BUY Low APE growth disappoints - hdfcsec.com Life - 1QFY19 - HDFC sec... · 1QFY18 where APEs grew...
19
RESULTS REVIEW 1QFY19 27 JUL 2018 SBI Life Insurance BUY HDFC securities Institutional Research is also available on Bloomberg HSLB <GO>& Thomson Reuters Low APE growth disappoints SBI Life’s 1QFY19 total APE grew just 2.1% YoY to Rs 13.1bn. Growth was lower also due to the high base in 1QFY18 where APEs grew 50%+. Protection share on APE basis reduced to just 4.6% (-480 bps YoY and -80bps vs. FY18) partly as a result of move to single premium credit life policies and partly as a result of lower (-63% YoY) group term business. For 1QFY19 SBILIFE for the first time reported tax rate adj. VNB margins at 19.0%. While margins are as expected, lower APE growth forces us to reduce our forecasts. We are not too perturbed by lower protection share in APE as the company is adding higher profitability credit protection business. Renewal premium growth was at 35% reflecting good quality underwriting. Individual APE grew 8.4% YoY to Rs 12.2bn while group APE declined 42.7% YoY to Rs 0.9bn. Adj. VNB for 1QFY19 was at Rs 2.5bn vs. Rs 15.7bn for FY18. PAT for 1QFY19 was at Rs 3.5bn (+12.8% YoY). We have fine tuned our APE growth assumptions resulting in VNB reduction of 2.1/5.3% for FY19E/20E. We continue to like SBI Life due to strong distribution footprint of its parent SBI, lowest operating cost ratios in the industry, and tailwinds from financialisation of savings. We maintain BUY with a TP of Rs 846 (FY20 EV + 27.3x FY20E VNB). Highlights of the quarter Management stated that growth was lower as a result of teething issues in the implementation of digital client on-boarding technology at SBI branches. Activated branches at SBI were 59% (48% for 1QFY18 and 69% for FY18). SBILIFE stated that growth is expected to bounce back as cashering (premium receipts pending policy issuance) has increased in July 2018. Credit life product drove growth with 90%+ premiums being collected on housing/LAP portfolio. 13 th /61 st month persistency ex. single premium improved 82.9/45.7% (+400/150bps). Decline in headline persistency (57%) for 61 st month is on account of higher proportion of single premium sales in that cohort. Others channel contribution increased to 15% vs. 12% in FY18. Outlook: Premium growth expected to revive driven by distribution reach of SBI. BUSINESS SUMMARY (Rs bn) 1QFY19 1QFY18 YoY (%) 4QFY18 QoQ (%) FY18 FY19E FY20E FY21E NBP 20.8 18.0 16 37.6 -45 109.7 141.0 164.0 190.3 APE 13.1 12.8 2 26.9 -51 85.4 100.3 116.4 135.0 VNB 2.5 2.0# 25 NM NM 15.7 19.3 22.6 26.4 Adj. VNBM (%) 19.0 15.4# NM 16.2# NM 18.4 19.3 19.4 19.6 EV 201.7 239.7 284.0 335.3 MCap/EV (x) 3.3 2.8 2.4 2.0 P/Bv (x) 10.6 8.9 7.5 6.3 ROEV 16.9 20.1 19.7 19.4 Source: Company, HDFC sec Inst Research #Reported VNB and VNB margins respectively INDUSTRY LIFE INSURANCE CMP (as on 26 Jul 2018) Rs 673 Target Price Rs 846 Nifty 11,167 Sensex 36,985 KEY STOCK DATA Bloomberg SBILIFE IN No. of Shares (mn) 1,000 MCap (Rs bn) / ($ mn) 673/9,804 6m avg traded value (Rs mn) 320 STOCK PERFORMANCE (%) 52 Week high / low Rs 775/625 3M 6M 12M Absolute (%) (11.7) (1.3) - Relative (%) (18.3) (3.9) - SHAREHOLDING PATTERN (%) Promoters 84.1 FIs & Local MFs 4.9 FPIs 4.3 Public & Others 3.7 Source : BSE Madhukar Ladha [email protected] +91-22-6171-7323
Transcript of BUY Low APE growth disappoints - hdfcsec.com Life - 1QFY19 - HDFC sec... · 1QFY18 where APEs grew...

RESULTS REVIEW 1QFY19 27 JUL 2018
SBI Life Insurance BUY
HDFC securities Institutional Research is also available on Bloomberg HSLB <GO>& Thomson Reuters
Low APE growth disappoints SBI Life’s 1QFY19 total APE grew just 2.1% YoY to Rs 13.1bn. Growth was lower also due to the high base in 1QFY18 where APEs grew 50%+. Protection share on APE basis reduced to just 4.6% (-480 bps YoY and -80bps vs. FY18) partly as a result of move to single premium credit life policies and partly as a result of lower (-63% YoY) group term business. For 1QFY19 SBILIFE for the first time reported tax rate adj. VNB margins at 19.0%.
While margins are as expected, lower APE growth forces us to reduce our forecasts. We are not too perturbed by lower protection share in APE as the company is adding higher profitability credit protection business.
Renewal premium growth was at 35% reflecting good quality underwriting. Individual APE grew 8.4% YoY to Rs 12.2bn while group APE declined 42.7% YoY to Rs 0.9bn. Adj. VNB for 1QFY19 was at Rs 2.5bn vs. Rs 15.7bn for FY18. PAT for 1QFY19 was at Rs 3.5bn (+12.8% YoY). We have fine tuned our APE growth assumptions resulting in VNB reduction of 2.1/5.3% for FY19E/20E. We continue to like SBI Life due to strong distribution footprint of its parent SBI, lowest operating cost ratios in the industry, and tailwinds from financialisation of savings. We
maintain BUY with a TP of Rs 846 (FY20 EV + 27.3x FY20E VNB).
Highlights of the quarter Management stated that growth was lower as a result
of teething issues in the implementation of digital client on-boarding technology at SBI branches.
Activated branches at SBI were 59% (48% for 1QFY18 and 69% for FY18).
SBILIFE stated that growth is expected to bounce back as cashering (premium receipts pending policy issuance) has increased in July 2018.
Credit life product drove growth with 90%+ premiums being collected on housing/LAP portfolio.
13th/61st month persistency ex. single premium improved 82.9/45.7% (+400/150bps). Decline in headline persistency (57%) for 61st month is on account of higher proportion of single premium sales in that cohort.
Others channel contribution increased to 15% vs. 12% in FY18.
Outlook: Premium growth expected to revive driven by distribution reach of SBI.
BUSINESS SUMMARY (Rs bn) 1QFY19 1QFY18 YoY (%) 4QFY18 QoQ (%) FY18 FY19E FY20E FY21E NBP 20.8 18.0 16 37.6 -45 109.7 141.0 164.0 190.3 APE 13.1 12.8 2 26.9 -51 85.4 100.3 116.4 135.0 VNB 2.5 2.0# 25 NM NM 15.7 19.3 22.6 26.4 Adj. VNBM (%) 19.0 15.4# NM 16.2# NM 18.4 19.3 19.4 19.6 EV 201.7 239.7 284.0 335.3 MCap/EV (x) 3.3 2.8 2.4 2.0 P/Bv (x) 10.6 8.9 7.5 6.3 ROEV 16.9 20.1 19.7 19.4 Source: Company, HDFC sec Inst Research #Reported VNB and VNB margins respectively
INDUSTRY LIFE INSURANCE CMP (as on 26 Jul 2018) Rs 673 Target Price Rs 846 Nifty 11,167
Sensex 36,985
KEY STOCK DATA
Bloomberg SBILIFE IN
No. of Shares (mn) 1,000
MCap (Rs bn) / ($ mn) 673/9,804
6m avg traded value (Rs mn) 320
STOCK PERFORMANCE (%)
52 Week high / low Rs 775/625
3M 6M 12M
Absolute (%) (11.7) (1.3) -
Relative (%) (18.3) (3.9) -
SHAREHOLDING PATTERN (%)
Promoters 84.1
FIs & Local MFs 4.9
FPIs 4.3
Public & Others 3.7
Source : BSE
Madhukar Ladha [email protected] +91-22-6171-7323

SBI LIFE: RESULTS REVIEW 1QFY19
Page | 2
Business update
Operating expenses ratio reduced to 9.7% in 1QFY19 vs. 9.8% in 1QFY18 and 6.8% in FY18.
Group credit life portfolio in terms of total number of transactions at end of 1QFY19 comprises 55% Home Loan, 38% Personal Loan, 5% Education Loan and 2% Vehicle Loan. On premium collection basis 90%+ of premium is from home loan/LAP product.
AUM increased to Rs 1.2tn (+18.8% YoY) while solvency ratio increased to 214% from 206% in FY18.
On APE basis, ULIP share increased to 65.6% (+159 bps YoY).
The agency channel has added 3,858 agents taking total headcount to 112,119 agents
The quarter witnessed 50% YoY increase in online sale of policies.
Surrender ratios have substantially reduced to 5.4% in 1QFY19 vs. 8.9% in 1QFY18.

SBI LIFE: RESULTS REVIEW 1QFY19
Page | 3
Five Quarters at a Glance (Rs Bn) 1QFY18 2QFY18 3QFY18 4QFY18 1QFY19 YoY (%) QoQ (%) Premium Earned 37.9 54.6 68.2 92.8 47.6 25.6 -48.7 Ceding -0.3 -0.8 -0.4 -0.4 0.0 -82.6 -90.0 Net Premium Earned 37.6 53.8 67.8 92.4 47.5 26.4 -48.5 Investment Income 27.1 24.4 29.2 8.3 22.2 -18.1 168.7 Other Income 0.2 0.2 0.2 0.2 0.2 -29.5 -11.2 Total Income 65.0 78.4 97.2 100.8 69.9 7.6 -30.6 Commission 1.7 2.7 3.1 3.8 2.0 21.2 -46.7 Operating expenses 4.3 5.2 5.4 6.1 5.5 26.6 -9.2 Policyholder tax 1.2 0.4 0.3 0.5 1.5 23.5 209.3 Claims paid (net) 26.3 26.7 29.1 35.0 21.6 -17.8 -38.3 Change in actuarial liability 28.3 41.1 56.9 51.6 35.7 26.3 -30.9 Total exp 61.8 76.1 94.8 97.0 66.3 7.4 -31.6 PBT 3.2 2.3 2.4 3.9 3.6 12.5 -6.3 Tax 0.1 0.1 0.1 0.0 0.1 1.6 645.0 PAT 3.1 2.2 2.3 3.9 3.5 12.8 -8.4 Source: Company, HDFC sec Inst Research
Operating and performance metrics Particulars (Rs bn) 1QFY18 2QFY18 3QFY18 4QFY18 1QFY19 YoY(%) QoQ(%) NBP (Rs. bn) Individual savings 12.0 21.0 24.5 25.9 13.1 8.8 -49.4 Protection 1.0 1.4 1.5 2.1 5.6 448.1 166.7 Group-Funds 4.9 2.5 3.2 9.6 2.1 -57.5 -78.1 Total 18.0 24.9 29.1 37.6 20.8 15.6 -44.7 Total APE (Rs bn) 12.8 20.9 24.7 26.9 13.1 2.1 -51.3 -Individual APE 11.3 19.9 23.2 23.6 12.2 8.4 -48.3 -Group APE 1.6 1.0 1.6 3.3 0.9 -42.7 -72.8 Individual APE share (%) 87.8 95.0 93.6 87.7 93.1 537 bps 541 bps Group APE share (%) 12.2 5.0 6.4 12.3 6.9 -537 bps -541 bps Reported VNB Margin (%) 15.6 15.6 16.0 16.2 17.0 140bps 80bps Adjusted VNB Margin (%) 18.4# 18.4# 18.4# 18.4# 19.0 60bps 60bps
Premium increased 25.6% YoY to Rs 47.6bn. Operating expenses increased 26.6% YoY. PAT increased 12.8% YoY to Rs 3.5bn. NBP increased 15.6% YoY to Rs 20.8bn. Adjusted VNB margin increased 60bps to 19% from 18.4% in FY18.

SBI LIFE: RESULTS REVIEW 1QFY19
Page | 4
1QFY18 2QFY18 3QFY18 4QFY18 1QFY19 YoY (%) QoQ (%) Product mix (NBP basis) ULIP (%) 49.6 59.9 62.2 50.7 45.7 -394bps -505bps PAR (%) 15.4 22.4 19.6 16.6 15.4 -5bps -124bps Non-PAR (%) 1.8 2.1 2.1 1.7 1.4 -40bps -26bps Group (%) 27.4 10.0 11.0 25.5 26.9 -52bps 139bps Protection (%) 5.7 5.6 5.2 5.6 10.1 442bps 451bps Channel mix Banassurance (%) 64.0 68.0 64.0 55.5 61.0 -300bps 548bps Agency (%) 25.0 24.0 26.0 24.9 23.0 -200bps -189bps Others (%) 11.0 8.0 10.0 19.6 16.0 500bps -359bps Opex Ratio (%) 9.8 12.7 11.0 NA 9.7 -10bps NA Solvency Ratio (%) 211 209 209 206 214 -500 bps 8000 bps AUM (Rs bn) 1,012 1,050 1,116 1,163 1,203 18.8 3.5 Linked (%) NA 46 47 47 47 NA 0bps Non-Linked (%) NA 54 53 53 53 NA 0bps Equity (%) NA 23 24 23 23 NA 0bps Debt (%) NA 77 76 77 77 NA 0bps Persistency (%) 1QFY18 2QFY18 3QFY18 4QFY18 1QFY19 YoY (%) QoQ (%) 13th month persistency 82.0 81.3 81.5 83.0 83.7 170bps 67bps 25th month persistency 74.8 74.5 74.0 75.2 75.1 31bps -8bps 37th month persistency 67.2 67.8 68.8 70.0 71.2 400bps 119bps 49th month persistency 63.0 63.1 63.9 63.9 63.4 42bps -48bps 61st month persistency 64.6 62.1 59.5 58.4 57.0 -763bps -141bps Source: Company, HDFC sec Inst Research #Adjusted VNB margin for FY18
Protection share on NBP basis increased 442bps to 10.1% however on APE basis protection share reduced to 4.6% (-480bps YoY). Opex ratio has reduced to 9.7%. 13th/61st month persistency ex. single premium improved 82.9/45.7% (+400/150bps). Decline in headline persistency (57%) of 61st month is on account of higher proportion of single premium sales.

SBI LIFE: RESULTS REVIEW 1QFY19
Page | 5
APE trend Product Mix On NBP basis
Source: Company, HDFC sec Inst Research
Source: Company, HDFC sec Inst Research
VNB Trend AUM Mix
Source: Company, HDFC sec Inst Research Source: Company, HDFC sec Inst Research
APE growth was meager at 2%! Protection biz shot up to 10% on NBP basis. Adjusted VNB margin improved 60bps to 19% v/s 18.4% in FY18. AUM at Rs1.2tn (+3% QoQ) with debt : equity mix unchanged at 77:23.
12.8
20.9 24.7 26.9
13.1
44
34
42
12
20.05.0
10.015.020.025.030.035.040.045.050.0
1QFY
18
2QFY
18
3QFY
18
4QFY
18
1QFY
19
APE (Rs bn) Growth (%)
45 50 5646
22 1119
15
22
2
1
22 3218
27
9 5 5 10
0
20
40
60
80
100
FY16
FY17
FY18
1QFY
19
ULIP PAR Non-PAR Group Protection
15.7
2.5
18.4
19.0
18.1
18.2
18.3
18.4
18.5
18.6
18.7
18.8
18.9
19
19.1
0.0
5.0
10.0
15.0
20.0
FY18 1QFY19
Adj. VNB (Rs bn) Adj. VNB margin
23 23 23
77 77 77
0
20
40
60
80
100
120
FY17
FY18
1QFY
19
Equity (%) Debt (%)
1,203 bn1,163 nb977 b

SBI LIFE: RESULTS REVIEW 1QFY19
Page | 6
Persistency Trend Channel Mix On NBP
Source: Company, HDFC sec Inst Research Source: Company, HDFC sec Inst Research
Change In Estimates
Rs bn FY19E FY20E
New Old Change (%) New Old Change (%) APE 100.3 102.5 -2.1 116.4 123.0 -5.3 VNB 19.3 19.7 -2.1 22.6 23.9 -5.3 VNB Margin (%) 19.3 19.3 0.0 19.4 19.4 0.0 Embedded Value 228.5 229.0 -0.2 271.7 273.7 -0.7 Source: HDFC sec Inst Research
Overall persistency levels reduced significantly in the 49th and 61st month buckets. We have fine-tuned our APE and VNB margin forecasts.
82.0
74.8
67.2
63.0
64.6
83.0
75.2
70.0
63.9
58.4
83.7
75.1
71.2
63.4
57.0
0.0
20.0
40.0
60.0
80.0
100.0
13th
mon
th
25th
mon
th
37th
mon
th
49th
mon
th
61st
mon
th
1QFY18 FY18 1QFY19
5362 61
2225 23
2513 16
0
20
40
60
80
100
FY17
FY18
1QFY
19
Banassurance Agency Others

SBI LIFE: RESULTS REVIEW 1QFY19
Page | 7
Sensitivity Analysis – 1QFY19 and FY18 Scenario Change in VNB% - 1QFY19 Change in VNB% - FY18 Reference Rate +100 bps 3% 1% Reference Rate -100 bps -3% -2% Decrease in Equity Value 10% - - Proportionate change in lapse rate +10% -6% -7% Proportionate change in lapse rate -10% 6% 7% Mortality / Morbidity +10% -7% -8% Mortality / Morbidity -10% 7% 8% Maintenance Expense +10% -2% -2% Maintenance Expense -10% 2% 2% Mass Lapse for ULIPs in the year after the surrender penalty period of 25% -8% -8% Mass Lapse for ULIPs in the year after the surrender penalty period of 50% -18% -19% Tax Rate Change to 25% -18% -17% Note: 1. Mass lapse sensitivity (of 25% or 50%) for ULIP business is applied at the end of surrender penalty period as defined by APS 10, which is taken to be the beginning of 5th policy year for current generation of our ULIP products. Source: Company, HDFC sec Inst Research
Positive sensitivity to interest rate increase due to change in structure of credit life from regular to single premium product.

SBI LIFE: RESULTS REVIEW 1QFY19
Page | 8
RoEV stack up chart
Source: Company, HDFC sec Inst Research Embedded Value movement Particulars (Rs mn) FY17 FY18 FY19E FY20E FY21E Opening IEV 125,475 174,200* 201,700 239,735 283,957 Value added by new business 10,368 15,700 19,312 22,585 26,402 Expected return on existing business 10,862 14,100 18,153 21,576 25,556 Variance in Operating experience 3,060 1,600 2,000 2,000 2,000 Change in operating assumptions 5,963 -100 1,000 1,000 1,000 Other operating variance -1,379 IEV operating earnings 28,874 31,300 40,465 47,162 54,958 Economic variances 12,835 (1,800) - - - Other non-operating variances 0 0 0 0 0 Total IEV earnings 41,709 29,500 40,465 47,162 54,958 Capital contributions / dividend payouts -1,500 -2,000 -2,431 -2,939 -3,565 Closing IEV 165,684 201,700 239,735 283,957 335,350 *FY18 opening IEV adjusted for effective tax rate Source: Company, HDFC sec Inst Research
8.3 9.0 9.6 9.4 9.3
8.7 8.1 9.0 9.0 9.0
2.4 0.91.0 0.8 0.7
4.8
-0.1
0.5 0.40.4
10.2
-1.0
0.0
-5.0
0.0
5.0
10.0
15.0
20.0
25.0
30.0
35.0
40.0
FY17 FY18 FY19E FY20E FY21E
Economic variances Other operating variance Change in operating assumptionsVariance in operating experience Expected return on existing business VNB as % of opening EV
Change in economic assumptions caused RoEVs to increase in FY17. Opening RoEV has been revised for FY18 for change in effective tax rate.

SBI LIFE: RESULTS REVIEW 1QFY19
Page | 9
Industry NBP analysis
Particulars Individual (Rs bn) Group (Rs bn) Total (Rs bn)
FY16 FY17 FY18 1QFY19 YOY (%) FY16 FY17 FY18 1QFY19 YOY (%) FY16 FY17 FY18 1QFY19 YOY (%) Aditya Birla Sun Life 7.1 9.6 11.5 2.5 46.7 15.1 15.7 15.1 3.9 56.6 22.2 25.3 26.6 6.4 52.6 Bajaj Allianz Life 8.9 10.7 14.6 3.0 1.4 19.9 22.2 28.4 4.2 8.7 28.8 32.9 42.9 7.2 5.6 Bharti Axa Life 3.6 4.0 4.7 1.1 75.7 1.8 2.1 2.6 0.6 35.1 5.4 6.1 7.3 1.7 58.3 DHFL Pramerica Life 1.8 2.2 3.6 0.9 42.3 5.4 6.6 10.9 2.9 24.0 7.2 8.8 14.5 3.8 27.9 HDFC Standard Life 36.6 42.0 59.4 12.4 56.6 28.3 45.0 54.0 14.4 68.6 64.9 87.0 113.4 26.8 62.8 ICICI Prudential Life 53.6 69.8 84.0 14.9 (18.1) 14.1 8.9 7.2 2.3 46.7 67.7 78.6 91.3 17.2 (12.9) Kotak Mahindra Old Mutual Life 10.6 14.4 19.7 2.8 15.6 11.5 14.1 14.5 3.8 23.5 22.1 28.5 34.3 6.6 20.1 Max Life 26.1 33.1 39.8 6.8 14.4 2.7 3.6 3.6 0.9 22.5 28.8 36.7 43.5 7.7 15.3 SBI Life 49.8 64.7 84.1 13.2 9.0 21.3 36.8 25.6 7.5 28.7 71.1 101.5 109.7 20.7 15.4 Tata AIA Life 6.1 10.5 14.0 2.7 36.6 1.3 0.8 0.9 0.2 96.7 7.4 11.3 14.9 2.9 40.0 LIC 327.9 455.9 517.4 85.6 3.2 648.9 788.1 828.1 161.6 7.9 976.7 1,244.0 1,345.5 247.3 6.2 Industry total* 582.8 776.8 921.1 157.8 6.2 803.6 974.1 1,017.8 209.5 13.9 1,386.5 1,750.9 1,938.9 367.3 10.4 Source: IRDAI data, HDFC sec Inst Research * Total will not add up since we have excluded smaller sized private players
Market share on NBP basis (%)
Particulars Individual Group
FY16 FY17 FY18 1QFY19 YOY (bps) FY16 FY17 FY18 1QFY19 YOY (bps) Aditya Birla Sun Life 2.9 3.0 2.9 3.4 86 8.0 8.5 8.0 8.2 86 Bajaj Allianz Life 3.6 3.3 3.6 4.1 -35 14.9 12.0 14.9 8.9 -256 Bharti Axa Life 1.2 1.3 1.2 1.5 57 1.4 1.1 1.4 1.3 -5 DHFL Pramerica Life 0.9 0.7 0.9 1.2 28 5.7 3.5 5.7 6.0 -78 HDFC Standard Life 14.7 13.1 14.7 17.1 510 28.5 24.2 28.5 30.1 507 ICICI Prudential Life 20.8 21.7 20.8 20.7 -711 3.8 4.8 3.8 4.9 22 Kotak Mahindra Old Mutual Life 4.9 4.5 4.9 3.9 19 7.7 7.6 7.7 8.0 -107 Max Life 9.9 10.3 9.9 9.4 36 1.9 1.9 1.9 1.9 -27 SBI Life 20.8 20.2 20.8 18.4 -17 13.5 19.8 13.5 15.7 -140 Tata AIA Life 3.5 3.3 3.5 3.7 72 0.5 0.4 0.5 0.5 14 Private players* 43.8 41.3 43.8 45.7 159.3 18.6 19.1 18.6 22.9 428.6 LIC 56.2 58.7 56.2 54.3 -159.3 81.4 80.9 81.4 77.1 -428.6 Industry 100 100 100 100 0 100 100 100 100 0
Source: IRDAI data, HDFC sec Inst Research * Total private insurers’ market share with respect to total market, whereas individual private insurers market share is with respect to total private market.

SBI LIFE: RESULTS REVIEW 1QFY19
Page | 10
Valuation Comps Unit Bloomberg Ticker IPRU MAXF SBILIFE HDFCLIFE Rating BUY BUY BUY NR Current market price Rs 415 472 673 489 Market Capitalisation Rs bn 596 127 673 984 Target price Rs 481 567 870 NA Upside/(Downside) % 16 20 0 -100 Profitablity FY18 FY19E FY20E FY18 FY19E FY20E FY18 FY19E FY20E FY18 FY19E FY20E VNB Margin % 16.5 17.5 18.0 20.2 20.4 20.6 16.3 19.3 19.4 23.2 24.2 25.0 Total RoEV % 23.4 17.8 18.1 19.0 20.0 20.0 16.7 20.7 20.2 23.6 20.1 20.3 Operating RoEV % 22.7 17.8 18.1 19.7 20.0 20.0 17.8 20.7 20.2 21.5 20.1 20.3 Non-operating RoEV % 0.7 0.0 0.0 -0.7 0.0 0.0 -1.1 0.0 0.0 2.1 0.0 0.0 RoE % 27.9 25.3 22.9 24.1 26.5 25.0 19.4 20.1 20.5 27.7 22.2 22.4
Valuation at CMP FY18 FY19E FY20E FY18 FY19E FY20E FY18 FY19E FY20E FY18 FY19E FY20E P/EV x 3.2 2.8 2.5 2.4 2.1 1.8 3.5 2.9 2.5 6.5 5.4 4.6 P/EVOP x 16.2 17.8 15.5 14.0 12.1 10.5 22.8 17.0 14.6 36.7 32.2 26.8 Implied P/VNB x 31.7 24.9 19.2 16.2 12.6 9.2 34.6 23.0 17.8 65.0 50.4 39.2 Implied P/VIF x 5.1 4.4 3.9 3.6 3.1 2.7 5.8 4.9 4.2 9.5 8.2 7.1 P/B x 9.1 8.0 7.1 6.2 5.2 4.4 10.6 8.9 7.5 20.9 17.9 15.2 P/E x 36.7 33.6 32.9 30.6 22.9 20.7 58.5 48.1 39.8 89.7 86.8 73.3 P/AUM x 0.4 0.4 0.3 0.3 0.3 0.2 0.6 0.5 0.4 1 1 1
0 0 0 Valuation at TP FY18 FY19E FY20E FY18 FY19E FY20E FY18 FY19E FY20E FY18 FY19E FY20E P/EV x 3.7 3.3 2.9 2.9 2.5 2.2 4.5 3.8 3.2 NA NA NA P/EVOP x 18.8 20.7 17.9 16.7 14.6 12.6 29.5 22.0 18.9 NA NA NA Implied P/VNB x 39.1 31.0 24.4 21.8 17.5 13.3 48.8 33.2 26.5 NA NA NA Implied P/VIF x 5.9 5.2 4.5 3.0 2.6 2.3 7.5 6.4 5.4 NA NA NA P/B x 10.5 9.3 8.3 7.5 6.3 5.3 13.6 11.6 9.7 NA NA NA P/E x 42.5 38.9 38.1 36.7 27.5 24.9 75.6 62.2 51.5 NA NA NA P/AUM x 0.5 0.4 0.4 0.2 0.2 0.1 0.7 0.6 0.5 NA NA NA
Per Share data FY18 FY19E FY20E FY18 FY19E FY20E FY18 FY19E FY20E FY18 FY19E FY20E EV Rs 131 148 169 194 225 262 191 228 272 76 90 107 EVOP Rs 26 23 27 34 39 45 30 40 46 13 15 18 VNB Rs 9 11 13 17 20 23 14 19 23 6 8 10 VIF Rs 82 93 107 131 151 173 116 136 160 51 59 69 Book Value Rs 46 52 58 76 90 106 64 75 89 23 27 32 Earnings Rs 11 12 13 15 21 23 12 14 17 5 6 7 AUM Rs 972 1,127 1,317 1,362 1,645 1,909 1,163 1,403 1,717 530 627 744 ANW Rs 49 55 62 90 106 126 75 91 111 24 30 38
SBI LIFE: RESULTS REVIEW 1QFY19
Page | 11
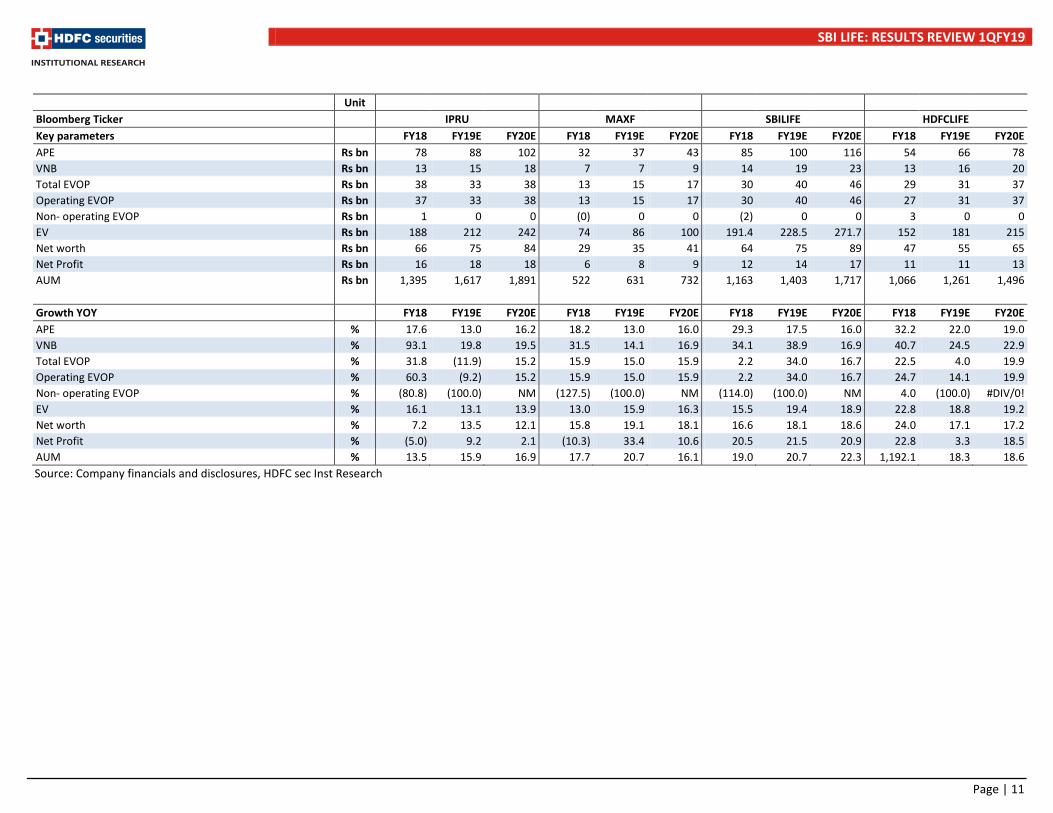
Unit Bloomberg Ticker IPRU MAXF SBILIFE HDFCLIFE Key parameters FY18 FY19E FY20E FY18 FY19E FY20E FY18 FY19E FY20E FY18 FY19E FY20E APE Rs bn 78 88 102 32 37 43 85 100 116 54 66 78 VNB Rs bn 13 15 18 7 7 9 14 19 23 13 16 20 Total EVOP Rs bn 38 33 38 13 15 17 30 40 46 29 31 37 Operating EVOP Rs bn 37 33 38 13 15 17 30 40 46 27 31 37 Non- operating EVOP Rs bn 1 0 0 (0) 0 0 (2) 0 0 3 0 0 EV Rs bn 188 212 242 74 86 100 191.4 228.5 271.7 152 181 215 Net worth Rs bn 66 75 84 29 35 41 64 75 89 47 55 65 Net Profit Rs bn 16 18 18 6 8 9 12 14 17 11 11 13 AUM Rs bn 1,395 1,617 1,891 522 631 732 1,163 1,403 1,717 1,066 1,261 1,496
Growth YOY FY18 FY19E FY20E FY18 FY19E FY20E FY18 FY19E FY20E FY18 FY19E FY20E APE % 17.6 13.0 16.2 18.2 13.0 16.0 29.3 17.5 16.0 32.2 22.0 19.0 VNB % 93.1 19.8 19.5 31.5 14.1 16.9 34.1 38.9 16.9 40.7 24.5 22.9 Total EVOP % 31.8 (11.9) 15.2 15.9 15.0 15.9 2.2 34.0 16.7 22.5 4.0 19.9 Operating EVOP % 60.3 (9.2) 15.2 15.9 15.0 15.9 2.2 34.0 16.7 24.7 14.1 19.9 Non- operating EVOP % (80.8) (100.0) NM (127.5) (100.0) NM (114.0) (100.0) NM 4.0 (100.0) #DIV/0! EV % 16.1 13.1 13.9 13.0 15.9 16.3 15.5 19.4 18.9 22.8 18.8 19.2 Net worth % 7.2 13.5 12.1 15.8 19.1 18.1 16.6 18.1 18.6 24.0 17.1 17.2 Net Profit % (5.0) 9.2 2.1 (10.3) 33.4 10.6 20.5 21.5 20.9 22.8 3.3 18.5 AUM % 13.5 15.9 16.9 17.7 20.7 16.1 19.0 20.7 22.3 1,192.1 18.3 18.6 Source: Company financials and disclosures, HDFC sec Inst Research
SBI LIFE: RESULTS REVIEW 1QFY19
Page | 12
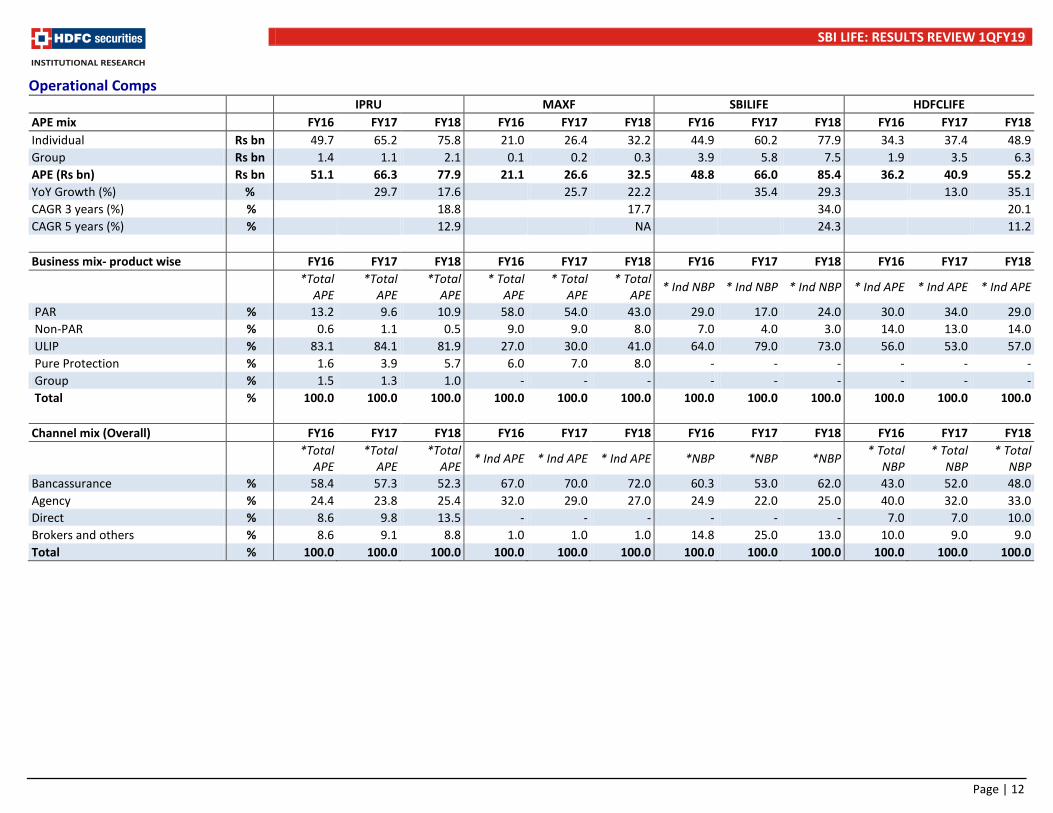
Operational Comps
IPRU MAXF SBILIFE HDFCLIFE APE mix FY16 FY17 FY18 FY16 FY17 FY18 FY16 FY17 FY18 FY16 FY17 FY18 Individual Rs bn 49.7 65.2 75.8 21.0 26.4 32.2 44.9 60.2 77.9 34.3 37.4 48.9 Group Rs bn 1.4 1.1 2.1 0.1 0.2 0.3 3.9 5.8 7.5 1.9 3.5 6.3 APE (Rs bn) Rs bn 51.1 66.3 77.9 21.1 26.6 32.5 48.8 66.0 85.4 36.2 40.9 55.2 YoY Growth (%) % 29.7 17.6 25.7 22.2 35.4 29.3 13.0 35.1 CAGR 3 years (%) % 18.8 17.7 34.0 20.1 CAGR 5 years (%) % 12.9 NA 24.3 11.2
Business mix- product wise FY16 FY17 FY18 FY16 FY17 FY18 FY16 FY17 FY18 FY16 FY17 FY18
*Total
APE *Total
APE *Total
APE * Total
APE * Total
APE * Total
APE * Ind NBP * Ind NBP * Ind NBP * Ind APE * Ind APE * Ind APE
PAR % 13.2 9.6 10.9 58.0 54.0 43.0 29.0 17.0 24.0 30.0 34.0 29.0 Non-PAR % 0.6 1.1 0.5 9.0 9.0 8.0 7.0 4.0 3.0 14.0 13.0 14.0 ULIP % 83.1 84.1 81.9 27.0 30.0 41.0 64.0 79.0 73.0 56.0 53.0 57.0 Pure Protection % 1.6 3.9 5.7 6.0 7.0 8.0 - - - - - - Group % 1.5 1.3 1.0 - - - - - - - - - Total % 100.0 100.0 100.0 100.0 100.0 100.0 100.0 100.0 100.0 100.0 100.0 100.0
Channel mix (Overall) FY16 FY17 FY18 FY16 FY17 FY18 FY16 FY17 FY18 FY16 FY17 FY18
*Total
APE *Total
APE *Total
APE * Ind APE * Ind APE * Ind APE *NBP *NBP *NBP * Total NBP
* Total NBP
* Total NBP
Bancassurance % 58.4 57.3 52.3 67.0 70.0 72.0 60.3 53.0 62.0 43.0 52.0 48.0 Agency % 24.4 23.8 25.4 32.0 29.0 27.0 24.9 22.0 25.0 40.0 32.0 33.0 Direct % 8.6 9.8 13.5 - - - - - - 7.0 7.0 10.0 Brokers and others % 8.6 9.1 8.8 1.0 1.0 1.0 14.8 25.0 13.0 10.0 9.0 9.0 Total % 100.0 100.0 100.0 100.0 100.0 100.0 100.0 100.0 100.0 100.0 100.0 100.0

SBI LIFE: RESULTS REVIEW 1QFY19
Page | 13
Banca channel partners ICICIB and SCB AXIS, YES, LVB SBI, P&SB, SIB HDFCB, RBL, IDFCB, BFL
AUM FY16 FY17 FY18 FY16 FY17 FY18 FY16 FY17 FY18 FY16 FY17 FY18 AUM Rs bn 1,039.4 1,229.2 1,395.3 358.2 443.7 522.4 798.3 977.4 1,163.0 742.3 917.4 1,066.0 Equity % 46.8 46.8 47.0 29.0 24.0 22.0 22.5 23.2 23.0 39.0 59.0 61.0 Debt % 53.2 53.2 53.0 71.0 76.0 78.0 77.5 76.8 77.0 61.0 41.0 39.0
Linked % 72.4 71.5 69.9 37.0 35.0 33.0 55.0 54.0 53.0 62.0 52.0 57.0 Non-linked % 27.6 28.5 30.1 63.0 65.0 67.0 45.0 46.0 47.0 38.0 48.0 43.0
Solvency ratio % FY16 FY17 FY18 FY16 FY17 FY18 FY16 FY17 FY18 FY16 FY17 FY18 Solvency 320.0 281.0 252.0 343.0 309.0 275.0 212.0 204.0 206.0 198.4 191.6 191.5
Market Share % FY16 FY17 FY18 FY16 FY17 FY18 FY16 FY17 FY18 FY16 FY17 FY18 Ind. NBP Private Market Share % 20.8 21.7 20.8 9.9 10.3 9.9 20.8 20.2 20.8 14.7 13.1 14.7 Ind. APE Private Market Share % 21.9 22.3 20.9 9.3 9.2 9.0 18.8 20.7 21.8 14.7 12.7 13.3
VNB Margin % FY16 FY17 FY18 FY16 FY17 FY18 FY16 FY17 FY18 FY16 FY17 FY18 Margin % 8.1 10.1 16.5 17.9 18.2 20.2 14.3 15.7 16.3 19.9 22.3 23.2
Persistency % FY16 FY17 FY18 FY16 FY17 FY18 FY16 FY17 FY18 FY16 FY17 FY18 13th month % 82.4 82.4 82.4 78.8 80.4 81.4 80.7 81.1 83.0 78.9 80.9 87.0 25th month % 71.2 73.9 78.8 66.6 70.4 71.4 73.2 73.9 75.2 67.4 73.3 77.0 37th month % 61.6 66.8 68.9 58.0 59.7 59.9 69.2 67.4 70.0 60.1 63.9 71.0 49th month % 62.2 59.3 63.6 55.6 54.9 55.1 76.9 62.5 63.9 63.4 58.3 62.0 61th month % 46.0 56.2 54.8 42.7 53.0 53.2 53.8 67.2 58.4 50.1 56.8 51.0
Source: Company financials and disclosures, HDFC sec Inst Research
SBI LIFE: RESULTS REVIEW 1QFY19
Page | 14
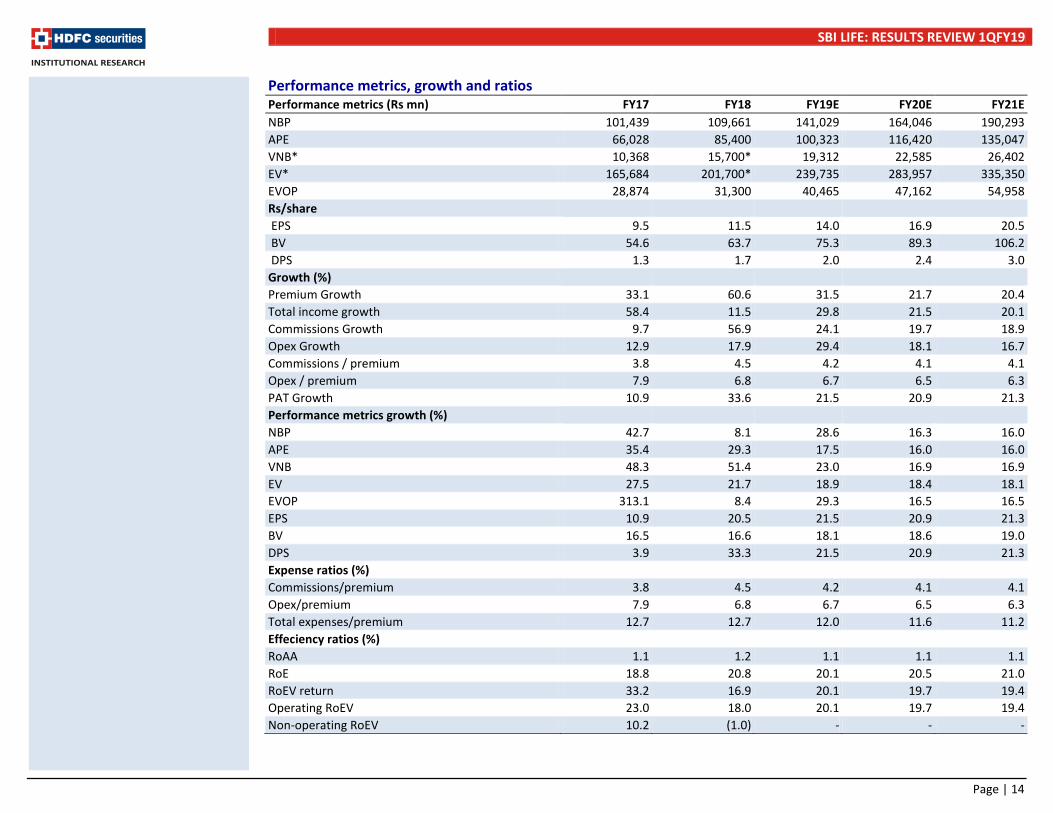
Performance metrics, growth and ratios Performance metrics (Rs mn) FY17 FY18 FY19E FY20E FY21E NBP 101,439 109,661 141,029 164,046 190,293 APE 66,028 85,400 100,323 116,420 135,047 VNB* 10,368 15,700* 19,312 22,585 26,402 EV* 165,684 201,700* 239,735 283,957 335,350 EVOP 28,874 31,300 40,465 47,162 54,958 Rs/share EPS 9.5 11.5 14.0 16.9 20.5 BV 54.6 63.7 75.3 89.3 106.2 DPS 1.3 1.7 2.0 2.4 3.0 Growth (%) Premium Growth 33.1 60.6 31.5 21.7 20.4 Total income growth 58.4 11.5 29.8 21.5 20.1 Commissions Growth 9.7 56.9 24.1 19.7 18.9 Opex Growth 12.9 17.9 29.4 18.1 16.7 Commissions / premium 3.8 4.5 4.2 4.1 4.1 Opex / premium 7.9 6.8 6.7 6.5 6.3 PAT Growth 10.9 33.6 21.5 20.9 21.3 Performance metrics growth (%) NBP 42.7 8.1 28.6 16.3 16.0 APE 35.4 29.3 17.5 16.0 16.0 VNB 48.3 51.4 23.0 16.9 16.9 EV 27.5 21.7 18.9 18.4 18.1 EVOP 313.1 8.4 29.3 16.5 16.5 EPS 10.9 20.5 21.5 20.9 21.3 BV 16.5 16.6 18.1 18.6 19.0 DPS 3.9 33.3 21.5 20.9 21.3 Expense ratios (%) Commissions/premium 3.8 4.5 4.2 4.1 4.1 Opex/premium 7.9 6.8 6.7 6.5 6.3 Total expenses/premium 12.7 12.7 12.0 11.6 11.2 Effeciency ratios (%) RoAA 1.1 1.2 1.1 1.1 1.1 RoE 18.8 20.8 20.1 20.5 21.0 RoEV return 33.2 16.9 20.1 19.7 19.4 Operating RoEV 23.0 18.0 20.1 19.7 19.4 Non-operating RoEV 10.2 (1.0) - - -

SBI LIFE: RESULTS REVIEW 1QFY19
Page | 15
Ratios on CMP FY17 FY18 FY19E FY20E FY21E P/E (x) 70.5 58.5 48.1 39.8 32.8 P/ABV (x) 12.3 10.6 8.9 7.5 6.3 P/EV (x) 4.1 3.5 2.9 2.5 2.1 P/VNB Multiple (x) 48.9 34.6 23.0 17.8 13.3 P/EVOP (x) 23.3 22.8 17.0 14.6 12.5 P/VIF (x) 7.1 5.8 4.9 4.2 3.6 P/AUM(x) 0.7 0.6 0.5 0.4 0.3 Ratios on TP P/E (x) 91.1 75.6 62.2 51.5 42.4 P/ABV (x) 15.9 13.6 11.6 9.7 8.2 P/EV (x) 5.3 4.5 3.8 3.2 2.7 P/VNB Multiple (x) 67.9 48.8 33.2 26.5 20.8 P/EVOP (x) 30.1 29.5 22.0 18.9 16.2 P/VIF (x) 9.1 7.5 6.4 5.4 4.6 P/AUM(x) 0.9 0.7 0.6 0.5 0.4 * Adjusted for change in effective tax rate Source: Company financials and disclosures, HDFC sec Inst Research

SBI LIFE: RESULTS REVIEW 1QFY19
Page | 16
Policyholder’s Account (Rs mn) FY17 FY18 FY19E FY20E FY21E Total premium earned 208,525 251,601 330,845 402,646 484,833 Income from investments and other income 93,624 85,248 106,926 129,185 153,890
Transfer from shareholders account 627 756 500 500 500
Total income 302,775 337,605 438,271 532,331 639,223 Commission 7,833 11,209 13,907 16,643 19,796 Operating expenses 16,465 17,188 22,243 26,259 30,643 Provisions 2,226 3,527 3,650 3,833 4,024 Total expenses 26,525 31,924 39,800 46,735 54,463 Benefits paid 95,502 117,123 133,494 165,207 203,890 Change in valuation of liabilities 172,410 175,950 248,928 301,134 357,686
Total 267,912 293,073 382,422 466,341 561,577 Surplus 8,339 12,609 16,048 19,255 23,183 Tax 1,798 2,380 3,029 3,634 4,376 Net surplus 6,541 10,229 13,019 15,620 18,807
Source: Company, HDFC sec Inst Research Shareholder’s Account (Rs mn) FY17 FY18 FY19E FY20E FY21E Transfer from policyholders' a/c 6,546 8,294 10,561 12,672 15,257
Investment income 4,016 4,521 5,014 6,012 7,244 Other income 82 113 - - - Total income 10,644 12,928 15,576 18,684 22,501 Expenses 271 327 360 387 416 Contribution to policyholders' a/c 627 756 500 500 500
Profit before tax 9,746 11,845 14,716 17,797 21,585 Taxes 199 341 736 890 1,079 PAT 9,547 11,504 13,980 16,907 20,506
Source: Company, HDFC sec Inst Research
Balance Sheet (Rs mn) FY17 FY18 FY19E FY20E FY21E Sources of funds Share capital 10,000 10,000 10,000 10,000 10,000 Reserve and surplus 44,648 53,745 65,294 79,262 96,203 Net worth 54,648 63,745 75,294 89,262 106,203 Credit/debit balance in fair value a/c 873 1,534 1,534 1,534 1,534
Policyholders' a/c 936,732 1,114,345 1,363,273 1,664,407 2,022,093 Funds for future appropriation - 1,935 2,032 2,133 2,240 Total Liabilities 992,252 1,181,558 1,442,132 1,757,336 2,132,069 Application of funds Shareholders' Investments 42,955 50,144 60,118 72,437 87,650 Policyholders' investments 469,617 544,857 - - - Asset to cover linked liabilities 445,730 549,359 1,343,143 1,644,278 2,001,964 Loans 1,782 1,709 1,752 1,796 1,840 Fixed assets + DTA 5,385 5,813 5,958 6,107 6,260 Net current assets 26,783 29,677 31,161 32,719 34,355 Debit balance in P&L - - - - - Total Assets 992,252 1,181,558 1,442,132 1,757,336 2,132,069

SBI LIFE: RESULTS REVIEW 1QFY19
Page | 17
RECOMMENDATION HISTORY
Rating Definitions BUY : Where the stock is expected to deliver more than 10% returns over the next 12 month period NEUTRAL : Where the stock is expected to deliver (-)10% to 10% returns over the next 12 month period SELL : Where the stock is expected to deliver less than (-)10% returns over the next 12 month period
Date CMP Reco Target 28-Dec-17 697 BUY 810 30-Jan-18 670 BUY 840 10-Apr-18 693 BUY 840 27-Apr-18 762 BUY 810 6-Jul-18 665 BUY 870
27-Jul-18 673 BUY 846
500550600650700750800850900
Oct
-17
Nov
-17
Dec-
17
Jan-
18
Feb-
18
Mar
-18
Apr-
18
May
-18
Jun-
18
Jul-1
8
SBI LIFE TP

SBI LIFE: RESULTS REVIEW 1QFY19
Page | 18
Disclosure: I, Madhukar Ladha, CFA, author and the name subscribed to this report, hereby certify that all of the views expressed in this research report accurately reflect our views about the subject issuer(s) or securities. HSL has no material adverse disciplinary history as on the date of publication of this report. We also certify that no part of our compensation was, is, or will be directly or indirectly related to the specific recommendation(s) or view(s) in this report. Research Analyst or his/her relative or HDFC Securities Ltd. does not have any financial interest in the subject company. Also Research Analyst or his relative or HDFC Securities Ltd. or its Associate may have beneficial ownership of 1% or more in the subject company at the end of the month immediately preceding the date of publication of the Research Report. Further Research Analyst or his relative or HDFC Securities Ltd. or its associate does not have any material conflict of interest. Any holding in stock –No HDFC Securities Limited (HSL) is a SEBI Registered Research Analyst having registration no. INH000002475. Disclaimer: This report has been prepared by HDFC Securities Ltd and is meant for sole use by the recipient and not for circulation. The information and opinions contained herein have been compiled or arrived at, based upon information obtained in good faith from sources believed to be reliable. Such information has not been independently verified and no guaranty, representation of warranty, express or implied, is made as to its accuracy, completeness or correctness. All such information and opinions are subject to change without notice. This document is for information purposes only. Descriptions of any company or companies or their securities mentioned herein are not intended to be complete and this document is not, and should not be construed as an offer or solicitation of an offer, to buy or sell any securities or other financial instruments. This report is not directed to, or intended for display, downloading, printing, reproducing or for distribution to or use by, any person or entity who is a citizen or resident or located in any locality, state, country or other jurisdiction where such distribution, publication, reproduction, availability or use would be contrary to law or regulation or what would subject HSL or its affiliates to any registration or licensing requirement within such jurisdiction. If this report is inadvertently send or has reached any individual in such country, especially, USA, the same may be ignored and brought to the attention of the sender. This document may not be reproduced, distributed or published for any purposes without prior written approval of HSL. Foreign currencies denominated securities, wherever mentioned, are subject to exchange rate fluctuations, which could have an adverse effect on their value or price, or the income derived from them. In addition, investors in securities such as ADRs, the values of which are influenced by foreign currencies effectively assume currency risk. It should not be considered to be taken as an offer to sell or a solicitation to buy any security. HSL may from time to time solicit from, or perform broking, or other services for, any company mentioned in this mail and/or its attachments. HSL and its affiliated company(ies), their directors and employees may; (a) from time to time, have a long or short position in, and buy or sell the securities of the company(ies) mentioned herein or (b) be engaged in any other transaction involving such securities and earn brokerage or other compensation or act as a market maker in the financial instruments of the company(ies) discussed herein or act as an advisor or lender/borrower to such company(ies) or may have any other potential conflict of interests with respect to any recommendation and other related information and opinions. HSL, its directors, analysts or employees do not take any responsibility, financial or otherwise, of the losses or the damages sustained due to the investments made or any action taken on basis of this report, including but not restricted to, fluctuation in the prices of shares and bonds, changes in the currency rates, diminution in the NAVs, reduction in the dividend or income, etc. HSL and other group companies, its directors, associates, employees may have various positions in any of the stocks, securities and financial instruments dealt in the report, or may make sell or purchase or other deals in these securities from time to time or may deal in other securities of the companies / organizations described in this report. HSL or its associates might have managed or co-managed public offering of securities for the subject company or might have been mandated by the subject company for any other assignment in the past twelve months. HSL or its associates might have received any compensation from the companies mentioned in the report during the period preceding twelve months from t date of this report for services in respect of managing or co-managing public offerings, corporate finance, investment banking or merchant banking, brokerage services or other advisory service in a merger or specific transaction in the normal course of business. HSL or its analysts did not receive any compensation or other benefits from the companies mentioned in the report or third party in connection with preparation of the research report. Accordingly, neither HSL nor Research Analysts have any material conflict of interest at the time of publication of this report. Compensation of our Research Analysts is not based on any specific merchant banking, investment banking or brokerage service transactions. HSL may have issued other reports that are inconsistent with and reach different conclusion from the information presented in this report. Research entity has not been engaged in market making activity for the subject company. Research analyst has not served as an officer, director or employee of the subject company. We have not received any compensation/benefits from the subject company or third party in connection with the Research Report. HDFC securities Limited, I Think Techno Campus, Building - B, "Alpha", Office Floor 8, Near Kanjurmarg Station, Opp. Crompton Greaves, Kanjurmarg (East), Mumbai 400 042 Phone: (022) 3075 3400 Fax: (022) 2496 5066 Compliance Officer: Binkle R. Oza Email: [email protected] Phone: (022) 3045 3600 HDFC Securities Limited, SEBI Reg. No.: NSE-INB/F/E 231109431, BSE-INB/F 011109437, AMFI Reg. No. ARN: 13549, PFRDA Reg. No. POP: 04102015, IRDA Corporate Agent License No.: HDF 2806925/HDF C000222657, SEBI Research Analyst Reg. No.: INH000002475, CIN - U67120MH2000PLC152193 Mutual Funds Investments are subject to market risk. Please read the offer and scheme related documents carefully before investing.
SBI LIFE: RESULTS REVIEW 1QFY19
Page | 19
HDFC securities Institutional Equities Unit No. 1602, 16th Floor, Tower A, Peninsula Business Park, Senapati Bapat Marg, Lower Parel, Mumbai - 400 013 Board : +91-22-6171 7330 www.hdfcsec.com


![Varese06 APe[1]](https://static.fdocuments.in/doc/165x107/577d22411a28ab4e1e96f162/varese06-ape1.jpg)