
© Ipsos MORI Measuring Drinkawares Impact Louise Park, Ipsos MORI 24 July 2013.

�
���������
In an age where the political emphasis is on reducing car use, it is perhaps worth reminding
those who run the country of a stark reality; over three-quarters of drivers would find it
difficult to adjust their lifestyles to being without a car.
That is just one of the findings of this joint RAC Foundation / Ipsos MORI report which
provides a barometer of opinion about car use and congestion, at a time when environmental
policy is aiming to deliver important climate change objectives during great economic
uncertainty. It underlines the importance of taking the needs and views of road users into
account when developing a strategy in this area. Policy must not be developed without
regard for public opinion, or at least the need for public explanation.
And here are a few more things to bear in mind. Congestion, although still considered a
serious problem by two in every five motorists, is not thought to be as big an issue as it was
ten years ago. This is a marked shift in opinion, created not by reduced traffic volumes, but
because motorists appear to have reluctantly accepted the phenomenon of congestion, and
believe it will only get worse in the future, particularly on motorways.
Improvements to the situation are considered unlikely and supposedly radical solutions like
road pricing carry decreasing support. Additional charges for travel into town centres and
motorways, no matter what the caveat, are unpopular, even more so than at the beginning of
the decade – witness the resounding defeat of the Manchester TIF scheme in the
referendum of December 2008.
Unsurprisingly support is highest for the options that cost the ‘public purse’ rather than the
individual, such as public transport improvements. However previous backing for these
initiatives has not translated into a change in people’s travel behaviour. In fact, there was
actually a greater willingness to swap from the car to another mode of transport ten years
ago.
Managing motorways better, through hard shoulder running and the adjustment of motorway
speed limits during periods of high congestion, was generally welcomed, and more than six
out of ten people favoured the widening of existing motorways where there were congestion
problems, a similar level of support to measures that increase the number and frequency of
bus services.

But on the whole, drivers remain unconvinced by alternative modes of travel - so much so
that over half would rather take the chance of being stuck in a traffic jam than get on public
transport. Only three out of ten people think it is likely they will use public transport to make a
journey they currently make by car over the next year. This appears to illustrate both a
reluctance to change behaviour and also disappointment with the alternatives that currently
exist. Despite Government rhetoric about improving public transport, fewer than three in ten
people are optimistic about its future, with the majority believing performance will stay the
same or get worse.
The resounding message is that the travelling public are extremely pessimistic, and resigned
to a future without performance improvements across the various transport modes. Those
who anticipate a worsening in traffic congestion over the coming years are no more inclined
to support any form of road pricing, in fact they are more likely to oppose policies, which
could improve the situation. A stalemate seems to have arisen.
A radically different – or rather, a radically better – future is hard for individuals to grasp and
accept. And while there is apparent widespread support for improving public transport, it is
clear that for many it will never be an alternative to the car. The challenge then is to make the
vehicles people use smaller and greener.
In the short term more can be done to enhance the ‘performance’ of the road network such
as providing motorists with reliable journey times. The Highways Agency’s Managed
Motorways scheme has started to do this and politicians must ensure it has the money to see
it through.
Longer term, any more radical changes to the way drivers use the road system – possibly
through the introduction of national road pricing – have to be implemented with public
support. Convincing sceptical motorists of the merit of such fundamental shifts in policy will
not be easy. But that is no reason not to do it.
Professor Stephen Glaister Director Royal Automobile Club Foundation

© 2009 Ipsos MORI.
���� �������
����������� �

�
���� ������
This report presents the findings from an Ipsos MORI survey on behalf of the RAC
Foundation. It has been written by a team of researchers at Ipsos MORI.
The survey was designed to provide a snapshot of public, and particularly car drivers’,
attitudes towards car use and congestion. It also aimed to supplement measurements of the
perceived nature of the problem with some pointers about the acceptability, or not, of
potential solutions. The survey was undertaken during June 2009 and utilised a number of
trend questions enabling us to comment on changes in public opinion over the course of this
decade.
The Ipsos MORI/RAC Foundation survey updates two undertaken by Ipsos MORI: the
surveys for the BBC in 1999 and the Commission for Integrated Transport in 2001. These
serve as bookends for this report by providing data from a decade ago, over which time there
has been an unchecked growth in car numbers – seven million more since 1995. While this
trend is still set to be followed in the next decade by increases in the number of cars and
traffic congestion according to official forecasts, it should be noted that during 2008 there
was, for the first time, a slight drop off in traffic volumes across the UK, a likely reaction to the
economic recession.1
There has been significant changes over the last ten years. Transport issues have
periodically been very salient for people, politicians and policy-makers alike: from the fuel
price protests in 2000 to similar protests in 2008, from the introduction of the Congestion
Charge in London in 2003 to the Manchester referendum defeat late last year. In terms of
public transport, we have seen the collapse of Railtrack, PPP on the Underground, a new
policy agenda reflecting a new focus on environmental sustainability and, shortly after the
fieldwork for this survey, the handover of the National Express franchise.
Our survey in 2009 provided us with an opportunity to track public and drivers’ attitudes over
this period and this was one of the primary motivations behind this research. We were also
prompted by the completion of the Place Survey, the successor to the Best Value
Performance Indicator (BVPI) surveys. Back in 2005/6 these surveys, undertaken by every
local authority across England, found tackling traffic congestion to be second only behind
activities for teenagers as something considered ‘most in need of improvement’ by local

�
residents. In 2006, the then Secretary of State for Transport, Douglas Alexander, referred to
a shared “congestion challenge”2.
If published in full, the Place Survey dataset will provide us with the chance to update BVPI
data, to look again at public perceptions of congestion at a very local level and to investigate
the relationship between these perceptions and a range of local factors. Alternatively, we can
use the growing National Highways and Transport Survey which can offer much needed local
granularity to supplement national surveys such as this one.
Our survey naturally gives people a voice about important issues. Inevitably, it represents a
snapshot of opinion and, in the confines of a short questionnaire we are reliant on quick top-
of-mind responses. Both Ipsos MORI and the RAC Foundation are keen that the findings we
now go on to describe, are seen alongside other, more detailed, pieces of work drawing on
wider evidence-bases such as:
• The Car in British Society, RAC Foundation, April 2009;
• Motoring towards 2050: Roads and Reality, RAC Foundation, November 2007;
• Road pricing at the crossroads, Ipsos MORI, October 2007; and
• Frontiers of performance in transport, Ipsos MORI, June 2006.
�������� �����������
The survey involved 995 face-to-face in-home interviews with a representative sample of
British adults aged 16+ with fieldwork undertaken 12-16 June 2009. Data have been
weighted to be representative of region, age, gender, working status, tenure, socio-economic
grade and car in household. There are 624 car drivers in our sample allowing us to analyse
the views of this group within the bounds of sampling tolerances of +4 percentage points (our
technical note at the end of this report provides further information).
�
�
�
1 See ‘Trafficmaster /RAC Foundation Journey Time Index report from Summer 2008 available here: http://www.racfoundation.org/files/journey%20time%20index%203rd%20edition.pdf 2 See: http://news.bbc.co.uk/1/hi/programmes/sunday_am/6203684.stm
�
����������� �
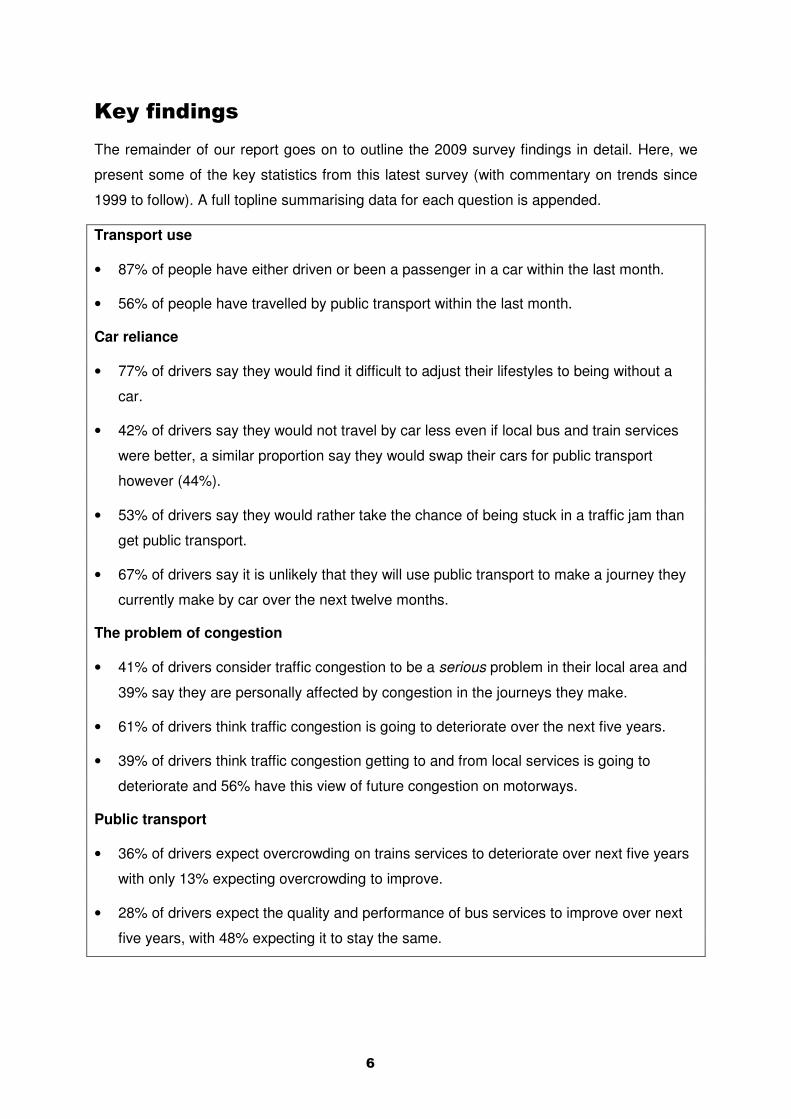
The remainder of our report goes on to outline the 2009 survey findings in detail. Here, we
present some of the key statistics from this latest survey (with commentary on trends since
1999 to follow). A full topline summarising data for each question is appended.
Transport use
• 87% of people have either driven or been a passenger in a car within the last month.
• 56% of people have travelled by public transport within the last month.
Car reliance
• 77% of drivers say they would find it difficult to adjust their lifestyles to being without a
car.
• 42% of drivers say they would not travel by car less even if local bus and train services
were better, a similar proportion say they would swap their cars for public transport
however (44%).
• 53% of drivers say they would rather take the chance of being stuck in a traffic jam than
get public transport.
• 67% of drivers say it is unlikely that they will use public transport to make a journey they
currently make by car over the next twelve months.
The problem of congestion
• 41% of drivers consider traffic congestion to be a serious problem in their local area and
39% say they are personally affected by congestion in the journeys they make.
• 61% of drivers think traffic congestion is going to deteriorate over the next five years.
• 39% of drivers think traffic congestion getting to and from local services is going to
deteriorate and 56% have this view of future congestion on motorways.
Public transport
• 36% of drivers expect overcrowding on trains services to deteriorate over next five years
with only 13% expecting overcrowding to improve.
• 28% of drivers expect the quality and performance of bus services to improve over next
five years, with 48% expecting it to stay the same.

�
• Similarly with train services, 29% think quality and performance will improve, 44% think it
will stay the same.
Congestion: possible solutions
• 42% of drivers oppose building more motorways but 73% support widening existing
motorways where there is a lot of congestion. Support for widening is significantly higher
among drivers than across the public more generally but, still, nearly two-thirds of British
adults are supportive (64%).
• 44% of drivers oppose charges for driving into the centre of large towns and cities where
there is major congestion while a similar proportion support this policy (41%). More
drivers support motorway tolling schemes than oppose them (45% support; 38%
oppose).
• 50% of drivers support using motorway hard shoulders when signs permit and 65%
support changing motorway speed limits depending on congestion. Support, though still
high, is lower among the general public – 43% support driving on hard shoulders, 56%
support variable motorway speed limits.
• 77% of drivers support increasing the number and frequency of bus services and 65%
support new tram systems in major towns and cities; more so than the public overall
(72% and 59% respectively).
�
���� ����� ����!���������!���
Car ownership and use have grown since the late 1980s and extended across the
population: according to national statistics three-quarters of households own at least one car
and the car dominates most people’s daily travel3. In an Ipsos MORI survey in 2007 42% of
British adults reported driving a car or van every day or nearly every day4. According to our
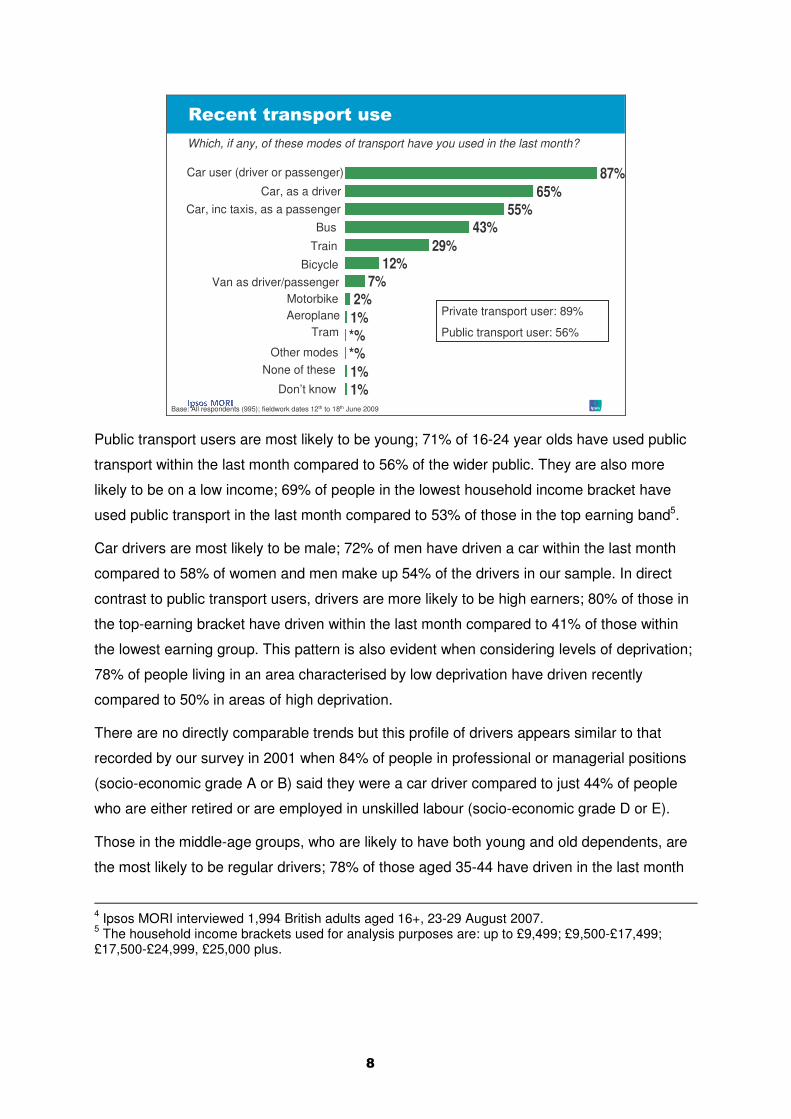
latest survey, nearly nine in ten people (87%) either regularly drive – at least once in the past
month – or are a passenger in a car. This compares to just over half, 56%, who have used a
bus or train within the last month (underground/metro facilities remain confined to major
English cities).
3 RAC Foundation The Car in British Society, pp.26-51.
"
87%65%
55%43%
29%12%
7%
1%
1%1%
*%
2%
*%
#�!�������� ����� �
Which, if any, of these modes of transport have you used in the last month?
Car, as a driverCar, inc taxis, as a passenger
Van as driver/passenger
Bus
Train
Bicycle
Motorbike
Other modesNone of these
Don’t knowBase: All respondents (995); fieldwork dates 12th to 18th June 2009
Car user (driver or passenger)
AeroplaneTram
Private transport user: 89%
Public transport user: 56%
Public transport users are most likely to be young; 71% of 16-24 year olds have used public
transport within the last month compared to 56% of the wider public. They are also more
likely to be on a low income; 69% of people in the lowest household income bracket have
used public transport in the last month compared to 53% of those in the top earning band5.
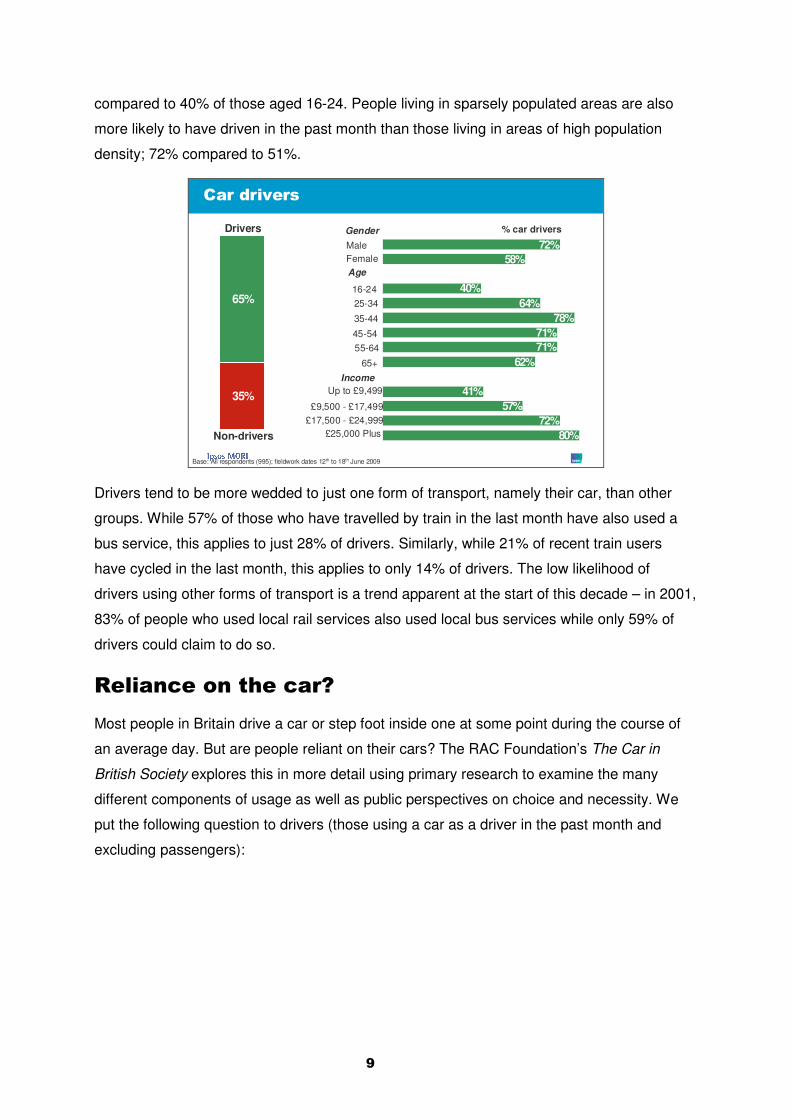
Car drivers are most likely to be male; 72% of men have driven a car within the last month
compared to 58% of women and men make up 54% of the drivers in our sample. In direct
contrast to public transport users, drivers are more likely to be high earners; 80% of those in
the top-earning bracket have driven within the last month compared to 41% of those within
the lowest earning group. This pattern is also evident when considering levels of deprivation;
78% of people living in an area characterised by low deprivation have driven recently
compared to 50% in areas of high deprivation.
There are no directly comparable trends but this profile of drivers appears similar to that
recorded by our survey in 2001 when 84% of people in professional or managerial positions
(socio-economic grade A or B) said they were a car driver compared to just 44% of people
who are either retired or are employed in unskilled labour (socio-economic grade D or E).
Those in the middle-age groups, who are likely to have both young and old dependents, are
the most likely to be regular drivers; 78% of those aged 35-44 have driven in the last month
4 Ipsos MORI interviewed 1,994 British adults aged 16+, 23-29 August 2007. 5 The household income brackets used for analysis purposes are: up to £9,499; £9,500-£17,499; £17,500-£24,999, £25,000 plus.
$
compared to 40% of those aged 16-24. People living in sparsely populated areas are also
more likely to have driven in the past month than those living in areas of high population
density; 72% compared to 51%.
35%
65%
80%72%
57%41%
62%71%71%
78%64%
40%
58%72%
Drivers
%���������
Gender
Non-drivers
MaleFemale
16-2425-34
Age
35-44
55-64
65+
Up to £9,499
£9,500 - £17,499£17,500 - £24,999
Income
45-54
£25,000 Plus
Base: All respondents (995); fieldwork dates 12th to 18th June 2009
% car drivers
Drivers tend to be more wedded to just one form of transport, namely their car, than other
groups. While 57% of those who have travelled by train in the last month have also used a
bus service, this applies to just 28% of drivers. Similarly, while 21% of recent train users
have cycled in the last month, this applies to only 14% of drivers. The low likelihood of
drivers using other forms of transport is a trend apparent at the start of this decade – in 2001,
83% of people who used local rail services also used local bus services while only 59% of
drivers could claim to do so.
#�����!���������!��&�
Most people in Britain drive a car or step foot inside one at some point during the course of
an average day. But are people reliant on their cars? The RAC Foundation’s The Car in
British Society explores this in more detail using primary research to examine the many
different components of usage as well as public perspectives on choice and necessity. We
put the following question to drivers (those using a car as a driver in the past month and
excluding passengers):

�'
Our question:
To what extent do you agree or disagree…”I would find it difficult to adjust my lifestyle to
being without a car”?
Three-quarters (77%) of drivers agree that they would find it difficult to adjust their lifestyles
to being without a car. Among drivers, more than half (54%) agree strongly with this
sentiment with a further 23% tending to agree. A similar proportion felt the same ten years
earlier according to the MORI/BBC survey in 1999; 79% agreed overall back then, including
57% who strongly agreed.
More than two in five say they would not travel by car less even if bus and train services in
their area were better (42%). And willingness to swap mode has apparently declined over the
past ten years; 44% of drivers now agree they would travel by car less if bus and train
services were better down from 60% in 1999; 42% disagree, up from 33%. This might, in
part, be related to a growing sense that congestion is not a problem, described later.
54
57
17
31
23
21
27
29
13
12
29
20
3
6
14
13
2009
1999
2009
1999
#�����!���������!��
I would find it difficult to adjust my lifestyle to being without a car
Base: All car drivers, 2009: 624, 1999: 2295
% Tend to agree% Strongly agree % Tend to disagree % Strongly disagree
I would travel by car less if bus and train services around here were better
While 44% of drivers agree that they would travel by car less if public transport services were
better, 67% say it is unlikely that they will use a bus, train or bicycle to make a regular
journey they currently make by car over the next twelve months. This suggests either a
reluctance to let go of car use and commit to a modal shift or, perhaps, low expectations that
public transport will improve over the next year or so. This survey shows the latter to be the

��
most likely as the majority of respondents believe that buses and trains will stay the same or
get worse. Or survey also provides a pointer that car use is the product of choice as well as
necessity. We asked:
Our question:
To what extent do you agree or disagree… “I would rather take the chance of being stuck in
a traffic jam than get public transport”?
More than half of drivers, 53%, say they would rather take the chance of suffering one of the
downsides of car use – being stuck in a jam – than having to use a public transport
alternative. And, among those considering traffic congestion to be a serious problem where
they live, more agree than disagree.
Men are more likely than women to be wedded to their cars; nearly two thirds say they would
find it difficult to adjust their lifestyles to being without a car (63%) compared to half of
women (53%). Among drivers, the vast majority of both men and women would find it difficult
to adjust (79% and 75% respectively). But female drivers are more likely to disagree that
they would rather take the chance of being stuck in a traffic jam than get public transport:
36% of women disagree compared to 27% of men. Their male counterparts are more likely to
disagree that they would travel by car less if bus and train services were better; 46% of men
disagree compared to 38% of women. Those in the middle-age range and on high incomes
are also more likely to be heavily dependent on their cars.
#�����!���������!��
I’d rather take the chance of being stuck in a traffic jam than get public transport
I would travel by car less if bus and train services around here were better
I would find it difficult to adjust my lifestyle to being without a car
7975
4245
5649
1715
4638
2736
Female drivers
Male drivers
Female drivers
Male drivers
Female drivers
Male drivers
Base: All respondents (995); fieldwork dates 12th to 18th June 2009
% Agree % Disagree
�
%���� ����(���) � �����* � ����� �
Data from national road traffic counts has shown a continual (albeit reduced) rate of growth
in road traffic over the past decade and beyond. Overall traffic growth could simply reflect
increases in the national population of driving age. The evidence does, however, indicate
that cars are being used less intensively. There are a number of possible explanations for
this trend, the most likely being that average car use has fallen because car ownership and
use is spreading to those groups who have not historically had access to cars and who, on
average, travel less than the more traditional profile of users.6 Traffic levels, although not a
measure of congestion, are a useful indicator of the overall levels of congestion road users
experience at any given time.
Against this backdrop, our survey of a national sample of British adults has found a
significant improvement in perceptions of local traffic congestion over the past decade. This
finding does chime with some evidence that congestion has, in fact, been easing since the
beginning of the economic downturn and as we go on to look at the detail it is worth
remembering that the question we asked referenced congestion as a serious problem.
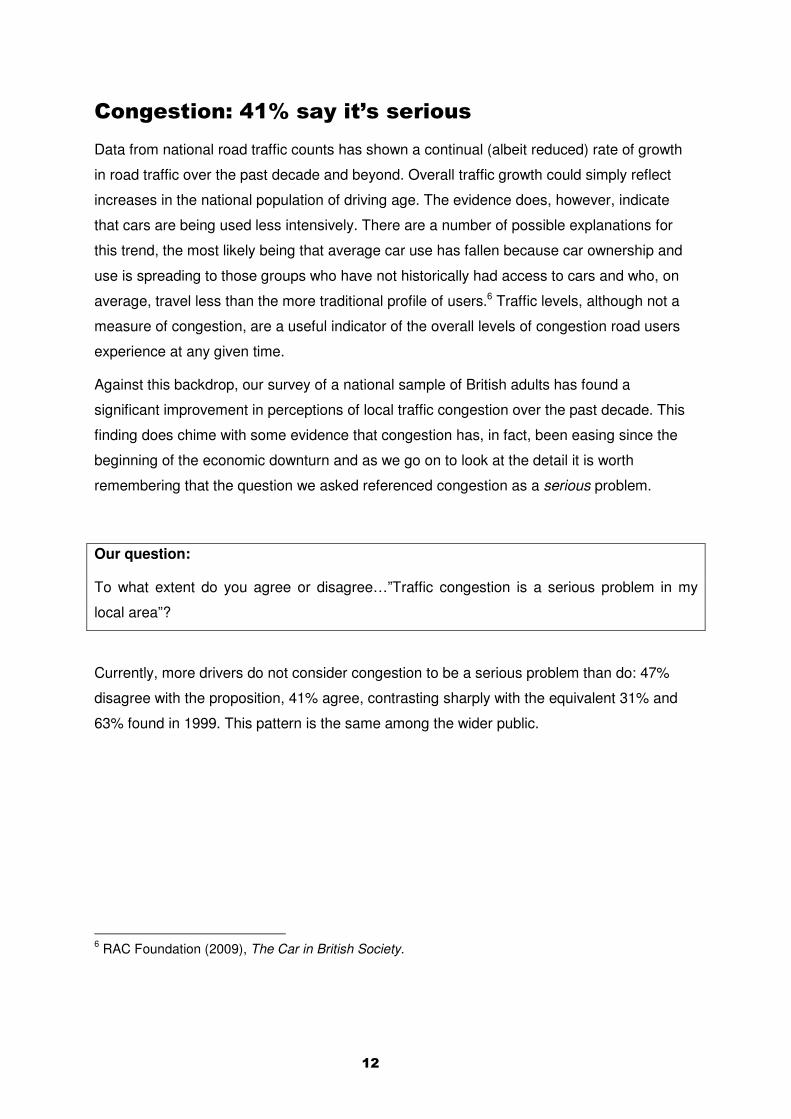
Our question:
To what extent do you agree or disagree…”Traffic congestion is a serious problem in my
local area”?
Currently, more drivers do not consider congestion to be a serious problem than do: 47%
disagree with the proposition, 41% agree, contrasting sharply with the equivalent 31% and
63% found in 1999. This pattern is the same among the wider public.
6 RAC Foundation (2009), The Car in British Society.

�
16
37
36
25
32
27
35
16
25
11
5
6
������!�!���� �����+ �� ����� � ��,��� &
2009
1999
2001
Base: All drivers, 2009: 624, 2001: 1404 1999: 2295
Traffic congestion is a serious problem in my local areaPlease tell me to what extent you agree or disagree with the following statements?
% Tend to agree% Strongly agree % Tend to disagree % Strongly disagree
A similar proportion of drivers say that they are personally affected by congestion in the
journeys they make (39%) as consider it to be a serious problem (41%). But the groups of
respondents taking these positions do not entirely overlap: 64% of drivers who consider
congestion to be a serious local problem consider themselves to be personally affected by
congestion (either being late or having to change the way they travel), but 23% disagree.
One possible explanation behind an increase in the proportion of drivers disagreeing that
congestion is a serious problem over the past ten years might simply be that over that period
drivers have become desensitised to the problem, accepting it as a necessary and inevitable
downside to driving – although this is not proven one way of the other by this research. In
addition, there is some evidence to suggest that congestion has recently eased, relatively
speaking at least7.
These are important findings as some of the potential instruments available to policy-makers
– congestion charging in particular – are unlikely to garner support however, if people doubt
the premise. This is not to say though that people do not consider congestion to be a
problem. Rather, on the whole, fewer doubt that it is a serious problem than was the case at
the start of the decade. Our research for the County Surveyors Society in 2007 found 68% of
British adults rated congestion as a ‘very major problem’ or a ‘fairly major problem’ in the five
7 See ‘Trafficmaster /RAC Foundation Journey Time Index’ report

��
miles around where they live8, something we will update later this year. The 2008-9 Place
Survey data will also provide a sense of the local picture of public concern about congestion
relative to other issues like crime and education.
Similarly, the aggregate picture in our survey masks some important differences among
different population groups and in different localities. For instance, drivers in Scotland are
significantly less likely to think that traffic congestion in their local area is a serious problem
than drivers in many English regions. For instance, more than half of drivers in Yorkshire and
the Humber (52%) consider traffic congestion to be a serious local issue compared to just a
quarter of Scottish drivers (24%). We look further at area differences, based on levels of
urbanity and population density, later in this report (see page 22).
%���� ����(� ������ � �� � � ��,���������������
There is a strong sense that congestion will get worse. In 2001, seven in ten drivers
expected traffic congestion to deteriorate over the decade (68%). As we have seen, at the
end of the decade not quite ten years later, a smaller proportion of drivers consider
congestion to be a serious problem – a relative improvement from 69% to 41%.
But, pessimism about the level of traffic expected on British roads in the future is as deep as
it is wide. The majority of people think traffic congestion will deteriorate looking ahead to the
future – 53% think it will get worse looking ahead over the next 5 years, five times the
proportion who think it will improve over this time period (11%) – including 16% who think it
will deteriorate a lot. Drivers are even more pessimistic: 61% predict a deterioration in
congestion.
This public pessimism about congestion compares with relative optimism about the quality
and performance of bus services and train services over the next five years – note, this is
relative optimism because the majority think these services will ‘stay the same’ but, there is
still, more of an optimistic than pessimistic view. More than a quarter think that the quality
and performance of bus (27%) and train services (28%) will improve.
These findings come in the context of pessimism about other road issues – 40% think vehicle
pollution affecting global warming will get worse, and 40% think the same of motorway
delays due to road works.
8 Ipsos MORI interviewed 2,044 British adults 18-23 October 2007.
��
-� �� � �� � � ��,����� ��������!���� �����
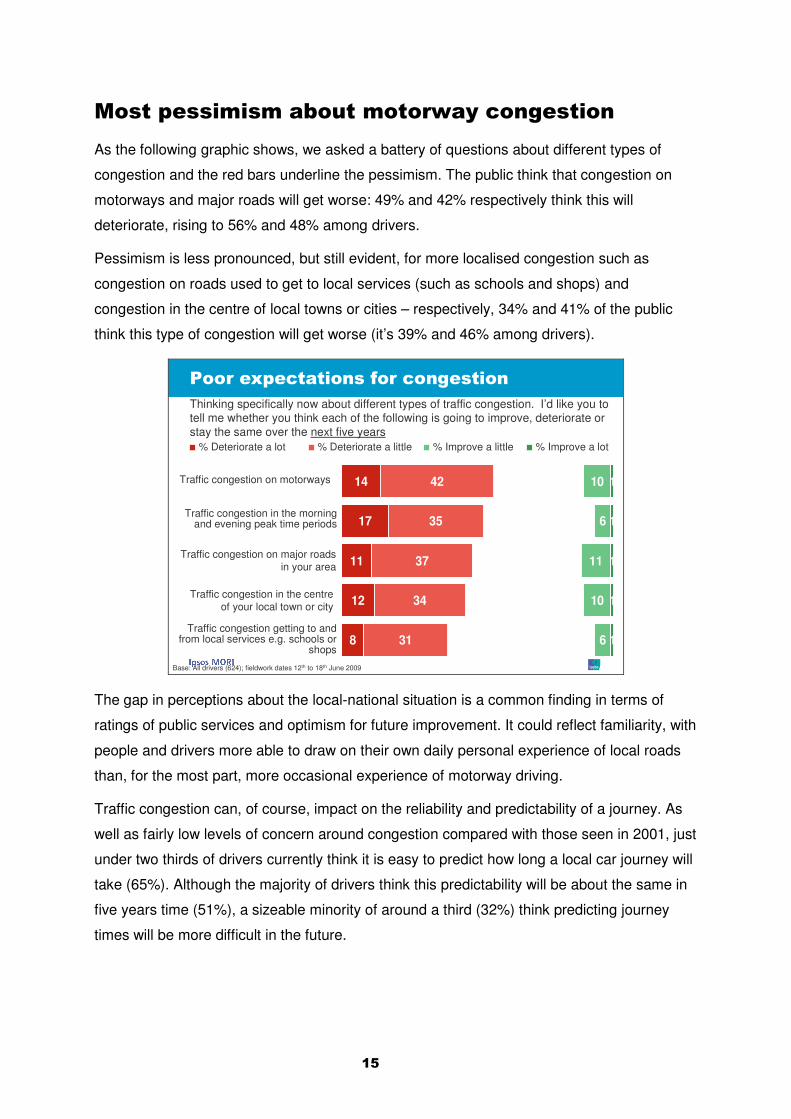
As the following graphic shows, we asked a battery of questions about different types of
congestion and the red bars underline the pessimism. The public think that congestion on
motorways and major roads will get worse: 49% and 42% respectively think this will
deteriorate, rising to 56% and 48% among drivers.
Pessimism is less pronounced, but still evident, for more localised congestion such as
congestion on roads used to get to local services (such as schools and shops) and
congestion in the centre of local towns or cities – respectively, 34% and 41% of the public
think this type of congestion will get worse (it’s 39% and 46% among drivers).
14
17
11
12
8
42
35
37
34
31
10
6
11
10
6
1
1
1
1
1
.�����/ �!������ �����!���� ����
Thinking specifically now about different types of traffic congestion. I’d like you to tell me whether you think each of the following is going to improve, deteriorate or stay the same over the next five years
% Deteriorate a lot % Deteriorate a little % Improve a little % Improve a lot
Traffic congestion on major roadsin your area
Traffic congestion in the morning and evening peak time periods
Traffic congestion getting to and from local services e.g. schools or
shops
Traffic congestion on motorways
Traffic congestion in the centre of your local town or city
Base: All drivers (624); fieldwork dates 12th to 18th June 2009
The gap in perceptions about the local-national situation is a common finding in terms of
ratings of public services and optimism for future improvement. It could reflect familiarity, with
people and drivers more able to draw on their own daily personal experience of local roads
than, for the most part, more occasional experience of motorway driving.
Traffic congestion can, of course, impact on the reliability and predictability of a journey. As
well as fairly low levels of concern around congestion compared with those seen in 2001, just
under two thirds of drivers currently think it is easy to predict how long a local car journey will
take (65%). Although the majority of drivers think this predictability will be about the same in
five years time (51%), a sizeable minority of around a third (32%) think predicting journey
times will be more difficult in the future.

��
This may be linked to expectations of worsening congestion as two in five of those who think
that traffic congestion will deteriorate over the next five years think it will be more difficult to
predict journey times; 40% compared to 20% among those who think congestion will
improve.
0� ����� ����!�����1���������� �
Currently
11%
54%
17%
14%3%1%
*%
5 years time
10%
51%
26%
5%5% 2%*%
To what extent is it easy or difficult to predict how long it takes to make a journey in your local area by car?
In five years time, do you think it will be easier or more difficult than it is now to predict how long it will take to make a journey in your local area by car, or will it be able the same?
Very easy
Fairly easy
Neither/nor
Fairly difficult
Very difficultDon’t know
Far easier
A little easier
About the same
A little more difficult
Far more difficultDon’t know
Base: All drivers (624); fieldwork dates 12th to 18th June 2009
Not applicable /don’t have a car
Not applicable /don’t have a car
�
.�,��!� � ���������/� �����!���� ������ ������ ����
���!�� �
What of the potential solutions? This year’s survey enabled us to update measurements of
public support and opposition collected by MORI in 2001 on behalf of the Commission for
Integrated Transport.
Our questions:
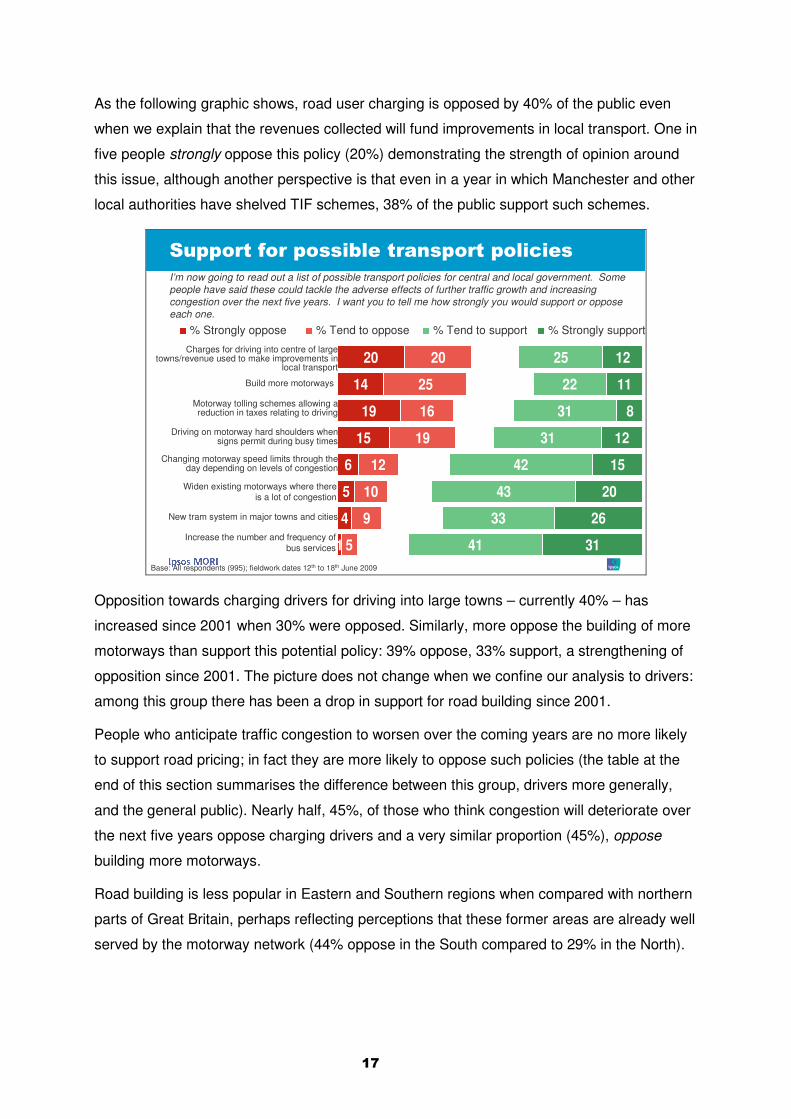
I’m now going to read out a list of possible transport policies for central and local
government. Some people have said that these could tackle the adverse effects of further
traffic growth and increasing congestion over the next few years. I want you to tell me how
strongly you would support or oppose each one…
��
As the following graphic shows, road user charging is opposed by 40% of the public even
when we explain that the revenues collected will fund improvements in local transport. One in
five people strongly oppose this policy (20%) demonstrating the strength of opinion around
this issue, although another perspective is that even in a year in which Manchester and other
local authorities have shelved TIF schemes, 38% of the public support such schemes.
20
14
19
15
6
5
4
1
20
25
16
19
12
10
9
5
25
22
31
31
42
43
33
41
12
11
8
12
15
20
26
31
�� �������� � �,������� ���� ���!��
I’m now going to read out a list of possible transport policies for central and local government. Some people have said these could tackle the adverse effects of further traffic growth and increasing congestion over the next five years. I want you to tell me how strongly you would support or oppose each one.
% Strongly oppose % Tend to oppose % Tend to support % Strongly support
Widen existing motorways where thereis a lot of congestion
New tram system in major towns and cities
Build more motorways
Increase the number and frequency of bus services
Charges for driving into centre of large towns/revenue used to make improvements in
local transport
Motorway tolling schemes allowing areduction in taxes relating to driving
Driving on motorway hard shoulders whensigns permit during busy times
Changing motorway speed limits through the day depending on levels of congestion
Base: All respondents (995); fieldwork dates 12th to 18th June 2009
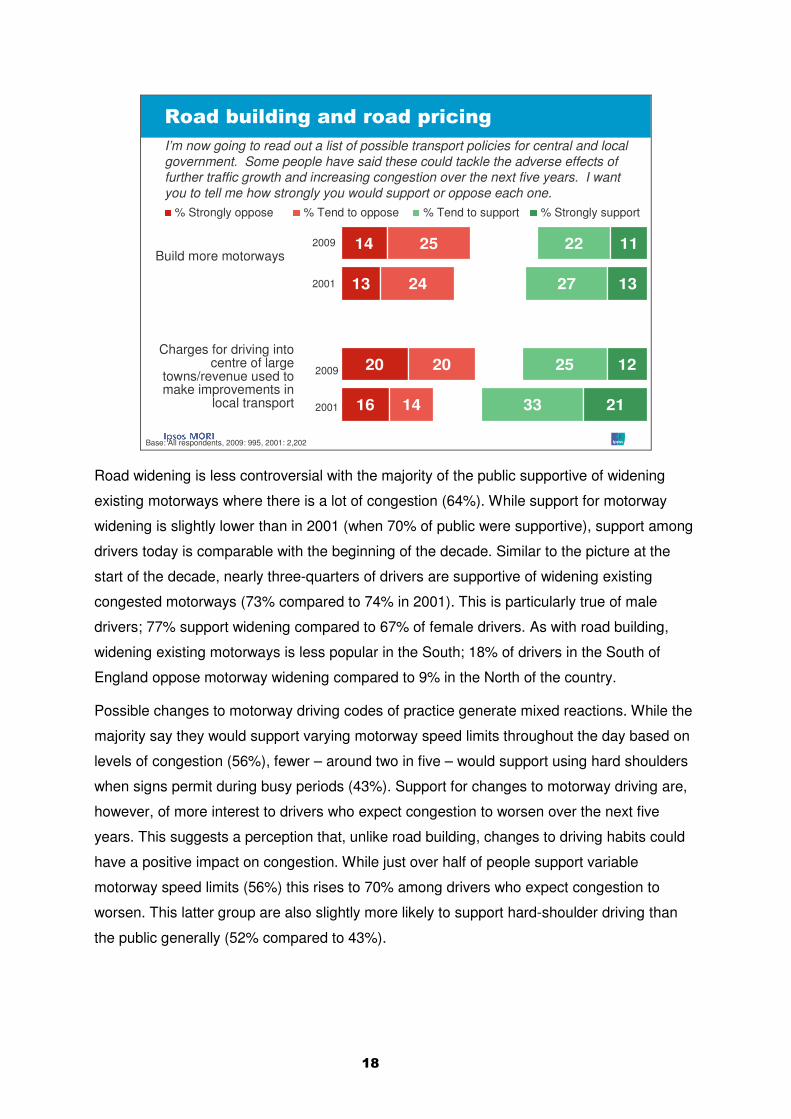
Opposition towards charging drivers for driving into large towns – currently 40% – has
increased since 2001 when 30% were opposed. Similarly, more oppose the building of more
motorways than support this potential policy: 39% oppose, 33% support, a strengthening of
opposition since 2001. The picture does not change when we confine our analysis to drivers:
among this group there has been a drop in support for road building since 2001.
People who anticipate traffic congestion to worsen over the coming years are no more likely
to support road pricing; in fact they are more likely to oppose such policies (the table at the
end of this section summarises the difference between this group, drivers more generally,
and the general public). Nearly half, 45%, of those who think congestion will deteriorate over
the next five years oppose charging drivers and a very similar proportion (45%), oppose
building more motorways.
Road building is less popular in Eastern and Southern regions when compared with northern
parts of Great Britain, perhaps reflecting perceptions that these former areas are already well
served by the motorway network (44% oppose in the South compared to 29% in the North).
�"
14
13
20
16
25
24
20
14
22
27
25
33
11
13
12
21
#����,����������������� ��!���
I’m now going to read out a list of possible transport policies for central and local government. Some people have said these could tackle the adverse effects of further traffic growth and increasing congestion over the next five years. I want you to tell me how strongly you would support or oppose each one.
% Strongly oppose % Tend to oppose % Tend to support % Strongly support
Build more motorways2009
2001
Base: All respondents, 2009: 995, 2001: 2,202
Charges for driving into centre of large
towns/revenue used to make improvements in
local transport
2009
2001
Road widening is less controversial with the majority of the public supportive of widening
existing motorways where there is a lot of congestion (64%). While support for motorway
widening is slightly lower than in 2001 (when 70% of public were supportive), support among
drivers today is comparable with the beginning of the decade. Similar to the picture at the
start of the decade, nearly three-quarters of drivers are supportive of widening existing
congested motorways (73% compared to 74% in 2001). This is particularly true of male
drivers; 77% support widening compared to 67% of female drivers. As with road building,
widening existing motorways is less popular in the South; 18% of drivers in the South of
England oppose motorway widening compared to 9% in the North of the country.
Possible changes to motorway driving codes of practice generate mixed reactions. While the
majority say they would support varying motorway speed limits throughout the day based on
levels of congestion (56%), fewer – around two in five – would support using hard shoulders
when signs permit during busy periods (43%). Support for changes to motorway driving are,
however, of more interest to drivers who expect congestion to worsen over the next five
years. This suggests a perception that, unlike road building, changes to driving habits could
have a positive impact on congestion. While just over half of people support variable
motorway speed limits (56%) this rises to 70% among drivers who expect congestion to
worsen. This latter group are also slightly more likely to support hard-shoulder driving than
the public generally (52% compared to 43%).
�$
The Department for Transport’s survey research earlier this year similarly found public
support for widening motorways but with these and other motorway congestion policies
presented as a menu, this idea was only slightly more popular than using motorway hard
shoulders9.
Approaching two in five (35%) oppose motorway tolling schemes operating at certain times
of day even if this was combined with a reduction in taxes relating to driving but 39% of the
public support this as a policy rising to 45% among drivers. A similar proportion of those who
expect congestion to worsen oppose such schemes (40%).
Support is strongest for policies involving improvements to public transport although we did
not put to respondents a clear sense of the costs involved or the source of funds. Overall,
59% and 72% of the public back new tram systems in major towns and cities and increasing
the number and frequency of bus services. Although support is very high for these policies
around public transport, it has dropped off slightly since 2001: 68% supported new tram
systems and 80% supported more bus services.
Drivers are similarly supportive of new tram systems (65%) although they are, perhaps
surprisingly, more supportive of a policy to increase the number and frequency of bus
services than the public generally (77%).
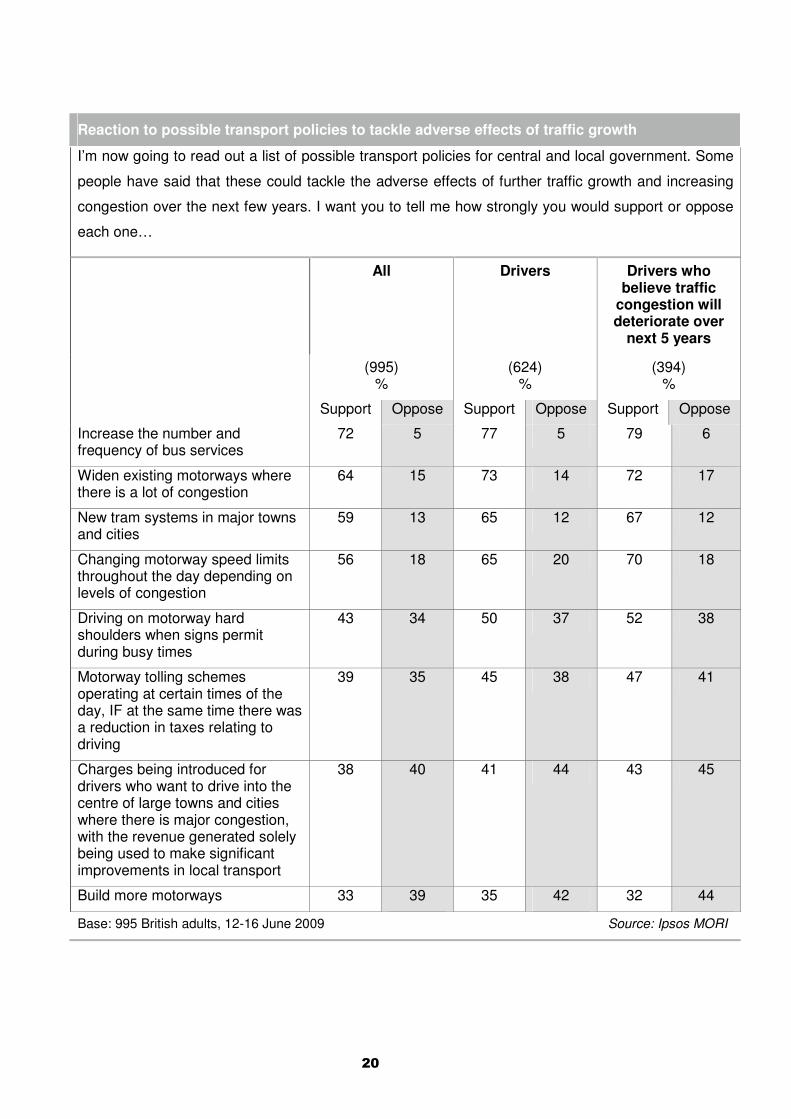
Finally, the following table summarises the picture among drivers and among those who
consider that traffic congestion will get worse in the next five years:
9 Department for Transport, Public attitudes towards road network performance in Great Britain, 2,133 British adults, January-February 2009.
'
Reaction to possible transport policies to tackle adverse effects of traffic growth
I’m now going to read out a list of possible transport policies for central and local government. Some
people have said that these could tackle the adverse effects of further traffic growth and increasing
congestion over the next few years. I want you to tell me how strongly you would support or oppose
each one…
� All Drivers Drivers who believe traffic
congestion will deteriorate over
next 5 years
(995) %
(624) %
(394) %
Support Oppose Support Oppose Support Oppose
Increase the number and frequency of bus services
72 5 77 5 79 6
Widen existing motorways where there is a lot of congestion
64 15 73 14 72 17
New tram systems in major towns and cities
59 13 65 12 67 12
Changing motorway speed limits throughout the day depending on levels of congestion
56 18 65 20 70 18
Driving on motorway hard shoulders when signs permit during busy times
43 34 50 37 52 38
Motorway tolling schemes operating at certain times of the day, IF at the same time there was a reduction in taxes relating to driving
39 35 45 38 47 41
Charges being introduced for drivers who want to drive into the centre of large towns and cities where there is major congestion, with the revenue generated solely being used to make significant improvements in local transport
38 40 41 44 43 45
Build more motorways 33 39 35 42 32 44
Base: 995 British adults, 12-16 June 2009 Source: Ipsos MORI
�
%�� 2�!���� ����2���!������������ ���������
So far, we have described attitudes among the public, commenting on the perspectives of
drivers and certain sub-groups of them. To supplement this we have looked at differences in
perspectives across the different types of sampling points used for our survey and have
focused in on population density and levels of deprivation.
For analysis purposes, we have categorised our sampling points as being high, medium or
low population density compared to the national average, and high, medium or low based on
the Index of Multiple Deprivation (IMD) score10, and we have been able to sub-divide urban
areas into London, metropolitan county or other urban area. Of course, there is likely to be
some overlap here with deprived areas more likely to be highly populated, often inner-city.
Those living in highly populated areas are far more likely to be public transport users than
people living in more sparsely populated areas. While more than six in ten people (62%) in
areas of high population density have travelled on public transport within the last month, this
applies to only half of those living in low density areas (50%). Large centres of population,
such as London and metropolitan counties are, of course, the most likely to have public
transport networks, including tram systems and underground as well as extensive overland
rail and bus services.
Virtually everyone living in an area with low population density is a private transport user
(97%) having either travelled by car as a driver or passenger, by taxi, van or by motorbike in
the last month. This compares to 79% of people living in highly populated areas. Meanwhile,
a higher proportion of people living in areas characterised by high levels of deprivation are
public transport users; 64% compared to 50% of those in areas of low deprivation.
Drivers from more sparsely populated areas are less concerned by congestion and less likely
to be affected personally by it but, at the same time, are more dependent on their cars as a
means of getting around. More than half, 54%, disagree that congestion is a serious local
problem compared to 46% of drivers living in a highly populated area. They are less likely to
say they are personally affected by congestion in the journeys they make; 57% disagree they
are affected, compared to 45% of people in areas characterised by a low population density.
10 Because the Index of Multiple Deprivation is measured and calculated in different ways across England, Scotland and Wales, and given the Due to small sample sizes in Scotland and Wales we only comment on deprivation in relation to England throughout this report.

These drivers are also more likely to strongly agree than those in high density areas that they
“would find it difficult to adjust my lifestyle to being without a car”; 60% do so compared to
43% living in a highly populated area, 82% agree in low areas and 69% in high areas.
Perceptions of congestion worsen with increasing urbanity – for instance, 50% of drivers
living in metropolitan areas agree traffic congestion is a serious problem compared to 30% in
town and fringe areas. Similarly, drivers from areas across England characterised by high
levels of deprivation (a low IMD score) are more likely to find congestion a serious problem
and be personally affected by it, but at the same time are not as wedded to their cars as
those in wealthier areas.
Drivers in areas characterised by low levels of deprivation are more likely to be dependent on
their cars; 85% agree they would find it difficult to adjust their lifestyle to being without a car
compared to 73% in areas of high deprivation. Indeed, a fifth of those living in an area of high
deprivation in England disagree that this would be difficult (20%) compared to only a tenth of
those in a low deprived area (11%).
Drivers living in more wealthy areas are also far less likely to be willing to swap their cars for
public transport: three-quarters of drivers here say they are unlikely to use a bus, train or
bicycle to make a journey they currently make by car over the next twelve months (74%)
compared to 64% of drivers in areas characterised by high levels of deprivation.
Looking forward, while current levels of congestion are perceived to be worse in more
deprived areas, those living in areas with low levels of deprivation are most likely to be
pessimistic about congestion in the future; 72% think it will deteriorate over the next five
years compared to only half of drivers living in areas of high deprivation (50%).
In fact, drivers from more deprived areas are less pessimistic, more optimistic, about
congestion across the board. They are more likely to believe that traffic congestion on major
roads in their area will improve (20% compared to just 5% of drivers in areas with low levels
of deprivation) and, similarly, are more optimistic with regard to traffic congestion at peak
times and getting to and from local services and delays experienced on motorways due to
road works. This pattern is also evident in terms of public transport services.
Population density and deprivation also appear to have some bearing on attitudes towards
possible measures to tackle traffic growth. Those living in highly populated areas and those
characterised by higher deprivation are far more likely, for instance, to support road building
policies. Drivers in London and metropolitan counties are more likely to be supportive of road
building (43% and 48% support) compared to drivers in other urban areas (29%).
The policy of introducing charges for drivers who want to drive into the centre of large towns
and cities is less popular in such areas; 51% of drivers in highly populated areas oppose this
as do 51% of drivers from metropolitan counties. Policies involving a financial penalty of
some sort on drivers – a charge or toll – generate far less support in more deprived areas.
�
%��!�� ��� ������� ��!����� �
Our survey provides some pointers about public attitudes towards car reliance, congestion
plus levels of support and opposition for potential policies relating to roads and motorists. It
updates similar surveys done in 1999 and 2001, and our main findings include:
• A strong reliance on the car across Britain. Our latest survey shows that 87% of
British adults have used a car in the past month. More than half the drivers in our sample,
54%, agree strongly that they would find life difficult without one.
• Congestion is considered to be less of a problem ten years on. Our survey in 1999
found 63% of drivers viewed congestion as a serious local problem. The equivalent is
now 41% and, while in absolute terms this remains a substantial minority, significantly
fewer people see congestion as a problem in comparison to ten years ago.
• A strong sense that congestion will be a problem in the future. While the proportion
of drivers considering congestion a problem is relatively low in a historical context,
perhaps more striking is strong pessimism about the future with 61% of drivers of the
view that it will deteriorate in as short a period as the next five years. Drivers consider
national road networks and motorways as hotspots for worsened congestion. Such
pessimism is not, of course, unique to transport and roads; our public opinion research
has frequently found enduring public pessimism about the county’s direction of travel and
that of public services.
• Scepticism about the alternatives. More than four in five, 84% of those drivers who say
they are personally affected by congestion also say they couldn’t adjust to life without a
car. And 53% of drivers would rather risk getting stuck in a traffic jam than get public
transport. Even among those drivers who consider congestion to be a serious local

�
problem, more than half, 57%, would rather risk sitting in a traffic jam than get public
transport.
Among the wider public, fewer agree that they would “travel by car less if bus and train
services around here were better” than was the case at the start of the decade. Private
transport users – car drivers, passengers, those who ride motorbikes or take taxis – are
more sceptical than those who rely more on buses and trains about the chances of public
transport getting better.
• The public support today’s congestion management policies rather than a radical
new approach. People are more supportive of, than opposed, to a number of traditional
management policies such as improving bus and tram services and widening existing
motorways where there is a lot of congestion. Road charging initiatives and more radical
changes to motorway driving practices generate higher levels of opposition. Although
more drivers do support than oppose driving on motorway hard shoulders when signs
permit at busy times this latter figure is as high as 37%. A fifth of drivers (20%) oppose
changing motorway speed limits depending on congestion although a majority are in
support of this measure (65%),
• Public opinion is split on motorway building and charge- and toll-based policies.
Support is lower where there is an obvious and direct financial burden on individual
motorists rather than a collective cost on the public purse. The proportion opposed to
road charging has increased over the decade with slightly more opposed to this policy
than support it. More than a fifth of drivers strongly oppose charging drivers entering
congested town centres or introducing motorway tolling schemes (22% and 21%)
showing the strength of opinion around this issue. Motorway building is also contentious
with two-fifths of the public opposed (39%).
• The public do not support road pricing as a measure to tackle congestion but,
instead, favour changing motorway driving codes. People who anticipate traffic
congestion to worsen over the coming years are no more likely to support road pricing; in
fact they are more likely to oppose such policies. They are however more likely than the
public generally to support driver management policies. While just over half of people
support variable motorway speed limits (56%) this rises to 70% among drivers who
expect congestion to worsen.

�
• There are differences between urban and rural drivers. Those living in more sparsely
populated areas are less concerned by congestion and less likely to be affected
personally by it but, at the same time, actually more dependent on their cars as a means
of getting around. Perceptions of congestion worsen with increasing urbanity and
deprivation (probably the same phenomenon).
Those living in highly populated areas characterised by higher deprivation are far more
likely to support road-building policies. The policy of introducing charges for drivers who
want to drive into the centre of large towns and cities are less popular in such areas.
Meanwhile, policies involving a financial penalty of some sort on drivers – a charge or toll
– generate far less support in more deprived areas. It’s hard to draw conclusions about
why and this could usefully be researched further.
These findings have a number of implications: • Cars play a central role in British society. This poses significant challenges for policy-
makers seeking to reduce car reliance and use and improve sustainability (quite apart
from technological solutions, some behaviour change is likely). This could be made
harder still given that the public consider congestion to be less of a problem and,
perhaps, something that can be tolerated.
• Congestion provides less of a ‘push’ towards public transport than was the case at
the start of the decade (fewer drivers consider it to be a problem now than then). At the
same time, public transport might have less ‘pull’ than it did a decade ago. While
people are relatively more optimistic about the chances of public transport getting better
than they are about the situation on roads improving, a smaller proportion of drivers now
say they would switch if bus and train services improved than was the case in 2001. Train
overcrowding appears to be a particular issue – around a third of the public, as well as
drivers in particular, think this will get worse in the next five years (33% and 36%
respectively).
• There is also an important local/national dimension to congestion. Our survey
shows greater public pessimism about congestion on motorways and major roads, in
comparison to congestion in town and city centres routes used for getting to and from
local services. While this may reflect a feeling that while there are alternatives for quick
trips across a local town there aren’t for long-distance motorway driving, this perception
gap could simply reflect a view that things cannot get much worse locally – after all, as

�
many as 41% of drivers think congestion is a serious problem. Either way, this is
important because many congestion and transport improvement schemes, such as TIF,
have been focused at the local, not the national, level.
• People, and drivers among them, are pessimistic about all types of congestion.
Pessimism extends to local, major and motorway roads and while this outlook is not
unique to the situation on our roads, it is salutary nonetheless. It is, however, the case
that proportionately fewer drivers consider congestion to be a serious problem than was
the case a decade ago, but this still represents a large proportion of an important
constituency for local and national government.
We suspect though that this national figure about a local problem masks considerable
local variation – of particular significance to local authorities charged with improving
transport services and shaping perceptions of place – and we plan to work with the RAC
Foundation later in the year to use the National Highways and Transport Survey and
Place Survey datasets to explore this further.
• The widespread concern for levels of congestion in the future helps to explain
wide support for numerous existing policies designed to tackle or alleviate
congestion. Widening existing motorways – strongly backed by the public – is preferred
to building more, and carefully communicated this could perhaps be one of the more
fruitful and publicly acceptable measures to pursue. At the time of writing, work has just
started on a widening scheme on a section of the M25, one of the first schemes of its
kind. People who expect congestion to worsen are also more supportive of policies to
change motorway driving management, such as variable speed limits and hard shoulder
running, which could suggest these are potential ‘easy wins’.
As this survey shows, there is value in disaggregating the sort of data we have collected
about drivers’ perspectives, in order that we are sensitive to urban, rural and socio-economic
dimensions. Drivers are far from being one homogenous group holding uniform views. For
example, our survey suggests that a policy framed as tackling congestion seems unlikely to
resonate in more sparsely populated areas. Policies involving a financial penalty of some sort
on drivers – a charge or toll – generate far less support in more deprived areas. Given these
variations in perspectives, the work being undertaken by Government and others to segment
different types of drivers, and better understand the levers and policies which are likely to
make a difference to different segments, will make an important contribution.
�
Our trend series shows growing public distaste for road charging and strong opposition to
motorway tolls even if reassurances are provided about the use of revenues. The bad press
and public defeats road pricing/charging has received in recent years can’t have helped, and
the economic backdrop could be a factor here too.
As our 2007 report Road pricing at the crossroads showed, strong political leadership and
effective communication are necessary pre-determinants of building public acceptability of
policies designed to tackle congestion. That report challenged the notion that the issue is
‘lost’ in public opinion terms but, on the evidence of this research for the RAC Foundation,
charging and tolls are undoubtedly ever more challenging policies to ‘sell’ to the public. This
probably makes the “congestion challenge” first talked about by Douglas Alexander in 2006,
an even greater one.
Ben Marshall and Antonia Dickman, Ipsos MORI Transport Research, July 2009
© Ipsos MORI
Ipsos MORI would like to thank Professor Stephen Glaister, Elizabeth Box and Philip Gomm
for their help and advice on this project, as well as the 995 British adults who took part in our
survey.

� © 2009 Ipsos MORI.
��!���!���������
������ �����
��!���!��������
Survey methodology
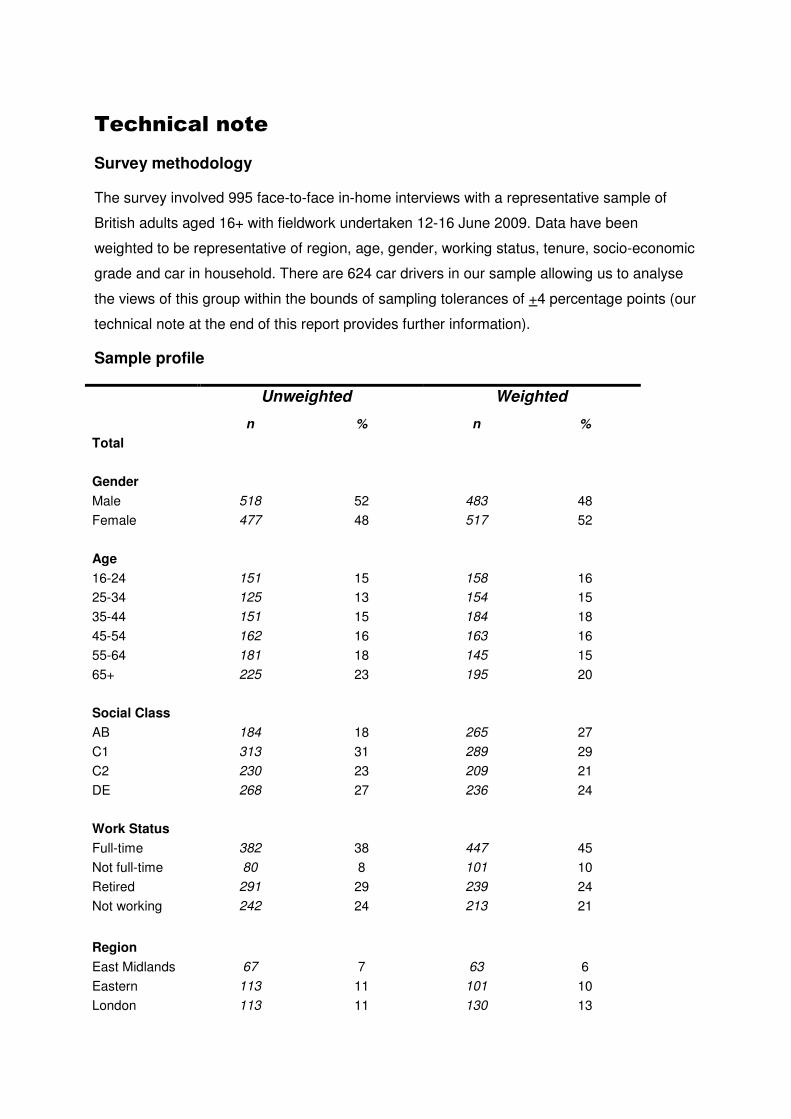
The survey involved 995 face-to-face in-home interviews with a representative sample of
British adults aged 16+ with fieldwork undertaken 12-16 June 2009. Data have been
weighted to be representative of region, age, gender, working status, tenure, socio-economic
grade and car in household. There are 624 car drivers in our sample allowing us to analyse
the views of this group within the bounds of sampling tolerances of +4 percentage points (our
technical note at the end of this report provides further information).
Sample profile
Unweighted Weighted
n % n % Total Gender Male 518 52 483 48 Female 477 48 517 52 Age 16-24 151 15 158 16 25-34 125 13 154 15 35-44 151 15 184 18 45-54 162 16 163 16 55-64 181 18 145 15 65+ 225 23 195 20 Social Class AB 184 18 265 27 C1 313 31 289 29 C2 230 23 209 21 DE 268 27 236 24 Work Status Full-time 382 38 447 45 Not full-time 80 8 101 10 Retired 291 29 239 24 Not working 242 24 213 21
Region East Midlands 67 7 63 6 Eastern 113 11 101 10 London 113 11 130 13

North East 55 6 46 5 North West 109 11 112 11 South East 105 11 143 14 South West 65 7 84 8 West Midlands 107 11 92 9 Yorks and Humber
101 10 88 9
Scotland 105 11 89 9 Wales 55 6 52 5 Tenure Owned outright 345 35 325 33 Bought on mortgage
359 36 379 38
Rented from local authority
150 15 133 13
Private rent 125 13 144 14 Other 5 1 5 1 Car in household
Yes 706 71 735 74 No 289 29 265 26
Source: Ipsos MORI
Population density, deprivation and location
We have categorised our sampling points as being high, medium or low population density
compared to the national average, and high, medium or low based on the Index of Multiple
Deprivation (IMD) score. The sampling points have also been characterised by their location
type with urban areas subdivided into London, metropolitan county or other urban area.
As the Index of Multiple Deprivation is measured and calculated in different ways across
England, Scotland and Wales, and given the small sample sizes in Scotland and Wales we
only comment on deprivation in relation to England throughout this report.

Guide to statistical reliability
The sample tolerances that apply to the percentage results in this report are given in the
table below. This table shows the possible variation that might be anticipated because a
sample, rather than the entire population, was interviewed. As indicated, sampling
tolerances vary with the size of the sample and the size of the percentage results.
Strictly speaking the tolerances shown here apply only to random samples; in practice good
quality quota sampling has been found to be as accurate
Approximate sampling tolerances applicable to percentages at or near these levels
10% or 90%
30% or 70% 50%
±±±± ±±±± ±±±± Size of sample on which Survey result is based
100 interviews 6 9 10 200 interviews 4 6 7 500 interviews 3 4 4 900 interviews 2 3 3 c. 1,000 interviews 2 3 3
Source: Ipsos MORI
For example, on a question where 50% of the people in a sample of 995 respond with a
particular answer, the chances are 95 in 100 that this result would not vary by more than 3
percentage points, plus or minus, from a complete coverage of the entire population using
the same procedures.
Tolerances are also involved in the comparison of results from different parts of the sample.
A difference, in other words, must be of at least a certain size to be considered statistically
significant. The following table is a guide to the sampling tolerances applicable to
comparisons.
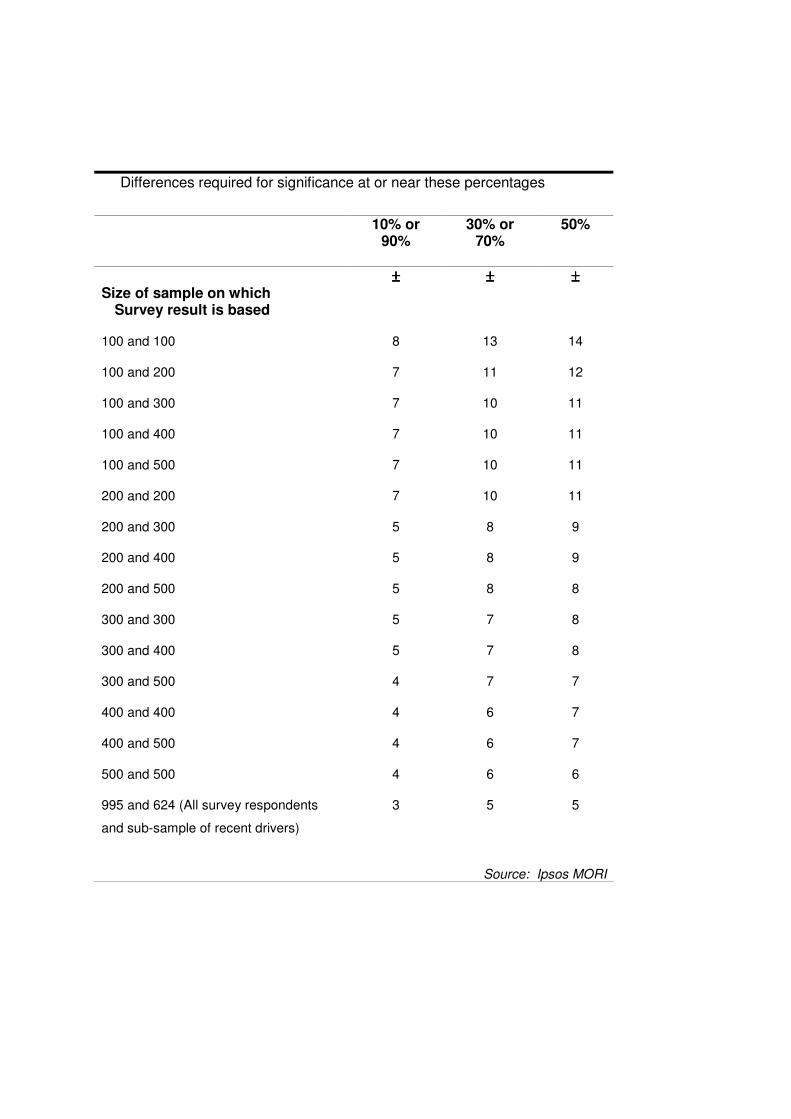
Differences required for significance at or near these percentages
10% or
90%
30% or 70%
50%
±±±± ±±±± ±±±± Size of sample on which Survey result is based
100 and 100 8 13 14
100 and 200 7 11 12
100 and 300 7 10 11
100 and 400 7 10 11
100 and 500 7 10 11
200 and 200 7 10 11
200 and 300 5 8 9
200 and 400 5 8 9
200 and 500 5 8 8
300 and 300 5 7 8
300 and 400 5 7 8
300 and 500 4 7 7
400 and 400 4 6 7
400 and 500 4 6 7
500 and 500 4 6 6
995 and 624 (All survey respondents
and sub-sample of recent drivers)
3 5 5
Source: Ipsos MORI
�
�� ����� �� � ����
• Where results do not sum to 100, this may be due to multiple responses, computer
rounding or the exclusion of don’t knows/not stated.
• Where combinations don’t sum to their components – e.g. ‘Strongly agree’, ‘Tend to agree’ and ‘Agree’, this may be due to computer rounding.
• Results are based on all respondents (995) unless otherwise stated.
• An asterisk (*) represents a value of less than one half or one percent, but not zero.
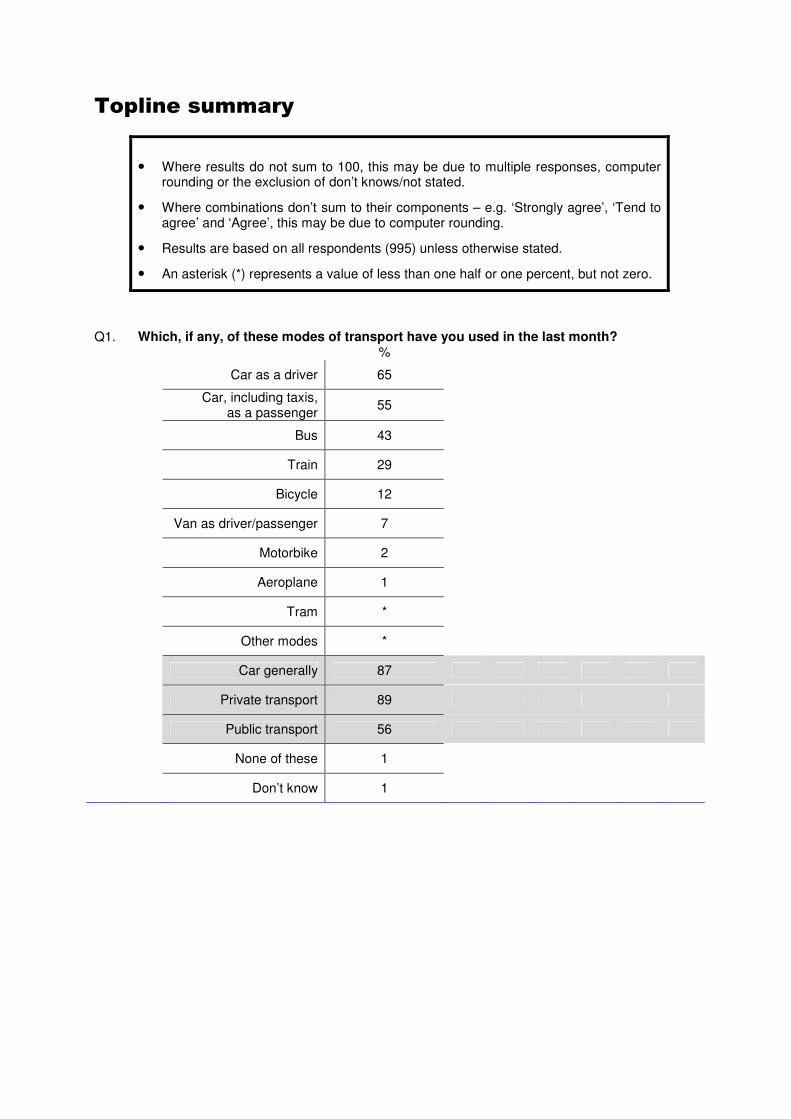
Q1. Which, if any, of these modes of transport have you used in the last month? %
Car as a driver 65
Car, including taxis, as a passenger 55
Bus 43
Train 29
Bicycle 12
Van as driver/passenger 7
Motorbike 2
Aeroplane 1
Tram *
Other modes *
Car generally 87
Private transport 89
Public transport 56
None of these 1
Don’t know 1
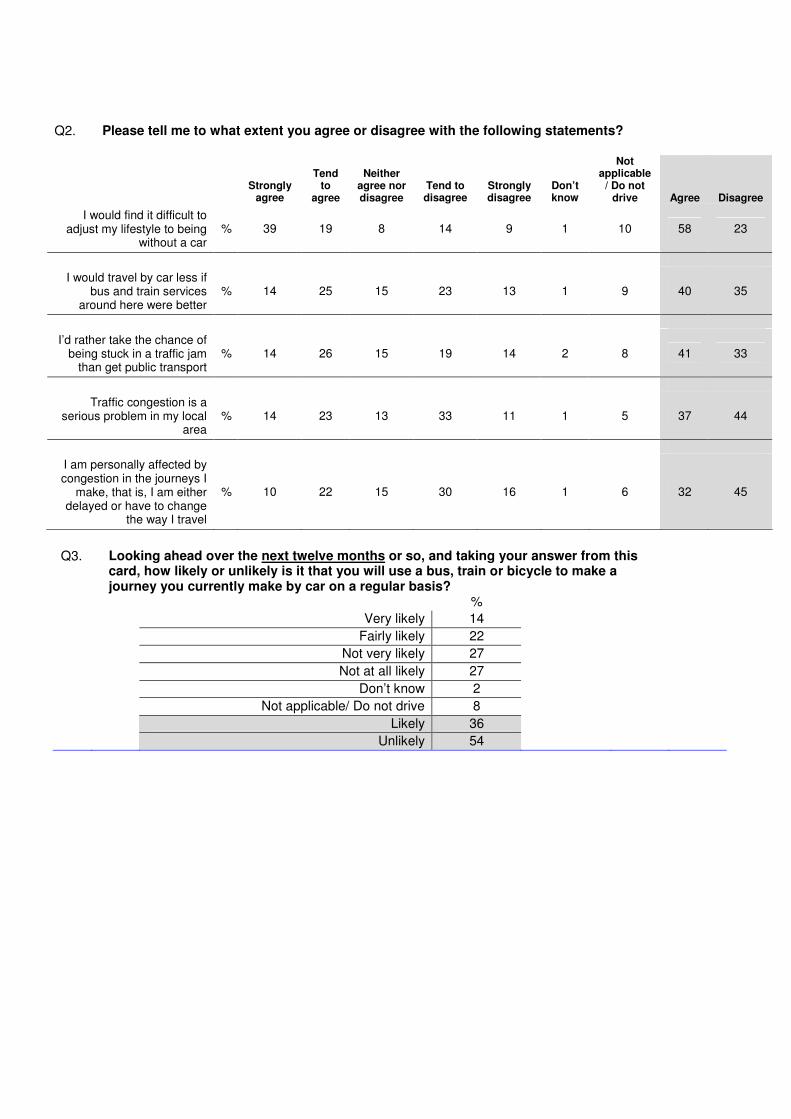
Q2. Please tell me to what extent you agree or disagree with the following statements?
Strongly
agree
Tend to
agree
Neither agree nor disagree
Tend to disagree
Strongly disagree
Don’t know
Not applicable
/ Do not drive Agree Disagree
I would find it difficult to adjust my lifestyle to being
without a car % 39 19 8 14 9 1 10 58 23
I would travel by car less if
bus and train services around here were better
% 14 25 15 23 13 1 9 40 35
I’d rather take the chance of
being stuck in a traffic jam than get public transport
% 14 26 15 19 14 2 8 41 33
Traffic congestion is a
serious problem in my local area
% 14 23 13 33 11 1 5 37 44
I am personally affected by congestion in the journeys I
make, that is, I am either delayed or have to change
the way I travel
% 10 22 15 30 16 1 6 32 45
Q3. Looking ahead over the next twelve months or so, and taking your answer from this
card, how likely or unlikely is it that you will use a bus, train or bicycle to make a journey you currently make by car on a regular basis?
% Very likely 14 Fairly likely 22 Not very likely 27 Not at all likely 27 Don’t know 2 Not applicable/ Do not drive 8 Likely 36 Unlikely 54
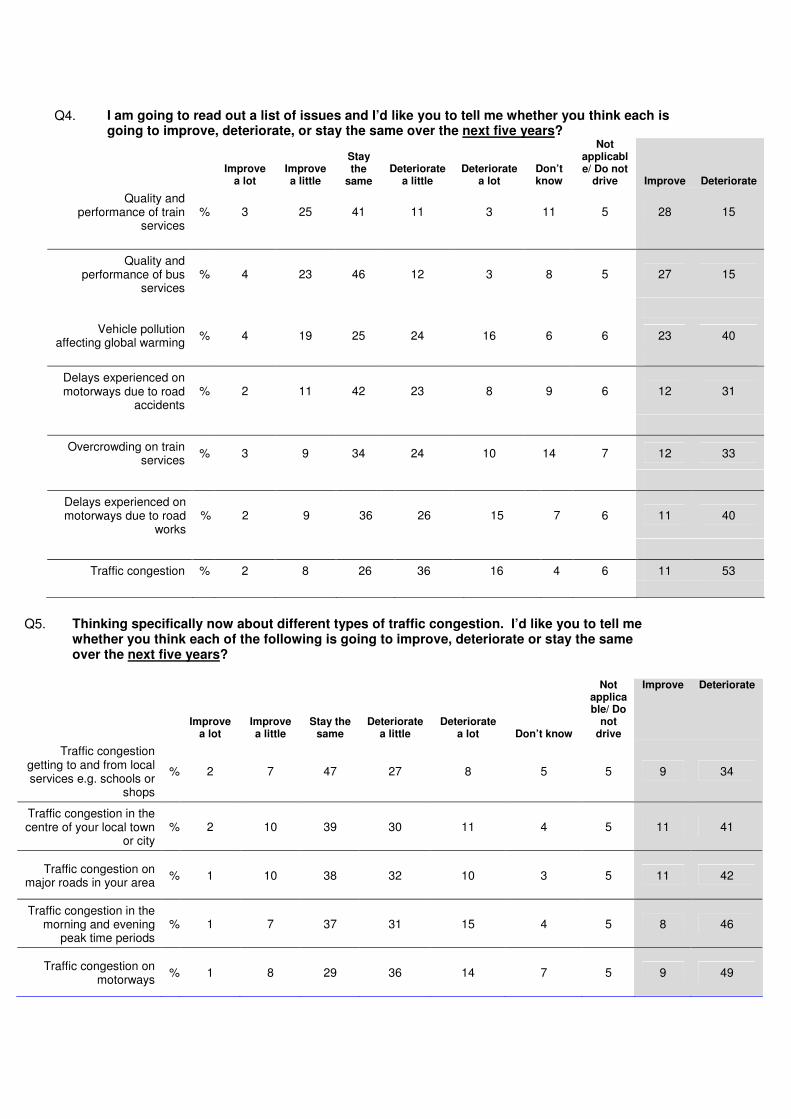
Q4. I am going to read out a list of issues and I’d like you to tell me whether you think each is
going to improve, deteriorate, or stay the same over the next five years?
Improve
a lot Improve a little
Stay the
same Deteriorate
a little Deteriorate
a lot Don’t know
Not applicable/ Do not
drive Improve Deteriorate
Quality and performance of train
services % 3 25 41 11 3 11 5 28 15
Quality and
performance of bus services
% 4 23 46 12 3 8 5 27 15
Vehicle pollution affecting global warming % 4 19 25 24 16 6 6 23 40
Delays experienced on motorways due to road
accidents % 2 11 42 23 8 9 6 12 31
Overcrowding on train services % 3 9 34 24 10 14 7 12 33
Delays experienced on motorways due to road
works % 2 9 36 26 15 7 6 11 40
Traffic congestion % 2 8 26 36 16 4 6 11 53
Q5. Thinking specifically now about different types of traffic congestion. I’d like you to tell me whether you think each of the following is going to improve, deteriorate or stay the same over the next five years?
Improve
a lot Improve a little
Stay the same
Deteriorate a little
Deteriorate a lot Don’t know
Not applicable/ Do
not drive
Improve Deteriorate
Traffic congestion getting to and from local services e.g. schools or
shops
% 2 7 47 27 8 5 5 9 34
Traffic congestion in the centre of your local town
or city % 2 10 39 30 11 4 5 11 41
Traffic congestion on major roads in your area % 1 10 38 32 10 3 5 11 42
Traffic congestion in the morning and evening
peak time periods % 1 7 37 31 15 4 5 8 46
Traffic congestion on motorways % 1 8 29 36 14 7 5 9 49
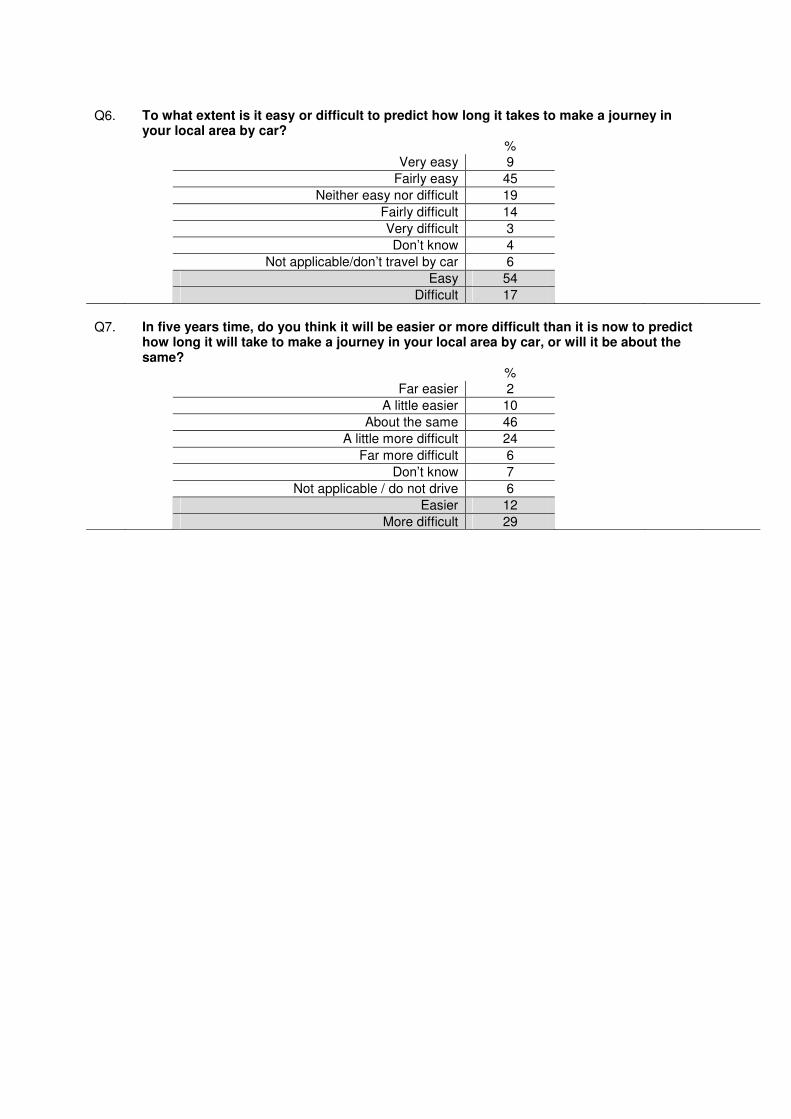
Q6. To what extent is it easy or difficult to predict how long it takes to make a journey in
your local area by car?
% Very easy 9 Fairly easy 45 Neither easy nor difficult 19 Fairly difficult 14 Very difficult 3 Don’t know 4 Not applicable/don’t travel by car 6 Easy 54 Difficult 17 Q7. In five years time, do you think it will be easier or more difficult than it is now to predict
how long it will take to make a journey in your local area by car, or will it be about the same?
% Far easier 2 A little easier 10 About the same 46 A little more difficult 24 Far more difficult 6 Don’t know 7 Not applicable / do not drive 6 Easier 12 More difficult 29

Q8. I’m now going to read out a list of possible transport policies for central and local government. Some people have said these could tackle the adverse effects of further traffic growth and increasing congestion over the next five years. I want you to tell me how strongly you would support or oppose each one.
Strongly support
Tend to support
Neither support
nor oppose
Tend to oppose
Strongly oppose
Don’t know
Not applicable/ Do
not drive Support Oppose
Increase the number and frequency of bus services % 31 41 16 4 1 3 4 72 5
Widen existing motorways where there is a lot of
congestion % 20 43 13 10 5 4 5 64 15
New tram systems in major towns and cities % 26 33 18 9 4 5 5 59 13
Changing motorway speed limits through the day
depending on levels of congestion
% 15 42 15 12 6 5 5 56 18
Driving on motorway hard shoulders when signs permit
during busy times % 12 31 11 19 15 6 5 43 34
Motorway tolling schemes operating at certain times of
the day, IF at the same there was a reduction in taxes
relating to driving
% 8 31 18 16 19 4 5 39 35
Charges being introduced for drivers who want to drive into the centre of large towns and
cities where there is major congestion, with the revenue generated solely being used
to make significant improvements in local
transport
% 12 25 14 20 20 3 5 38 40
Build more motorways % 11 22 20 25 14 4 5 33 39


