BusinessOnline - Automating PPT with Tableau Dashboards
28
January 2016 SD Tableau User Group Meeting Eric Ramos [email protected] https://www.linkedin.com/in/eramos42 Tableau Dashboards Are Not Enough! Automating PowerPoint with Tableau Visualizations to Layer in Actionable Insights
-
Upload
eric-ramos -
Category
Data & Analytics
-
view
531 -
download
0
Transcript of BusinessOnline - Automating PPT with Tableau Dashboards

January 2016
SD Tableau User Group Meeting
Eric [email protected]
https://www.linkedin.com/in/eramos42
Tableau Dashboards Are Not Enough!
Automating PowerPoint with Tableau
Visualizations to Layer in Actionable Insights
Agenda + About BusinessOnline
+ Empowering People to Utilize Reporting Tools
+ Dashboards with Actionable Insights
+ Demo
+ Other Resources

About Us+

4
/////////////////////////////////////////////////////////////////////////////////////////////////////////////////////////////////////////////////////////////////////
People with Deep “Data Driven” Expertise
Award Winning Digital Marketing Agency
Data Know-How + Channel Expertise = The “Holy Grail”
of marketing
metrics and insights
Business Analysts, Reporting
Engineers, Developers, Best-
in-class Technical Resources
+ Data Developers
+ Business Intelligence
Experts
+ Marketing Technologists
+ Display + Programmatic
+ Search
+ Retargeting
+ Social
+ Marketing Automation

5
/////////////////////////////////////////////////////////////////////////////////////////////////////////////////////////////////////////////////////////////////////
Technology Enabled Service Offering
Overview
We use market driven software to enable greater analysis & insights.
6
/////////////////////////////////////////////////////////////////////////////////////////////////////////////////////////////////////////////////////////////////////
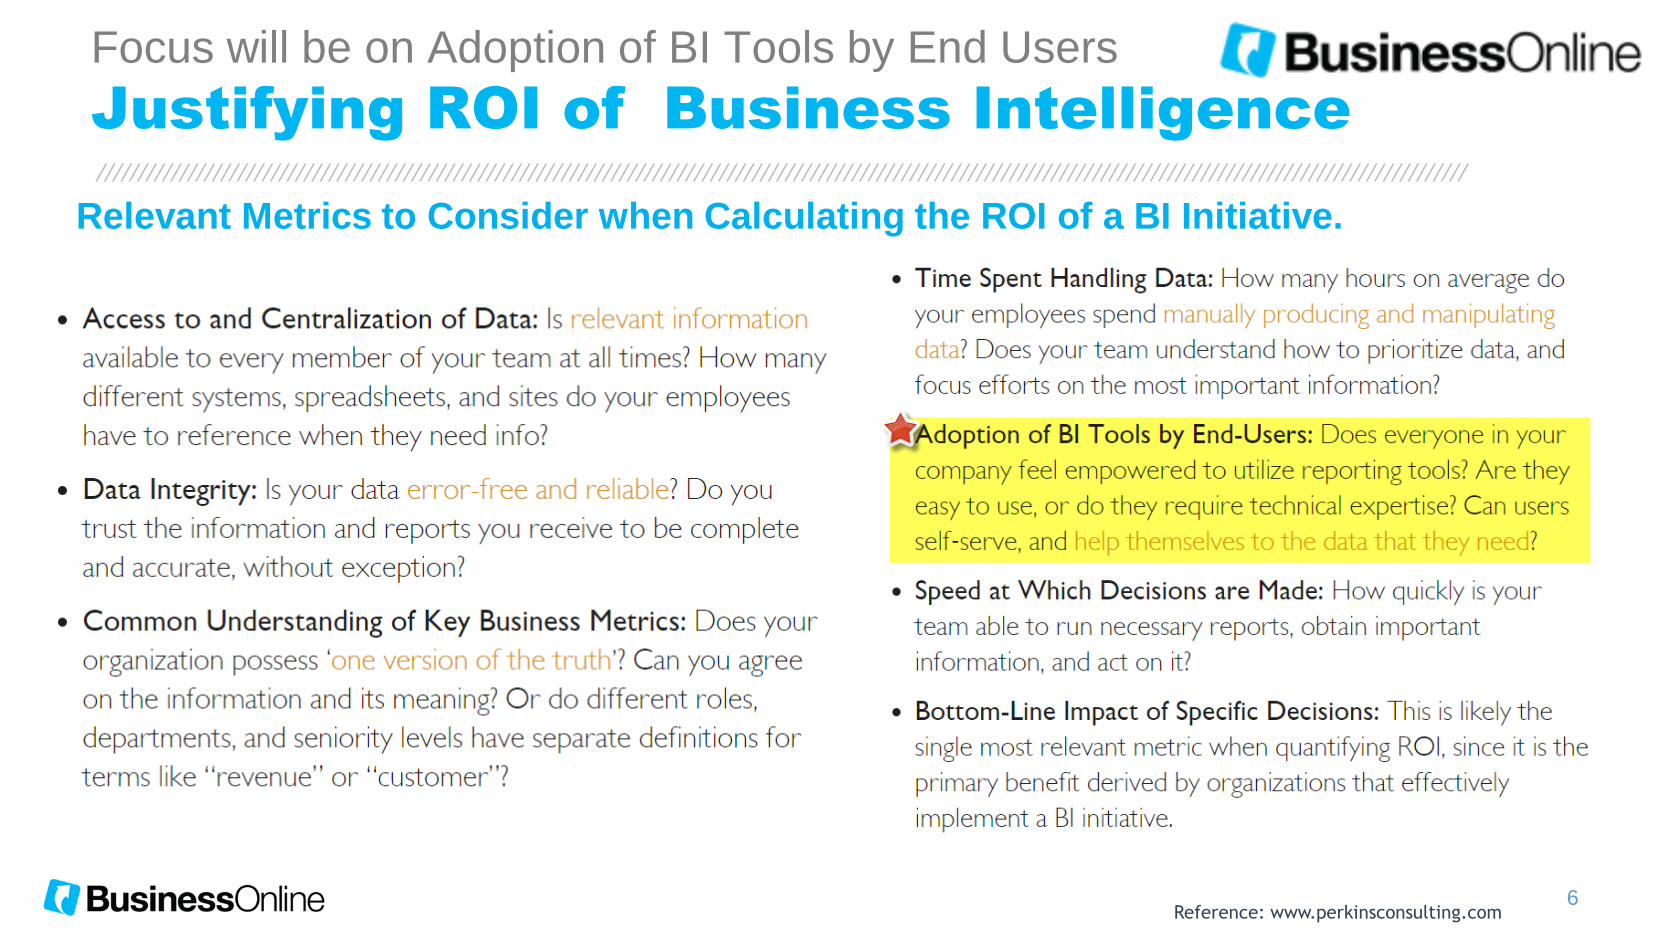
Justifying ROI of Business Intelligence
Focus will be on Adoption of BI Tools by End Users
Relevant Metrics to Consider when Calculating the ROI of a BI Initiative.
Reference: www.perkinsconsulting.com

Empowering People to
Utilize Reporting Tools +
8
/////////////////////////////////////////////////////////////////////////////////////////////////////////////////////////////////////////////////////////////////////
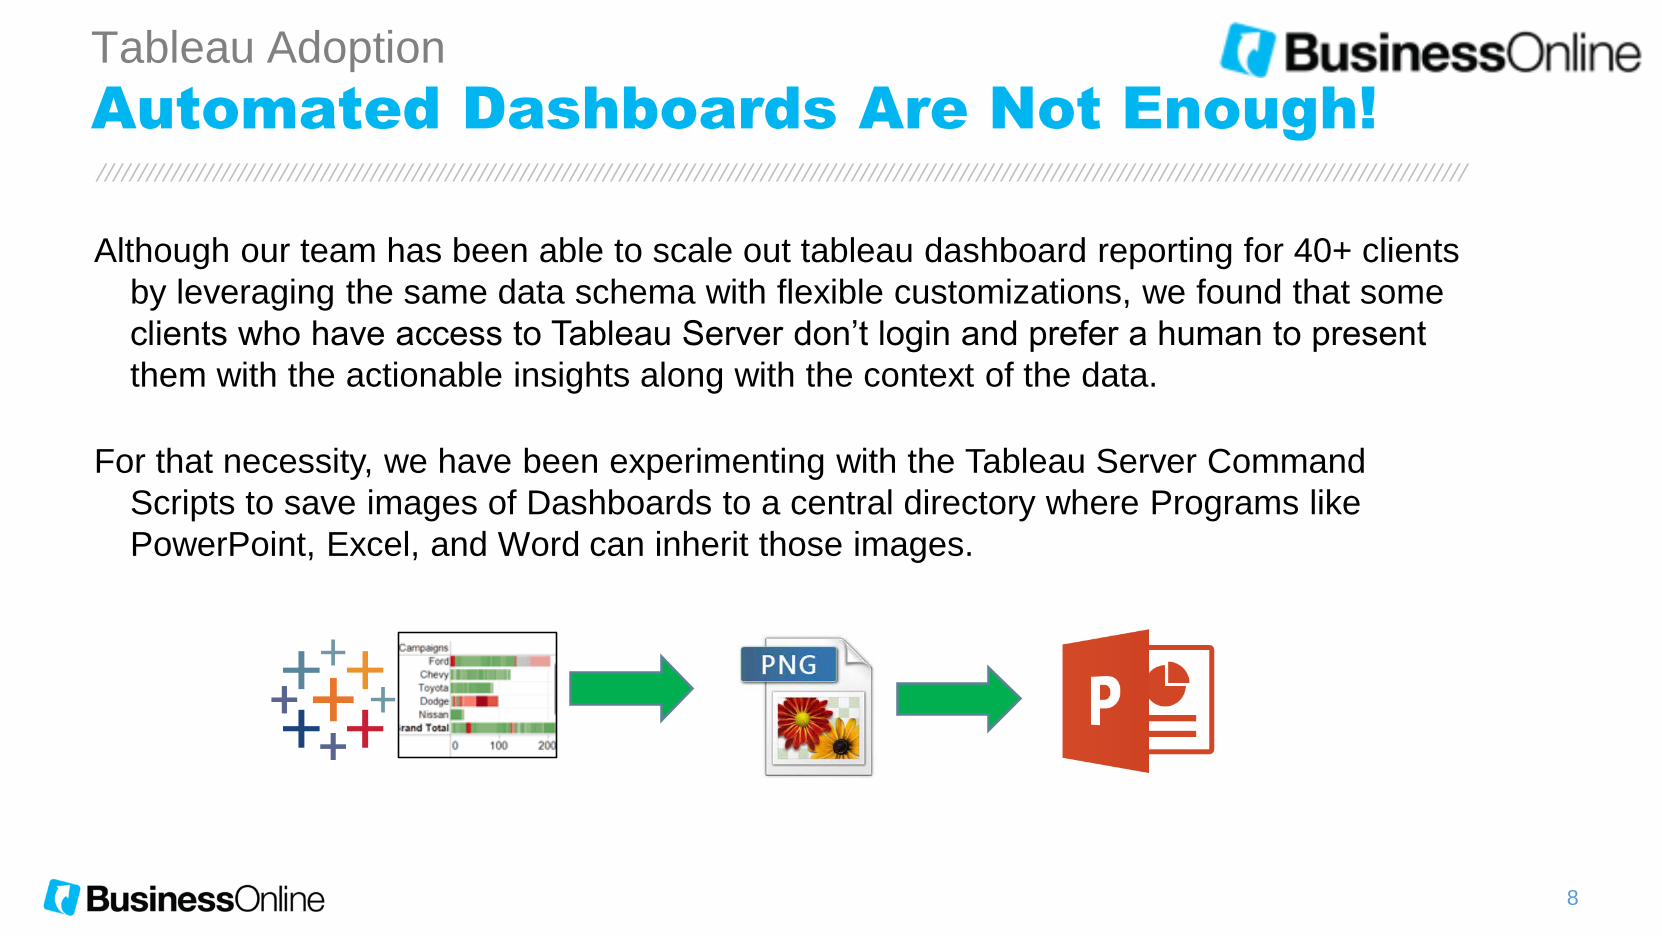
Automated Dashboards Are Not Enough!
Tableau Adoption
Although our team has been able to scale out tableau dashboard reporting for 40+ clients
by leveraging the same data schema with flexible customizations, we found that some
clients who have access to Tableau Server don’t login and prefer a human to present
them with the actionable insights along with the context of the data.
For that necessity, we have been experimenting with the Tableau Server Command
Scripts to save images of Dashboards to a central directory where Programs like
PowerPoint, Excel, and Word can inherit those images.

9
/////////////////////////////////////////////////////////////////////////////////////////////////////////////////////////////////////////////////////////////////////
Data with Actionable Context is Valuable
Summary
Humans are the catalyst in connecting the dots and driving actionable
recommendations.
By automating the Tableau Dashboards
with the tabcmd functionality, we can
layer in actionable context & insights to
empower people within the organization
to make better & faster decisions.

Dashboards with Actionable
Insights+

11
/////////////////////////////////////////////////////////////////////////////////////////////////////////////////////////////////////////////////////////////////////
Market Intelligence: Contextualizing Results Insights Example
GEO DASHBOARD
75% of the Worst performing markets are located in rural areas, with low population
density and where the client’s target audience
concentration is below 50%. For ALL markets that fit this criteria, reallocate budget to
best performing markets.
+ This external data layer (Public government data) help us understand why these markets are underperforming and enable us to make the necessary adjustments to optimize results
2
1+ The worst performing markets (identified in the previous slide) are displayed into a new bar chart, where we can contextualize their poor performance with an “external data layer”
12
/////////////////////////////////////////////////////////////////////////////////////////////////////////////////////////////////////////////////////////////////////
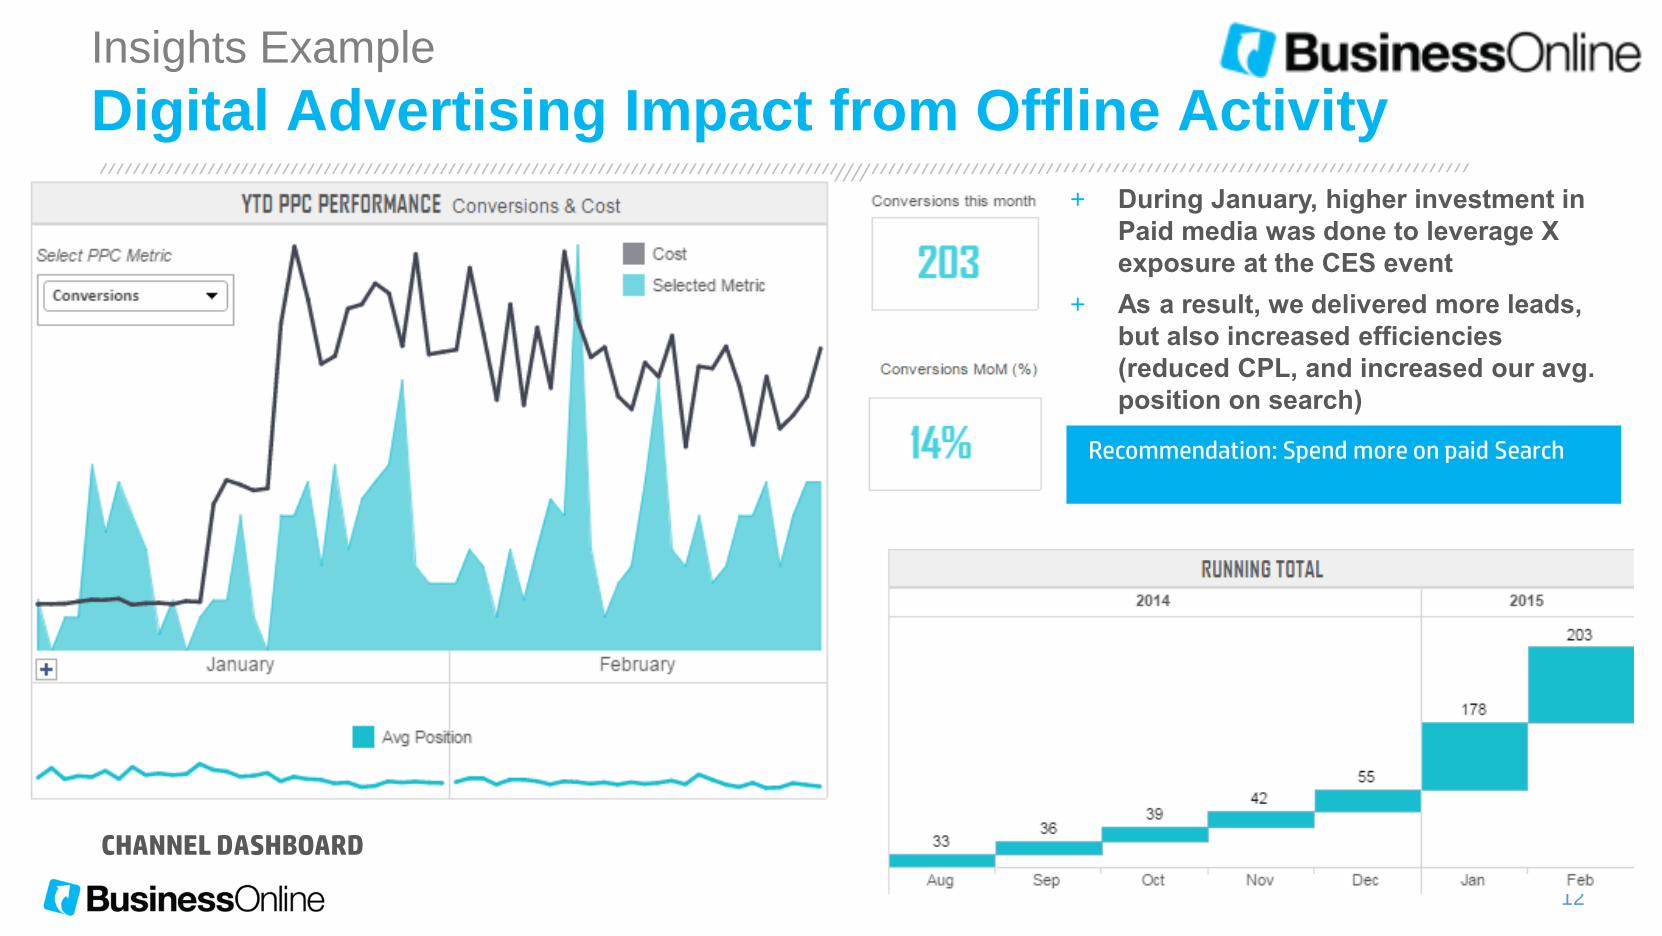
Digital Advertising Impact from Offline ActivityInsights Example
CHANNEL DASHBOARD
+ During January, higher investment in
Paid media was done to leverage X
exposure at the CES event
+ As a result, we delivered more leads,
but also increased efficiencies
(reduced CPL, and increased our avg.
position on search)
Recommendation: Spend more on paid Search
13
/////////////////////////////////////////////////////////////////////////////////////////////////////////////////////////////////////////////////////////////////////
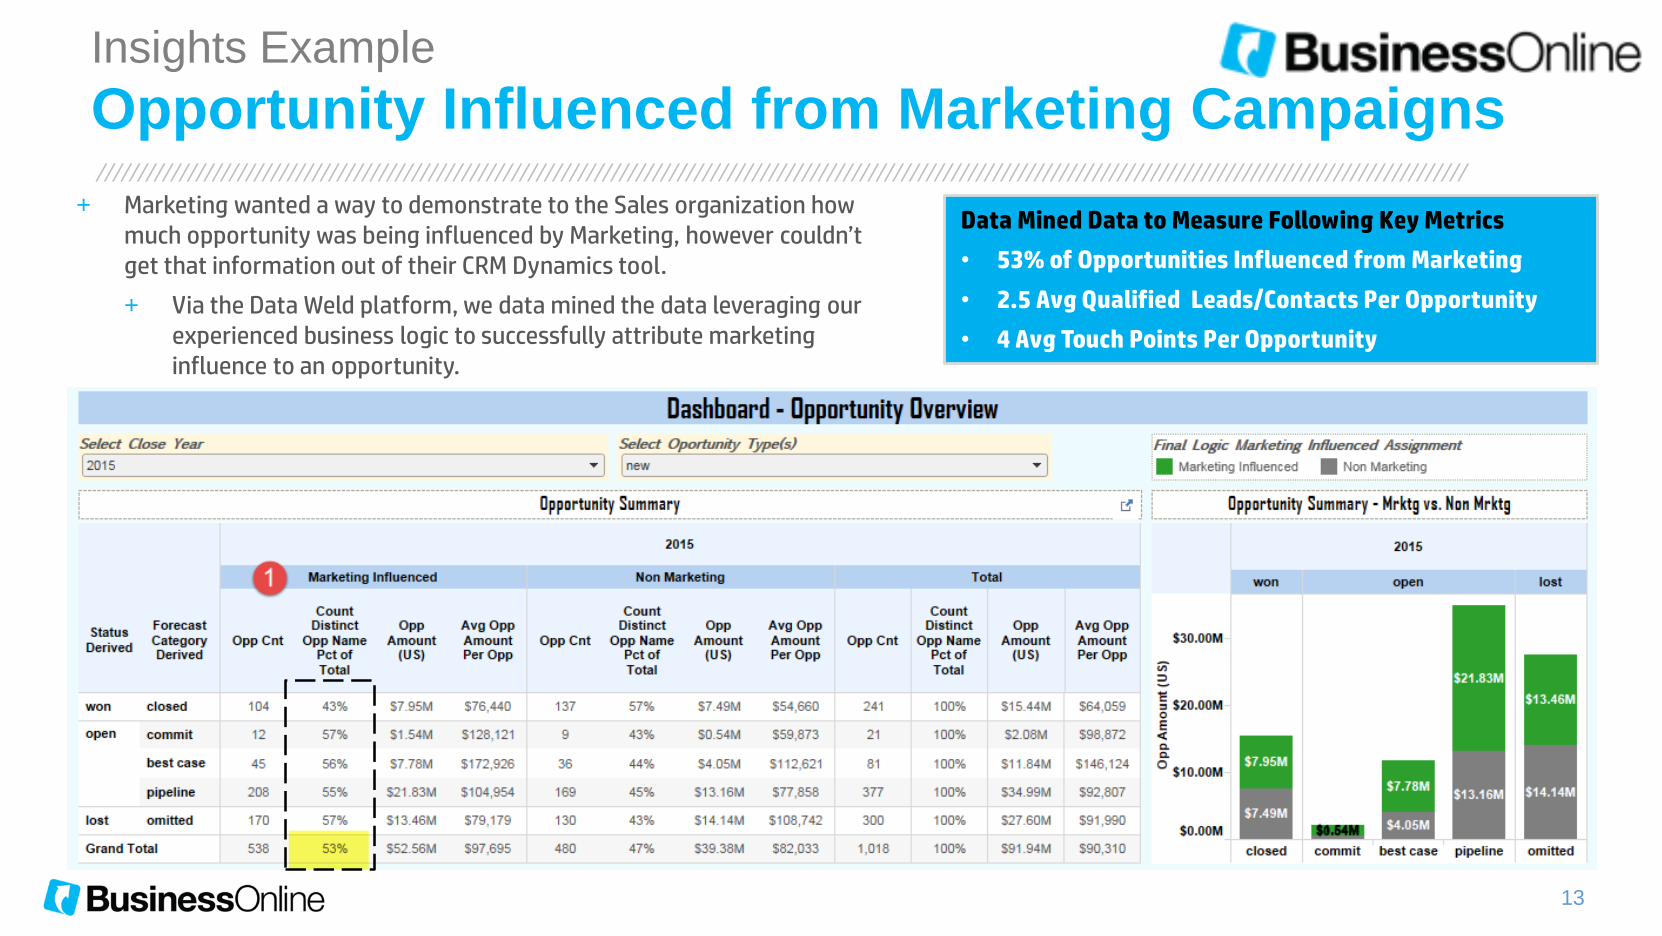
Opportunity Influenced from Marketing CampaignsInsights Example
Data Mined Data to Measure Following Key Metrics
• 53% of Opportunities Influenced from Marketing
• 2.5 Avg Qualified Leads/Contacts Per Opportunity
• 4 Avg Touch Points Per Opportunity
+ Marketing wanted a way to demonstrate to the Sales organization how much opportunity was being influenced by Marketing, however couldn’t get that information out of their CRM Dynamics tool.
+ Via the Data Weld platform, we data mined the data leveraging our experienced business logic to successfully attribute marketing influence to an opportunity.

14
/////////////////////////////////////////////////////////////////////////////////////////////////////////////////////////////////////////////////////////////////////
Geographic Market Investment ForecastInsights Example
+ Visual representation of the markets in a matrix with 2 variables: Bounce Rate (Engagement) and Conversion Rate (Ability to Convert). The Size of each bubble represents the volume of whatever metric was selected.
+ The markets with an above average Bounce Rate and below average Conversion Rate are highlighted in blue, in the top left quadrant of the matrix.
+ These “low” performing markets will be further analyzed to contextualize their poor performance and will be subject to optimizations.
GEO DASHBOARD
BOL was able to anticipate and accurately forecast thedecline in Sales and Web Leads before it happened, givingthe client the information needed for budget decisionmaking
18%
% of Bad performing markets
“Invest More” quadrant
“Need to optimize” quadrant

Demo+
16
/////////////////////////////////////////////////////////////////////////////////////////////////////////////////////////////////////////////////////////////////////
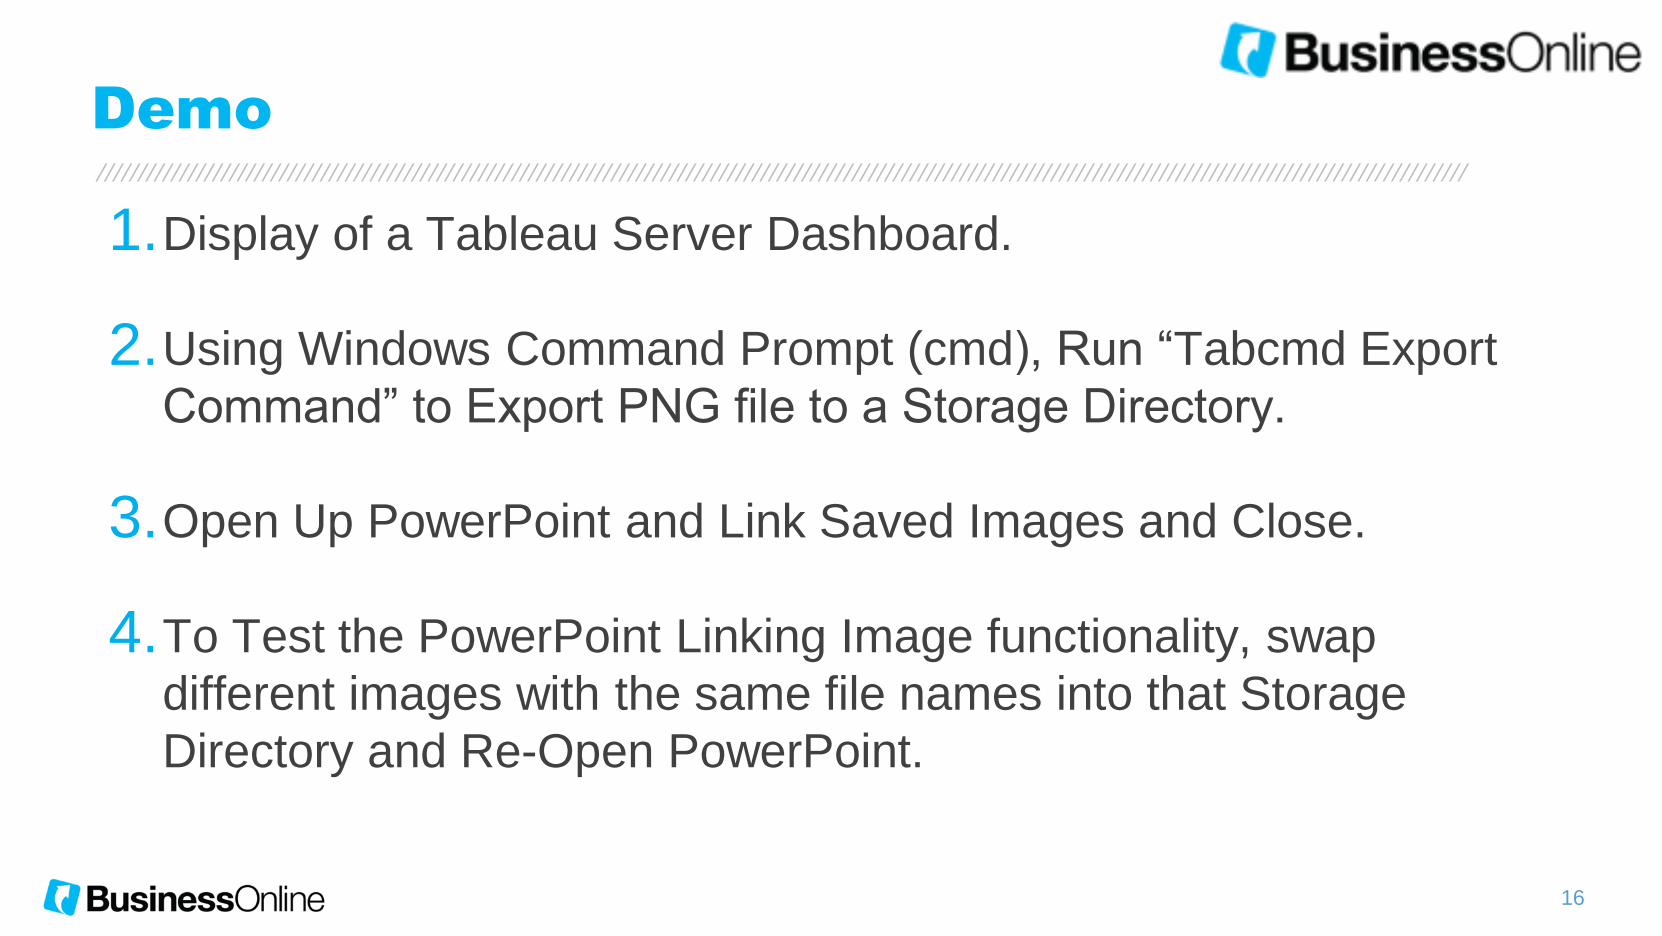
Demo
1.Display of a Tableau Server Dashboard.
2.Using Windows Command Prompt (cmd), Run “Tabcmd Export
Command” to Export PNG file to a Storage Directory.
3.Open Up PowerPoint and Link Saved Images and Close.
4.To Test the PowerPoint Linking Image functionality, swap
different images with the same file names into that Storage
Directory and Re-Open PowerPoint.

17
/////////////////////////////////////////////////////////////////////////////////////////////////////////////////////////////////////////////////////////////////////
Install tabcmd
Step 0
Reference: http://onlinehelp.tableau.com/current/online/en-us/tabcmd_install.htm

18
/////////////////////////////////////////////////////////////////////////////////////////////////////////////////////////////////////////////////////////////////////
Display Published Tableau Server Dashboard
Step 1

19
/////////////////////////////////////////////////////////////////////////////////////////////////////////////////////////////////////////////////////////////////////
Tabcmd command – export script
Step 2
Open up the command prompt.
Navigate and open the bash script file which contains something like the below.
Images will be saved to a location you choose from in the bash script file
20
/////////////////////////////////////////////////////////////////////////////////////////////////////////////////////////////////////////////////////////////////////
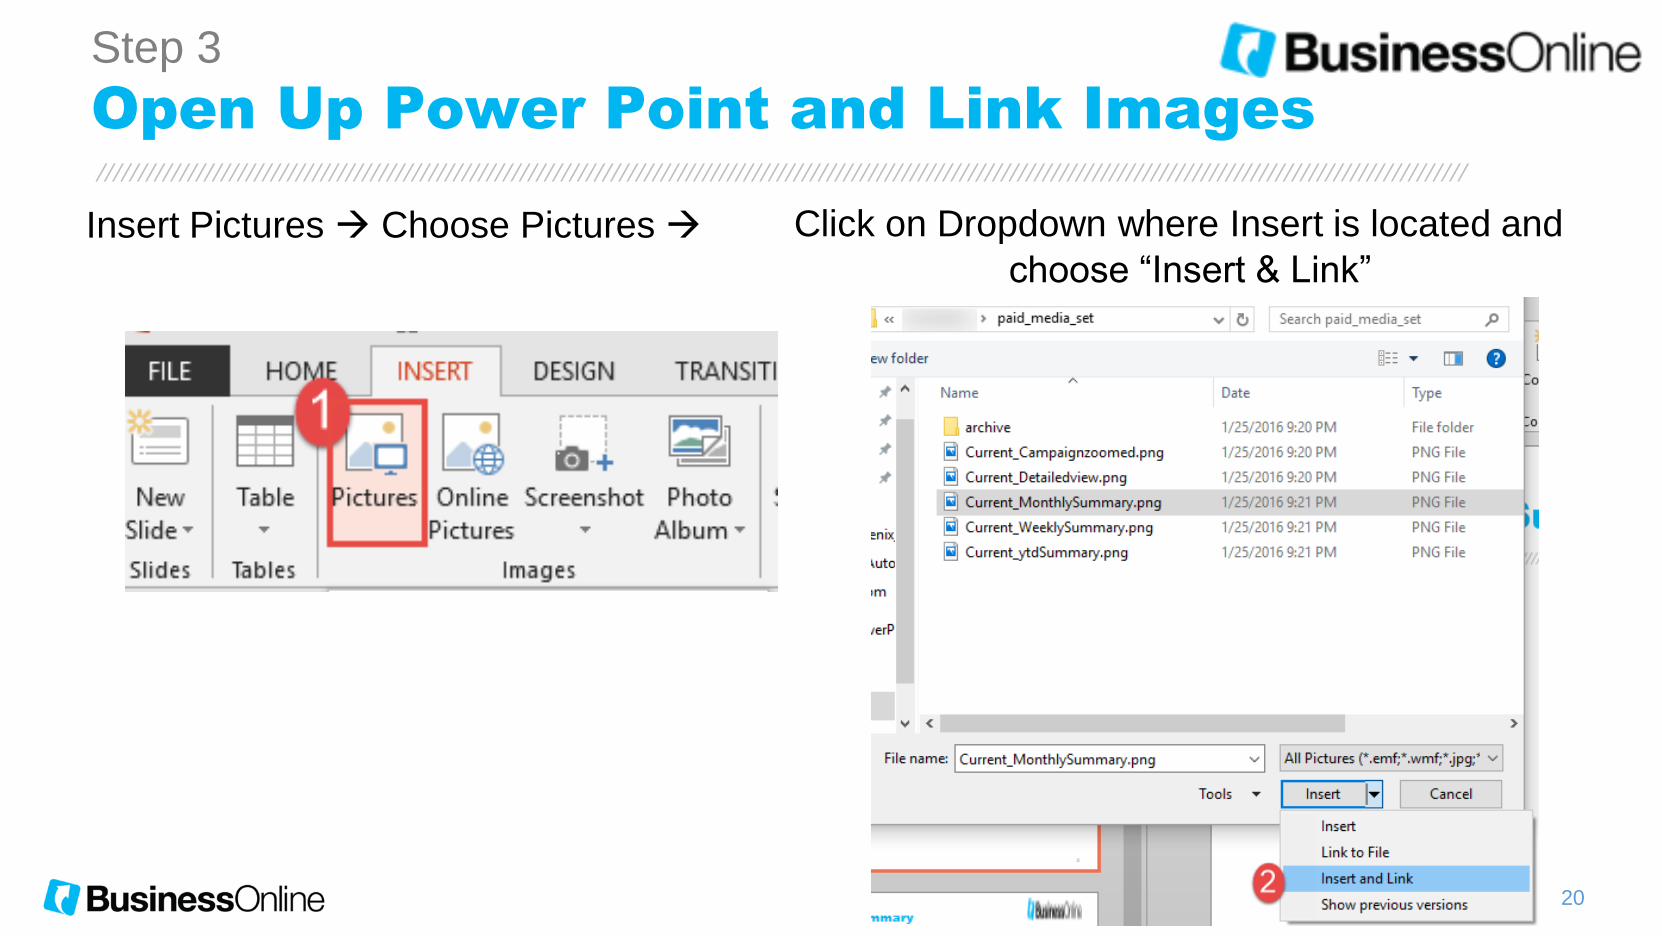
Open Up Power Point and Link Images
Step 3
Insert Pictures Choose Pictures Click on Dropdown where Insert is located and
choose “Insert & Link”
21
/////////////////////////////////////////////////////////////////////////////////////////////////////////////////////////////////////////////////////////////////////
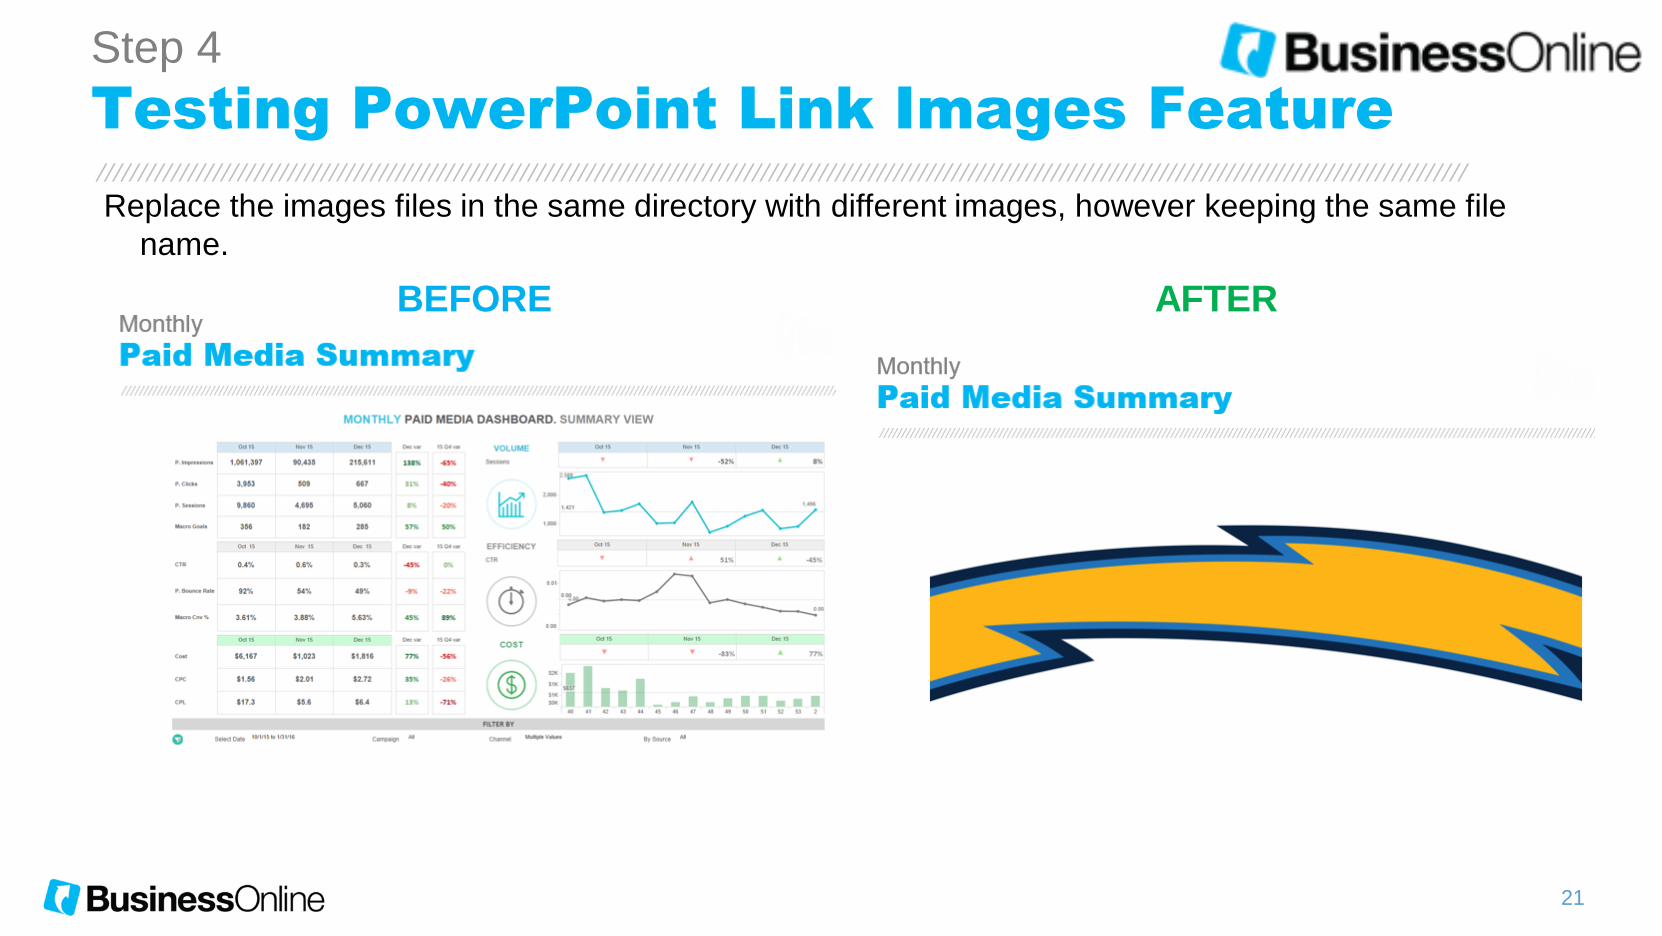
Testing PowerPoint Link Images Feature
Step 4
Replace the images files in the same directory with different images, however keeping the same file
name.
BEFORE AFTER
Other Resources+

23
/////////////////////////////////////////////////////////////////////////////////////////////////////////////////////////////////////////////////////////////////////
Tabcmd commands & examples
http://onlinehelp.tableau.com/current/server/en-
us/tabcmd_cmd.htm
http://kb.tableau.com/articles/knowledgebase/using
-tabcmd

24
/////////////////////////////////////////////////////////////////////////////////////////////////////////////////////////////////////////////////////////////////////
Tabcmd – additional export features
http://onlinehelp.tableau.com/current/server/en-us/tabcmd_cmd.htm#id7cb8d032-a4ff-43da-9990-15bdfe64bcd0

25
/////////////////////////////////////////////////////////////////////////////////////////////////////////////////////////////////////////////////////////////////////
Workbook Automation in Tableau’s Tabcmd
https://mliang1.wordpress.com/2013/06/23/workbo
ok-automation-in-tableaus-tabcmd/
https://www.interworks.com/blog/ktreadwell/2012
/09/07/automating-dashboard-delivery-using-
tabcmd

26
/////////////////////////////////////////////////////////////////////////////////////////////////////////////////////////////////////////////////////////////////////
PowerPoint Linking Images
http://www.indezine.com/products/powerpoint/learn/picturesandvisuals/2013/insert-or-link-picture.html

27
/////////////////////////////////////////////////////////////////////////////////////////////////////////////////////////////////////////////////////////////////////
BusinesOnline Contributors


![Welcome [tc18.tableau.com] · Tableau Server / Online • Web-based access to interactive dashboards • Collaboration features (limited) • Download dashboards as images/PDF •](https://static.fdocuments.in/doc/165x107/5ec552f600acf0544c22bcae/welcome-tc18-tableau-server-online-a-web-based-access-to-interactive-dashboards.jpg)