
Business update November 2017 - Bolsa de Madrid
19
1 TRADING UPDATE NOVEMBER 2017 Business update November 2017 Jardins de Castellarnau, Sabadell. Barcelona
Transcript of Business update November 2017 - Bolsa de Madrid

1 TRADING UPDATE NOVEMBER 2017
Business update
November 2017
Jardins de Castellarnau, Sabadell. Barcelona

2 TRADING UPDATE NOVEMBER 2017
This document has been prepared by Aedas Homes, S.A. (the “Company”) and comprises slides for a presentation to the market of the evolution of the business
activities of the Company and its subsidiaries (the “Group”) during the period running from 1st of March 2017 to 30th of November 2017. For the purposes of this
disclaimer, “Presentation” means this document, its contents or any part of it. This Presentation may not be copied, distributed, reproduced or passed on, directly
or indirectly, in whole or in part, or disclosed by any recipient to any other person, for any purpose other than the above.
The information contained in this Presentation does not constitute periodic financial information as defined in Royal Decree 1362/2007 of 19 October and is
voluntarily disclosed by the Company. The information contained in this Presentation does not purport to be comprehensive. In addition, the information and
opinions contained in this Presentation have not been independently verified by any third person. Accordingly, no representation or warranty, express or implied, is
made as to the truth, accuracy or completeness of the information in this Presentation. None of the Company, any of its subsidiaries, or any of their respective
directors, officers or employees accepts any responsibility or liability whatsoever for any loss howsoever arising from any use of this Presentation or otherwise
arising in connection therewith.
The information and opinions contained in this Presentation are provided as at the date of the Presentation and are subject to verification, correction, completion
and change without notice. In giving this Presentation, no obligation to amend, correct or update this Presentation or to provide the recipient with access to any
additional information that may arise in connection with it is undertaken.
This Presentation does not constitute or form part of, and should not be construed as, any offer to sell or issue or invitation to purchase or subscribe for, or any
solicitation of any offer to purchase or subscribe for, any securities of the Company in any jurisdiction, nor shall it or any part of it nor the fact of its distribution form
the basis of, or be relied on in connection with, any contract or investment decision. Any purchase of or subscription for securities of the Company should be
based solely on each investor’s own analysis of all public information, the assessment of risk involved and its own determination of the suitability of any such
investment. No reliance should be placed and no decision should be based on this Presentation.
Disclaimer
2

3 TRADING UPDATE NOVEMBER 2017
AEDAS HOMES SA, declared its intention to float (ITF) as of 22nd September
2017 and its shares started public negotiation as of 20th October 2017.
According to the market regulations, the Company is exempt from presenting
the standard quarterly information as of 30th September (Q3), as the
Prospectus was registered after 30th of September. Therefore the first quarter
to be reported by the Company will be the last quarter of 2017 (Q4).
The present note is a voluntary disclosure of the company to inform the market
in general and our investors in particular about the evolution of the ramp-up as
of 30th November.
The company plans to send a similar update for the month of December. After
that it will adjust back to the normal quarterly reporting calendar.
Preliminary Note
3
4 TRADING UPDATE NOVEMBER 2017
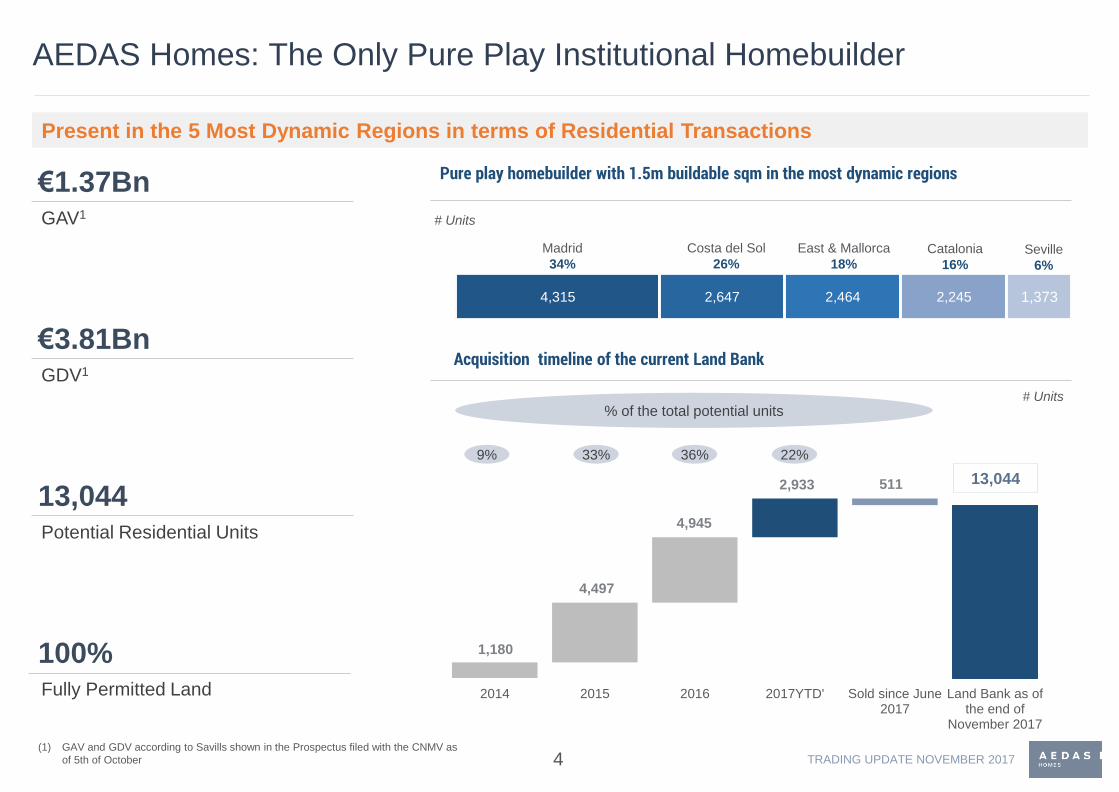
4,315 2,647 2,464 2,245 1,373
1,180
4,497
4,945
2,933 511
2014 2015 2016 2017YTD' Sold since June2017
Land Bank as ofthe end of
November 2017
AEDAS Homes: The Only Pure Play Institutional Homebuilder
Pure play homebuilder with 1.5m buildable sqm in the most dynamic regions
Acquisition timeline of the current Land Bank
13,044
Present in the 5 Most Dynamic Regions in terms of Residential Transactions
100%Fully Permitted Land
€1.37BnGAV1
€3.81BnGDV1
13,044Potential Residential Units
33%9% 22%36%
% of the total potential units # Units
4
Madrid
34%
Costa del Sol
26%
East & Mallorca
18%Catalonia
16%Seville
6%
# Units
(1) GAV and GDV according to Savills shown in the Prospectus filed with the CNMV as
of 5th of October

5 TRADING UPDATE NOVEMBER 2017
1,748
2,042
2,580
3,000 3,000 3,000 3,000
0
231
1,055
1,896
2,438
3,063
3,326
2017 2018 2019 2020 2021 2022 2023
Target Launches Target Deliveries
Business Plan 2017-2023: Summary
Sustainable Housing Development Plan (Units)
Launch
Run Rate+82%
Target launches and deliveries
covered with existing land portfolio
~€330-350kAverage Selling Price per Unit
~25%
Blended Net Development Margin
over the Business Plan 2017-2023
c. 12,000
Units to be delivered by the end of
2023
# Units
5
Delivery
Run Rate

6 TRADING UPDATE NOVEMBER 2017
Business Plan Progress as of 30th November 2017
Business Plan
Targets 2017 Y-End
Level of achievement
as of 30th NovemberCurrent status
# Projects Launched
# Units Launched
# Units pre-sold
Price Increase
# Projects under construction
# Units under construction
Land Acquisitions1 (# units)
34
1,748
845
11
583
416
35
1,773
832
15
758
865
(1) 2nd Half 2017
Overachieving all operating targets
6
0% 7%

7
TRADING UPDATE NOVEMBER 2017
TRADING UPDATE NOVEMBER 2017
1,419
1,773 1,7482
354
Up to October 2017 Up to November 2017 Total Launched as of theend of November 2017
Total Target Launches2017
Projects launched1 as of 30th November
28 7 35
Ramp-up activity of launched projects (by # of units)
#projects
7
101%Overachievement
7 new projects
launched in November
43% of launched
projects already
under construction
(1) A project is launched when marketing kicks off
(2) According to the Targets over the course of the 2017-2023 Business Plan. For additional
information, see the Prospectus filed with the CNMV as of 5th of October

8 TRADING UPDATE NOVEMBER 2017
322
355
262
2021,773
1,748 488
492
Launching Activity by Region
Madrid Costa
del SolEast &
MallorcaCataluña Seville
491
478
185
246
Target 2017
Launched by
November 2017
GDV1
Total Launched
2017 Total GDV
Breakdown by
Launches
32%
12%32%
16%8%
€722.6 Mn
8
# Units
€227.5Mn €85.1Mn €233.1Mn €60.0Mn
# Projects35 10 6 8 7 4
Successful strategy in all five regions
(1) Expected GDV before future price increase application
€116.9Mn

9 TRADING UPDATE NOVEMBER 2017
87
156
94
6249
49
119
119
March April May June July August September October November
11%
21%
31%
8%
Madrid Costa del
Sol
East &
MallorcaCataluña Seville
29%
832 845
Presales as of theend of November
2017
2017 PresalesTarget
Pre-sales Activity, Month by Month
Regional Presales
breakdown # Units
On track to beat pre-sales forecast for 2017: 832 Units sold up to November vs 845 2017 Business
Plan Target
Recovery to normal levels following low season
8
#projects
15 18 19 20 21 25 28 35
Offsetting Catalonian Crisis
Sustainable Evolution of Sales
85
Prior to March
12
Presales Achievement Vs Target
9

10 TRADING UPDATE NOVEMBER 2017
97
337
160
238832
Up to March 2017 Q2 2017 Q3 2017 Q4as of the end of November
2017
Total
Presales Evolution
Evolution of Presales by Quarter
# Units
35
Projects
Strong, stable pre-sales evolution in 2017 provides high visibility of deliveries in the years ahead
10

11 TRADING UPDATE NOVEMBER 2017
167
64
352
175758
Up to March 2017 Q2 2017 Q3 2017 Q4 as of the end ofNovember 2017
Total
11
15
Projects underconstruction as of theend of October 2017
Projects underconstruction as of theend of November 2017
311 143 129 125 50
Projects Under Construction
Quarterly Evolution of Construction Projects
758 Units
% Breakdown of Construction Projects by Region
66.2%
Under construction already
pre-sold
11
Beating targets: 4 new projects started construction in November
East & Mallorca
41%
Catalonia
19%
Seville
17%
Madrid
16%
Costa del Sol
7%
# Projects
2 1 8 4 15
Evolution of Projects since October
583 Units
12 TRADING UPDATE NOVEMBER 2017
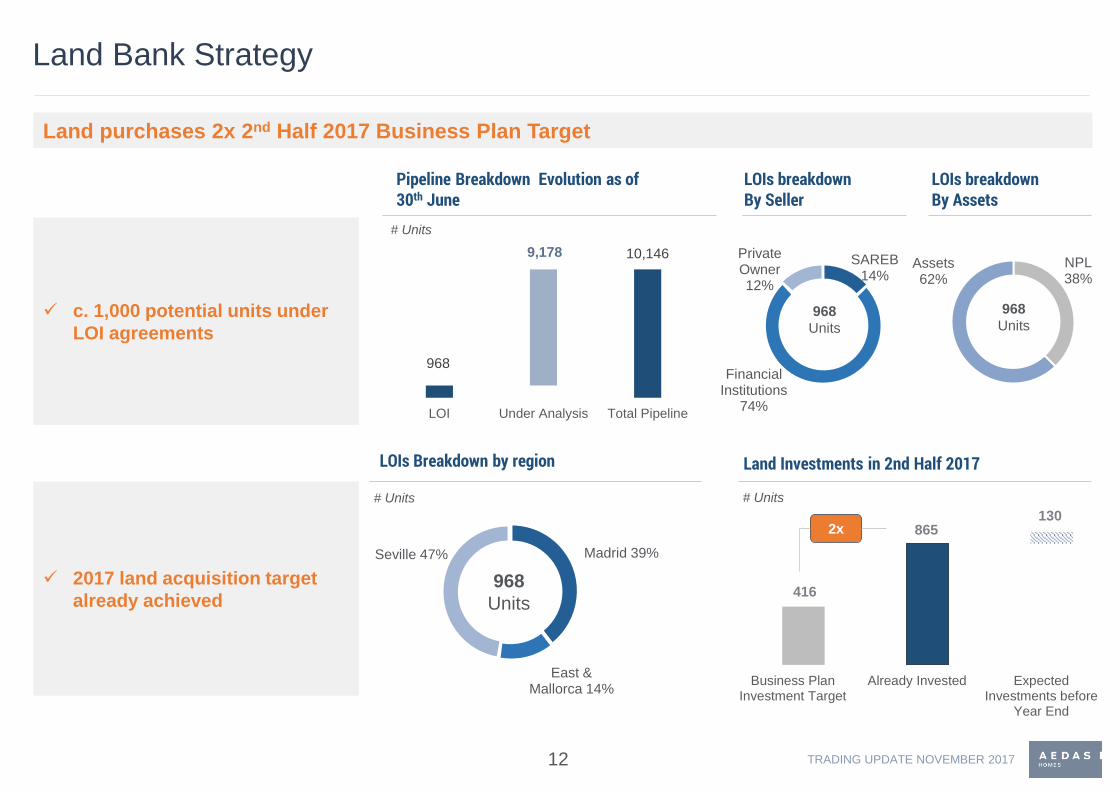
968
10,1469,178
LOI Under Analysis Total Pipeline
416
865130
Business PlanInvestment Target
Already Invested ExpectedInvestments before
Year End
NPL38%
Assets62%
Land Bank Strategy
Land Investments in 2nd Half 2017
# Units
LOIs Breakdown by region
Madrid 39%
East & Mallorca 14%
Seville 47%
968
Units
Pipeline Breakdown Evolution as of 30th June
LOIs breakdownBy Seller
LOIs breakdownBy Assets
SAREB14%
Financial Institutions
74%
Private Owner12%
968
Units
968
Units c. 1,000 potential units under
LOI agreements
2017 land acquisition target
already achieved
# Units
# Units
2x
Land purchases 2x 2nd Half 2017 Business Plan Target
12

13 TRADING UPDATE NOVEMBER 2017
355143
2,245
173
Launched In construction Potential Development
25
47
34
222
1216
15 173
April May June July Aug Sept Oct Nov Total
Progress in Catalonia
Monthly Pre-Sales
Maintained trading
levels during November
# Units# Units
551
194
April May June July Aug Sept Oct Nov
Leads Visits
Commercial KPIs – Leads - Visits
Ongoing projects
7 40
# Projects
2
c. 50%
11
locations
c. 50% of the launched
units already pre-sold
40 potential projects in
11 different locations
Minimal impact felt by the Catalonia crisis
13
Launched Pre-sold Under construction Potential Development Units
Total land bank including ongoing projectsUnder construction
# Units # Units # Units # Units
14 TRADING UPDATE NOVEMBER 2017
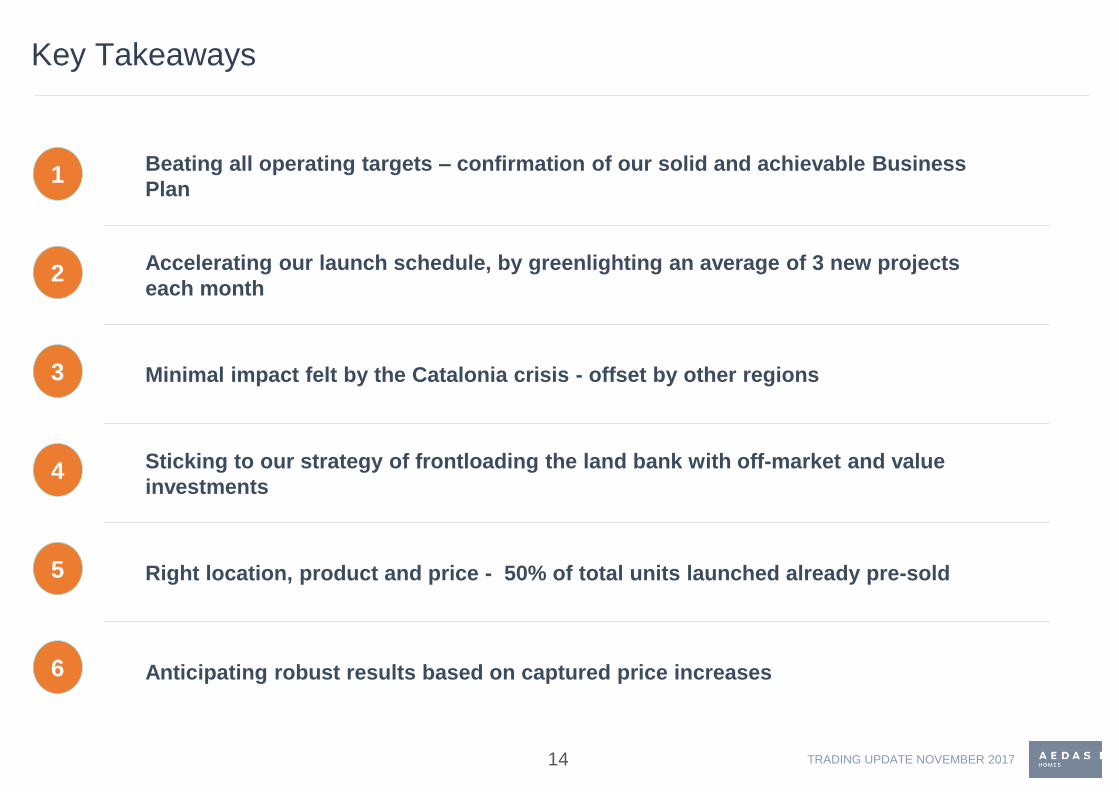
Key Takeaways
14
Beating all operating targets – confirmation of our solid and achievable Business
Plan
Accelerating our launch schedule, by greenlighting an average of 3 new projects
each month
Minimal impact felt by the Catalonia crisis - offset by other regions
Sticking to our strategy of frontloading the land bank with off-market and value
investments
Right location, product and price - 50% of total units launched already pre-sold
Anticipating robust results based on captured price increases
1
2
3
4
5
6

Appendix

16 TRADING UPDATE NOVEMBER 2017
Metrics compared to last month
Facebook followers evolution Website traffic
Traffic evolution in 2017 (sessions) Traffic by device,
gender and age
AEDAS Homes Digital Presence
30th Nov
8,396 followers
November 2017
114,212
Aug. 2017 Sept.2017 Oct.2017 Nov.2017
A sharp increase in online traffic and double the number of followers in less than three months
16

17 TRADING UPDATE NOVEMBER 2017
16.3%
0
5
10
15
20
25
30
Q1 2
001
Q4 2
001
Q3 2
002
Q2 2
003
Q1 2
004
Q4 2
004
Q3 2
005
Q2 2
006
Q1 2
007
Q4 2
007
Q3 2
008
Q2 2
009
Q1 2
010
Q4 2
010
Q3 2
011
Q2 2
012
Q1 2
013
Q4 2
013
Q3 2
014
Q2 2
015
Q1 2
016
Q4 2
016
Q3 2
017
Unemployment Rate
Source: INE, Bank of Spain
%
Real Estate Risk Indicators - Macro
1.15%
-6
-4
-2
0
2
4
6
8
ma
r.-0
6
sep.-
06
ma
r.-0
7
sep.-
07
ma
r.-0
8
sep.-
08
ma
r.-0
9
sep.-
09
ma
r.-1
0
sep.-
10
ma
r.-1
1
sep.-
11
ma
r.-1
2
sep.-
12
ma
r.-1
3
sep.-
13
ma
r.-1
4
sep.-
14
ma
r.-1
5
sep.-
15
ma
r.-1
6
sep.-
16
ma
r.-1
7
sep.-
17
Construction Costs
Source: Ministerio de Fomento, Spain
%
17

18 TRADING UPDATE NOVEMBER 2017
-1.2%
1.4%
3.2% 3.2% 3.1%
2.5%
0.0%
1.2%
2.0%1.8%
2.1%1.9%
2013
2014
2015
2016
2017E
2018E
-50
-40
-30
-20
-10
0
10
no
v.-
07
no
v.-
08
no
v.-
09
no
v.-
10
no
v.-
11
no
v.-
12
no
v.-
13
no
v.-
14
no
v.-
15
no
v.-
16
no
v.-
17
Real Estate Risk Indicators - Macro
Net Balance
Source: IMF
Spanish Consumer Confidence Index Positive Outlook for Spanish Economy (GDP)
YoY
Source: Ine, Bank of Spain
6.9x
34%
0
10
20
30
40
50
60
70
80
x
2x
4x
6x
8x
10x
jun.-
99
jun.-
01
jun.-
03
jun.-
05
jun.-
07
jun.-
09
jun.-
11
jun.-
13
jun.-
15
jun.-
17
House Price as Multiple of Annual Household Income
% Income Destined to Mortgage Payments
Affordability Ratios
Price/ Annual Income % Income to Mortgage
Positive Outlook for Spanish Economy
2.21%
58%
0
20
40
60
80
100
0
1
2
3
4
5
6
7
oct.-9
9
oct.-0
1
oct.-0
3
oct.-0
5
oct.-0
7
oct.-0
9
oct.-1
1
oct.-1
3
oct.-1
5
oct.-1
7
Cost of Mortgages % Mortgage Lending Over GDP
% Cost of Mortgage % Mortgage Lending
Source: Ine, Bank of Spain Source: Ine,
Bank of Spain18

19 TRADING UPDATE NOVEMBER 2017
Cabot. Madrid.


