Business travel and car rental – a long relationship ... · Business travel and car rental ......
14
Business travel and car rental – a long relationship coming to an end? September 2017
Transcript of Business travel and car rental – a long relationship ... · Business travel and car rental ......

Business travel and car rental – a long relationship coming to an end?
September 2017

- 2 -
This document has been produced by Nedrelid Corporate Advisory. The opinions included herein, all of which are based on information derived from selected and publicly available sources we believe to be reasonable, are entirely those the author. We do not guarantee neither the accuracy nor the completeness of the information included and nothing in this document shall be construed to be a representation of such a guarantee. Any opinions expressed reflect the current judgment of the author and are subject to change without notice. Nedrelid Corporate Advisory accepts no responsibility for any liability arising from the use of this document or its contents.

- 3 -
Business travel and car rental – a long relationship coming to an end? Changes in the use of mobility is not an exclusive B2C phenomenon, it is also starting to impact the world of business travel, thus becoming an issue the B2B segment. As new mobility offerings, most notably ride-hailing (Uber, Lyft etc) are increasingly becoming an accepted solution in corporate travel policies, the thesis is that traditional services used by business travelers, notably taxis and car rental, are, and will increasingly be, negatively impacted. While the case for a replacement of taxi-rides by ride-hailing is rather intuitive (they are essentially equivalent products with a different wrapping) based on an end-user price advantage of the latter, the case for why ride-hailing should be eating into the car rental sector is less obvious. Nevertheless, there is a general perception that ride-hailing operators are taking share at the expense of car rental operators, which begs the question whether the long relationship between business travel and car rental is coming to an end. The most frequently cited evidence used to show the growth new mobility services in business travel at the expense of historical mobility providers is the quarterly SpendSmart report published by the expense management solution provider Certify. The quarterly development in market share for various ground transportation providers, measured by expensed transactions, since Q1/2014 is summarized in Figure 1.
Figure 1 Business travel share by mode of transport
Source: Certify
The headline figure regarding ground transportation, i.e. market share of car rental, taxi and ride-hailing looks rather lopsided in favor of the latter if one looks at recent performance. However, looking at the available data from a different angle, one does get some alternative insights into the actual situation. As confirmed in Figure 2, which represents an extract from the 2016 SpendSmart report, market share calculations are based on expensed transactions.
http://www.travelpulse.com/news/car-rental-and-rail/uber-lyft-are-killing-taxis-and-rental-cars.html
- 4 -
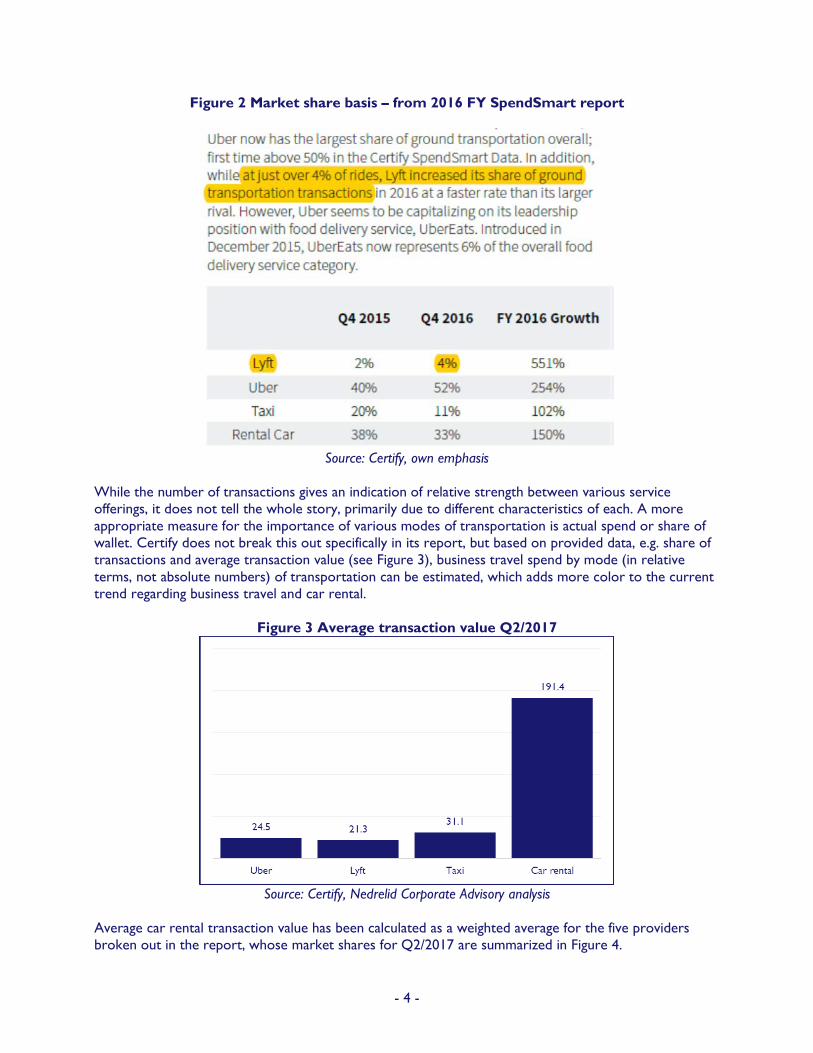
Figure 2 Market share basis – from 2016 FY SpendSmart report
Source: Certify, own emphasis
While the number of transactions gives an indication of relative strength between various service offerings, it does not tell the whole story, primarily due to different characteristics of each. A more appropriate measure for the importance of various modes of transportation is actual spend or share of wallet. Certify does not break this out specifically in its report, but based on provided data, e.g. share of transactions and average transaction value (see Figure 3), business travel spend by mode (in relative terms, not absolute numbers) of transportation can be estimated, which adds more color to the current trend regarding business travel and car rental.
Figure 3 Average transaction value Q2/2017
Source: Certify, Nedrelid Corporate Advisory analysis
Average car rental transaction value has been calculated as a weighted average for the five providers broken out in the report, whose market shares for Q2/2017 are summarized in Figure 4.

- 5 -
Figure 4 Car rental transaction data Q2/2017
Source: Certify, Nedrelid Corporate Advisory analysis
Excluding a quarter of transactions from the calculation of average transaction size is not a significant issue in this case. The arithmetic average transaction value using this methodology was very close to the figures provided by Certify in their annual summaries, being 190.15 vs 190.74 reported in 2016 and 184.32 vs 186.42 reported in 2015, and accordingly represents a good proxy. Based on the available data, the estimated market share, measured by share of wallet, for Q2/2017 is seen in Figure 5.
Figure 5 Ground transportation share of wallet Q2/2017
Source: Certify, Nedrelid Corporate Advisory analysis
This represents a significantly different picture than the transaction-based market share seen in Figure 6.

- 6 -
Figure 6 Ground transportation market share by transactions Q2/2017
Source: Certify, Nedrelid Corporate Advisory analysis
As seen in Figure 1, ride-hailing has been steadily taking share from both taxis and car rental since 2015. Is this also the case with regards to share of wallet? Figure 7 shows estimated share of wallet in Q1/2015 and Figure 8 shows the change, both in share of transactions and share of spend, from Q1/2015 to Q2/2017.
Figure 7 Ground transportation share of wallet Q1/2015
Source: Certify, Nedrelid Corporate Advisory analysis
- 7 -
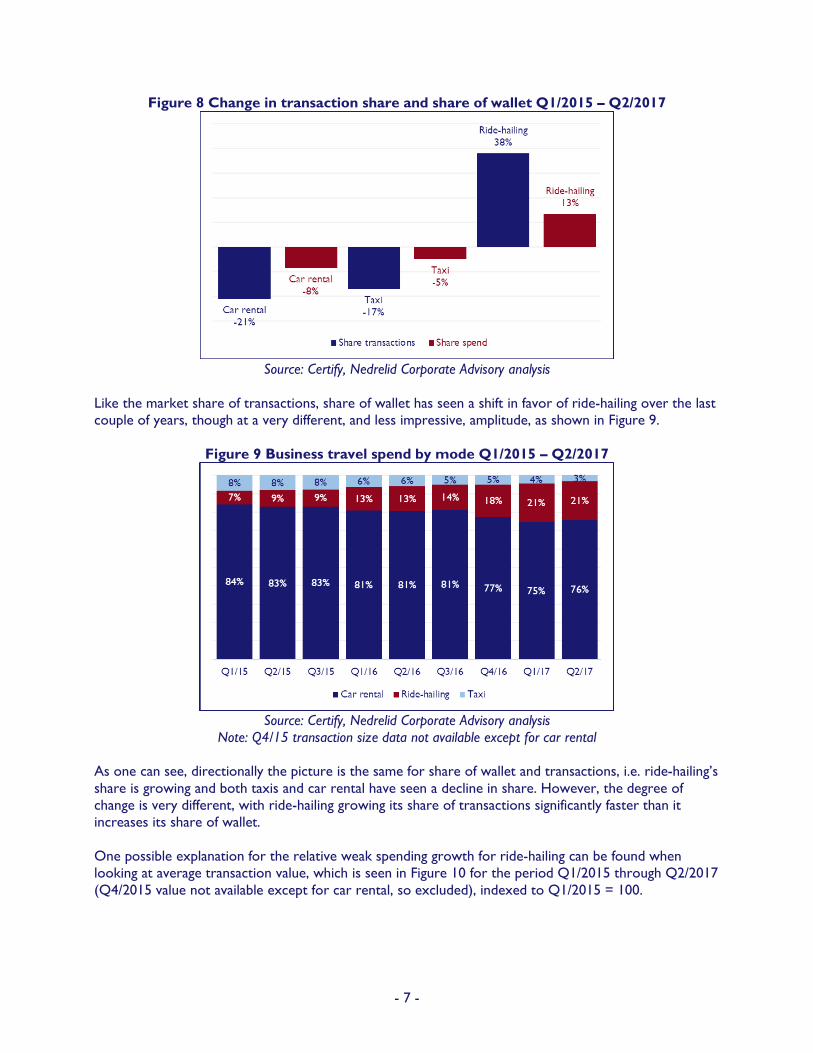
Figure 8 Change in transaction share and share of wallet Q1/2015 – Q2/2017
Source: Certify, Nedrelid Corporate Advisory analysis
Like the market share of transactions, share of wallet has seen a shift in favor of ride-hailing over the last couple of years, though at a very different, and less impressive, amplitude, as shown in Figure 9.
Figure 9 Business travel spend by mode Q1/2015 – Q2/2017
Source: Certify, Nedrelid Corporate Advisory analysis
Note: Q4/15 transaction size data not available except for car rental As one can see, directionally the picture is the same for share of wallet and transactions, i.e. ride-hailing’s share is growing and both taxis and car rental have seen a decline in share. However, the degree of change is very different, with ride-hailing growing its share of transactions significantly faster than it increases its share of wallet. One possible explanation for the relative weak spending growth for ride-hailing can be found when looking at average transaction value, which is seen in Figure 10 for the period Q1/2015 through Q2/2017 (Q4/2015 value not available except for car rental, so excluded), indexed to Q1/2015 = 100.

- 8 -
Figure 10 Average transaction size Q1/2015 – Q2/2017
Source: Certify, Nedrelid Corporate Advisory analysis
Note: Q4/15 average transaction values for ride-hailing and taxi not available What one sees is that while average transaction size for car rental companies is trending slightly upwards and taxi fares held steady throughout 2016, the average spend per ride-hailing transactions has declined significantly (though there was an increase in Q4/ 2016 and Q1/2017). Both Uber and Lyft have a proven history of price cuts, the objective being to increase the attractiveness of its service and grow volume, so this is not a surprise. The corollary is that while undercutting taxis on prices takes market share from these, it also tightens the price differential with other modes of transport potentially used by business travelers, e.g. public transportation such as buses, metros and trains, making ride-hailing a palatable alternative for budget conscious travelers willing (or able) to pay a minor “comfort premium”. If this is the case, growing market share in rides would in part come from growing the pie with ride-hailers taking the bulk of this rather than simply “stealing” existing business from car rental companies (in a previous article the market share impact of a shift in mode with a “fixed” number of clients was considered), particularly as these alternative modes mentioned are not covered as ground transportation options by Certify. As explained above, the battle between car rental and ride-hailing is not black and white, there are certainly shades of grey (maybe not 50…) to the story. What do the car rental operators themselves say? Figure 11 summarizes recent segment trends for the major listed operators (Avis Budget, Europcar, Hertz and Sixt) and as one immediately sees, the corporate segment is declining in relative importance for them all.

- 9 -
Figure 11 Corporate segment by operator
Sources: Company filings
This does not, however, necessarily imply that business travelers are shunning car rental for its mobility needs. Rather, it reflects an overall market trend where the leisure segment is outgrowing the corporate segment, as seen in Figure 12 and Figure 13, which show segment breakdown in the 5 main European markets (France, Germany, the UK, Spain and Italy) in euros and relative size.
Figure 12 European market by segment (€B) – Top-5 EU markets
Source: Europcar IPO-filing document

- 10 -
Figure 13 European market by segment – Top-5 EU markets
Source: Europcar IPO-filing document, Nedrelid Corporate Advisory analysis
The five countries upon which this data is based make up +/- 70% of the total European car rental market and can thus be considered representative, at least for the European context. If one looks at the US car rental market, available data does not suggest a market in distress, as the US car rental market has grown significantly in recent years as seen in Figure 14. I do not have segment data for the US market, but it does seem reasonable to assume that growth has not been exclusively driven by the leisure segment. Thus, it seems fair to assume that the corporate segment of the US car rental market has grown rather than contracted in recent years.
Figure 14 US car rental market size ($B)
Source: Auto Rental News
Further, the sentiment that Uber is crushing the car rental sector is to a large degree based on Hertz operating and share price performance in recent years. Avis Budget, the other listed US major, has also seen operational and valuation challenges, though to a lesser degree than its peer, which has added to a negative industry sentiment.

- 11 -
Figure 15 3-year share price performance – Hertz and Avis Budget vs S&P 500
Source: Capital IQ
What is often forgotten is that these two, despite their globally recognized brands, are not the market leaders, neither in their home market nor internationally. To illustrate this point, Enterprise Holdings, which includes the brands Enterprise, National and Alamo, is larger than Hertz and Avis Budget combined in the US car rental market (see Figure 16) and it has taken significant share in the last few years.
Figure 16 Market share US car rental market
Source: Auto Rental News
As seen in Figure 14, the US car rental market has gone through a period of sustained growth, though all operators have not been able to take advantage of the positive market dynamics.

- 12 -
Figure 17 US car rental revenue development – 2013 = 100
Sources: company filings, Auto Rental News, Nedrelid Corporate Advisory analysis
Hertz US has seen a decline in revenue since 2013, whereas Avis Budget, after a strong 2014, has seen stagnating revenue. The big winner has been Enterprise, who between 2013 and 2016 saw an estimated (company is private and only discloses consolidated revenue numbers for all underlying business and geographical divisions combined) revenue growth of almost 30%. The trend of Enterprise taking market share is also evident in the Certify data, where National and Enterprise are respectively #1 and #2. Avis, in particular, has lost market share recently, going from #1 to #4 between Q1/2013 and Q2/2017, whereas Hertz remains #3 with stable market share throughout the aforementioned period, as summarized in Figure 18.
Figure 18 Car rental market share for business travel
Source: Certify
There is, accordingly, evidence that the overall car rental market is doing quite well revenue and growth-wise and that predicting the probable demise of an entire industry based on one company’s performance seems premature. What are the takeaways from the above? While it is irrefutable that ride-hailing operators are growing fast, the latest quarterly figures from Uber confirm this, the evidence of this being at the expense of car

- 13 -
rental seems more circumstantial than based on real, concrete evidence. The global press picks up on the headline figures in Figure 1 that ride-hailing has overtaken taxis and car rental in terms business travel ground transportation, which obviously makes a nice story, i.e. how Mobility 1.0 is being outmaneuvered and made irrelevant by Mobility 2.0. However, as explained, the picture is more nuanced than what this one chart shows. A further issue is to what degree share is shifting or whether the pie is growing with various segments experiencing different growth rates. Certify’s summary report for 2016 sheds some light on this and makes for interesting reading, as seen in Figure 19.
Figure 19 2016 transaction growth Y/Y
Source: Certify, own emphasis
Whereas the strong growth rates for Uber and Lyft are consistent and coherent with the overall message conveyed on ground transportation in the SpendSmart reports, it is clearly worthwhile noting the growth rates for taxis and car rental transactions. Both categories more than doubled in size during 2016, which can quite possibly serve as a testament of the positive development experienced by Certify itself. There is little doubt that ride-hailing is becoming an accepted solution in corporate travel policies and that it is gaining ground and popularity with business travelers. At the same time, the assertion that ride-hailing is beating car rental as the preferred option for business travelers is based on one metric from one expense management provider and it is not necessarily backed up by macro-level, industry data. Finally, car rental operators are indirectly benefiting from the growth in ride-hailing the trough fleet supply partnerships. To conclude, all things considered it seems somewhat premature to claim that car rental is getting blown out of the water by ride-hailing companies. Based on share of wallet, which is the ultimate metric for market share, car rental still represents a significantly more important mode of ground transportation than ride-hailing. Further, the different characteristics of the offerings make them complementary, which means that they can co-exist. As such, whereas there are indeed alternatives, business travel and car rental still maintain a strong and solid relationship in this day and age. Nicolay Nedrelid is Founder & Corporate advisor at Nedrelid Corporate Advisory, an independent advisory and consulting boutique focused on the car rental industry based in Geneva, Switzerland. Feel free to reach out by e-mail or by phone on +41 79 782 4996.

About us Nedrelid Corporate Advisory is an independent advisory and consulting boutique based in Geneva, Switzerland. Our service offering is targeted at car rental industry participants and our ambition is to be the consultant of choice to current and prospective operators and other industry stakeholders.
Chemin des Papillons 18
P.O. Box 565 1215 Geneva Switzerland
Phone: +41 79 782 4996 Mail: [email protected] Web: www.nedrelid-ca.com
September 2017 © Nedrelid Corporate Advisory