Business Tendency Survey
23
Statistics Jersey: www.gov.je/statistics Business Tendency Survey June 2020 Statistics Jersey Business Tendency Survey – June 2020 1 Introduction The Jersey Business Tendency Survey (BTS) was launched in September 2009 to provide qualitative information about the Island’s economy in a timely manner. The survey provides a set of ten qualitative indicators. There are: eight current indicators: these are measures of current performance relative to that of three months previously (rather than absolute measures of performance) two future indicators: these measure anticipated change over the next three months Detailed definitions of the indicators are provided in the glossary. For each indicator a net balance is calculated, defined as the difference between the proportion of businesses reporting an increase in a particular measure and the proportion reporting a decrease. Note that figures in this report are rounded independently; therefore, an indicator’s balance may differ by up to one percentage point from the difference between stated percentages. The survey is run quarterly and most comparisons are made with the previous four rounds of the survey. However, the survey did not take place in June 2016 or September 2016; therefore, comparisons with previous years are made without reference to this period. Recent response rates for the hotels, restaurants and bars sector (i.e. hospitality) are now judged to be sufficient to include explicitly in the report. Business Tendency Survey reports for the last few years did not separate out this sector, which was included in the “other non-finance” sector. The appendix of this report contains data tables for the hotels, restaurants and bars sector and the other non-finance sector both excluding and including hotels, restaurants and bars. Context: COVID-19 In response to the COVID-19 pandemic and associated economic consequences, additional questions were included in the June 2020 round of the survey in order to measure some of these consequences. These questions are analysed in the annex at the end of the report. The glossary includes definitions for some of the new concepts covered in the COVID-19 annex Summary for the Business Tendency Survey in June 2020 Business activity indicator the headline all-sector business activity indicator was extremely negative, at -62 percentage points (pp); this means the proportion of businesses reporting an increase was 62 pp lower than those reporting a decrease o the business activity indicator was negative for the finance sector (-21 pp) and was extremely negative for the non-finance sector (-80 pp) o this indicator recorded its lowest level to date, overall and for both finance and non-finance o the business activity indicator decreased significantly over the three months to June, overall and for both finance and non-finance, with each decrease being the largest recorded to date
Transcript of Business Tendency Survey

Statistics Jersey: www.gov.je/statistics
Business Tendency Survey
June 2020
Statistics Jersey Business Tendency Survey – June 2020 1
Introduction
The Jersey Business Tendency Survey (BTS) was launched in September 2009 to provide qualitative information about the Island’s economy in a timely manner.
The survey provides a set of ten qualitative indicators. There are:
eight current indicators: these are measures of current performance relative to that of three
months previously (rather than absolute measures of performance)
two future indicators: these measure anticipated change over the next three months
Detailed definitions of the indicators are provided in the glossary.
For each indicator a net balance is calculated, defined as the difference between the proportion of businesses reporting an increase in a particular measure and the proportion reporting a decrease. Note that figures in this report are rounded independently; therefore, an indicator’s balance may differ by up to one percentage point from the difference between stated percentages.
The survey is run quarterly and most comparisons are made with the previous four rounds of the survey. However, the survey did not take place in June 2016 or September 2016; therefore, comparisons with previous years are made without reference to this period.
Recent response rates for the hotels, restaurants and bars sector (i.e. hospitality) are now judged to be sufficient to include explicitly in the report. Business Tendency Survey reports for the last few years did not separate out this sector, which was included in the “other non-finance” sector. The appendix of this report contains data tables for the hotels, restaurants and bars sector and the other non-finance sector both excluding and including hotels, restaurants and bars.
Context: COVID-19
In response to the COVID-19 pandemic and associated economic consequences, additional questions were included in the June 2020 round of the survey in order to measure some of these consequences. These questions are analysed in the annex at the end of the report. The glossary includes definitions for some of the new concepts covered in the COVID-19 annex
Summary for the Business Tendency Survey in June 2020
Business activity indicator
the headline all-sector business activity indicator was extremely negative, at -62 percentage points (pp); this means the proportion of businesses reporting an increase was 62 pp lower than those reporting a decrease
o the business activity indicator was negative for the finance sector (-21 pp) and was extremely negative for the non-finance sector (-80 pp)
o this indicator recorded its lowest level to date, overall and for both finance and non-finance
o the business activity indicator decreased significantly over the three months to June, overall and for both finance and non-finance, with each decrease being the largest recorded to date

Statistics Jersey: www.gov.je/statistics
Business Tendency Survey
June 2020
Statistics Jersey Business Tendency Survey – June 2020 2
Current indicators
six of the eight current indicators were significantly negative, and none were significantly positive
o for the finance sector, there were four negative indicators, one positive indicator, and three indicators within 10 pp of zero
o for the non-finance sector, seven of the eight current indicators were negative, and one was within 10 pp of zero
the overall picture was significantly more negative than last quarter; seven current indicators decreased significantly and one (input costs) improved significantly
o the finance sector was more negative than in March 2020 in three current indicators, more positive in one (input costs), and four indicators changed by less than 10 pp
o the non-finance sector was more negative than last quarter in seven current indicators, and more positive in one indicator (input costs)
six of the eight current indicators recorded their lowest levels to date, three of which were more than 20 pp below the previous recorded respective minima
Current situation: COVID-19
the turnover indicator was extremely negative at -75 pp
the actively working indicator was extremely negative at -51 pp
the most commonly cited workforce measure taken in response to COVID-19 was to enrol in the government Co-Funded Payroll Scheme
Next quarter – the three months to September 2020
the outlook for future business activity was negative (-14 pp) overall, and the indicator was strongly negative for finance (-32 pp) and within 10 pp of zero for non-finance (-6 pp)
o the overall future business activity indicator was slightly more positive than 3 months ago, up 9 pp from the lowest recorded level of -23 pp in March 2020
the overall future employment outlook was within 10 pp of zero (-7 pp), as it was for finance (+8 pp), while it was negative for non-finance (-13 pp)
o the future employment indicator was down 9 pp from last quarter overall, and was down 8 pp for both finance and non-finance
2020 – Finance sector expectations
the employment expectations indicator for 2020 was negative (-19 pp)
o the balance for this indicator was the lowest recorded to date, the first negative recorded, and was 43 pp lower than in June 2019
the profit expectations indicator for 2020 was strongly negative (-30 pp); 62% of finance companies anticipated a decrease in profits in 2020, compared to 32% that anticipated an increase
o the expected profits indicator was also the lowest recorded to date, the first negative balance recorded, and was 85 pp lower than in June 2019
Statistics Jersey Business Tendency Survey – June 2020 3
Section 1: Current situation
Business activity
The headline indicator is business activity, which is a measure of the total amount of work undertaken by businesses operating in Jersey. The type of business activity will be specific to each sector of business; for example turnover, number of products produced, or chargeable hours. Detailed definitions for this indicator and others can be found in the glossary.
In June 2020, the all-sector business activity indicator was extremely negative, with a value of -62 percentage points (pp). An increase in business activity was reported by 10% of businesses, compared with 72% that reported a decline; the difference in the unrounded figures results in a net balance of -62 pp, which provides the value of the indicator. The remaining 18% of companies reported that business activity was unchanged; see Figure 1.1. Figure 1.1 – Business activity, June 2020
Figure 1.2 – Business activity, time series
* The net balance is the difference between the proportion of companies reporting an increase and those reporting a decrease. The net balance and individual percentages are rounded independently, and therefore the percentages may not sum to the balance.
The business activity indicator was negative for the finance sector (-21 pp) and extremely negative for the non-finance sector (-80 pp). The overall business activity indicator was significantly lower than in the previous quarter, down 51 pp – the largest change recorded for this indicator. Similarly, the indicator decreased by 38 pp for finance and 56 pp for non-finance, both being the largest recorded changes; see Figure 1.2.
Within the non-finance sector, all respondents in the hotels, restaurants and bars sector reported lower business activity in June 2020, resulting in an indicator value of -100 pp for this sector. The business activity indicator was extremely negative for construction (-92 pp) and wholesale and retail (-79 pp), and strongly negative (-49 pp) for other non-finance sectors. See the appendix for further sectoral breakdown.
The all sector business activity indicator had been positive from June 2014 until December 2019, making March 2020 the first time this indicator has not been positive for six years. The current balance of -62 pp was 37 pp below the previous lowest level recorded of -25 pp in March 2012, and was 74 pp below the three-year average of +12 pp.
In June 2020, the indicator was also at its lowest recorded levels to date for both the finance and non-finance sectors, -21 pp and -80 pp, respectively. The finance sector was 16 pp below its previous minimum of -5 pp (March 2012), and was 47 pp below its three-year average of +26 pp. The non-finance sector was 49 pp below its previous minimum of -31 pp (March 2012), and 86 pp below its three-year average of +6 pp.
Figure 1.1 – Business activity, June 2020 Compared with situation three months previously
Figure 1.2 – Business activity, time series June 2019 – June 2020 (percentage points)
10%
18%
6%
18%
42%
8%
72%
40%
86%
All sectors
Finance
Non-finance
Increase Same Decrease Balance*
- 62 pp
- 21 pp
- 80 pp
-62
-21
-80-100
-50
0
50
All Sector Finance Non-finance
Balance* Jun-19 Sep-19 Dec-19 Mar-20 Jun-20

Statistics Jersey Business Tendency Survey – June 2020 4
Current indicators
In June 2020, six out of the eight all-sector indicators relating to the current situation were significantly negative, the other two were within 10 pp of zero; see Figure 2.1. A positive balance indicates that a greater proportion of companies reported increases than decreases, and conversely for a negative balance, while an indicator is significant if it has a balance of at least ±10 pp. For five of the eight current indicators, the most common response was negative, while ‘no change’ was the most common response for the other three.
Four of the eight current indicators had extremely negative balances, below -50 pp: profitability (-70 pp), business activity (-62 pp), new business (-58 pp) and business optimism (-51 pp). Prior to June 2020, the only overall indicator recorded to have an extremely positive or negative balance was the input costs indicator, which was -50 pp or lower in half of the rounds between December 2016 and March 2020. Thus, June 2020 marks the first occasion that there have been multiple indicators with such large balances.
Two current indicators were strongly negative, with balances between -25 pp and -49 pp: capacity utilisation (-40 pp) and employment (-34 pp).
The remaining two indicators, input costs1 and the product prices, were both within 10 pp of zero, at -9 pp and -3 pp, respectively. The input costs indicator was at its highest recorded level, and for the first time was not significantly negative. For this indicator, a negative balance indicates that more businesses have seen input costs increase than decrease.
Figure 2.1 – All-sector indicators, comparing current situation (June 2020) to three months previously
* The net balance is the difference between the proportion of companies reporting an increase and those reporting a decrease. For input costs, a negative balance indicates that more businesses have seen input costs increase than decrease.
The balance of significantly positive indicators with significantly negative indicators (-6) was lower than the three-year mean for the period to March 2020 (1.2) and was the lowest balance of significant indicators recorded since June 2013. However, looking at the balance of extreme indicators (at least +50 pp or -50 pp), the recorded balance has always been either 0 or -1 until the current quarter, when it was -4.
1 Input costs relate to the prices paid for supplies, purchases, wages and salaries etc.. See the glossary for more detail.
10%
11%
14%
21%
10%
5%
6%
9%
18%
21%
31%
66%
77%
20%
53%
30%
72%
69%
54%
12%
13%
75%
40%
60%
Business activity
New business
Capacity utilisation
Input costs
Product prices
Profitability
Employment
Business optimism
Increase No change Decrease
- 58 pp
- 9 pp
- 70 pp
- 34 pp
- 51 pp
- 40 pp
Balance*
- 3 pp
- 62 pp
Statistics Jersey Business Tendency Survey – June 2020 5
Figure 2.2 shows the eight current indicators for June 2020 against those of the previous four quarters.
Figure 2.2 – All-sector current indicators, time series June 2019 – June 2020
In June 2020, all of the six significantly negative current indicators were at their lowest levels recorded to date, with three of these being more than 20 pp below their previous respective minimum. In contrast, the input costs indicator was at its highest level recorded to date, 10 pp higher than its previous maximum of -19 pp in September 2015.
Since the previous quarter, seven of the eight current indicators decreased significantly, and the other indicator (input costs) increased significantly. The largest change was seen in the business activity indicator, which declined by 51 pp. There were strong quarterly declines of at least 25 pp in new business (down 45 pp), profitability (down 41 pp), employment (down 30 pp), and capacity utilisation (down 29 pp). The business optimism and product prices indicators decreased significantly, down 21 pp and 13 pp respectively. In comparison, the input costs indicator increased by 31 pp from -40 pp to -9 pp.
Every current indicator was significantly different to its three-year average; seven of the eight current indicators were more than 20 pp below their three-year average, with inputs costs being the exception at 38 pp higher than its three-year average. The biggest departures from the three-year means were seen in business activity (down 74 pp), new business (down 68 pp), profitability (down 60 pp), and business optimism (down 54 pp).
Finance sector
In June 2020 the finance industry had four negative current indicators, one positive indicator, and three indicators within 10 pp of zero; see Figure 3.1. An indicator is described as positive or negative if it has a balance of at least ±10 pp.
The only positive indicator was capacity utilisation (+13 pp). The negative indicators were profitability and new business (both -36 pp), business optimism (-35 pp), and business activity (-21 pp). Other indicators were within ten percentage points of zero.
The balance of positive indicators with negative indicators (-3) was lower than the three-year mean for the period up to March 2020 for finance (+3.0).
-62 -58
-40
-9 -3
-70
-34
-51
-80
-60
-40
-20
0
20
40
Businessactivity
Newbusiness
Capacityutilisation
Inputcosts
Productprices
Profitability Employment Businessoptimism
Balance Jun-19 Sep-19 Dec-19 Mar-20 Jun-20

Statistics Jersey Business Tendency Survey – June 2020 6
Figure 3.1 – Finance sector indicators, comparing current situation (June 2020) to three months previously
* The net balance is the difference between the proportion of companies reporting an increase and those reporting a decrease. For input costs, a negative balance indicates that more businesses have seen input costs increase than decrease.
Figure 3.2 illustrates that there were four changes of at least 10 pp since last quarter, three of which were decreases and the other was an increase. The indicators that saw large quarterly decreases were: new business (down 47 pp), business activity (down 38 pp), and profitability (down 17 pp). The only indicator to improve was input costs, which increased strongly by 26 pp.
Figure 3.2 – Finance sector current indicators, time series June 2019 – June 2020
The four current indicators with balances below -20 pp were each the lowest recorded to date for the finance sector in these indicators. In contrast, the input costs indicator was at the highest it has been since December 2014, when it was -2 pp.
Five of the eight current indicators were at least 10 pp below their three-year averages: new business (down 56 pp), business activity and profitability (both down 47 pp), business optimism (down 46 pp), and employment (down 25 pp). Input costs was the only indicator significantly above its three-year mean (up 21 pp), while product prices and capacity utilisation were not significantly different from their three-year averages.
18%
15%
28%
15%
14%
13%
13%
15%
42%
33%
58%
76%
74%
38%
68%
35%
40%
52%
14%
9%
12%
49%
20%
50%
Business activity
New business
Capacity utilisation
Input costs
Product prices
Profitability
Employment
Business optimism
Increase No change Decrease
- 36 pp
- 6 pp
- 36 pp
- 7 pp
- 35 pp
+13 pp
+ 1 pp
- 21 pp
Balance*
-21
-36
13
-6
1
-36
-7
-35
-60
-40
-20
0
20
40
Businessactivity
Newbusiness
Capacityutilisation
Inputcosts
Productprices
Profitability Employment Businessoptimism
Balance Jun-19 Sep-19 Dec-19 Mar-20 Jun-20
Statistics Jersey Business Tendency Survey – June 2020 7
Non-finance sector
For the non-finance sector, seven out of the eight indicators for the current situation were negative in June 2020, with the exception being product prices, which was within 10 pp of zero; see Figure 4.1.
Figure 4.1 – Non-finance sector indicators, comparing current situation (June 2020) to three months previously
* The net balance is the difference between the proportion of companies reporting an increase and those reporting a decrease. For input costs, the balance indicates that more businesses have seen input costs increase than decrease.
Five of the eight current indicators were extremely negative, with balances of at least -50 pp: profitability (-85 pp), business activity (-80 pp), new business (-68 pp), capacity utilisation (-64 pp), and business optimism (-58 pp). Employment was strongly negative (-46 pp). All six of these indicators were at their lowest recorded levels and significantly below their previous minima.
The input costs indicator is usually the most negative indicator, but was among the least negative at -10 pp.
Among the sub-sectors, hotels, restaurants and bars was extremely negative in six indicators, construction in five, wholesale and retail in four, and other non-finance in one indicator. Hotels, restaurants and bars was significantly negative in all eight current indicators, while all other sub-sectors were significantly negative in seven of the eight current indicators.
For the non-finance sector overall, seven of the eight current indicators decreased significantly since the previous quarter, with the exception being the input costs indicator, which increased significantly; see Figure 4.2. This pattern was reported in every sub-sector. Looking at the non-finance sector overall, the seven quarterly decreases were: business activity down 56 pp, profitability down 51 pp, capacity utilisation down 45 pp, new business down 44 pp, employment down 39 pp, business optimism down 27 pp, and product prices down 23 pp. The inputs costs indicator was up 34 pp. These are the largest quarterly changes recorded to date. See the appendix for detailed breakdowns by size and sector.
Comparing with the three-year averages, seven of the eight current indicators were at least 30 pp lower than their averages: business activity was down 86 pp, new business down 72 pp, profitability down 65 pp, capacity utilisation down 64 pp, business optimism down 57 pp, employment down 46 pp, and product prices down 31 pp. The exception was the input costs indicator, which had a balance 47 pp higher than average. All of the non-finance sub-sectors also reported seven current indicators significantly below average, with the input costs indicator being the exception and significantly above average.
6%
8%
8%
24%
8%
1%
4%
7%
8%
15%
20%
62%
79%
13%
47%
28%
86%
77%
72%
14%
13%
86%
49%
65%
Business activity
New business
Capacity utilisation
Input costs
Product prices
Profitability
Employment
Business optimism
Increase No change Decrease
- 64 pp
- 6 pp
- 85 pp
- 46 pp
- 58 pp
- 10 pp
- 68 pp
Balance*
- 80 pp

Statistics Jersey Business Tendency Survey – June 2020 8
Figure 4.2 – Non-finance sector current indicators, time series June 2019 – June 2020
Comparison of finance and non-finance sectors
The finance sector was at least 20 pp more positive than the non-finance sector in six of the eight current indicators and was within 10 pp for the other two indicators, for a net balance of +6; see Figure 5.1. While it is typical for finance to be more positive than non-finance – the three-year mean balance between more positive and more negative indicators (by at least 10 pp) is +4.4 for the period ending March 2020 – the magnitudes of the differences are greater in the current quarter. The largest differences were in the capacity utilisation indicator (77 pp higher for finance), business activity (59 pp), profitability (49 pp), and employment (39 pp).
Figure 5.1 – Finance and non-finance sector indicators (net balances, percentage points)
June 2020
* The net balance is the difference between the proportion of companies reporting an increase and those reporting a decrease. For input costs, the balance indicates that more businesses have seen input costs increase than decrease.
Product prices and input costs were the indicators where the two sectors differed by less than 10 pp.
-80-68 -64
-10 -6
-85
-46-58
-100
-80
-60
-40
-20
0
20
40
Businessactivity
Newbusiness
Capacityutilisation
Inputcosts
Productprices
Profitability Employment Businessoptimism
Balance Jun-19 Sep-19 Dec-19 Mar-20 Jun-20
-21-36
13
-6
1
-36
-7
-35
-80-68 -64
-10 -6
-85
-46-58
-100
-80
-60
-40
-20
0
20
Businessactivity
Newbusiness
Capacityutilisation
Inputcosts
Productprices
Profitability Employment Businessoptimism
Balance* Finance sector Non-finance sector
Statistics Jersey Business Tendency Survey – June 2020 9
Section 2: Future indicators
The results presented below (and throughout this report) for the two future indicators are as reported by respondents to this survey in June 2020.
Future business activity
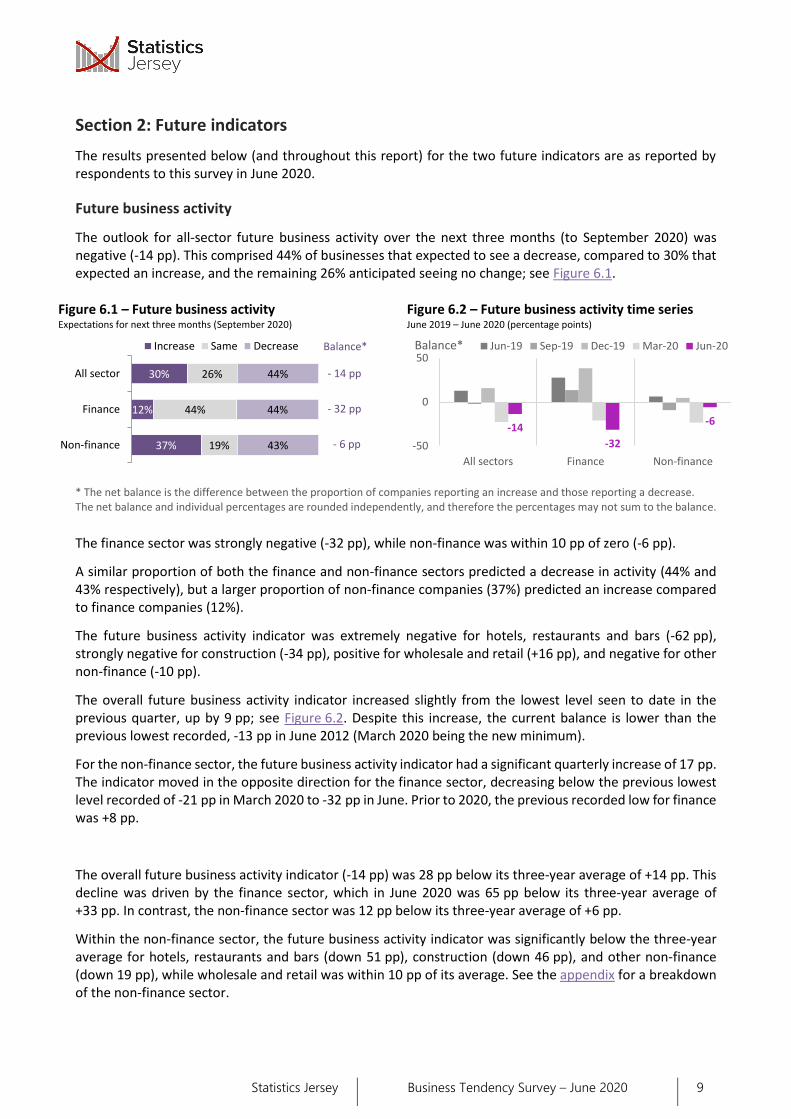
The outlook for all-sector future business activity over the next three months (to September 2020) was negative (-14 pp). This comprised 44% of businesses that expected to see a decrease, compared to 30% that expected an increase, and the remaining 26% anticipated seeing no change; see Figure 6.1.
Figure 6.1 – Future business activity
Figure 6.2 – Future business activity time series
* The net balance is the difference between the proportion of companies reporting an increase and those reporting a decrease. The net balance and individual percentages are rounded independently, and therefore the percentages may not sum to the balance.
The finance sector was strongly negative (-32 pp), while non-finance was within 10 pp of zero (-6 pp).
A similar proportion of both the finance and non-finance sectors predicted a decrease in activity (44% and 43% respectively), but a larger proportion of non-finance companies (37%) predicted an increase compared to finance companies (12%).
The future business activity indicator was extremely negative for hotels, restaurants and bars (-62 pp), strongly negative for construction (-34 pp), positive for wholesale and retail (+16 pp), and negative for other non-finance (-10 pp).
The overall future business activity indicator increased slightly from the lowest level seen to date in the previous quarter, up by 9 pp; see Figure 6.2. Despite this increase, the current balance is lower than the previous lowest recorded, -13 pp in June 2012 (March 2020 being the new minimum).
For the non-finance sector, the future business activity indicator had a significant quarterly increase of 17 pp. The indicator moved in the opposite direction for the finance sector, decreasing below the previous lowest level recorded of -21 pp in March 2020 to -32 pp in June. Prior to 2020, the previous recorded low for finance was +8 pp.
The overall future business activity indicator (-14 pp) was 28 pp below its three-year average of +14 pp. This decline was driven by the finance sector, which in June 2020 was 65 pp below its three-year average of +33 pp. In contrast, the non-finance sector was 12 pp below its three-year average of +6 pp.
Within the non-finance sector, the future business activity indicator was significantly below the three-year average for hotels, restaurants and bars (down 51 pp), construction (down 46 pp), and other non-finance (down 19 pp), while wholesale and retail was within 10 pp of its average. See the appendix for a breakdown of the non-finance sector.
Figure 6.1 – Future business activity Expectations for next three months (September 2020)
Figure 6.2 – Future business activity time series June 2019 – June 2020 (percentage points)
30%
12%
37%
26%
44%
19%
44%
44%
43%
All sector
Finance
Non-finance
Increase Same Decrease
- 6 pp
- 14 pp
Balance*
- 32 pp
-14
-32
-6
-50
0
50
All sectors Finance Non-finance
Balance* Jun-19 Sep-19 Dec-19 Mar-20 Jun-20

Statistics Jersey Business Tendency Survey – June 2020 10
Future employment
The outlook for all-sector future employment was within 10 pp of zero (-7 pp). An increase was expected by 17% of companies, and 23% expected a decrease; see Figure 7.1. These proportions were approximately reversed for finance, where 24% of companies expected to increase their employment compared to 16% that expected a decrease, giving a balance of +8 pp for the sector. In contrast, the indicator for the non-finance sector was negative (-13 pp).
Figure 7.1 – Future employment
Figure 7.2 – Future employment time series
* The net balance is the difference between the proportion of companies reporting an increase and those reporting a decrease. The net balance and individual percentages are rounded independently, and therefore the percentages may not sum to the balance.
The overall indicator was also within 10 pp of zero in March 2020 (+2 pp), and both finance and non-finance reported quarterly decreases of less than 10 pp, see Figure 7.2.
The overall indicator (-7 pp) was significantly more negative than its three-year average of +10 pp (down 17 pp). The indicator for finance was 20 pp below its three-year mean (+28 pp), and the non-finance indicator was 15 pp more negative than its three-year average (+2 pp).
Within the non-finance sector, the future employment indicator was strongly negative for hotels, restaurants and bars (-42 pp), negative for construction (-21 pp) and wholesale and retail (-11 pp), and neutral for other non-finance (+1 pp).
See the appendix for a detailed breakdown by size and sector.
Figure 7.1 – Future employment Expectations for next three months (September 2020)
Figure 7.2 – Future employment time series June 2019 – June 2020 (percentage points)
17%
24%
13%
60%
60%
60%
23%
16%
27%
All sector
Finance
Non-finance
Increase Same Decrease Balance*
- 7 pp
+ 8 pp
- 13 pp-7
8
-13-20
0
20
40
All sectors Finance Non-finance
Balance* Jun-19 Sep-19 Dec-19 Mar-20 Jun-20

Statistics Jersey Business Tendency Survey – June 2020 11
Annex – COVID-19
In response to the COVID-19 pandemic and associated economic consequences, additional questions were included in the June 2020 round of the survey in order to measure some of these consequences.
Trading activity
Businesses were asked if they were currently trading. Of those that responded, 91% were trading and 9% were inactive in June 2020. A small, non-zero, number of businesses reported having ceased trading; however, some of the undertakings that did not respond to the survey are known to have ceased, so this will be an underestimate.
Turnover
Businesses were asked how their turnover in June compared to three months’ ago (March 2020) and were given a choice of several options. In calculating the balance of this indicator, we have given a lower weight (50%) to the smaller increases and decreases (of less than 20%), and a larger weight (150%) to the greatest increases and decreases (of more than 50%).
The balance of the turnover indicator was extremely negative at -75 pp, with the most selected option being a decrease of over 50%, which was selected by a third (32%) of businesses; see Figure A1.1. Overall, 73% of undertakings reported a decrease in turnover, compared to 8% that reported an increase.
Figure A1.1 – Turnover in June 2020 compared to three months’ ago (March 2020)
Access to finance
The access to finance indicator was negative, with a balance of -13 pp. This comprised 19% of companies that reported a decrease in access to finance compared to 6% that reported an increase; see Figure A1.2.
Figure A1.2 – Access to finance in June 2020 compared to three months’ ago (March 2020)
* The net balance is the difference between the proportion of companies reporting an increase and those reporting a decrease. The net balance and individual percentages are rounded independently, and therefore the percentages may not sum to the balance.
Employment
Most businesses employed staff in June (92%), while 8% of businesses reported they did not employ staff.
Of the businesses that employed staff, half (49%) reported that a lower proportion of their staff were actively working in June 2020 compared to normal, and 2% said none of their staff were actively working. Staff that
0%0%
7%
18%19%
23%
32%
Increase> 50%
Increase20-50%
Increase< 20%
No changeDecrease< 20%
Decrease20-50%
Decrease> 50%
6% 75% 19%Access to finance
Higher Same Lower
- 13 pp
Balance*

Statistics Jersey Business Tendency Survey – June 2020 12
are actively working are carrying out their duties, as opposed to not working but continuing to be employed. In contrast, 1% said their staff were working more than normal, giving an extremely negative net balance of -51 pp in the actively working indicator2; see Figure A1.3.
Figure A1.3 – Proportion of staff actively working in June 2020 compared to three months’ ago (March 2020)
Of the businesses that employed staff, a quarter (27%) reported that all of their staff were working remotely, and a further 39% said some of their staff were working remotely. In contrast, a third (33%) said none of their staff were working remotely. This resulted in a positive balance of +13 pp for the working remotely indicator3; See Figure A1.4.
Figure A1.4 – Proportion of working remotely in June 2020
Businesses were asked if they had taken any measures to cope with the impact of COVID-19 on their workforce, and what actions they had taken. Of businesses that employed staff, three-quarters (77%) implemented some measures. The most commonly cited response was enrolling in the Government of Jersey Co-Funded Payroll Scheme (41%), followed by decreased hours for staff (34%); see Figure A1.5. Measures involving increasing or decreasing employment were the least frequently cited; 7% of businesses reported they had made staff redundant and 3% reported that they had recruited staff.
Figure A1.5 – Workforce measures taken in response to COVID-19 in June 2020
Among the measures described in “other” were flexible working arrangements, not recruiting new staff, and financial measures such as changes to pensions and bonuses.
2 For this indicator, businesses that reported none of their staff were actively working were weighted at 150%, compared
to 100% for those that responded higher or lower.
3 For this indicator, we have assigned a weight of +100% to “all”, +50% to “some” and -100% to “none”.
48% 49%Actively working staff
Higher Same Lower None
- 51 pp
Balance*
27% 39% 33%Working remotely
All Some None
+ 13 pp
Balance*
8%
34%
41%
7%
3%
14%
23%
Increased hours
Decreased hours
Co-funded payroll scheme
Redundancies
Recruited staff
Other
None

Statistics Jersey Business Tendency Survey – June 2020 13
Annex – Finance sector
Future expectations
Additional questions were asked of the finance sector to gauge their expectations for future employment, profits and business development4.
Employment expectations
Businesses were asked to quantify their expected changes in employment from December 2019 to December 2020.
The longer-term employment expectations indicator was negative (-19 pp), with half (50%) of finance companies expecting employment to be lower in December 2020, compared to a third (31%) that expected an increase and 20% that expected no change; see Figure A2.1.
Figure A2.1 – Longer-term employment expectations (December 2019 to December 2020)
A similar proportion of companies expected employment decreases of less than 5% and between 5-10%, with proportions of 23% and 21% respectively, compared to 5% that expected decreases of more than 10%. Approximately 10% of companies expected to see increases each of less than 5%, 5-10%, and more than 10%.
Compared to expectations in June 2019 (for December 2019), this indicator was down 43 pp (from +24 pp to -19 pp). Fewer companies predicted increases, and more predicted decreases; see Figure A2.2.
Figure A2.2 – Longer-term employment expectations for 2020 (expressed in June 2020), compared with expectations for 2019 (expressed in June 2019)
4 In publications prior to June 2019, the finance annex was weighted by company size only. The annex is now weighted by company size and sampling probability, as in the rest of the report.
9%8%
13%
20%
23%21%
5%
Increasemore than 10%
Increase5-10%
Increaseless than 5%
No changeDecreaseless than 5%
Decrease5-10%
Decreasemore than 10%
1%
10%12%
31%
20%17%
9%
5%
21%23%
20%
13%
8% 9%
Decreasemore than 10%
Decrease5-10%
Decreaseless than 5%
No change Increaseless than 5%
Increase5-10%
Increasemore than 10%
June 2019 June 2020

Statistics Jersey Business Tendency Survey – June 2020 14
Profit expectations
Companies were asked their expected level of profits for the following three months, between June and September 2020. The outlook for profits in the short term was strongly negative (-29 pp); half (52%) of finance companies expected decreases, with most of those companies predicting decreases of 5-10%, see Figure A2.3. In contrast, a quarter (23%) of companies expected an increase in profits in the short term.
June 2020 was the first quarter recorded to date when this indicator was negative; the previous minimum balance was +6 pp in June 2010, a figure the current balance was 35 pp below.
In June 2019 the balance of this indicator had been +37 pp, resulting in an annual decrease in June 2020 of 66 pp, the largest annual change recorded to date by this survey.
Figure A2.3 – Short-term profit expectations (June 2020 to September 2020)
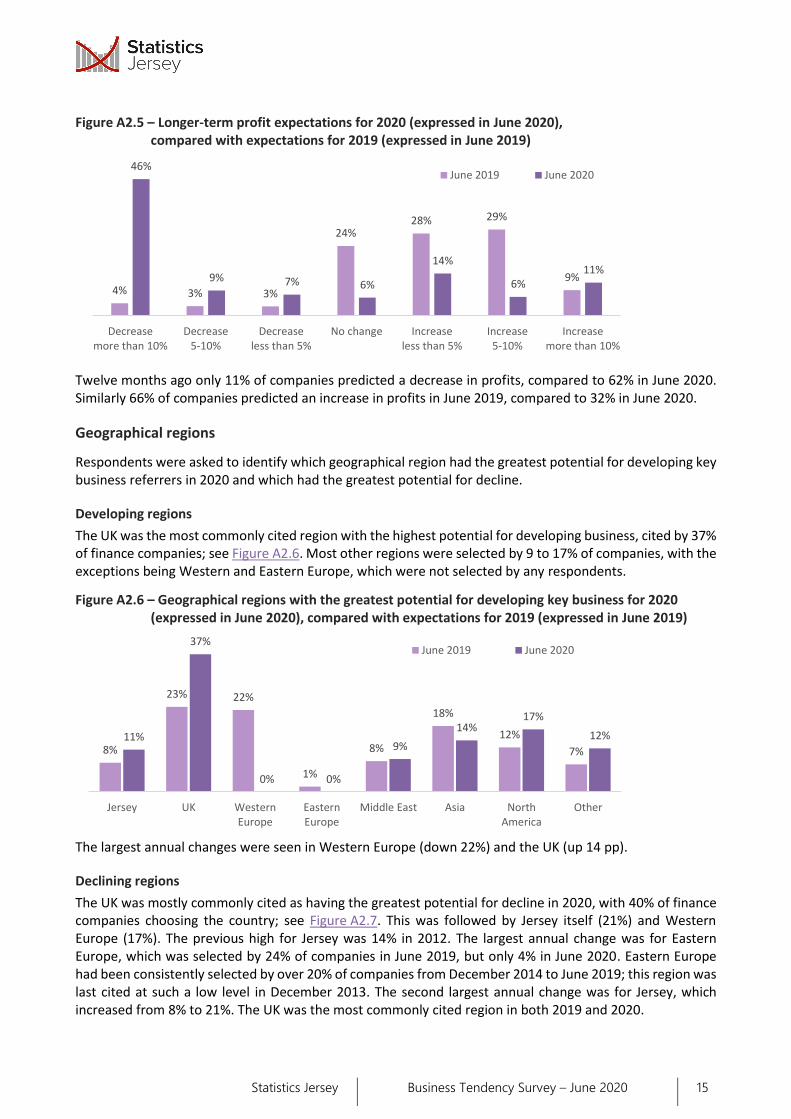
Businesses were also asked to compare their profits for financial year 2019 with their expected profits for financial year 2020. The balance for the longer-term profits for this year was strongly negative (-30 pp), similar to the short-term profit expectations indicator. More than three-fifths (62%) of finance companies expected that profits in 2020 would be lower than in 2019, compared to 30% that expected decreases; see Figure A2.4. Almost half (46%) of finance companies predicted a decrease in profits of more than 10%, making it the most commonly selected option; all other options were selected by 6 to 14% of companies.
Figure A2.4 – Longer-term profit expectations (for 2020, compared with 2019)
As with the short-term profit expectations, this indicator had always been positive for the finance sector prior to June 2020, with a minimum of +9 pp in June 2015. The current balance of -30 pp was 39 pp below the previous minimum.
Similarly, the figure twelve months ago in June 2019 was +55 pp; the annual change was a decrease of 85 pp, the largest annual change recorded to date by this survey. See Figure A2.5.
2%3%
19%
25%
11%
27%
15%
Increasemore than 10%
Increase5-10%
Increaseless than 5%
No changeDecreaseless than 5%
Decrease5-10%
Decreasemore than 10%
11%6%
14%
6%7%9%
46%
Increasemore than 10%
Increase5-10%
Increaseless than 5%
No changeDecreaseless than 5%
Decrease5-10%
Decreasemore than 10%
Statistics Jersey Business Tendency Survey – June 2020 15
Figure A2.5 – Longer-term profit expectations for 2020 (expressed in June 2020), compared with expectations for 2019 (expressed in June 2019)
Twelve months ago only 11% of companies predicted a decrease in profits, compared to 62% in June 2020. Similarly 66% of companies predicted an increase in profits in June 2019, compared to 32% in June 2020.
Geographical regions
Respondents were asked to identify which geographical region had the greatest potential for developing key business referrers in 2020 and which had the greatest potential for decline.
Developing regions
The UK was the most commonly cited region with the highest potential for developing business, cited by 37% of finance companies; see Figure A2.6. Most other regions were selected by 9 to 17% of companies, with the exceptions being Western and Eastern Europe, which were not selected by any respondents.
Figure A2.6 – Geographical regions with the greatest potential for developing key business for 2020 (expressed in June 2020), compared with expectations for 2019 (expressed in June 2019)
The largest annual changes were seen in Western Europe (down 22%) and the UK (up 14 pp).
Declining regions
The UK was mostly commonly cited as having the greatest potential for decline in 2020, with 40% of finance companies choosing the country; see Figure A2.7. This was followed by Jersey itself (21%) and Western Europe (17%). The previous high for Jersey was 14% in 2012. The largest annual change was for Eastern Europe, which was selected by 24% of companies in June 2019, but only 4% in June 2020. Eastern Europe had been consistently selected by over 20% of companies from December 2014 to June 2019; this region was last cited at such a low level in December 2013. The second largest annual change was for Jersey, which increased from 8% to 21%. The UK was the most commonly cited region in both 2019 and 2020.
4% 3% 3%
24%28% 29%
9%
46%
9% 7% 6%
14%
6%11%
Decreasemore than 10%
Decrease5-10%
Decreaseless than 5%
No change Increaseless than 5%
Increase5-10%
Increasemore than 10%
June 2019 June 2020
8%
23% 22%
1%
8%
18%
12%
7%11%
37%
0% 0%
9%
14%17%
12%
Jersey UK WesternEurope
EasternEurope
Middle East Asia NorthAmerica
Other
June 2019 June 2020

Statistics Jersey Business Tendency Survey – June 2020 16
Figure A2.7 – Geographical regions with the greatest potential for decline of key business for 2020 (expressed in June 2020), compared with expectations for 2019 (expressed in June 2019)
Key issues
Respondents were asked to identify the three key issues for Jersey’s business environment for the next six months (to December 2020). Due to the COVID-19 pandemic and associated changes to the economic environment, four additional options were added to this question: the global economic outlook, lockdowns (within countries), border controls / travel restrictions (between countries), and market / public confidence.
These four new options were the four most commonly cited key issues, with the global economic outlook selected by 88% of companies, followed by market and public confidence (53%), and travel restrictions and lockdowns (33% and 32%, respectively); see Figure A2.8.
Figure A2.8 – Key issues for Jersey’s business environment for the next six months (to December 2020)
The addition of the four new categories means we cannot compare this question with previous rounds of the survey on a consistent basis. Nevertheless, to give an indication of what was commonly cited when the four new options were not available, in June 2019 the four most commonly cited issues were the Island’s reputation (69%), external financial regulation (44%), staff skills (42%) and government regulation (39%). These issues are also the most commonly cited when looking at averages for the three-year period June 2017 to December 2019, with averages of 60%, 57%, 50% and 28%, respectively.
8%
44%
11%
24%
3% 3% 1%
6%
21%
40%
17%
4% 4% 5%0%
10%
Jersey UK WesternEurope
EasternEurope
Middle East Asia NorthAmerica
Other
June 2019 June 2020
19%
7%
16%
21%
9%
20%
9%
88%
32%
33%
53%
1%
Island's reputation
Financial services legislation
Staff skills
Government regulations
Taxation
Internal financial regulations
External financial regulations
Global economy
Lockdown
Travel restrictions
Market / public confidence
Other

Statistics Jersey Business Tendency Survey – June 2020 17
Notes
The Business Tendency Survey samples private sector businesses in Jersey. The survey asks the Chief Executive or Managing Director of sampled businesses for their opinions on the current situation of their business compared with three months previously, and for their expectations for the next three months.
Each indicator derived from the survey responses is calculated as a net balance; that is, the difference between the percentage of respondents answering higher or increase compared with the percentage answering lower or decrease. Responses are weighted according to the sampling probability and size of workforce of each business. Hence, each indicator constitutes a weighted net balance (WNB).
The survey is run in the last month of each quarter. In June and December, additional questions are asked of the finance sector to gauge their expectations for future employment, profits and business development.
1. Net balance: Net balances are used to summarise respondents’ answers to the multiple-choice questions of the Business Tendency Survey. The net balance is obtained by taking the difference between the weighted percentages of respondents giving positive (such as “increase” or “higher”) and negative responses (such as “decrease” or “lower”). The net balance is given as a difference measured in percentage points (pp). The statistical uncertainty on each net balance (expressed as a 95% confidence interval) depends on the effective (weighted) numbers of respondents to each question. For overall indicators covering the whole of the private sector, the 95% confidence interval usually ranges from ±4 to ±6 pp, but was ±7 pp this round due to a lower response rate.
2. Seasonal effects: Businesses are asked to exclude normal seasonal fluctuations from their responses. When it is not practical to compare the current trading situation with that of three months ago, businesses are asked to compare with one year ago.
3. Stratified sample: To design a representative sample of Jersey’s businesses, a random sampling approach was used, stratified by business size (employment on a full‐time equivalent, FTE, basis) and type of activity (UK SIC 2007 sector). Size‐dependent sampling probabilities were applied, and businesses with more than 50 FTE employees were given a sampling probability of one. The sample is reviewed twice yearly to incorporate new businesses and changes in staffing, in order that the sample remains representative of Jersey’s economy.
4. Response: Around 500 firms were sent a survey questionnaire for this survey; 260 completed questionnaires were returned, constituting an overall response rate of 52%. The respondents accounted for 32% of total private sector employment in the Island.
5. Weighting: The response data collected were analysed by calculating a weighted net balance. Each reporting business was assigned two weights: a sampling probability weight and a size weight (FTE workforce). The sampling weight adjusts for the different likelihoods of different sized businesses being included in the sample, an effect of the sampling methodology used. The size weight ensures that companies contribute to each indicator in proportion to the size of their workforce.
Statistics Jersey welcomes suggestions on how we can improve our surveys and reports to ensure we are meeting the needs of our users. If you have any feedback relating to this report, please email [email protected].
Statistics Jersey
23 July 2020

Statistics Jersey Business Tendency Survey – June 2020 18
Glossary
1. Employed staff: This includes staff who are currently on leave of any sort, including furlough leave and unpaid leave. Staff paid through the co-funded payroll scheme should be included, whether or not they are working any hours.
2. Actively working staff: This includes staff who are fulfilling their work duties. Staff who are unable to work for any reason should be excluded, whether or not they are paid
3. Level of business activity / output: Laying off only covers staff who are no longer employed by the business. Staff that are on the co-funded payroll scheme are still employed, and similarly for staff on leave of any sort, including furlough leave and unpaid leave.
4. Level of business activity / output: This is the total amount of work undertaken by an organisation. Business activity can be thought of as gross income, chargeable hours worked, turnover or the number of products produced. The measure of business activity used depends on the nature of an organisation. For example, a legal firm may use the number of chargeable hours worked. A bank may decide to use values of fees, commission and premium income.
5. Incoming new business / new orders: This is the amount of new business placed with an organisation. This may include any new clients, new orders or contracts from existing clients or any new contracts.
6. Level of capacity utilisation: This is the current business activity relative to ‘normal capacity’. ‘Above capacity’ indicates that a business is above its normal capacity, for example because an organisation is busier than normal or staff are working longer hours than normal. Similarly, ‘below capacity’ indicates the current business activity is below its normal capacity, for example because an organisation is quieter than normal or staff are working shorter hours than normal.
7. Average cost of inputs: This is the average cost for all inputs used by an organisation. Inputs include supplies obtained, stocks/materials bought in and costs of employees, including wages, salaries and pension costs paid by an organisation. We ask businesses to try to give a weighted average of costs. For example, if employment costs are the largest share, they should be given the largest weighting (i.e. importance) when answering the question.
8. Average prices that charged for products: This is the price charged per item or per unit of time on average. For example, a legal firm will know how much they charge an hour. However, if an organisation offers various services/products, we ask them to try to give a weighted average. For example, if one service accounts for most sales and its prices have increased, then it should be given the largest weighting (i.e. importance) when answering the question, indicating that prices have risen on average.
9. Profitability: This is the total profits earned on all activities of an organisation. If an organisation does not calculate profits over the most recent three months, we ask them to try to estimate how their profitability has changed, taking into account changes in turnover, changes in input costs and changes in mark-ups/spreads over input costs.
10. Employment: This is the number of employees employed on average. Two part-time employees are equivalent to one full-time employee. For example, if two part-time employees resigned and one full-time employee was taken on, we ask organisations to count this as no net change (so employment was the ‘same’). We ask organisations to ignore seasonal or temporary hirings.
11. Business optimism: This refers to confidence or optimism about the overall business situation in an organisations’ industry generally. Unlike the previous questions, it is not about what is actually happening to an organisation at present, but asks about their opinions for their sector generally.
Statistics Jersey Business Tendency Survey – June 2020 19
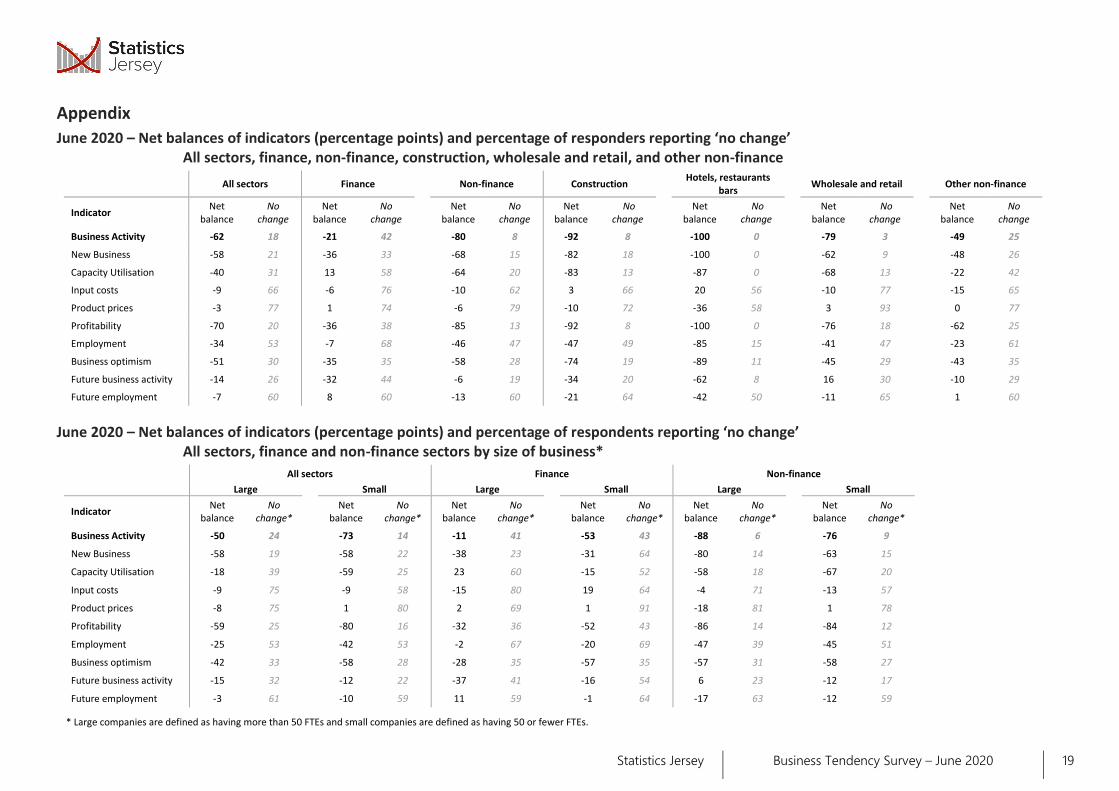
Appendix
June 2020 – Net balances of indicators (percentage points) and percentage of responders reporting ‘no change’ All sectors, finance, non-finance, construction, wholesale and retail, and other non-finance
All sectors Finance Non-finance Construction
Hotels, restaurants bars
Wholesale and retail Other non-finance
Indicator Net
balance No
change Net
balance No
change
Net balance
No change
Net balance
No change
Net
balance No
change
Net balance
No change
Net
balance No
change
Business Activity -62 18 -21 42 -80 8 -92 8 -100 0 -79 3 -49 25
New Business -58 21 -36 33 -68 15 -82 18 -100 0 -62 9 -48 26
Capacity Utilisation -40 31 13 58 -64 20 -83 13 -87 0 -68 13 -22 42
Input costs -9 66 -6 76 -10 62 3 66 20 56 -10 77 -15 65
Product prices -3 77 1 74 -6 79 -10 72 -36 58 3 93 0 77
Profitability -70 20 -36 38 -85 13 -92 8 -100 0 -76 18 -62 25
Employment -34 53 -7 68 -46 47 -47 49 -85 15 -41 47 -23 61
Business optimism -51 30 -35 35 -58 28 -74 19 -89 11 -45 29 -43 35
Future business activity -14 26 -32 44 -6 19 -34 20 -62 8 16 30 -10 29
Future employment -7 60 8 60 -13 60 -21 64 -42 50 -11 65 1 60
June 2020 – Net balances of indicators (percentage points) and percentage of respondents reporting ‘no change’ All sectors, finance and non-finance sectors by size of business*
All sectors Finance Non-finance
Large Small Large Small Large Small
Indicator Net
balance No
change*
Net balance
No change*
Net balance
No change*
Net
balance No
change* Net
balance No
change*
Net balance
No change*
Business Activity -50 24 -73 14 -11 41 -53 43 -88 6 -76 9
New Business -58 19 -58 22 -38 23 -31 64 -80 14 -63 15
Capacity Utilisation -18 39 -59 25 23 60 -15 52 -58 18 -67 20
Input costs -9 75 -9 58 -15 80 19 64 -4 71 -13 57
Product prices -8 75 1 80 2 69 1 91 -18 81 1 78
Profitability -59 25 -80 16 -32 36 -52 43 -86 14 -84 12
Employment -25 53 -42 53 -2 67 -20 69 -47 39 -45 51
Business optimism -42 33 -58 28 -28 35 -57 35 -57 31 -58 27
Future business activity -15 32 -12 22 -37 41 -16 54 6 23 -12 17
Future employment -3 61 -10 59 11 59 -1 64 -17 63 -12 59
* Large companies are defined as having more than 50 FTEs and small companies are defined as having 50 or fewer FTEs.

Statistics Jersey Business Tendency Survey – June 2020 20
Indicators – net balances (percentage points)
All sectors
*Data is not available for June and September 2016
Finance
*Data is not available for June and September 2016
2015 2016* 2017 2018 2019 2020
Indicator June Sept Dec March Dec March Sept Sept Dec March June Sept Dec March June Sept Dec Mar Jun
Business Activity 20 5 18 7 20 18 3 7 12 16 25 21 11 13 16 3 6 -11 -62
New Business 24 12 10 14 14 14 3 12 21 19 16 18 3 8 3 3 9 -13 -58
Capacity Utilisation 7 9 9 2 9 9 3 4 9 6 11 8 7 1 3 3 1 -11 -40
Input costs -31 -19 -25 -23 -45 -55 -50 -39 -42 -50 -54 -53 -44 -48 -42 -50 -52 -40 -9
Product prices 10 4 2 7 14 16 16 21 14 26 29 22 14 27 21 16 15 10 -3
Profitability 2 -8 -1 -9 -11 -16 -19 -8 -7 -9 1 -2 -14 -11 -5 -19 -14 -29 -70
Employment -4 7 8 8 3 2 4 6 13 9 14 10 4 10 4 4 -2 -4 -34
Business optimism 15 5 8 9 4 7 -5 8 18 11 10 7 1 1 -4 -5 4 -30 -51
Future business activity 27 25 18 22 14 26 -2 10 27 20 25 21 11 25 13 -2 16 -23 -14
Future employment 12 10 21 11 0 7 12 11 22 12 16 17 3 7 3 12 2 2 -7
2015 2016* 2017 2018 2019 2020
Indicator June Sept Dec March Dec March June Sept Dec March June Sept Dec March June Sept Dec Mar Jun
Business Activity 31 0 31 33 41 34 35 12 28 36 31 28 28 39 33 7 17 17 -21
New Business 39 15 10 41 31 18 16 18 38 33 17 23 20 28 1 7 29 11 -36
Capacity Utilisation 16 23 29 19 28 30 25 4 27 28 20 8 21 13 7 7 8 5 13
Input costs -26 -13 -18 -22 -18 -34 -23 -11 -23 -25 -30 -27 -22 -21 -19 -43 -43 -32 -6
Product prices 12 0 4 14 3 16 13 7 21 18 16 7 7 24 3 2 7 -5 1
Profitability 17 -3 11 7 12 -7 15 23 31 18 17 20 7 16 11 -12 2 -19 -36
Employment -4 8 16 19 -5 12 6 18 29 33 28 11 11 35 20 4 18 1 -7
Business optimism 18 4 11 11 13 19 12 22 33 24 20 16 17 15 1 -9 9 -27 -35
Future business activity 29 36 34 22 49 38 45 25 51 39 54 49 34 39 28 14 38 -21 -32
Future employment 24 11 43 6 -2 11 28 29 57 37 39 24 12 17 18 41 16 16 8

Statistics Jersey Business Tendency Survey – June 2020 21
Non-finance
*Data is not available for June and September 2016
Construction
*Data is not available for June and September 2016
2015 2016* 2017 2018 2019 2020
Indicator June Sept Dec March Dec March June Sept Dec March June Sept Dec March June Sept Dec Mar Jun
Business Activity 14 9 10 -4 12 12 21 5 4 6 23 18 4 1 8 2 0 -24 -80
New Business 15 10 10 1 7 13 26 9 11 12 16 15 -5 -1 4 1 -2 -24 -68
Capacity Utilisation 3 2 -3 -5 2 3 2 4 0 -3 8 8 1 -4 1 1 -2 -19 -64
Input costs -33 -22 -30 -23 -55 -62 -66 -54 -51 -62 -64 -65 -53 -60 -51 -53 -57 -44 -10
Product prices 10 6 1 4 18 16 30 28 11 29 35 29 17 28 29 22 19 17 -6
Profitability -5 -10 -9 -16 -21 -19 -9 -24 -26 -22 -5 -12 -23 -23 -13 -22 -22 -34 -85
Employment -4 7 3 3 6 -1 -1 0 5 -2 8 10 2 -2 -3 3 -12 -7 -46
Business optimism 14 5 6 8 1 3 15 0 10 5 6 3 -6 -6 -6 -3 1 -31 -58
Future business activity 26 19 8 23 0 22 18 1 14 12 14 9 1 19 6 -9 5 -23 -6
Future employment 6 9 8 13 0 5 9 1 5 1 7 14 -1 3 -4 -2 -6 -5 -13
2015 2016* 2017 2018 2019 2020
Indicator June Sept Dec March Dec March June Sept Dec March June Sept Dec March June Sept Dec Mar Jun
Business Activity 8 8 -5 2 25 16 10 7 16 20 21 11 3 -8 -10 3 -8 -13 -92
New Business 4 12 10 2 14 17 16 6 20 9 18 4 -10 -6 19 9 -7 -13 -82
Capacity Utilisation 11 -4 -5 -10 8 3 12 -2 18 -5 -2 13 -7 21 7 3 4 -7 -83
Input costs -37 -27 -24 -28 -57 -64 -73 -51 -62 -78 -76 -75 -44 -54 -77 -69 -56 -52 3
Product prices 2 40 -4 -1 13 24 24 16 17 31 34 33 12 3 38 25 14 15 -10
Profitability -14 -19 -6 -29 -6 -15 -12 -29 -22 -24 8 -6 -17 -25 -25 -37 -27 -33 -92
Employment -4 30 17 -5 -4 1 -1 1 25 4 18 28 6 -2 -10 8 -5 4 -47
Business optimism 17 36 31 11 20 18 34 27 26 21 32 21 5 -11 9 34 13 -2 -74
Future business activity 23 53 22 3 21 13 16 13 32 17 17 19 8 -1 -1 12 6 5 -34
Future employment 21 36 6 -10 4 11 14 -14 16 -17 2 19 9 -2 3 16 9 13 -21

Statistics Jersey Business Tendency Survey – June 2020 22
Hotels, restaurants and bars
*Data is not available for June and September 2016
Wholesale and retail
*Data is not available for June and September 2016
2015 2016* 2017 2018 2019 2020
Indicator June Sept Dec March Dec March June Sept Dec March June Sept Dec March June Sept Dec Mar Jun
Business Activity 31 19 11 20 5 16 2 -23 -20 -7 13 28 -16 -27 -23 -4 -7 -42 -100
New Business 42 36 22 7 -7 6 -2 -18 14 2 13 28 -27 -20 -27 -10 -18 -45 -100
Capacity Utilisation 15 28 -2 4 -5 -3 -5 -10 -16 -10 -3 17 -25 -24 -28 -5 -12 -44 -87
Input costs -81 -38 -44 -51 -70 -80 -88 -69 -55 -91 -70 -70 -70 -83 -75 -68 -72 -47 20
Product prices 29 22 29 20 47 33 58 52 15 47 36 52 23 58 38 35 47 8 -36
Profitability 15 0 -2 5 -9 -23 -25 -55 -30 -35 -30 -12 -46 -39 -15 -31 -39 -62 -100
Employment -2 11 -23 3 11 2 -8 -18 -5 -14 15 1 -15 -19 -12 -13 -14 -25 -85
Business optimism 33 13 -1 7 -13 8 -3 -24 -7 -14 -15 -11 -35 -8 -12 -16 -10 -78 -89
Future business activity 30 2 5 19 -17 22 8 -39 -22 17 17 -11 -37 25 5 -41 -5 -49 -62
Future employment 13 -3 4 6 -10 12 -6 -16 -18 29 6 -3 -26 22 -15 -36 -10 -35 -42
2015 2016* 2017 2018 2019 2020
Indicator June Sept Dec March Dec March June Sept Dec March June Sept Dec March June Sept Dec Mar Jun
Business Activity 11 -1 10 -11 9 -4 40 11 4 -19 41 1 2 14 16 9 -3 -29 -79
New Business 13 6 4 -6 8 -6 48 15 1 -14 33 6 -9 7 3 3 -1 -29 -62
Capacity Utilisation 1 -5 -10 -10 3 -11 0 7 -9 -13 15 -21 3 -15 10 26 0 -24 -68
Input costs -29 -13 -28 -8 -57 -56 -71 -57 -53 -47 -73 -67 -66 -65 -51 -23 -68 -48 -10
Product prices 10 -7 -10 -8 12 23 45 51 20 32 36 22 27 22 29 8 29 22 3
Profitability 0 -10 -4 -16 -26 -20 12 -20 -46 -24 3 -30 -36 -13 -23 -12 -31 -48 -76
Employment -13 3 19 -5 17 -9 3 7 -5 -12 -2 -8 1 -1 -7 5 5 -4 -41
Business optimism 15 7 -1 2 -8 -27 26 3 4 1 -2 -20 -27 -15 -16 6 -5 -21 -45
Future business activity 28 30 9 21 -1 18 28 11 19 17 16 -3 5 25 6 6 -1 -21 16
Future employment -6 14 19 16 1 -3 16 24 -10 -14 5 14 -7 -3 3 14 -2 -2 -11

Statistics Jersey Business Tendency Survey – June 2020 23
Other non-finance – private sector excluding finance and legal activities, construction and quarrying, hotels restaurants and bars, and wholesale and retail
*Data is not available for June and September 2016
For comparability with past reports, the previously used definition of “other non-finance” is included below.
Other non-finance and hotels, restaurants and bars – private sector excluding finance and legal activities, construction and quarrying, and wholesale and retail
*Data is not available for June and September 2016
Past reports are available online at www.gov.je/BTS Data tables for the above and earlier years are available online at opendata.gov.je/dataset/business-tendency-survey
2015 2016* 2017 2018 2019 2020
Indicator June Sept Dec March Dec March June Sept Dec March June Sept Dec March June Sept Dec Mar Jun
Business Activity 12 14 15 -11 12 20 26 11 8 18 19 24 13 8 19 0 5 -17 -49
New Business 12 3 11 3 10 25 23 17 13 28 8 18 7 4 10 2 4 -17 -48
Capacity Utilisation -2 1 1 -4 2 13 12 11 5 5 11 18 12 0 5 -8 -2 -11 -22
Input costs -19 -25 -28 -21 -48 -61 -39 -48 -46 -54 -51 -59 -45 -52 -37 -57 -48 -40 -15
Product prices 6 2 0 9 13 4 14 10 3 22 34 22 13 28 24 23 7 20 0
Profitability -11 -12 -16 -21 -26 -18 -2 -13 -15 -16 -3 -4 -12 -21 -3 -19 -11 -18 -62
Employment 1 2 -3 12 -1 2 2 3 8 6 7 17 6 4 4 8 -20 -5 -23
Business optimism 6 -9 6 13 6 16 10 -2 14 7 10 16 9 1 -3 -13 5 -25 -43
Future business activity 26 4 2 31 0 29 29 7 17 6 10 21 10 20 9 -10 10 -20 -10
Future employment 7 1 3 21 2 7 15 3 16 6 10 19 7 2 -6 0 -9 1 1
2015 2016* 2017 2018 2019 2020
Indicator June Sept Dec March Dec March June Sept Dec March June Sept Dec March June Sept Dec Mar Jun
Business Activity 16 16 14 -2 10 19 23 1 1 12 16 25 5 -1 9 -1 2 -24 -78
New Business 19 12 14 4 5 21 19 7 13 22 9 21 -2 -2 1 -1 -1 -25 -67
Capacity Utilisation 2 8 1 -2 0 10 9 5 0 1 7 17 2 -6 -3 -7 -4 -23 -59
Input costs -34 -28 -32 -30 -54 -65 -47 -54 -48 -63 -57 -62 -52 -60 -46 -60 -54 -43 -13
Product prices 11 8 8 12 23 10 20 22 6 28 35 30 16 36 27 27 17 17 -7
Profitability -5 -9 -12 -13 -21 -19 -5 -25 -19 -21 -12 -7 -21 -26 -6 -22 -18 -29 -86
Employment 0 4 -8 9 2 2 0 -3 5 1 10 13 1 -2 0 2 -19 -10 -47
Business optimism 12 -3 4 11 0 14 8 -8 9 2 2 8 -3 -1 -5 -14 1 -40 -58
Future business activity 27 3 3 28 -5 27 26 -6 8 8 12 12 -2 22 8 -19 6 -29 -6
Future employment 8 0 3 16 -1 8 12 -3 8 11 9 13 -2 6 -8 -10 -9 -9 -12