Business Strategy of the Magnetic Materials CompanyMagnetic Materials Segment FY2015 Revenues:...
19
© Hitachi Metals, Ltd. 2016. All rights reserved. 1 Ryoji Akada Executive Officer President of the Magnetic Materials Company Hitachi Metals, Ltd. June 3, 2016 Hitachi Metals IR Day 2016 Business Strategy of the Magnetic Materials Company
Transcript of Business Strategy of the Magnetic Materials CompanyMagnetic Materials Segment FY2015 Revenues:...

© Hitachi Metals, Ltd. 2016. All rights reserved. 1
Ryoji Akada Executive Officer President of the Magnetic Materials Company
Hitachi Metals, Ltd.
June 3, 2016
Hitachi Metals IR Day 2016
Business Strategy of the Magnetic Materials Company

© Hitachi Metals, Ltd. 2016. All rights reserved.
1. Business Overview
2. Market Environment
3. Strategy and Action Plan
4. Trend in Business Results and Goals
5. Conclusion
[Table of Contents]
Business Strategy of the Magnetic Materials Company
2

© Hitachi Metals, Ltd. 2016. All rights reserved.
Automotive-related: 63%
◆ Rare earth magnets ◆ Ferrite magnets
Electronics-related: 15%
Industrial infrastructure-related: 22%
◆ Rare earth magnets ◆ Ferrite magnets ◆ Information system components
◆ Rare earth magnets ◆ Ferrite magnets ◆ Applied products
For EPS For HEV & EV
Consumer electronics & mobile devices
FA & industrial equipment
Magnetic Materials Segment
FY2015
Revenues: ¥105.3 billion
Supplying an extensive line-up of magnet products to the market
Rare earth magnets World’s No. 1 brand
Ferrite magnets Magnetic properties of the highest level
NMF-15 Series
3
1-1. Our Position in the Magnet Industry
© Hitachi Metals, Ltd. 2016. All rights reserved.
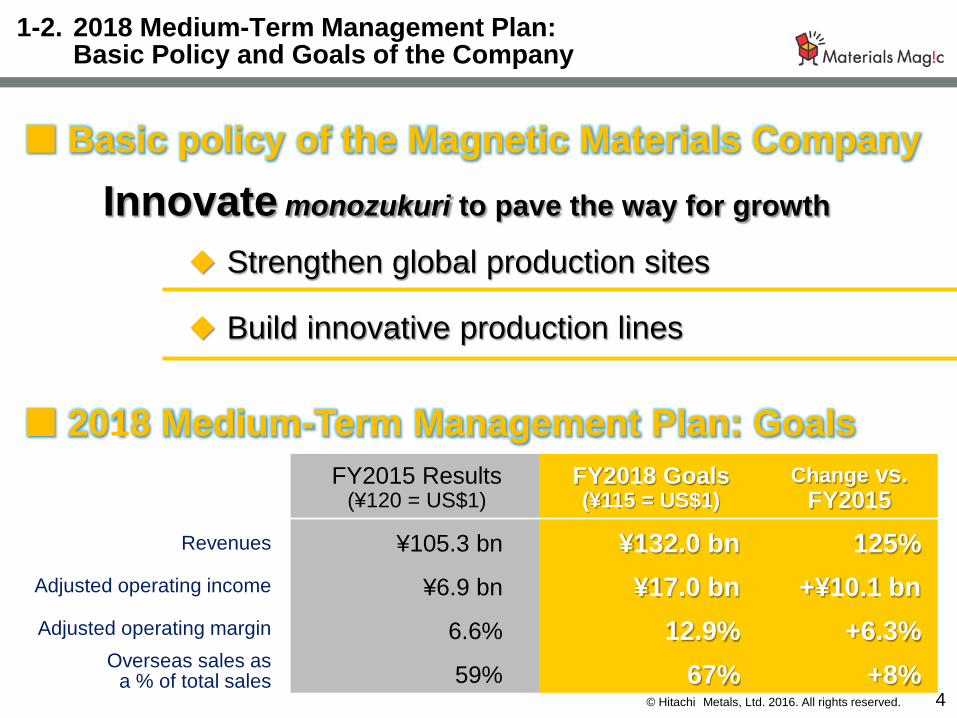
Basic policy of the Magnetic Materials Company
◆ Build innovative production lines
4
◆ Strengthen global production sites
2018 Medium-Term Management Plan: Goals
Revenues
Overseas sales as a % of total sales
Adjusted operating income
Adjusted operating margin
¥105.3 bn
¥6.9 bn
6.6%
59%
FY2015 Results (¥120 = US$1)
¥132.0 bn
¥17.0 bn
12.9%
67%
FY2018 Goals (¥115 = US$1)
Change vs. FY2015
125%
+¥10.1 bn
+6.3%
+8%
Innovate monozukuri to pave the way for growth
1-2. 2018 Medium-Term Management Plan: Basic Policy and Goals of the Company

© Hitachi Metals, Ltd. 2016. All rights reserved.
1. Business Overview
2. Market Environment
3. Strategy and Action Plan
4. Trend in Business Results and Goals
5. Conclusion
[Table of Contents]
Business Strategy of the Magnetic Materials Company
5

© Hitachi Metals, Ltd. 2016. All rights reserved.
0
2
4
6
8
10
Other Asia
Europe
North America
China
Japan
Automotive-related Market
Annual growth of around 20%
Projection of production volume for HEV and EV power systems in each country/region
No.
of H
EV
& E
V
(Mill
ions
of v
ehic
les/
year
)
◆ HEV and EV are becoming increasingly popular out of heightened environmental awareness engendered by regulations on CO2 emissions and fuel efficiency in various countries and regions.
◆ HEV and EV production is projected to increase in China, the U.S., and Europe.
FY 2015
FY 2016
FY 2017
FY 2018
FY 2020
FY 2022
* HEV indicates a full hybrid vehicle 6
2. Market Environment: Expanding Demand for HEV and EV

© Hitachi Metals, Ltd. 2016. All rights reserved.
1. Business Overview
2. Market Environment
3. Strategy and Action Plan
4. Trend in Business Results and Goals
5. Conclusion
[Table of Contents]
Business Strategy of the Magnetic Materials Company
7
© Hitachi Metals, Ltd. 2016. All rights reserved.
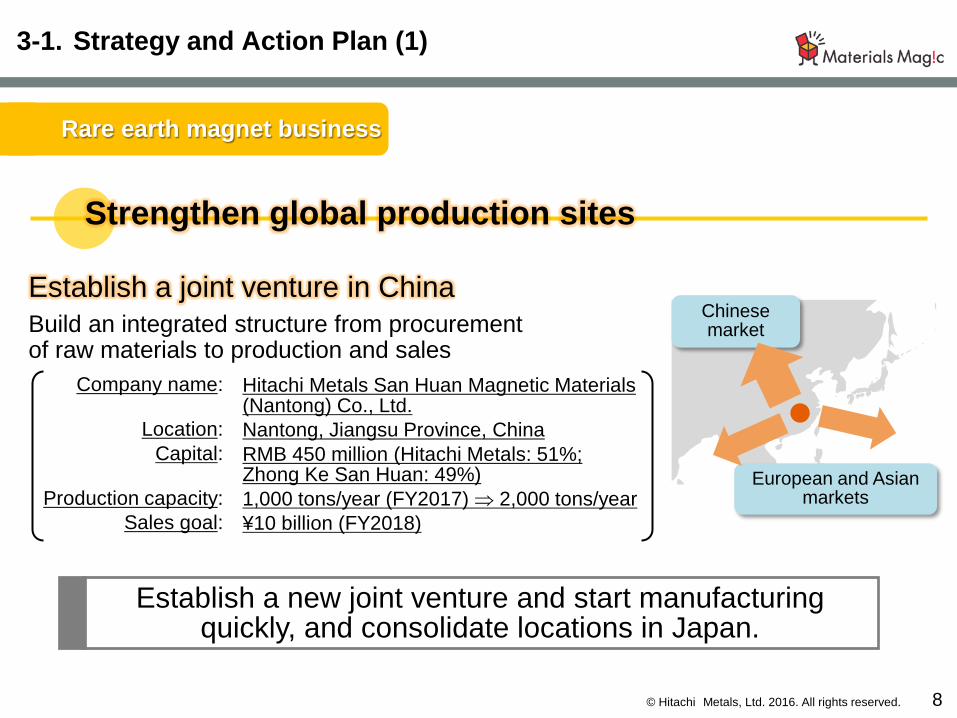
Rare earth magnet business
8
Establish a new joint venture and start manufacturing quickly, and consolidate locations in Japan.
3-1. Strategy and Action Plan (1)
Strengthen global production sites
Establish a joint venture in China Build an integrated structure from procurement of raw materials to production and sales
Chinese market
European and Asian markets
Hitachi Metals San Huan Magnetic Materials (Nantong) Co., Ltd. Nantong, Jiangsu Province, China RMB 450 million (Hitachi Metals: 51%; Zhong Ke San Huan: 49%) 1,000 tons/year (FY2017) ⇒ 2,000 tons/year ¥10 billion (FY2018)
Company name:
Location: Capital:
Production capacity:
Sales goal:

© Hitachi Metals, Ltd. 2016. All rights reserved.
◆ High-performance automated line
◆ Real data management using IoT (Proper inventory management, automatic control of manufacturing conditions)
9
Anticipate customer needs and develop a monozukuri structure that outstrips the competition
Improved material flow
Improve production efficiency
• Shorter lead times • Stable production
◆ Competitive heavy rare earth diffusion technology
◆ Recycling process utilizing proprietary technology
3-2. Strategy and Action Plan (2)
Respond to the growing demand for HEV and EV
Building innovative production lines

© Hitachi Metals, Ltd. 2016. All rights reserved.
Ferrite magnet business
10
South Korea Japan U.S. Indonesia
Roll out the proprietary technology for innovative production lines to ferrite magnets as well.
Reconfigure production lines to meet the requirements of the automotive sector for high quality components and ultra-thin, small components, which are difficult to manufacture.
3-3. Strategy and Action Plan (3)
Expand scale through lateral roll-out of innovative production line technologies
Roll out capabilities in production technologies to all locations and supply high quality products on a global basis

© Hitachi Metals, Ltd. 2016. All rights reserved.
Strengthen the business base
◆ Introduce innovative production lines at locations in Japan
• Heavy rare-earth diffusion line • Introduce IoT
◆ Roll out innovative production lines globally
◆ Launch a joint venture in China
■ Capital Investment: ¥39 billion (cumulative total for FY2016-FY2018)
3-4. Investment Plans
Investment necessary to achieve innovation
11
© Hitachi Metals, Ltd. 2016. All rights reserved.
1. Business Overview
2. Market Environment
3. Strategy and Action Plan
4. Trend in Business Results and Goals
5. Conclusion
[Table of Contents]
Business Strategy of the Magnetic Materials Company
12

© Hitachi Metals, Ltd. 2016. All rights reserved.
0
50
100
150
200
FY2015 FY2016 FY2018
Revenues (¥billions)
Adjusted operating income (¥billions)
Adjusted operating income (right axis) Revenues (left axis)
105.3
8.0 (8.0%)
100.0
17.0 (12.9%)
6.9 (6.6%)
132.0
15.0
10.0
5.0
13
◆
◆
◆
59%
61%
67%
4-1. Trend in Business Results
Overseas sales as % of total sales
© Hitachi Metals, Ltd. 2016. All rights reserved.
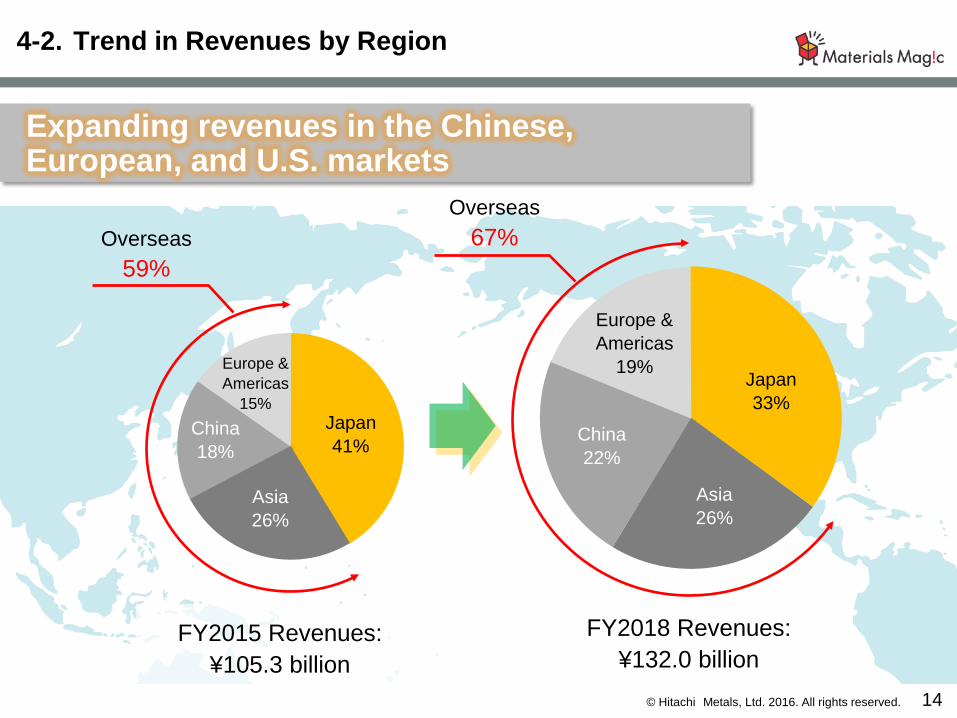
Europe & Americas
15% Japan 41%
Asia 26%
Overseas 59%
Europe & Americas
19% Japan 33%
Asia 26%
China 22%
FY2018 Revenues: ¥132.0 billion
FY2015 Revenues: ¥105.3 billion
14
Overseas 67%
China 18%
4-2. Trend in Revenues by Region
Expanding revenues in the Chinese, European, and U.S. markets

© Hitachi Metals, Ltd. 2016. All rights reserved. 15
Revenues (¥billions)
105.3
FY2015 FY2018 FY2025
(2018 Medium-Term Management
Plan) 2025 Vision
200.0
Reform business to achieve growth Expand business scale
132.0
Become a leading magnet company that helps to develop an ecologically-minded society
4-3. 2025 Vision
Achieving greater growth through innovation in the business base
© Hitachi Metals, Ltd. 2016. All rights reserved.
1. Business Overview
2. Market Environment
3. Strategy and Action Plan
4. Trend in Business Results and Goals
5. Conclusion
[Table of Contents]
Business Strategy of the Magnetic Materials Company
16

© Hitachi Metals, Ltd. 2016. All rights reserved.
FY2018 Plan
Revenues ¥132.0 bn
Adjusted operating income (Adjusted operating margin)
¥17.0 bn (12.9%)
Overseas sales as % of total sales 67%
17
Magnetic Materials Company
Innovate monozukuri to pave the way for growth
5. Conclusion

© Hitachi Metals, Ltd. 2016. All rights reserved. 18
This document contains forward-looking statements—such as results forecasts and management plans—that are not historical facts. All such forward-looking statements are based upon all available information and upon assumptions and projections that were deemed reasonable at the time the Company prepared this document. Changes to the underlying assumptions or circumstances could cause the actual results to differ substantially. The factors causing such differences include, but are not limited to, the following:
• Changes in economic conditions and regulations in the main markets where the Company operates, particularly Japan, the United States, Asia and Europe
• Sudden changes in technological trends • Changes in competitive advantage and the capabilities of the Company and its subsidiaries and affiliates to develop and
commercialize new products and businesses • Fluctuations in the status of product markets, exchange rates and international commodity markets • Changes in financing environment • The capability of the Company and its subsidiaries and affiliates to cope with fluctuations in product supply and demand,
the status of product markets, exchange rates and international commodity markets • Protection of the Company’s intellectual property, and securing of licenses to use the intellectual property of other parties • Changes in the status of alliances with other parties for product development, etc. • Fluctuations in Japanese stock markets
Information on Risks Inherent in Future Projections
© Hitachi Metals, Ltd. 2016. All rights reserved.
Hitachi Metals