QBM117 Business Statistics Probability Distributions Random variables and probability distributions.
date post
18-Dec-2015Category
view
221download
1
Business Statistics - QBM117
Testing hypotheses about a population proportion

Objectives
To test a hypothesis about a population proportion
To practice hypothesis testing with further examples.

proportion
Does the question ask us to test a hypothesis about a mean or a proportion?
npq
ppz
/
ˆ
Testing a hypothesis about the population proportion, p
Exercise 10.48 p357 (9.48 9323 abridged)

5.0:
5.0:0
pH
pH
A
Step 1
Step 2
npq
ppz
/
ˆ
Step 3
05.0

0
Critical value = 0.05
-3 -2.50
-2.00
-1.50
-1.00
-0.50
0.00
0.50
1.00
1.50
2.00
2.50
3.00Region of non-rejection
0.95
1.645
z

5.0:
5.0:0
pH
pH
A
Step 1
Step 2
npq
ppz
/
ˆ
Step 3
645.105.0 05.0 zStep 4
645.1if Reject 0 samplezH

Step 5
npq
ppzsample
/
ˆ
4.1
100/)5.0)(5.0(
5.057.0
/
ˆ
npq
ppzsample
qpnqp ˆˆ 43.0ˆ57.0ˆ1005.05.0 qpnqp
50)5.0)(100(50)5.0)(100( nqnp

0 = 0.05
-3 -2.50
-2.00
-1.50
-1.00
-0.50
0.00
0.50
1.00
1.50
2.00
2.50
3.00Region of non-rejection
0.95
1.645
z
1.4

Since 1.4 < 1.645 we do not reject H0.
Step 5
4.1
100/)5.0)(5.0(
5.057.0
/
ˆ
npq
ppzsample
Step 6
There is insufficient evidence at = 0.05 to conclude that the proportion is greater than 0.5.

proportion
Does the question ask us to test a hypothesis about a mean or a proportion?
npq
ppz
/
ˆ
Exercise 10.70 p360 (9.70 p326 abridged)

22.0:
22.0:0
pH
pH
A
Step 1
Step 2
npq
ppz
/
ˆ
Step 3
05.0

0
Critical value = 0.05
-3 -2.50
-2.00
-1.50
-1.00
-0.50
0.00
0.50
1.00
1.50
2.00
2.50
3.00Region of non-rejection
0.95
1.645
z

22.0:
22.0:0
pH
pH
A
Step 1
Step 2
npq
ppz
/
ˆ
Step 3
645.105.0 05.0 zStep 4
645.1if Reject 0 samplezH

Step 5
90.2
200/)78.0)(22.0(
22.0305.0
/
ˆ
npq
ppzsample
695.0ˆ305.0ˆ20078.022.0 qpnqp156)78.0)(200(44)22.0)(200( nqnp

0 = 0.05
-3 -2.50
-2.00
-1.50
-1.00
-0.50
0.00
0.50
1.00
1.50
2.00
2.50
3.00Region of non-rejection
0.95
1.645
z
2.9
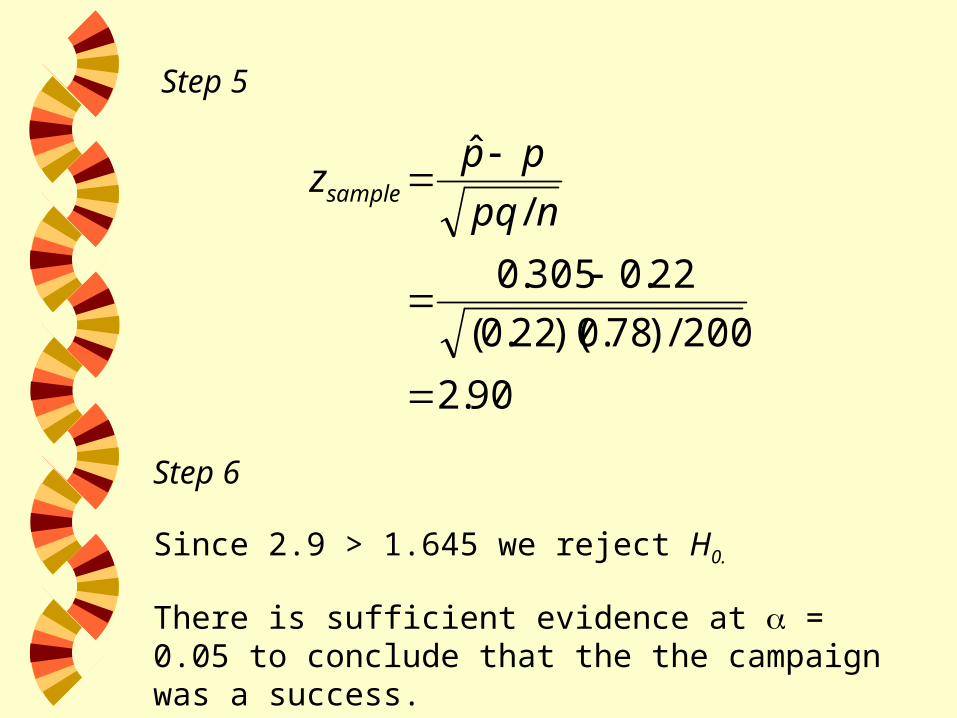
Since 2.9 > 1.645 we reject H0.
Step 5
npq
ppzsample
/
ˆ
90.2
200/)78.0)(22.0(
22.0305.0
/
ˆ
npq
ppzsample
Step 6
There is sufficient evidence at = 0.05 to conclude that the the campaign was a success.

Do we know the population standard deviation, or do we only have the sample standard deviation s?
mean
Does the question ask us to test a hypothesis about a mean or a proportion?
n
xz
/
Exercise 10.64 p360 (9.64 326 abridged)

20:
20:0
AH
HStep 1
Step 2
n
xz
/
Step 3
05.0

0
Critical value = 0.05
-3 -2.50
-2.00
-1.50
-1.00
-0.50
0.00
0.50
1.00
1.50
2.00
2.50
3.00
Region of non-rejection
0.95
z
-1.645

20:
20:0
AH
HStep 1
Step 2
n
xz
/
Step 3
645.105.0 05.0 zStep 4
645.1if Reject 0 samplezH

7.18153 xnStep 5
n
xzsample
/
68.115/3
207.18/
n
xzsample
xn

0
= 0.05
-3 -2.50
-2.00
-1.50
-1.00
-0.50
0.00
0.50
1.00
1.50
2.00
2.50
3.00
Region of non-rejection
0.95
z
-1.645-1.68

Since -1.68 < -1.645 we reject H0.
7.18153 xnStep 5
68.115/3
207.18/
n
xzsample
Step 6
There is sufficient evidence at = 0.05 to conclude that the managers belief is correct.

Reading for next lecture
Read Chapter 10 Sections 10.4
(Chapter 9 Section 9.4 abridged)
Exercises to be completed before next lecture
S&S 10.52 (9.52 abridged)