Business-Skills-for-Engineers-and-Technologists.pdf
376
-
Upload
tazman10102458 -
Category
Documents
-
view
116 -
download
5
description
business
Transcript of Business-Skills-for-Engineers-and-Technologists.pdf


Business Skills for Engineersand Technologists


Business Skillsfor Engineers andTechnologists
Harry Cather
Richard Morris
Joe Wilkinson
OXFORD AUCKLAND BOSTON JOHANNESBURG MELBOURNE NEW DELHI

Butterworth-HeinemannLinacre House, Jordan Hill, Oxford OX2 8DP225 Wildwood Avenue, Woburn, MA 01801-2041A division of Reed Educational and Professional Publishing Ltd
A member of the Reed Elsevier plc group
First published 2001
© Harry Cather, Richard Morris and Joe Wilkinson 2001
All rights reserved. No part of this publication may be reproduced inany material form (including photocopying or storing in any medium byelectronic means and whether or not transiently or incidentally to someother use of this publication) without the written permission of thecopyright holder except in accordance with the provisions of the Copyright,Designs and Patents Act 1988 or under the terms of a licence issued by theCopyright Licensing Agency Ltd, 90 Tottenham Court Road, London,England W1P 0LP. Applications for the copyright holder’s writtenpermission to reproduce any part of this publication should be addressedto the publishers
While every effort has been made to trace the copyright holders and obtainpermission for the use of all illustrations and tables reproduced from othersources in this book we would be grateful for further information on anyomissions in our acknowledgements so that these can be amended in futureprintings.
British Library Cataloguing in Publication DataA catalogue record for this book is available from the British Library
ISBN 0 7506 5210 1
Composition by Genesis Typesetting, Laser Quay, Rochester, KentPrinted and bound in Great Britain

Contents
Series Preface vii
1 Organizations and organizing 1
1.1 The business world 11.2 Structures and links 151.3 Improving the organization’s performance 261.4 Business and society 45
2 Human resource management 58
2.1 The manpower plan – recruitment and termination 582.2 Making the most of people – work design, training
and development 722.3 Rewarding employees – pay and benefits 82
3 Law 104
3.1 The English legal system 1043.2 Product protection 1093.3 Contracts 1253.4 Liability 140
4 Project management 148
4.1 What is project management? 1484.2 Project scheduling – the critical path 1574.3 Dealing with uncertainty 1764.4 Controlling projects 187
5 Money in the organization 196
5.1 Investment appraisal 1965.2 Cost determination 2105.3 Producing the accounts 2285.4 Budgeting and the interpretation of results 240
6 Meeting customer needs 255
6.1 The marketplace 2556.2 Forecasting the future 2696.3 Marketing research 2836.4 Market strategy 292

vi Contents
7 Information technology and electronic commerce 312
7.1 IT and change in organizations 3127.2 Using computer applications efficiently 3207.3 Using the major office applications 3267.4 Industry specific applications 3457.5 Electronic commerce 347
Index 359

Series Preface
‘There is a time for all things: for shouting, for gentle speaking, forsilence; for the washing of pots and the writing of books. Let now thepots go black, and set to work. It is hard to make a beginning, but it mustbe done’ – Oliver Heaviside, Electromagnetic Theory, Vol 3 (1912),Ch 9, ‘Waves from moving sources – Adagio. Andante. AllegroModerato’.
Oliver Heaviside was one of the greatest engineers of all time,ranking alongside Faraday and Maxwell in his field. As can be seenfrom the above excerpt from a seminal work, he appreciated the need tocommunicate to a wider audience. He also offered the advice ‘So berigorous; that will cover a multitude of sins. And do not frown.’ Theseries of books that this prefaces takes up Heaviside’s challenge but ina world which is quite different to that being experienced just a centuryago.
With the vast range of books already available covering many of thetopics developed in this series, what is this series offering which isunique? I hope that the next few paragraphs help to answer that;certainly no one involved in this project would give up their time tobring these books to fruition if they had not thought that the series isboth unique and valuable.
This motivation for this series of books was born out of the desire ofthe UK’s Engineering Council to increase the number of incorporatedengineers graduating from Higher Education establishments, and theInsitution of Incorporated Engineers’ (IIE) aim to provide enhancedservices to those delivering Incorporated Engineering courses and thosestudying on Incorporated Engineering Courses. However, what hasemerged from the project should prove of great value to a very widerange of courses within the UK and internationally – from FoundationDegrees or Higher Nationals through to first year modules fortraditional ‘Chartered’ degree courses. The reason why these books willappeal to such a wide audience is that they present the core subject areasfor engineering studies in a lively, student-centred way, with key theorydelivered in real world contexts, and a pedagogical structure thatsupports independent learning and classroom use.
Despite the apparent waxing of ‘new’ technologies and the waning of‘old’ technologies, engineering is still fundamental to wealth creation.Sitting alongside these are the new business focused, information andcommunications dominated, technology organisations. Both facets havean equal importance in the health of a nation and the prospects ofindividuals. In preparing this series of books, we have tried to strike abalance between traditional engineering and developing technology.
The philosophy is to provide a series of complementary texts whichcan be tailored to the actual courses being run – allowing the flexibilityfor course designers to take into account ‘local’ issues, such as areas ofparticular staff expertise and interest, while being able to demonstratethe depth and breadth of course material referenced to a framework. Theseries is designed to cover material in the core texts which approx-imately corresponds to the first year of study with module texts focusingon individual topics to second and final year level. While the generalstructure of each of the texts is common, the styles are quite different,reflecting best practice in their areas. For example MechanicalEngineering Systems adopts a ‘tell – show – do’ approach, allowingstudents to work independently as well as in class, whereas BusinessSkills for Engineers and Technologists adopts a ‘framework’ approach,setting the context and boundaries and providing opportunities fordiscussion.
Another set of factors which we have taken into account in designingthis series is the reduction in contact hours between staff and students,the evolving responsibilities of both parties and the way in whichadvances in technology are changing the way study can be, and is,undertaken. As a result, the lecturers’ support material which accom-panies these texts, is paramount to delivering maximum benefit to thestudent.
It is with these thoughts of Voltaire that I leave the reader to embarkon the rigours of study:
‘Work banishes those three great evils: boredom, vice and poverty.’
Alistair DuffySeries Editor
De Montfort University, Leicester, UK
Further information on the IIE Textbook Series is available [email protected]/iie
Please send book proposals to:[email protected]
Other titles currently available in the IIE Textbook SeriesMechanical Engineeing Systems 0 7506 5213 6Design Engineering 0 7506 5211 X

1 Organizations andorganizing
Summary
Organizations exist in an intricate, continually changing world, with many pressures on it thatinfluence its behaviour. The organization structures itself to survive and prosper by planning andforming links with other organizations. At the same time, it must present an acceptable personaby working within society’s constraints.
Objectives
By the end of this chapter, the reader should:
� appreciate the complexity of the business world and the forces acting on it and be aware of thedifferent forms of ownership and the processes involved in starting a company (Section 1.1);
� understand why organization structures arise and the links made internally and externally inthe supply chain (Section 1.2);
� understand the application of organizational analysis using methodology such as the EFQMmodel and the Balanced Scorecard (Section 1.3);
� understand the need for ethics in organizations expressed through codes of conductespecially where applied to environmental management (Section 1.4).
1.1 Thebusiness world
This section examines the business world by starting with a look at theinfluencing on a business through the PEST analysis. It then describesthe different types of organizations, including the different legal formsthat can be taken. It goes through the business plan essentials for a start-up situation and then concludes by looking at the external moneytransactions that are made.
The business world is a complex situation. Each organization exists ina world of opportunities and constraints. The best way to describe thisenvironment is to carry out a PEST analysis, to consider the ways thatoutside forces impinge on an organization. PEST stands for Political,Economic, Social and Technological factors. There are a few similaracronyms such as STEP, STEEP, LE PEST C, which cover similarfactors.

2 Organizations and organizing
PEST analysis
This analysis looks at a variety of present factors which presently affectthe business world and gauges the probability of changes arising. Theareas examined include:
Political factors
� Legislative structures of the EC, national and local government andhow they are changing.
� Monopoly restrictions such as the Office of Fair Trading and theMonopolies Commission in the UK and similar structures in the ECcommission and other countries and how they are interpretingevents in a worldwide context as well as domestically.
� Political and government stability – not only extreme cases such asarmed insurrection, but even in the UK a change of governmentmay herald changes in legislation such as deregulation andprivatization of state controlled industries, which affect businesses –as happened in Western Europe in the later decades of the twentiethcentury.
� Political orientations of governments’ attitude towards business,trade unions and the environment often drive tax and othereconomic policies.
� Pressure groups such as Friends of the Earth and the variousconsumer groups can influence not only buyers’ and investors’attitudes, but also government policy. This affects matters such asthe environment legislation and delays in the construction and otherindustries by public enquiries. Other examples include the fuel priceescalator in the UK during the 1990s.
� Taxation and grant policies can change over a period. For example,the various UK and EC grant schemes and changes in policy oncapital allowances for factory construction in areas of highunemployment.
� Employment legislation in areas such as equal opportunities,working time directive, etc.
� Foreign trade regulations both at home and in a country targeted forexports, for example many countries, have restrictions on theimportation of certain goods to protect indigenous industries. Thishappens not just in the developing countries, but also in thedeveloped countries, as can be seen from the regular meetings ofGATT (General Agreement on Tariff and Trade) where discussionshave been ongoing since 1947 without completely eradicatingnational tariffs and quotas.
Economic factors
� Business cycles: These are a natural rise and fall in demand forproducts which have been observed throughout history. They arecaused by a complex mixture of factors and can be quite severe onoccasions, i.e. the depression of the 1930s. Unfortunately thesecycles vary considerably and are not easy to forecast. Governmentshave attempted to do so in the hope of controlling them, withlimited success.

Organizations and organizing 3
� Money supply: Reflects government action on government tax andspend policy and actions such as credit availability controls. Thesaving behaviour of individuals can affect the circulation ofavailable money as can be seen in Japan where there is a hightendency towards saving when future trends look pessimistic.
� Inflation rates, i.e. the rate at which prices of products, services andwages change. This can affect people’s attitude to credit and savingsand the ability of people on fixed incomes to have surplus moneyfor spending. It can affect the flow of imports and exports as theexchange rates vary in relation to other countries.
� Investment levels: Ties in with business confidence about the future,perhaps based on an assumption regarding the stage of the businesscycle. This cycle especially affects the construction and machinetool industries.
� GNP (Gross National Product), i.e. the value of the productiveefforts of the nation as a whole.
� Pattern of ownership – especially trends in same. Examples includehome computers, mobile phones and the growth in car ownership.
� Energy costs: Can affect the cost of making products. Also affectsthe consumer’s attitude towards various products and their func-tions. A good example is the drive for lower fuel consumption incars following the oil price rises of the 1970s.
� Unemployment. Is a double-edged factor. Low unemploymentmeans a healthy demand from consumers, but it also leads to ashortage in certain key skill areas which tends to drive up wagecosts for these jobs.
Socio-cultural factors
� Demographics, i.e. the make-up of the population – the age groups,where they live, etc.
� Lifestyles: As well as fashion trends, this also looks at habits suchas eating out, holiday preferences, central heating, etc.
� Education levels: This will determine the ability of staff to take onnew ideas, equipment and processes. It will also affect job seekers’expectations towards company policy and pay.
� Consumerism: This reflects the growing power of special interestgroups towards policies. Consumer panels often advise the regulatoron privatized industries regarding service delivered and allowedcharges.
Technological factors
� Levels and focus of R&D expenditure within the industry andespecially by your competitors.
� Speed of technology change in processes and products.� Product life cycles.
In addition to the PEST analysis, there are always the competitors’actions which will directly affect a business in its relationships with itscustomers. Chapter 6 deals further with the market and an organization’scompetitive position therein.
4 Organizations and organizing
Organizations
Organizations come in many shapes and forms, from the one-manbusiness to the large multinationals employing thousands of people inmany countries. Although most are profit making there are also somewhich do not have making a profit as one of their aims, such as theNational Health Service, one of the largest employers in the UK.
For a group of people to become an organization requires more thanjust casual contact – it requires a formal relationship of the participants inworking towards a set goal. So what are the goals for organizations?
There are probably as many goals as there are organizations. The firstone must be continual survival, and money is the important component inthis. Even all the not-for-profit organizations such as charities, tradeunions, the civil service, the National Health Service and state education,which are very large organizations, must have money to complete theirfunction and ensure their continued existence.
In this textbook, we are mainly considering the organizations whichsupply services or products for a profit. If the profit does notmaterialize, then they will have to cease trading – either voluntarily orby being put in the hands of the official receivers, i.e. by being madebankrupt.
It is therefore important to recognize the legal status of thosecompanies you deal with – especially if you are supplying them withgoods on payment terms. It is illegal for a business to continue to tradewhen they know they cannot meet existing debts, but that fact does notguarantee your payments will be made. You need to determine your ownrisk.
Types of ownership
Sole trader/proprietor
The basic one-person business – although it may employ others. This isthe majority of businesses where one person raises the investmentcapital and takes all the profit. The owner also takes all the risk andremains personally liable for the business debts.
Most small businesses do not grow and many fail because:
� Many ideas are not commercially viable.� Many owners have little commercial understanding and training.� Capital raised is insufficient to cover the initial time until customers
build up.
This size of business does, however, have its advantages:
� Personal involvement of the owner.� Quick decision making and action.� Normally communications are easy.� Details of earnings required by tax authorities are limited, in effect
they are treated as self-employed and do not require to submitaudited accounts.
The latter does not mean that sole traders should not keep detailedaccounts for their own purposes.

Organizations and organizing 5
Partnership
Basically similar to the sole proprietor, but involving more than oneperson – up to twenty people can be partners, although more are allowedin certain professions. All partners have the same ultimate liability as thesole trader, even a sleeping partner, i.e. someone who contributes tofunding but takes no part in the day-to-day management of thepartnership. Working, and sleeping, partners do not necessarily take thesame share of the profits, but cannot take a secret share.
This is a common arrangement amongst professions such asaccountants and consultant engineers. It has the advantage of more skillsand money available initially.
Again the details of earnings submitted for tax purposes are limitedalthough it is highly likely that detailed audited accounts will berequired to demonstrate a proper share out of the profits.
The registered company
This is an artificial legal individual under the law, i.e. it is legallyseparate from its owners. There are three types:
� Unlimited company: Whilst still a separate entity, the owners retainfull liability for the business debts. This has advantages in certaincircumstances that full accounts need not be disclosed.
� Limited company: The owners have a liability for debts only to theextent of their agreed shareholding. If they have not paid for all theirshares when the company ceases trading, they will have to pay up– but only for the amount they have outstanding. A limited companycan be private, or public:– Private limited company: The shares for this type of company
cannot be offered on the stock market, but it is still a limitedcompany. It has the advantage that owners can take decisionswithout considering how their share price fluctuates on the stockmarket, but has the disadvantage that selling of shares is morecontrolled, i.e. they cannot be offered on the stock market onlyby personal contact with the buyer.
– Public limited company: The shares for this type of company arebought and sold on the stock market and as such the share pricehas an influence on the operation of the company. Legally thesecompanies are controlled by their owners, i.e. the shareholders,but in practice the day-to-day operation is very much in thehands of the company directors.
The accounts of registered companies do need to be audited independ-ently annually and submitted for company tax purposes (see Chapter 5).
The limitation of liability does make dealing with a limited companymore risky, but most companies do have a long life, therefore as long asyou keep track of the company’s performance these risks can be keptsmall.
Without this limitation in liability, it would be extremely difficult topersuade investors to risk participation in companies. However, it is alsosaid that the limitation deprives creditors of a full comeback if thecompany is mismanaged – after all the shareholders are legallysupposed to be the ultimate controllers.
6 Organizations and organizing
Setting up a business
Sole traders and partnerships are relatively easy to set up as they requireno legal stages to come into existence. They do, however, requireregistration for tax, VAT (Value Added Tax) and National Insurancecontributions. The main problem with their formation tends to be theraising of capital.
Although it is not a requirement, most partnerships do complete alegal Deed of Partnership, i.e. a personal contract between the partners.This should spell out their relationship on matters such as capital input,share of the profits, management of the partnership, signatories forcontracts and cheques, and how partners are changed, e.g. addition of anew partner or a present partner leaving the partnership.
Where a partnership wishes to trade under a name other than that ofthe partners, they need to have the name registered with the Registrar ofBusiness Names.
When forming a company, the procedure is more arduous andregistration under the Companies Act 1980 is required. The followingneed to be presented.
Memorandum of association
This is a document explaining the external workings of the company forprospective subscribers. It must include:
� The company name – including Limited or Ltd if a limitedcompany.
� The registered office.� The objects clause: This sets out the purpose that the company is
being formed to do. Legally this limits what the company can beinvolved with and may make some contracts void, although this isoften mitigated if a contract has been entered into with good faith.
� Limited liability – if appropriate.� The nominal share capital at registration, i.e. the amount available
and the unit of issue, e.g. £100 000 in £1 shares. Note a privatecompany has no minimum amount, but a public company has anauthorized minimum of £50 000 under the Companies Act, althoughthis need not be all issued, i.e. sold, at the start-up. This sectionshould also denote the type of shares.
The articles of association
This document shows the internal workings of the company, i.e. its rulebook. It covers matters such as annual meetings, election of directorsand some matters relating to the day-to-day management.
The costs of setting up a company, even a limited company, are quitesmall and the steps are simple, although it is advisable to employ lawyersskilled in this type of work to avoid unnecessary complications later.
Starting up your own company
Every organization should be working to a moving series of businessplans which lay out the direction in which it proposes to move over thefollowing years. These tend to be split into short term (tactical) for a year

Organizations and organizing 7
or so and longer term (strategic) for five to ten years. Even for the long-term plans, we need to prepare matters so that there is a firm base.
A business plan is especially necessary for the start-up situation as itcan be the basis on which it may attract financing. Many of the tools yourequire to complete a business plan are contained within the chapters ofthis textbook and the main pertinent chapters are shown with theheadings of the plan.
For example, when you decide to start up a new business you willneed to approach a bank to open a business account, even if you are notborrowing or arranging credit facilities through them. The bank willwant to see your business plan before it decides on taking you as acustomer.
There are many packs available from banks which guide you throughthe process, and you are advised to get a few from various banks. In themain they will require a properly presented plan which will contain thefollowing details.
A summary of the plan
This will outline what the business is and the market potential for itsproduct or service. It should state the dates of starting and include aprofit forecast and what additional investment is required. If you havebeen trading, it should include the accounts for that period.
Management (see Chapters 1 and 2)
Management should denote the legal form of the business, i.e. soletrader, partnership or limited company, including the Memorandum andArticles of Association for the latter.
Starting with yourself you should detail your proposed role in thebusiness and your business record and achievements, especially thosedirectly related to the present business. The latter should give a clearidea of past responsibilities, and personal skills and competence.
You should do the same with any partners and other key skilledpeople involved, so that the bank can see the breadth and depth of themanagement. This should also indicate what management weaknessesexist and what is planned to address them.
Product or service (see Chapter 6)
This should describe your product or service in clear simple terms. If itis a complex product then you should include the technical detail in aseparate appendix. Any unique selling points and price need to behighlighted, including any after-sales requirements.
A brief summary should be made of your nearest competitor’sproducts/services and price for their nearest equivalent offering. Thisshould indicate why you believe your offering can compete.
Market description (see Chapter 6)
Needs to describe:
� Who are the potential buyers – by size, number, business sector,etc.?

8 Organizations and organizing
� Is the market static or changing?� Are there identifiable sectors which require different offerings?� How often does a buyer purchase your product, i.e. a single sale or
repeat customers?� What are the market qualifying and order winning criteria?� Number of competitors and their position in the market.� What your selling and advertising plan will be, including who will
be doing the sales contacts.� What are the sales targets, tied to dates to be achieved?
Operations (see Chapter 5)
Here you need to detail the premises where you intend to operate in andtrade from and the associated equipment and vehicles you need topurchase, or already possess. The age and expected usage/life may needspelling out with a replacement policy if equipment is second-hand.
This should include any processes that will be operated at particularlocations, so that you clearly have a right to do so, and have consideredenvironmental matters such as safety, noise and other nuisances.
It will not be sufficient to say merely that you propose to have yourproduct entirely produced and packed by a sub-contractor. You mustinclude actual quotes if this is proposed and show how you will preventyour supplier marketing a similar product.
Record system (see Chapters 5 and 7)
As it is important that a close watch is kept by the company over matterssuch as cash flow and outstanding debts, it is imperative that youdemonstrate that proper records will be kept. The intended use ofsoftware would look good here.
Finance (see Chapter 5)
You will need to state where you are getting the funds to start yourbusiness. In addition to your own money, you may be borrowing fromfriends and family or perhaps a venture capital company if you have agood product or service. Banks like you to be risking your own personalmoney, especially if you wish to borrow some extra from them.
You will have to include as appendices cash flow and budgeted profitand loss statements for the next two years. The first year normally needsto be on a month-by-month basis, but the second year may only need tobe on a quarterly basis. This should indicate what assumptions havebeen used to arrive at the figures.
Costs must be clearly identified in value and timing. These willinclude:
� Source of capital and repayment and interest terms.� Start-up and development costs.� Premises cost including any lease terms.� Equipment purchase and running expenses.� Material costs, both direct and other consumables, including any
arrangements for trade credit.� Wage costs and basis of application. Include your own anticipated
drawings.

Organizations and organizing 9
� Cost of services such as telephone, lighting, heating and water/sewage.
� Arrangements for VAT, tax and National Insurance payments.� Vehicle purchase and running.� Miscellaneous expenses such as stationery and postage.� Insurance of persons, property, employees and product liability.� Pension arrangements.
Legal matters (see Chapters 1 and 3)
In addition to the particulars of what type of business it is, i.e. soletrader, partnership or a company, you will need to demonstrate you haveconsidered all other legal aspects such as:
� Health and safety requirements.� Environmental/Trading Standards requirements.� Registration for VAT and National Insurance contributions.� Income tax arrangements.� Company tax arrangements, including audit proposals.
Owners’ objectives
Although this may appear an extra, it is often necessary to include thelong-term plans of the owners to see how the business fits in withthis.
Who to consult
There are many sources who it would be useful to consult both beforeand when starting a business. Some offer assistance with training andothers will arrange the appointment of mentors to aid you through yourstart-up. The sources include:
� Business Links (in Scotland Business Shops).� Training and Enterprise Councils (TECs).� Local enterprise and development agencies.� Department of Trade and Industry.� Banks.� Accountants.� Solicitors.� Other businessmen.
The last is a very useful source of potential pitfalls and advice on manymatters. It could prove useful to join a local small business club to shareproblems with others – and incidentally the added possibility of pickingup business.
Money transactions
In Chapter 5 we examine how the organization looks at money withinitself, i.e. investment appraisal, costing, book-keeping and budgeting.What we are concerned with here are the financial transactions that theorganization has with the outside world.

10 Organizations and organizing
In a business contract, there must be consideration, i.e. in return for aproduct or service something of value will be given in return. In pasttimes, a system of barter did exist, but money became the universalmedium of exchange many centuries ago. It could be said that if moneydid not exist, then neither would the industrial world, as the barter systemcould not accommodate the many transactions which take place today.
The organization will have to make the following payments out oftheir funds on a continual basis and needs a detailed record of them andany associated paperwork:
Pay to employees, after deductionsExpenses to employees. Note petrol allowances can vary on a mileagebasisDividends to ownersPayment to suppliers of products, services and facilities, includingdetails of delivery notes and credit for returned purchasesPayments under leases for plant or premisesPayment for plant and equipment purchasedPayment for service cover and spare parts usedPayment to sub-contractorsPayment to professional advisersRoyalty paymentsRent and industrial ratesCompany taxEmployer’s National Insurance contribution (NIC)Employer’s contribution to pension fundsInsuranceOwner’s income taxStatutory Sick PayStatutory Maternity Pay
In addition organizations act as a collecting arm of the government bycalculating out, collecting at source and paying to the government thefollowing:
Employees’ PAYE income tax contributionsEmployees’ National Insurance Contributions (NIC)Value Added Tax
Income tax, NIC and VAT
Employees have income tax and National Insurance contributionsdeducted from their wages under PAYE, i.e. pay as you earn.Calculation of income tax and NI is complex and varies from year toyear. The amounts due are based on a stepped percentage of the payafter reaching a base figure. The percentages and bases are different forboth systems and ready reckoning tables are used which are easilyincorporated into computer software. However, this means that thesoftware has to be updated each year with changes introduced in theannual government budget.
For many years there have been moves to amalgamate employees’income tax and NIC and this is now going ahead.

Organizations and organizing 11
Income taxAlmost everyone has to pay this on their total income less any taxallowances. If you are an employee the government works out your taxallowance and gives you a code. Your employer works out your incometax based on this code which gives you an amount before you pay tax.On the remainder you pay a progressive tax, i.e. an initial rate for a setamount, then a variety of increasing rates above that.
Example using 2000–2001 rates:
Earnings £32 000Tax allowance £6 000Taxable pay £24 000
10% on 0–£1500 10% × 1500 = £15022% on £1501–28 400 22% × 22 500 = £495040% on over £28 400 NilTotal due = £5200
This figure is not calculated at the end of the year, but has to bedone on each pay day.
If you are self-employed, i.e. a sole trader or a partner, you haveto agree with the tax office what allowances you can offset beforepaying tax. If you are self-employed, you can elect to calculate outthe tax due yourself.
You may also be due to pay income tax on other earnings suchas capital gains.
National insuranceWith National Insurance there are different bases for calculating thecontributions due from the employee, the employer and the self-employed. If you are an employee in an organization and earn additionalmoney on a self-employed basis, you may have to pay both as anemployee and self-employed.
Class 1 contributions are paid by the employee and the employer onemployee earnings in stepped stages between two amounts. Thesecontributions are not the same. The contributions further depend onwhether the employee is contracted out or into the government SERPS(State Earning Related Pension Scheme). Where there is an occupa-tional pension most employees will be contracted out.
Example 1.1.1Example of Class 1, contracted-out, contributions using2000–2001 figures:
Employee pays Employer pays
Employee’s earnings: £32 000
Up to £3948 0% = 0 0% = 0£3948 to £4380 8.4% = £36 0% = 0£4380 to £27 828 8.4% = £1970 9.2% = £2157£27 828 and over 0% = 0 12.2% = £509Total due £2006 £2666
Again this calculation has to be done on each pay day.
12 Organizations and organizing
Self-employed people pay two contributions. In 2000–2001, thesewere Class 2, a fixed amount of £2, and Class 4, equal to 7% of taxableincome between £4385 and £27 820. This appears to be slightly morethan an employee, but is based on taxable income whereas theemployee’s is based on total income. Note that if you are self-employedyou will not be eligible for all the same state benefits as anemployee.
VAT
The VAT payment (standard rate is 17.5%, but can be 5% or 0%)appears initially to be more simple. You first keep records of all the VATyou pay on items and services purchased – it normally appears as aseparate amount. Secondly you keep a note of all the VAT you chargeyour customer. You pay the government the difference if you chargemore than you paid, or collect a refund if you pay more than you charge.This has to be done quarterly unless you are a very small business.
The difficulty is that you may not be registered for VAT. Non-registration is a choice you make if your turnover is below £52 000, notethis is turnover – not profit. You may also be zero rated or exempt incertain dealings. In non-registration and exempt cases, no VAT ischarged and you cannot claim back any VAT paid.
As this demonstrates, calculation of income tax, National Insuranceand VAT can be complex. There are penalties attached for late payment,avoiding payment or supplying false information – hence the need toemploy a good accountant.
Payment can also be collected and passed on for items such as:
Employees’ pension fund contributionsTrade union subscriptionsSAYE (save as you earn) contributionsCharity deductionsWage attachment orders for a set amount to be paid to another person,e.g. for child support
In addition, the organization has to keep tabs on all incoming money,including any VAT paid with the account, money owed to them fromtheir customers or suppliers (i.e. by credit notes), and any grants orsubsidies due from central or local government.
The control of customers’ credit is especially important to ensure thatmoney is received for products despatched or services rendered. Thereare several credit reference agencies which you can use to check out thecredit worthiness of potential customers. Remember that this needs to beperiodically rechecked to ensure that the credit rating remains inforce.
The wait for payment can be quite long. Your invoice may state amaximum period but it is common for this to be exceeded, sometimesby months. This is a common reason for small companies to have cashflow problems. The government has attempted to reduce these delaysand has passed a law limiting the amount of credit taken by latepayment. However, if you are a small business with a lot of your incomecoming from another business, you are in a weak position to forcematters. You may lose future orders.

Organizations and organizing 13
It is possible to factor out the receivable accounts, i.e. get anotherorganization to do the actual collection. You will then receive money duequickly from the agent, but at a cost. The factoring agent will charge a fee– usually up to 2.5% of total turnover.
If you are dealing directly with the general public and offer creditterms, you need to follow the conditions laid down in the ConsumerCredit Act 1974. This includes being licensed under credit controlregulations.
This means that the organization has to keep careful notes of allcollections and payments as they become liable for any mistakes made.Therefore the organization has to know all the regulations and lawsinvolved so that no penalties are incurred, this is where the realknowledge of the accountant proves valuable.
In order to keep tabs on the money flow, the use of accounting softwaremakes it easy to ensure that all transactions are recorded, an easy audittrail is made and end-of-year summaries such as profit and loss accountsand balance sheets are readily compiled. Figure 1.1.1 shows show screenlayouts from a PC accounts system for small companies.
Problems 1.1.1
(1) We are mostly members of a family. So are we members of alegal partnership in this case?
(2) Do you consider it fair that a company can go bankruptthrough management paying themselves excessive salarieswith no comeback against their property?
(3) What new business do you feel may succeed in your localtown?
(4) Do you think that registering for VAT as a small business, andcharging customers this extra, puts you at a disadvantagecompared to another business not being registered and notcharging?
(5) As practice for operating accounts in a small business, trykeeping a detailed record of personal income and spendingover a three-month period.
1.2 Structuresand links
In small organizations, people often tackle a wide variety of tasks. As theorganization grows, people tend to deal with a limited number of theavailable tasks. This leads to problems in communications and focusingwhich organizational structures attempt to deal with. Links andrelationships now extend from inside the organization outwards towardsits suppliers and customers.
Internal structures
When organizations start, they have very few people – often only one, theowner. This means that this person (people) has to do every job that arises.However, as organizations grow, the volume of work also grows. It isnatural then that people stop doing just any of the many tasks that ariseand start to concentrate on doing only a selection of the tasks, i.e. adivision of labour takes place.
This division of labour is important to the efficiency of the organizationas it enables employees to become skilled in doing a limited number of

14O
rgan
ization
s and
org
anizin
g
Figure 1.1.1 Screenshots from PC-based accounting system. (Reproduced courtesy of Sage Group plc.)

Organizations and organizing 15
tasks through continual repetition, i.e. they undergo a learning curve.They then have the opportunity and motivation to seek ways to becomemore knowledgeable in these tasks so that they can perform them to ahigher level and hence become more useful to the organization.Sometimes it may be so they can become more secure in their jobs, oreven gain more influence within the organization.
As the organization continues to grow, the work for these individualsincreases; individuals become sections and then departments within theorganization. People are then employed with a deeper level of knowledgeand experience in these particular areas. This, unfortunately, also meansthat individuals have a smaller overall breadth of knowledge about all thejobs being done within the organization.
These departments tend to fall into recognizable functional areas.However, just as people grow up differently, so does each organization. Adepartment in one organization therefore often does not cover exactly thesame detailed functions as a similar named department in anotherorganization.
We are going to examine the typical functions, i.e. jobs that need to bedone within any organization. Most organizations start with two basicfunctions:
� Selling the products and/or service.� Making the products and/or providing the service.
From within these grows a multitude of other functions:
Cash managementPurchasingStock keepingProduct design and developmentEstimation of cost and pricesProcess developmentQualityRecruitmentDisputesTrainingMaintenanceTransportationInformation technologyLegal
The list will continually grow and diversify as the organization increasesin size. There is a disadvantage in too much specialization as it createsproblems of communication and ensuring that everyone is moving in thesame direction. Large organizations therefore require the integration ofmanagement to:
� Plan ahead.� Give directions to the separate groupings.� Ensure groups are operating correctly, i.e. controlling.
Each organization finds different structures to link these together. This ispartially determined by the industry and their market, and partially by thecharacteristics and competencies of their staff as they are growing. If welook at an organization’s environment, as in Figure 1.2.1, we see thatthere is a multitude of influences and constraints on how they operate.

16 Organizations and organizing
This also has an effect on the growth and composition of their internalstructures as they form interfaces with the outside world.
Historically the only organizations that were large enough to haveseparate functions within them were governments and armed forces.When other organizations became large enough to support internalspecialization, they tended therefore to imitate those models available.This gave rise to the concept of line and staff posts (see Figure 1.2.2),
where line personnel are directly in the chain of command and staffpersonnel are in an advisory position.
The first stage in internal structuring arises with the change fromanyone doing any job to people having set jobs.
As the organization grows then the number of people performingsimilar duties grows. If this is only two or three they may be still part ofthe overall team. Once numbers grow it becomes difficult for theremainder of the overall team to communicate with each person andusually one person becomes the communication focus and a specificsection is formed. With continual growth this focus becomes that person’smain role and you now have a section leader, or supervisor. This role thenhas responsibility for the productivity and quality of the section.
If the number in the section continues to grow, then the span ofcontrol may become too much for one person. You are then left with achoice:
� Do you form two/three separate sections, splitting the dutiesbetween these sections? or
� Do you retain the section as a whole under the present leader/supervisor, but with others put in a similar, but junior role reporting
EC Commission
Local government UK government
New technology Advisors Distributors
Material suppliers The organization Customers
Plant and equipment suppliers Competitors
Local community Pressure groups
Trade unionsFigure 1.2.1 The environmentof an organization
Figure 1.2.2 Line and staffrelationships. (Line relationshipsare indicated by the full linesand staff relationships by dottedlines)

Organizations and organizing 17
to the leader/supervisor? The latter would then be classified as amanager.
Your choice is to increase the number of different junctions or to addlevels of management. However, there probably will not be too muchdifference eventually as you may have to have someone co-ordinatingthe several separate sections!
In this way as the organization grows, the levels of management andtheir span of control change. Two problems tend to arise in thissituation:
� The sections become specialized and lose focus on the organiza-tion’s overall objectives.
� Top management become increasingly distanced from the detail ofthe day-to-day operations.
This has led to most organization’s changing their internal structure totry to keep direction and focus. Some organizations appear to becontinually changing their internal structures – perhaps on the basis thatby pure chance, the ideal must be hit on sometimes. Many centuriesback, a Roman general was reported to have complained that thereaction to any problem is to reorganize.
The various structures that can be seen are:
� Entrepreneurial as in Figure 1.2.3.� Functional as in Figure 1.2.4: The actual make-up of the functions
will be dependent on the importance of different tasks. For example,the purchasing function may be under accounts in one organization,but under operations in another. The former may give betterfinancial management, the latter better ties to productionschedules.
� Regional as in Figure 1.2.5: Here the lower levels could be amixture of any of the other structures. In sales, it is often a lowerlevel copy of the main structure.
� Product as in Figure 1.2.6: This is common where products arediverse and focus is required at product level.
� Business sub-units: Each smaller unit is an organization by itselfwith its own internal structure. Very common in conglomerates.
� Matrix as in Figure 1.2.7: Here there are several main differentfocuses at work. Can create problems when each focal point isunder conflicting pressure from the different axis.
� Centralization: Here the centre attempts to control certainaspects.
� Decentralization: Here the centre plays a specialized role. This isnormally financial, but could include research and developmentactivities.
There is no universal panacea that an organization can just impose onan existing structure. Any change must be well thought through andtested, and needs very careful management during implementation.
The problems in communication and different viewpoints that tendto develop with specialization by functions have led many organiza-tions back to reforming project teams for various tasks with memberscoming from the different functions. In effect they are reforming theentrepreneurial structure.
Figure 1.2.3 Entrepreneurialorganizational structure. (TheChief Executive is at the centreof all decision making)

18 Organizations and organizing
Figure 1.2.4 Functional organizational structure
Figure 1.2.5 Regional organizational structure
Figure 1.2.6 Product organizational structure
Figure 1.2.7 Matrix organization. (The factory managers have to satisfy the requirements of the competingbrand managers. Where problems arise they may have to go to discussion between the UK operationsdirector and the European sales and marketing director)
UK operations director
Glasgow factory manager Bristol factory manager Sheffield factory manager
Europeansales andmarketingdirector
Product A brand manager X
Product A brand manager X X
Product A brand manager X X X
Product A brand manager X X

Organizations and organizing 19
This leads to three advantages:
� Communications and feedback are quick.� People in close working relationships tend to be more prepared to
listen to the differing viewpoints of others and adjust their ownstance.
� The team can easier come to an agreed focus on the task.
This has led to substantial cuts in project times and tends to produceresults which are both effective and more acceptable to the peopleinvolved.
Supplier relationships
In many modern manufacturing industries, the manufacturer of thefinal product is just an assembler of bought-in components andassemblies. In these companies, the cost of the bought-in items canoften be more than 50% of the direct cost of the products.
This means that purchasing cannot be thought of just as a cost. Itmust be managed in a way that maximizes its potential to contributetowards profit. This means sourcing the best suppliers that fit into theorganization’s operational demand of cost, time, and quality (seeChapter 6 Section 4, for a discussion on order-winning criteria andcompetitive analysis).
In addition there are many recent adoptions within organizations ofISO 9000 quality registration and changes in material procurement toa JIT (just-in-time) system that increase the need to have high qualitysuppliers delivering error-free items direct into the productionprocess.
ISO 9000 Quality System Registration
ISO 9000 refers to an internal Quality Assurance Systemwith procedures covering all aspects of managing design,procurement, materials, processing and inspection. To beregistered under the scheme requires the organization toprove it is using high quality suppliers – ideally alsoregistered organizations.
The objective of the JIT methodology is to operate with a minimumof internal stock. This means that the factory makes only what isrequired for immediate delivery and only brings in materials andcomponents required for immediate use by the process lines. Thisincoming material needs to be of high quality and adherence todelivery times is very important.
It used to be sufficient to have incoming goods retained in areception area and then to have inspection carry out either 100%inspection or apply an acceptance sampling scheme to batches of
20 Organizations and organizing
incoming material and reject batches that exceeded a set number ofdefects. Nowadays, this method cannot cope with the stocklessoperations with their tight time schedules and high quality demands.The most important process of ensuring one has suitable materialavailable as and when is to carry out a complete assessment of allsuppliers’ abilities to supply the correct material.
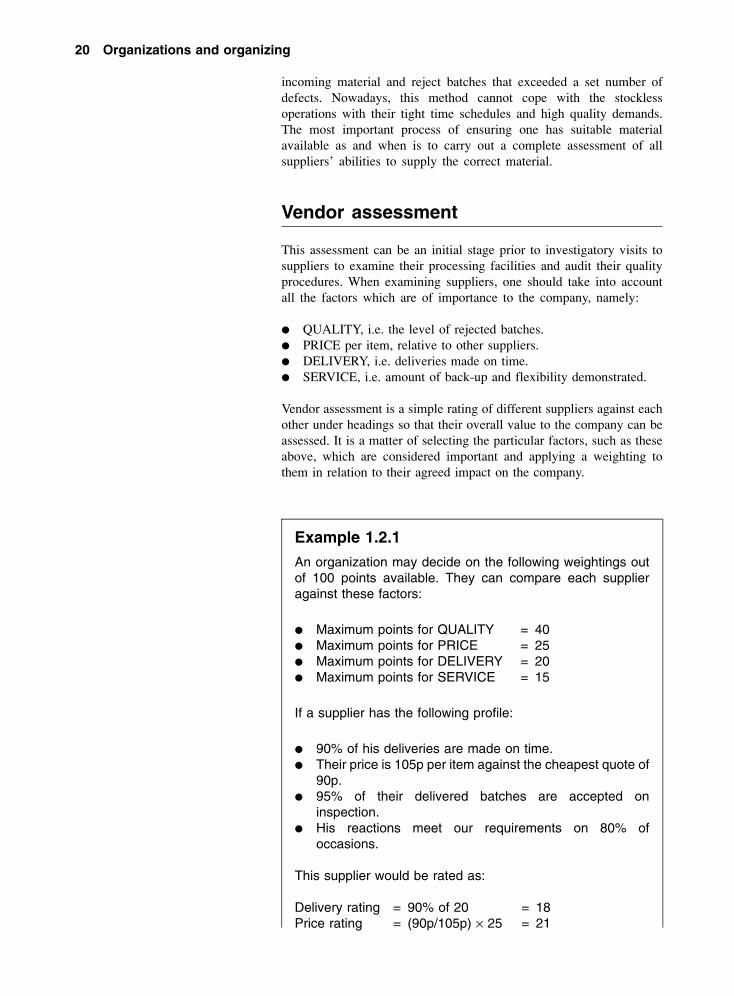
Vendor assessment
This assessment can be an initial stage prior to investigatory visits tosuppliers to examine their processing facilities and audit their qualityprocedures. When examining suppliers, one should take into accountall the factors which are of importance to the company, namely:
� QUALITY, i.e. the level of rejected batches.� PRICE per item, relative to other suppliers.� DELIVERY, i.e. deliveries made on time.� SERVICE, i.e. amount of back-up and flexibility demonstrated.
Vendor assessment is a simple rating of different suppliers against eachother under headings so that their overall value to the company can beassessed. It is a matter of selecting the particular factors, such as theseabove, which are considered important and applying a weighting tothem in relation to their agreed impact on the company.
Example 1.2.1
An organization may decide on the following weightings outof 100 points available. They can compare each supplieragainst these factors:
� Maximum points for QUALITY = 40� Maximum points for PRICE = 25� Maximum points for DELIVERY = 20� Maximum points for SERVICE = 15
If a supplier has the following profile:
� 90% of his deliveries are made on time.� Their price is 105p per item against the cheapest quote of
90p.� 95% of their delivered batches are accepted on
inspection.� His reactions meet our requirements on 80% of
occasions.
This supplier would be rated as:
Delivery rating = 90% of 20 = 18Price rating = (90p/105p) × 25 = 21

Organizations and organizing 21
Quality rating = 95% of 40 = 38Service rating = 80% of 15 = 12Total rating = 89
We then can compare this supplier’s total rating against allother suppliers for the same material or components todecide on which better serves our needs. It can also be usedin conjunction with selected suppliers to show where theirtotal service is behind their competitors to drive up thegeneral rating of all suppliers combined. We wish to end upwith a few high value suppliers.
Vetted suppliers
Once suppliers have been selected to be the main, or sole, supplier andwe are convinced that the quality of their supply consistently meets ourrequirements, it should be possible to reduce the need to inspect theirincoming goods.
It will still be necessary to monitor their quality which can bepartially from occasional quality audits and partially from records oftheir material/components service within the plant and in service withour customers. To ensure that this can take place it is important to ensurethat full traceability of all materials used is possible and maintained.
When examining a potential supplier, the areas which should beexamined are:
Management
� Organization structure and responsibilities.� HRM policies on recruitment, training, promotion, health and
safety. Can be judged on number of disputes, stability/turnover,absenteeism and accidents.
� Customer satisfaction statistics.� Business integration – especially towards their customers.� Supplier management.
Delivery
� Delivery system integration with processing.� On-time manufacturing systems – percentage of orders late, average
days late statistics.� Packaging, shipping and receiving operations.
Technology
� Process development, e.g. age of plant, skill level of employees.� Product design process.� Manufacturing and test equipment.

22 Organizations and organizing
Quality
� Quality policy and procedures.� Process control, e.g. measuring automation and use of statistical
quality control.� Problem prevention, detection and correction procedures.� Supplier quality process and audit statistics.
Cost
� Labour and materials allocation systems.� Rates used for accounting and other costs:
– Performance statistics on processes.� Processes for estimating costs on proposal and pricing policy.� Financial condition of the organization.
Technical support
� Organization.� Logistics support development.� Field maintenance support.
This will give an indication of the suppliers’ ability now. It must becontinually addressed so that improvements are made to increase qualityand lower costs.
The supply chain
Supply chains
As in Figure 1.2.8, there is a complete supply chain from the basic, orprimary industries, through to the ultimate consumer through which wecan see material progressing and changing shape. A few companies arevertically integrated and own parts of their supply chain, but this israre.
Every organization supplying services or products exists within amixture of different supply chains as in Figure 1.2.9. Some of thesechains will be of great importance to the organization; others will be lessso. The organization should identify which chains are important, andthen fully engage with them to gain the maximum advantage forthemselves.
Today the supply chain for many products is worldwide andorganizations’ destinies are becoming more interwoven and interde-pendent in an international setting. The earthquake in Kobe, Japan, in1999, for example, caused shortages in components for organizationsthroughout the world.
In 1961, a model demonstrating the effect of a change in demandrippling back through the supply chain was demonstrated by J. M.Forrester in Industrial Dynamics. This showed that the further upstream,i.e. away from the end user, the higher the fluctuations in demandexperienced.

Organizations and organizing 23
The Forrester Effect
To show the effect of a change in demand of 10% from theend customer on the subsequent participants in the supplychain, a simple example of the flow of orders and products isshown in Table 1.2.1. The rules in the table are:
Each point in the chain aims to have at each period-beginning, a stock equal to the orders received during theprevious period.
� Orders passed on to the next stage in the supply chainare based on a sufficient quantity to bring the closingstock up to the desired opening stock quantity for the nextperiod.
� Orders are placed at the end of a period and areinstantaneously delivered so that the items are availablein the opening stock for sale in the next period.
� Stock shortages are allowed and taken off the quantitydelivered.
The first period shows a stable market, therefore openingstock for each stage is set at 100 units. As 100 units are sold,the closing stock drops to zero and an order is placed for 100units at each stage.
In the second period, the end sales reduce by 10 units to90 units. The retailer therefore resets his stock target to 90units (same as orders received). Order quantity thenbecomes 90 – 10 (closing stock), i.e. 80 units.
The manufacturer receives an order for 80 units andtherefore has a closing stock of 20 units left from the openingstock of 100 units. As the new opening stock is 80 the orderplaced for components is 60 units, i.e. 80 – 20 (closingstock).
Figure 1.2.8 Supply chain
Figure 1.2.9 Mixture of supply chains. (Where multiple arrows are shown there can be several differentsupplier-customers involved)

24 Organizations and organizing
The component supplier receives the order for 60 unitswhich leaves them with a closing stock of 40. They reset theiropening stock to 60 (as sales) and therefore make only 20units.
In the next period, as we can see from Table 1.2.1, both themanufacturer and the component supplier have a stock-out,shown as a minus figure in the closing stock. This means theywould have to make special arrangements (i.e. incur extracosts) to quickly make these.
As can be seen in Figure 1.2.10, a change is doubled ateach stage initially. Thereafter the further up the supply chainthe more severe the fluctuations become before settlingdown as the effect of the change is dampened after fourperiods.
As all markets have fluctuations, continual small changes in enddemand will tend to send constant ripples through the whole supplychain, forcing the lower level suppliers to continually vary theirmanufacturing orders much more radically than the actual changes inthe end demand.
In order to level out these disturbances large amounts of safety stocksare installed to buffer the effect and ensure no stock-outs arise. Thismeans a large amount of safety stock at all points in the chain:
� Retailers would hold stock in case the manufacturers failed todeliver sufficient products.
� The manufacturer would hold stock of the end product in case theretailer suddenly requested more than normal and at the same timewould hold stocks of raw materials and components in case theirsupplier failed to meet their orders.
� The component supplier, of course, would also hold stocks ofcomponents and raw materials in case the manufacturer suddenlyincreased their order.
The advent of EDI (see Chapter 7) has meant that organizations canshare data not only within themselves but with partners along the chain,i.e. customers and suppliers. It is possible to have point of salesinformation collated in a computer and then relayed to all points in thesupply chain as in Figure 1.2.11. This means that only replacementitems need to be produced so that any changes in the sales pattern areimmediately catered for.
Eliyahu Goldratt discusses the handling of this integration in his bookIt’s not luck. In his latest book Necessary But Not Sufficient he in factgoes one step further in advocating that all supply chain members onlyget paid when the final sale is made.
It is natural that supplier and customer follow on to their developedrelationships in trading together over factors such as quantities anddelivery time, to other aspects such as developing products and servicestogether.
Manufacturers of bought-in components will have a wealth ofexperience in making their own products. For their customer to ask them

Organizations and organizing 25
Figure 1.2.10 Graph showing Forrester effect
Figure 1.2.11 Information flow in the supply chain
Table 1.2.1 Order pattern demonstrating the Forrester effect
Enddemand
Retailer
Openingstock
Closingstock
Orders forproducts
Manufacturer
Openingstock
Closingstock
Orders forcomponents
Component supplier
Openingstock
Closingstock
Makecomponent
100 100 0 100 100 0 100 100 0 10090 90 10 80 100 20 60 100 40 2090 90 0 90 80 –10 100 60 –40 14090 90 0 90 90 0 90 100 10 8090 90 0 90 90 0 90 90 0 90
a b c = b – a d = a – c e f = e – d g = d – f h j = h – g k = g – ju

26 Organizations and organizing
to make an item to an imposed design may not produce the bestcomponent in terms of function, quality or cost.
In the same way as cross discipline teams are formed withinorganizations, it is easy to apply the same concept between organiza-tions to develop a rapid response and design functionally effectiveproducts and processes at a minimum cost whilst protecting profits inboth organizations.
This does require openness and trust between organizations. As theirlong-term future will be tied up together, a lack of fairness and honestyin the setting up of a relationship will leave both open to futuredifficulties.
An example of trust between organizations is the on-site stock of asupplier’s materials that is only charged for when it is withdrawn for useby the customer. This was initially set up in spare parts for maintenance,but has now spread to low value items which are used in manufacture,such as bolts and screws.
Problems 1.2.1
(1) Think about a hockey team. Is it important that each playerfulfils a set role? Should there be occasions when they canstep outside that role?
(2) Think about the last group project you were involved with –did everyone carry out the same task? Why not?
(3) If you were asked to investigate a supplier, how would youpersuade them to allow you to closely examine theiroperations?
(4) How easy would it be to make the consumer demandavailable to everyone in the chain, when there are manysuppliers serving many intermediates in the chain?
(5) What problems do you see in Goldratt’s proposition of allsupply chain members getting paid only when the final saleis made?
1.3 Improvingtheorganization’sperformance
All organizations need to be continually improving themselves,especially when they are exposed to keen competition in their markets. Toachieve this is no easy task and this section looks at two methodologiesthat exist which attempt to integrate all aspects of an organization towardsit becoming fully effective. It also examines the modification to ISO 9004introducing Quality Management Principles.
As the twentieth century ended, many organizations were beingsubjected to tremendous pressures due to the international nature ofmany markets. During the 1990s organizations had been through aprocess of ensuring that high quality products and services weredelivered to the customer through techniques such as continuousimprovement, company-wide quality and total qality management.These have now become so ingrained in organizational culture that it isdifficult to demonstrate their uniqueness, except when they aremissing.

Organizations and organizing 27
What was required during the twentieth century were managementapproaches which integrated all functions and aspects of the organiza-tion towards its key result areas. We are going to examine three ofthese:
� Business Excellence Awards� The Balanced Scorecard� The ISO 9004:2000 Quality Management Principles.
Business Excellence Awards
The history of Excellence Awards
These awards started as part of the national quality initiative in Japan inthe 1950s with the Deming Prize, and spread to the USA with theMalcolm Balridge National Quality Award in 1988. Europe followedsuit in 1992 with the European Quality Award.
In the UK, the British Quality Foundation (BQF) introduced theBritish Quality Award (BQA) using the Business Excellence modelwhich has since been adapted as the framework for most countrieswithin Europe and is also used for regional awards within the UK.
Although the original criteria of these awards was biased towardsdesign and manufacturing quality aspects, the models have expandedto include all aspects of a business and hence the BQA award hasbeen renamed the EFQM (European Foundation for Quality Manage-ment) Excellence Model. It was revised to its present format in1999.
The Business Excellence Model
The model comprises nine criteria covering all aspects of theorganization. It can be applied to the organization as a whole, or to partsof it. The criteria are grouped into two sectors as in Figure 1.3.1. Thefirst sector is concerned with inputs and contains five enablers. Thesecond sector is concerned with criteria outputs and contains theremaining four results criteria.
The organization is assessed under each criterion and given a scorefor that criterion. The individual criterion scores are then summated,using weighting indicating the criterion’s contribution, to give an
Figure 1.3.1 The Business Excellence Model. Reproduced courtesy of the European Foundation for Qualityand Management

28 Organizations and organizing
overall score for the organization. The individual criterion score and theoverall score can then be used to determine the organization’s presentstanding using a process of comparison, i.e. benchmarking, againstknown organizations. These exemplar organizations can come fromvarious business sectors, not just the sector in which the organization isactive.
Benchmarking
Benchmarking is the systematic search for the best practiceswhich, if implemented, lead to superior performance.
By conducting a survey, you can see how you are doingrelative to other organizations as in Table 1.3.1:
Table 1.3.1 Results from a benchmarking survey
Criteria Best You
Lead time 3 days 28 daysOrders met from stock 85% 55%New products last year 7 2Defects 0.05% 3%Material yield 98% 87%Customer returns 0.5% 7.5%
More importantly, the assessment process highlights key areas that canthen be improved to increase the organization’s all-round effectiveness.If assessments are carried out over time they also indicate any trend thatis happening to judge the result of action taken.
We will examine the enabler criteria first and then see what the resultscriteria are and how the enablers contribute towards the performance inthe result criteria.
The enabler criteria
These are the criteria in which the organization’s performance should bereflected in the results criteria.
Leadership. A key area as the leaders drive all the other process bytheir behaviour, communicating purpose through relevant systems andmotivating staff.
Purpose: How the leader develops visions and values and forms a rolemodel:
� Defines mission and desired results.� Sets and reinforces an ethical culture.� Gathers feedback on impact of style and amends behaviour.� Seeks and supports improvements.� Encourages collaboration.� Encourages learning.� Operates a no-blame culture.

Organizations and organizing 29
Management systems:� Matches structure to support strategy.� Reviews and updates administration processes.� Aligns systems to strategy and desired results.
External contacts:� Involved in partnership and community projects.� Works with customers and authorities to determine their needs.� Supports staff involvement in community projects.
Behaviour:� Are they accessible?� Do they communicate effectively?� Do they recognize individual and team achievement?
Policy and strategy. Looks at how the organization develops imple-ments and reviews its policy and strategy.
Establishing needs: Here we are looking at what data is used toestablish needs and expectations of all possible stakeholders:
� Customers, suppliers and other partners.� Shareholders.� Staff.� Representatives of local and national government.� Authorities and regulators.� Other indicators, e.g. a PEST analysis.
Develop and review process:� Match to short- and long-term objectives of organization and
partners.� Balance between the various stakeholders.� Assumptions made, risks identified and contingency plans.� Alignment with critical success factors.� Review process.
Deployment:� Do resources match requirements?� Do processes deliver objectives?� The review process for future needs.
Communications:� Effectively communicated?� Is employee awareness evaluated?� Tie into lower level tactics.
People management. This looks at how the staff are developed andmotivated to effectively perform towards the business goals.
Planning:� Is there a manpower plan prepared on the basis of a business
plan?� Are there clear career development plans?� How will assessing of morale be done?� Are equal opportunity, promotion policy, etc. in place?

30 Organizations and organizing
Development:� Is training need analysis used to develop training and development
programmes?� How are individuals’ targets set and reviewed?� Is there a system of staff appraisal?
Participation:� What decisions are people empowered to do themselves?� How are staff encouraged to participate in continuous
improvement?
Communication:� How is two-way communication encouraged?� How is knowledge shared?
Rewards:� What tie into organizations objectives is there?� Additional facilities, e.g. child-care, sports facilities.� Opportunity for changing work patterns.
Partnerships and resources. Here we look at how the organization addsto its results through effectively using partners and its availableresources.
External partners:� Are they actively sought and developed?� Does relationship add mutual value?� Are joint developments encouraged?
Finances:� Support to policies.� Review and development procedure.� Key financial ratios.� How are investments evaluated?� How is empowerment monitored and controlled?� How are risks identified and managed?
Buildings and equipment:� How is security managed?� How are resources utilized and maintained?� How is waste generation and power usage monitored?
Technology:� How is technology used to improve efficiency?� How are new technologies evaluated?� How are staff skills updated in new technology?
Information:� How is information collected and used?� How are information systems linked to user’s needs?� How is information validity and security maintained?� How accessible is the information?

Organizations and organizing 31
Processes. If the people are to deliver the main objectives, the keyprocesses must support them in their roles in satisfying customers andother stakeholders.
Management:� Are there measures of capability and output?� Are appropriate standards applied, e.g. ISO 9000 and ISO
14 000?� The review and updating procedures.
Innovation:� Is there identification of potential improvements?� Number and degree of changes.� Change management and communication of the changes.� Training in new processes.
Design:� Is it driven by research of customer needs?� What is the evaluation procedure?� What co-operation is there with partners?
Process:� Match to customer and other stakeholders’ needs.� Are some processes outsourced?� The communication with customers.� What efficiency measures are employed?
Customer relationships:� Is feedback from customers collected and acted upon?� What monitoring of customer perceptions is carried out?
The results criteria
There are two areas of measures on the first three criteria – perceptionand performance indicators. On the fourth criterion, the performanceresults, the measures are outcomes and leading indicators.
Customer satisfaction. What the organization is doing in relation tothe complete chain of its external customers. We must ensure that themeasures used are of real importance to the customer.
Perception measures: Can be collected from surveys, interviews,trade analysts’ views, vendor assessments, and complaint records:
� Overall perception: Accessibility, flexibility, responsiveness and co-operation.
� Product/service: Functionality, specification range available, qual-ity, value for money, reliability, design innovation, environmentallyfriendly.
� Pre-after-sales: Staff friendliness and competence, technical/salesadvice and support, match to customer requirements, response time,problem solving, complaint procedure, product training, sales andcustomer literature and manuals.
� Future relationship: Intention to continue to trade/looking for othersuppliers, willingness to recommend you to others.

32 Organizations and organizing
Performance indicators: Many of these can be collated from internaldata:
� Product/service performance: Defect/reject rate, complaints,returns, warranty claims, delivery delays.
� Design: Number of innovations, product life cycle, time to market,conversation/rejection of quotations into orders.
� Sales/after-sales: Number of complaints, speed of response,demands for information/training.
� Customer loyalty: Length of relationship, number/value of repeatorders, lost business/retention rate, value of order per customer.
� Customer recommendation: Prizes, award nominations, trade presscoverage.
People satisfaction. Here we are looking at how the organization’sactions are perceived by their own staff:Perception measures: Taken from surveys, focus groups, interviews andstaff appraisals:
� Motivating factors: Career development and opportunities, commu-nication, involvement, empowerment, equal opportunities, leader-ship issues, recognition for achievement, target setting andappraisal, learning and training opportunities, commitment toorganization, sharing organization goals.
� Satisfaction measures: Condition, pay and benefits, job security,change management, health and safety, peer relationships,administration.
Performance indicators: Again most of these can be collated frominternal data:
� Employee achievement: Competency gap, productivity, number oftraining initiatives, training uptake and completion, post-trainingevaluation.
� Evidence of participation: Suggestion scheme responses, involve-ment in improvement teams, recognition of individual/teams,response to employee surveys.
� Satisfaction indicators: Absenteeism, sickness levels, accidents,turnover, recruitment response, number of grievances, use ofwelfare and social facilities.
� Administration: Accuracy in data held, response time to queries,health and safety audits, environment audits, community projects.
Society satisfaction. What the organization is doing in relation to thelocal, national and international communities – especially in environ-mental matters and with authorities which affect or regulate itsbusiness:Perception measures: Taken from surveys, newspaper reports, publicmeetings, dealing with local/national authorities:
� Corporate citizenship: Disclosure of relevant information, equalopportunity practice, impact on local economy, ethical behaviour,relationship with authorities.

Organizations and organizing 33
� Supporting local community: Schools and colleges, hospitals,community projects, voluntary work, sport and leisure facilities,medical and welfare provision.
� Nuisances: Noise, smell, sound, traffic, pollution, health risks andgeneral safety.
� Environment: Product recyclability, waste produced and collectionefficiency, usage of utilities, material usage, use of resources, powerrequirements.
Performance indicators:
� Handling of changes in employment levels.� Usage of formal environmental systems.� Relationships with planning authorities.� Staff involvement with voluntary and other local activities.� Number of visits to local schools and colleges.� Donations to and assistance with local causes.
Key performance results. These are the normal business measures whichorganizations use to denote their performance:Performance outcomes:
� Financial: Profit and loss, margins, sales, share price, dividends,borrowing, return on capital/assets, cash flow.
� Non-financial: Market share, volume, size of orders, time to market,quotation conversions, product launch date achievement.
Performance indicators:
� Process: Performance/productivity, defect rate, innovations andimprovements, cycle times, time to market, late orders, deliverytimes, project completion rates.
� Suppliers: Prices, quality, performance, late deliveries, jointinitiatives
� Financial: Cash flow, working capital requirements, returns oninvestments made, bad debts, inventory turns, maintenance costs,debtor ratios, creditor ratios, asset utilization, credit ratings.
� Technology: Patents, royalties, new product launches.
The assessment process
The EFQM model can be used in different ways to assess anorganization’s performance and give pointers for improvement. Theinitial assessment is normally carried in a self-assessment mode.Ultimately the organization can carry out the detailed award styleassessment itself, or it may wish to be formally assessed by external,independent assessors appointed by the BQF.
Initially assessment can be by a series of questionnaires andworkshops to determine how an organization’s management determinesits performance on the criteria. Figure 1.3.2 demonstrates the BQCBusiness Improvement Matrix used as a broad-based questionnaire togauge performance on each criterion.

34O
rgan
ization
s and
org
anizin
g
Leadership Policy andstrategy
Peoplemanagement
Resources Processes Customersatisfaction
Peoplesatisfaction
Impact onsociety
Business results
10 All managersare proactive insustainingcontinuousimprovement
Mission andbusiness policystatements coverthe wholebusiness
All actions aredirected towardsrealizing the fullpotential of allemployees
Theorganization’sresources aredeployedeffectively tomeet policy andstrategyobjectives
Key value addedprocesses areunderstood.Formallymanaged andcontinuouslyimproved
There is apositive trend incustomersatisfaction.Targets are beingmet. There aresomebenchmarkingtargets across theindustry
Regularcomparison withexternalcompanies showemployeesatisfaction iscomparable withother companiesand hasimproving trends
Views of localsociety areproactivelycanvassed.Results are fedback into thecompany andhave improvingtrends
There areconsistent trendsof improvementin 50% of keyresult areas. Someresults are clearlylinked toapproach
9 Managers areable todemonstratetheir externalinvolvement inthe promotionof total qualityas a businessphilosophybased on theirown experience
A process is inplace to analysecompetitorbusiness strategyand modify plansas a result inorder to developand sustain acompetitiveadvantage
Employees areempowered torun theirbusinessprocesses
A process is inplace to identifyadditionalresources whichcan be used tostrengthencompetitiveadvantage
The existence ofa formal qualitymanagementsystem can bedemonstrated
75% of customersatisfactiontargets are beingmet
Results indicatethat employeesand their familiesfeel integratedinto the workenvironment
Benchmarkinghas started for25% of impacton societytargets
All targets arebeing met andshowingcontinuousimprovement in25% of trends
8 Managers havea consistentapproachtowardscontinuousimprovementacross the unit
The policy andstrategy processare benchmarked
The humanresource plan forthe unit supportsthe company’spolicy andstrategy forcontinuousimprovement
A system is inplace to reviewand modify theallocation ofresources basedon changingbusiness needs
Processperformance isdemonstrablylinked tocustomerrequirements
50% of customersatisfactiontargets are beingmet
Results indicatethat people feelvalued for theircontribution atwork
50% of impacton societytargets are beingmet
75% of targetshave beenachieved. Able todemonstraterelevance of keyresult area tobusiness
7 etc. etc. etc. etc. etc. etc. etc. etc. etc.
Figure 1.3.2 BQC Business Improvement Matrix. Reproduced courtesy of the European Foundation for Quality and Management

Org
anizatio
ns an
d o
rgan
izing
35
Elements Attributes SCORE
0% 25% 50% 75% 100%
Approach Sound:� Approach has a clear rational� Well defined and developed processes� Approach focuses on stakeholder needs
No evidence oranecdotal
Some evidence Evidence Clear evidence Comprehensiveevidence
Integrated:� Approach supports policy and strategy� Approach linked to other approaches
No evidence oranecdotal
Some evidence Evidence Clear evidence Comprehensiveevidence
Total score 0 10 20 30 40 50 60 70 80 90 100
Deployment Implemented:� Approach is implemented
No evidence oranecdotal
Implemented in25% of areas
Implemented in50% of areas
Implemented in75% of areas
Implemented inall areas
Systematic:� Approach deployed in a structured way
No evidence oranecdotal
Some evidence Evidence Clear evidence Comprehensiveevidence
Total score 0 10 20 30 40 50 60 70 80 90 100
Assessmentand Review
Measurement:� Regular measurement of effectiveness of
approach and deployment carried out
No evidence oranecdotal
Some evidence Evidence Clear evidence Comprehensiveevidence
Learning:� Learning activities are used to identify and
share best practice and improvement
No evidence oranecdotal
Some evidence Evidence Clear evidence Comprehensiveevidence
Improvement:� Output from measurement and learning is
analysed and used to identify, prioritize, planand implement improvements
No evidence oranecdotal
Some evidence Evidence Clear evidence Comprehensiveevidence
Total score 0 10 20 30 40 50 60 70 80 90 100
Figure 1.3.3 Scoring enablers against elements and attributes under RADAR. Reproduced courtesy of the European Foundation for Quality and Management

36 Organizations and organizing
When we come to the detailed award style assessment, we canexamine each criterion as a whole, or break it down into its componentparts, for assessment. We then use the criterion scores arrived at, andapply their weightings to build up an overall score for the organization.The score can be expressed as a percentage or out of a maximum of1000 points.
When assessing the enabler criteria, we award each sub-criteria aRADAR card score as shown in Figure 1.3.3, based on the degree ofhard evidence available for:
� Approach taken: Is it sound and integrated?� Deployment within the organization: Is the approach fully imple-
mented in a systematic way?� Assessment and review: Is the effectiveness regularly measured,
and improvements sought?
Example 1.3.1
People management criterion:
Approach: Soundness 60%Integrated 50%
Average 55%
Deployment: Implemented 30%Systematic: 60%
Average 45%
Assessment: Measurement 50%Learning 40%Improvement 30%
Average 40%
People management overall average of (55% + 45% +40%)/3 = 47%.
The weighting in the overall score for the people manage-ment criterion is 9% or 90 points, therefore the peoplecriterion contribution to the overall score is (9% × 47%) =4.2%, or 42 points.
When assessing the results criteria, the RADAR card score (see Figure1.3.4) is determined by:
� Trends: Positive and sustained.� Targets: Appropriate and achieved.� Comparisons: i.e. bench-markings against averages and best in class
organizations.� Causes: Tie into approach.� Scope: Addresses relevant key areas.

Org
anizatio
ns an
d o
rgan
izing
37
Elements Attributes SCORE
0% 25% 50% 75% 100%
Results Trends:� Trends are positive and/or there is sustained
good performance
No results oranecdotalinformation
Positive trends/satisfactoryperformance insome results
Positive trends/satisfactoryperformance inmany resultsover three years
Positive trends/satisfactoryperformance inmost resultsover three years
Positive trends/satisfactoryperformance inall areas overfive years
Targets:� Targets are achieved� Targets are appropriate
No results oranecdotalinformation
Favourable andappropriate insome areas
Favourable andappropriate inmany areas
Favourable andappropriate inmost areas
Excellent andappropriate inall areas
Comparisons:� Comparisons with external organizations take
place and results compare well with industryaverages or acknowledged ‘best in class’
No results oranecdotalinformation
Comparisons insome areas
Favourable insome areas
Favourable inmany areas
Excellent inmost areas and‘world class’ inmany areas
Causes:� Results are caused by approach
No results oranecdotalinformation
Some results Many results Most results All results andthese will bemaintained
Total score 0 10 20 30 40 50 60 70 80 90 100
Scope:� Results address appropriate areas
No results oranecdotalinformation
Some areasaddressed
Many areasaddressed
Most areasaddressed
All areasaddressed
Total score 0 10 20 30 40 50 60 70 80 90 100
Figure 1.3.4 Scoring results against elements and attributes under RADAR. Reproduced courtesy of the European Foundation for Quality and Management

38 Organizations and organizing
Example 1.3.2
People satisfaction
Results: Trends 70%Targets 80%Comparison 30%Causes 60%
Average 60%
Scope 80%
People satisfaction overall average of
(60% + 80%)/2 = 70%.
The weighting in the overall score for the people satisfactioncriterion is 9% or 90 points, therefore the people resultscriterion contribution to the overall score is (9% × 70%) =6.3%, or 63 points.
The results for the individual criterion are then summated to give anoverall organization score as shown in Table 1.3.2. In the table, thepoints are awarded out of a total of 1000 overall.
Although an overall score of 506 out of a possible 1000 indicates thatthere is room for improvement, it is still a reasonable score as even therecognized ‘best’ organizations seldom achieve more than 700 points.
The areas highlighted for improvement are those indicated by anasterisk (*) which are below industry averages.
The Balanced Scorecard
This is a method developed by Robert S. Kaplan and David P. Nortonof the Harvard Business School in the 1990s. Its key approach is toensure all decisions are made on how they contribute towards the mainaims of the organization.
Table 1.3.2 Results from self-assessment under the EFQM criteria
Criterion Rawscore
Weighting Weightedscore
Leadership* 50 10% 25Policy and strategy 60 8% 48People management* 47 9% 42Partnerships and resources* 30 9% 27Processes 55 14% 77People satisfaction 70 9% 63Society satisfaction* 40 6% 24Customer satisfaction 55 20% 110Key performance results 60 15% 90
TOTAL 506

Organizations and organizing 39
The Balanced Scorecard (BSC) has four perspectives tied together(see Figure 1.3.5). These can be common across an organization, butmore usually differ within different areas.
� Financial: ROI; value added; profitability; revenue growth and mix;cost reduction; time to pay invoices; risk reduction.
� Customer: Market share; new customers; retaining customers;customer profitability; customer satisfaction.
� Process: Innovations; operations; post-sales – from identifyingneeds to satisfying them.
� Learning and growth: Employee satisfaction; employee retention;employee productivity.
These perspectives enable the organization to identify how each linkstogether to meet strategic aims using a cause-and-effect relationship asshown in Figure 1.3.6. It identifies the performance drivers that willproduce the desired outcomes – e.g. on-time deliveries producingcustomer loyalty, in turn giving profitability.
Financial perspective
Businesses, or products, can be in various stages of the market lifecycle, each of which calls for differing strategies as shown inTable 1.3.3.
In addition, organizations are interested in reducing risk andvariability which may guide strategy by broadening markets served.
Customer perspective
Market segmentation. Customers are different and value differentproduct characteristics. Some want low cost, others high value.Matching each segment calls for different strategies.
Figure 1.3.5 The Balanced Scorecard Perspectives
Figure 1.3.6 Cause-and-effect relationships throughout theorganization

40 Organizations and organizing
Core measurement:
� Market share: Proportion of business in a given market.� Customer acquisition: rate of attracting new customers.� Customer retention: Rate of retaining ongoing relationships.� Customer satisfaction: Level on specific performance measures.� Customer profitability: Net profit after allowing for unique
expenses required for that customer group (see Table 1.3.4 forstrategies).
Measuring customer value propositions:
� Product attributes: Function; price; quality; delivery; image.� Relationships: Knowledgeable people; convenient access; respon-
siveness; EDI, supplier integration.� Image and reputation: Of product, brand or service.
Internal business process perspective
The internal value chain covers the three principal processes ofinnovation, processing and post-sales.
Table 1.3.2 Strategies in relation to state of market
STRATEGIC THEME
MARKETSTRATEGY
Revenue growth and mix Cost reduction/productivityimprovement
Asset utilization
GROWTH Sales growth by segment. Revenue/employee Investment (% of sales).Percentage revenue fromnew products, services and/or customers
R&D (% of sales)
SUSTAIN Share of target’s customers. Cost versus competitors. Working capital ratios.Cross-selling. Cost reduction rates. ROCE by key asset.Percentage revenue fromnew applications.
Indirect expenses Asset utilization
Customer and product lineprofitability
HARVEST Customer and product lineprofitability
Unit costs (per unit ofoutput, per transaction)
Payback.Throughput
Table 1.3.4 Strategies in relation to profitability of segments
CUSTOMERS Profitable Unprofitable
Targeted segment Retain TransformUntargeted Monitor Eliminate

Organizations and organizing 41
Innovation
Important both in short and long product life because it determines thefuture value creation and even sets the basic costs involved, as these aredesigned in.
There are two components:
� What range of products will customers need?� How can we preempt development?
These are achieved by:
� Performing basic research to develop radically new products.� Performing applied research to exploit existing technology.� Focusing development to bring new products to the marketplace.
Measures are:
� Percentage of sales from new products.� Percentage of sales from proprietary products.� New product introduction versus competitors and plan.� Manufacturing capability improvements.� Time to develop next generation.� Yields.� Numbers passing through each process stage.� Successful products.� Redesigns and modifications – before and after launch.� Time to recoup investment.
Operations
This is the present value creation. Starts with a customer order and endswith delivery of the product. Stresses efficient, consistent and timelydelivery. They tend to be repetitive and scientific management can oftenbe applied to improve them. Measurements are:
� Process time: Processing time/throughput time; waiting times;material handling; batch policy; set-up times.
� Quality: Defect rates; yields; waste; scrap; rework; returns; processunder SPC.
� Cost: Process cost; overhead costs – ABC; interruptions; inaccurateinformation; priorities.
Post-sales
Includes warranty and repair activities and processing of payment.Measures can be:
� Time to react.� Single call service.� Disposal of waste, by-products and end-of-life plant.� Number of claims.� Predictive behaviour.
Learning and growth perspectiveEmployee capabilities
Changes in IT mean that employees no longer need to perform limitedwork and in fact the organization requires that they deliver ideas forimprovement. This requires both reskilling and attitude changes.

42 Organizations and organizing
Core measurement used to be only:
� Employee satisfaction.� Employee retention.� Employee productivity.
But now broadens to include:
� Critical skill coverage.� Suggestions made.� CPD.� Matching of personal goals to company objectives.� Continuous improvement (half-life – time to reduce defects/errors
by half).
Reskilling scenarios:
� Strategic: A focused portion needs a high level of new skills.� Massive: A large portion needs massive skills renovation.� Competency upgrade: Some portion requires core skill upgrading.
IT capabilities
Employee skills alone may be insufficient to deliver necessaryimprovements. They will probably need additional IT systems to givetimely and accurate information. This will include expert systems,databases and CAL to quickly bring themselves up to speed on newprocesses and products.
Team measurements:
� Survey of cross support.� Team-based activities.� Time of team working.
Missing measurements
There will not be available all the measures initially identified as beingleading indicators. This means that these, at present, are not beingmanaged effectively.
Linking BSC measures to strategy
Cause-and-effect relationships are the key (see Figure 1.3.7). The BSCshows up the cause-and-effect relationships between outcome measuresand performance drivers. Every measure should be an element of thischain.
Figure 1.3.7 Further cause-and-effect relationships
Organizations and organizing 43
Outcomes and performance drivers
Outcomes tend to be lagging indicators of performance. Performancedrivers are the leading indicators that will deliver the value propositionsto customers. BSC requires both and they form the cause-and-effectrelationships which can be tested during operations.
Linkage to financials
BSC retains a strong connection to financial outcomes. Each area willhave 15 to 25 mixed financial and non-financial measures, grouped intothe four perspectives.
BSC can be used by individual SBU to create its own BSC to meetcorporate objectives depending on their own circumstances andmarkets. For example, the various units can be in different growthscenarios or against different aggressiveness in competitors. These canreflect common corporate themes such as safety, environment andinnovation. They can also follow mandatory instructions such as cross-selling, sharing technology or using central sources, e.g. grouppurchasing.
Joint ventures
With the difficulty of serving more than one master, the selection ofBSC within the joint venture can create a common purpose that allpartners can subscribe to.
Support departments
Corporate staff should contribute added value to their internal customersto give a competitive advantage. Where they do not then their functionshould either be assumed by the operating department or outsourced tomore competitive and responsive suppliers.
Barriers
The barriers to achieving the connections between strategy formulationand implementation are:
� Visions and strategies that are not actionable – no consensus.� Strategies not linked to departmental, team or individual goals.� Strategies not linked to long- and short-term resource allocation.� Feedback that is tactical rather than strategic.
Any strategy, such as BSC, must have top-level management involve-ment and support, as it is a change to the entire management process,not just measurement.
Many measures only reflect what all companies should be doing – theBSC should throw up unique strategies, targeted customers and criticalinternal processes and development.
The organizational defects are:
� BSC delegated to mid-management, rather than top level.� BSC used to broaden benchmarks rather than develop own
criteria.� Seeking a perfect BSC before implementation.

44 Organizations and organizing
Quality Management Principles in ISO9004:2000
The ISO 9000:1994 Series on Quality Systems has been augmented bymodifying the ISO 9004 standard to include the following QualityManagement Principles.
Quality Management Principles
A quality management principle is a comprehensive and fundamentalrule or belief, for leading and operating an organization, aimed atcontinually improving performance over the long term by focusing oncustomers while addressing the needs of all other stakeholders.
Principle 1 – Customer-focused organization
Organizations depend on their customers and therefore should under-stand current and future customer needs, meet customer requirementsand strive to exceed customer expectations.
Principle 2 – Leadership
Leaders establish unity of purpose and direction of the organization.They should create and maintain the internal environment in whichpeople can become fully involved in achieving the organization’sobjectives.
Principle 3 – Involvement of people
People at all levels are the essence of an organization and their fullinvolvement enables their abilities to be used for the organization’sbenefit.
Principle 4 – Process approach
A desired result is achieved more efficiently when related resources andactivities are managed as a process.
Principle 5 – System approach to management
Identifying, understanding and managing a system of interrelatedprocesses for a given objective improves the organization’s effective-ness and efficiency.
Principle 6 – Continual improvement
Continual improvement should be a permanent objective of theorganization.
Principle 7 – Factual approach to decision making
Effective decisions are based on the analysis of data and information.
Principle 8 – Mutually beneficial supplier relationships
An organization and its suppliers are interdependent, and a mutuallybeneficial relationship enhances the ability of both to create value.

Organizations and organizing 45
It is possible to see this modification as a move towards the EFQMmodel with traces of the Balanced Scorecard.
Problems 1.3.1
(1) Do you agree with the 50/50 split into enablers and results inthe EFQM model?
(2) What do you think is the most important aspect that affectsyou as an employee, or student, in your organization?
(3) What factors would you use to measure how your presentorganization performs against its customers’, or students’,expectations?
(4) What would you say was your present organization’s staffattitude to their organization?
(5) Looking at the financial outcomes, what benchmarks wouldyou use to judge how well your organization is performing?
1.4 Businessand society
This section looks at the reasoning behind codes of conduct and thechanges in legislation caused by changes in the general public’sperception of what constitutes ethical behaviour by organizations. Itlooks briefly at health and safety before concluding with environmentalpolicy guidelines.
Codes of conduct
Throughout history society has had rules of conduct for its members.Some of these rules have developed into laws, and some have remaineddesired norms of conduct rather than laws. There are even actions whichare considered wrong in one circumstance and right in another, orperhaps legally wrong but morally right by some members of thepublic.
Most people would rate lying as being against the general rules ofconduct, but no country has yet drafted a law against lying per se. Thereare, however, laws which cover redressing wrongs arising out of someparticular types of lies:
� Perjury, i.e. false evidence.� Reputations, i.e. slander and libel.� Contracts under the Trades Description Act and the Misrepresenta-
tion Act.
In business, it is easy to determine which actions are illegal, but not soeasy to define those which are not ethical. Laws and ethics overlap tosome extent, but they should not be thought of as the same – especiallywhen considered on an international basis.
Quite often laws lag behind public perceptions on ethical issues. Inaddition special interest groups may have their own reasons for

46 Organizations and organizing
launching action, e.g. human rights activists, environmental activistsand animal rights activists. In some cases the law may offer a degree ofprotection and avenues for recovering damage, but public opinion maybe persuaded otherwise. This can affect trading or the value ofshares.
Historically a business has been thought of as having only one aim –to make money for the owners – and has tended to ignore ethical mattersexcept where they impinged on this duty. They have been accused ofalmost using a definition of anything that is not illegal, is legal andtherefore can be carried out.
Society does not take that view today, and looks for businesses havingan ethical dimension. Where businesses do not self-regulate, they findthat governments, influenced by pressure groups, are laying downconstraints within which organizations must work.
It is therefore in the organization’s own interest that it produces itsown code of conduct in many issues. The Code of Conduct (see Figure1.4.1) of the Institute of Management is a good starting point for anyorganization.
As you can see the Code covers a wide area, some of which can belinked into legislation and other codes, e.g. the Equal OpportunityCommission’s model for an Equal Opportunity Policy (see page 68) andthe Investor in People (IIP) initiative (see page 78). However, that stillleaves areas which are not set by laws and may appear difficult to fullydetermine what action to take.
One problem is that codes of conduct, and laws to a degree, are notthe same throughout the world. This means that an organization has tobe careful when dealing with people from different cultures.
Ethics
Debates on ethics and moral rights have been going on throughouthistory. In ancient Greece philosophers such as Aristotle and Platoattempted to define the ideal of virtue and citizenship which manysubscribe to still. Yet in their society slave owning was the acceptablenorm and women had no rights.
Is there a universal code that can be followed to guide organizationswhen considering ethical dilemmas? Unfortunately there is not, but weshall examine several codes which may give guidance.
Immannuel Kant (1724–1804) put forward a theory stating that thereare three main criteria which should be used to determine the ethicalapproach:
� Reversibility, i.e. what if someone did it to you?� Universality, i.e. what if everyone acted like this?� Intrinsic human dignity.
The problem arises when you have to deal with someone with blatantegoism, i.e. self-interest, who believes in being free to do as he/shepleases. In the short term at least, this type of person often wins butorganizations that allow this action to foster set up their own conflictsand often the individual’s self-interest may not coincide with the interestof the organization.

Organizations and organizing 47
Guides to Professional Management Practice
1. As regards the Individual Manager
The Professional Manager should:
� Pursue managerial activities with integrity, accountability and competence.� Disclose any personal interest which might be seen to influence managerial decisions.� Practise an open style of management so far as is consistent with business needs.� Take active steps for continuing development of personal competence.� Adopt a reasoned approach to the identification and resolution of conflicts of values,
including ethical values.� Safeguard confidential information and not seek personal advantage from it.� Exhaust all available internal remedies for dealing with matters perceived as
improper, before resorting to public disclosure.� Encourage the development and maintenance of quality in all management activities.
2. As regards others within the organization
The Professional Manager should, in addition to the above:
� Ensure that others are aware of their responsibilities, areas of authority andaccountability.
� Encourage and assist others to develop their potential.� Consider the mental and physical health, safety and well being of others.� Have regard for matters of conscience of others.� Have regard for the needs, pressures and problems of others and not discriminate on
grounds other than those demonstrably necessary for the task.
3. As regards the organization
The Professional Manager should, in addition to the above:
� Uphold the lawful policies and practices of the organization.� Identify and communicate relevant policies, practices and information.� Keep under review organization structure, objectives, procedures and controls.� Seek to balance departmental aims in furtherance of the organization’s overall
objectives.� Safeguard the assets and reputation of the organization.
4. As regards others external to but in direct relationship with the organization
The Professional Manager should, in addition to the above:
� Ensure that the interests of others are properly identified and responded to in abalanced manner.
� Establish and develop continuing and satisfactory relationships based on mutualconfidence.
� Avoid entering into arrangements which unlawfully or improperly affect competitivepractice.
� Avoid entering into any agreement or undertaking any activity which may give rise toa conflict of interest with the organization or prejudice professional managementperformance.
� Neither offer nor accept gifts, hospitality or services which could, or might appear to,imply an improper obligation.
5. As regards the wider community
The Professional Manager should, in addition to the above:
� Have due regard to the short and long term effects and possible consequences ofpresent and proposed activities, taking action where appropriate.
� Ensure truthfulness in all public communications.� Seek to conserve resources wherever possible and preserve the environment.� Respect the customs, practices and reasonable ambitions of other peoples which may
differ from the manager’s own.
6. As regards the Institute of Management
The Professional Manager should, in addition to the above:
� Promote the mission, aims and objectives of the Institute.� Uphold the integrity and good name of the Institute and refrain from conduct which
detracts from its reputation.� Promote the Institute’s professional image and standing.
Figure 1.4.1 Institute ofManagement’s Code of Conduct(reproduced with permissionfrom the Institute ofManagement)

48 Organizations and organizing
Kant’s criteria are similar to the Four-way Test adopted by the Rotarymovement which states that in all business transactions the followingquestions should be asked:
� Is it the truth?� Is it fair to all concerned?� Will it build goodwill, and better friendship?� Will it be beneficial to all concerned?
All these appear to be a little theoretical and idealistic in values. Can thisbe put into more businesslike terms?
Ronald Green in The Ethical Manager introduces the concept ofstakeholders into the equation. He suggests the following sequence:
� Define your self-interest and the interest for other directly involvedparties.
� Identify other stakeholders, i.e. others who may be affected, and theminimum rights and duties involved.
� Determine the best outcome for the interested parties only.� Test that outcome against the other stakeholders’ interests.� Where conflicts arise determine if the strategic outcome outweighs
the morale consequences.� Where conflict is unresolved attempt to find another outcome more
equitable to the direct parties and the other stakeholders.
At the end of the day, you may still be left with an outcome you wishto proceed with and that you feel is in your self-interest but against otherstakeholders, although you should have amassed an argument in yourfavour. However, remember that being legally right does not protect youfrom public disquiet and attacks from those whose interests you havegone against. The ‘fat cats’ arguments of the 1990s regarding directors’pay and bonuses are an example of the media attention that you may besubjected to.
Constant disregard of public disquiet by organizations has led overthe years to changes in the laws of the UK and other countries.
Trends in laws
Due to changes in public acceptance of various practices, governmentsduring the twentieth century have introduced a series of laws and reg-ulations constraining the freedom of organizations to act as they see fit.
Contract law
The historic position was caveat emptor – let the buyer beware.This led to unethical behaviour on the part of some organizations
where the buyers were not in a position of power, nor had the necessaryskills or knowledge, to fully take up their right to examine the contractor the product before buying.
This led to changes to protect the weaker parties such as the Sale andSupply of Goods Act 1994, the Unfair Contracts Act 1977, the ConsumerProtection Act 1987 and Unsolicited Goods and Services Acts 1971 and1975. These are dealt with in Chapter 3.

Organizations and organizing 49
There are other acts which limit the action of organizations to operatecartels, unfair competition and restrictive practices. There are even lawswhich protect the interests of minority shareholders in companies.
It is expected that the EC will introduce Europe-wide legislationwhich will further constrain organizations.
Labour law
In Chapter 2 on human resource management we continually addresslegislation concerning employment and employee rights that wereenacted in the last quarter of the twentieth century. This period has seenchanges in legislation that have weakened the trade union organizations,but at the same time have increased individual’s rights and benefits.
The latest of these is the Public Interest Disclosure Act 1998. Thisgives protection to employees engaged in whistle blowing, i.e. makingpublic information where:
� A criminal offence has been committed, is being committed or islikely to be committed.
� A person has failed, is failing or is likely to fail to comply with anylegal obligation to which he is subject.
� A miscarriage of justice has occurred, is occurring or is likely tooccur.
� The health or safety of any individual has been, is being or is likelyto be endangered.
� The environment has been, is being or is likely to be damaged, or� Information tending to show any matter falling within any one of
the preceding paragraphs has been, is being or is likely to bedeliberately concealed.
This means that an employee can make public any illegal action takenby an organization. The problem that can arise is in the grey areas wherethe general public may consider that although a certain action is legal itis unethical, e.g. the use of child labour by one of your suppliers.
The report from the Nolan Committee clearly states that anorganization requires to formulate a procedure for handling this.
Blowing the whistle – the view from theCommittee on Standards in Public Life
All organizations face the risk of things going wrong or ofunknowingly harbouring malpractice. Part of the duty ofidentifying such a situation and taking remedial action may liewith the regulatory or funding body. But the regulator isusually in the role of detective, determining responsibilityafter the crime has been discovered. Encouraging a culture ofopenness within an organization will help: prevention is betterthan cure. Yet it is striking that in the few cases where thingshave gone badly wrong in local public spending bodies, it hasfrequently been the tip-off to the press or the local Member ofParliament – sometimes anonymous, sometimes not – whichhas prompted the regulators into action.

50 Organizations and organizing
Placing staff in a position where they feel driven toapproach the media to ventilate concerns is unsatisfactoryboth for the staff member and the organization. We observedin our first report that it was far better for systems to be put inplace which encouraged staff to raise worries within theorganization, yet allowed recourse to the parent departmentwhere necessary. In the course of the present study, wereceived evidence from the independent charity, PublicConcern at Work, which specialises in this area. Theyproposed that an effective internal system for the raising ofconcerns should include:
� A clear statement that malpractice is taken seriously inthe organization and an indication of the sorts of mattersregarded as malpractice.
� Respect for the confidentiality of staff raising concerns ifthey wish, and the opportunity to raise concerns outsidethe line management structure.
� Penalties for making false and malicious allegations.� An indication of the proper way in which concerns may be
raised outside the organization if necessary.
We agree. This approach builds on some aspects of existingpractice. For example the duty of accounting officers ineducation bodies to notify the funding councils of the misuseof public funds. It goes further by inviting all staff to actresponsibly to uphold the reputation of their organization andmaintain public confidence. It might help to avoid the caseswhen the first reaction of management faced with unwelcomeinformation has been to shoot the messenger.
The Nolan CommitteeSecond Report of the Committee on Standards in Public Life,p. 22 Cm 3270–1 (May 1996). (Crown Copyright is repro-duced with the permission of the Controller of Her Majesty’sstationery office).
Health and safety
There are a multitude of acts controlling the workplace. These applyto offices and factories (see also Chapter 3). The EC has evenintroduced working conditions which previously came under labourlaw in the UK, e.g. the Working Time Directive, under the heading ofHealth and Safety.
The Health and Safety at Work Act 1974 is the main one concerningsafety and is rigorously imposed. This Act lays down a general duty oneveryone at work – including the self-employed – that is backed bycriminal liability. This duty is owed to employees, sub-contractors,customers and other non-employees on site and the general public whomay be affected by anything we do.
The duty is ‘To ensure, so far as is reasonably practical, that theprocess, article or substance is so designed and managed as to be safeand without risk to health when properly used, stored and transported.’Improper use is further defined as ‘without regard to any relevantinformation’.

Organizations and organizing 51
Specific duties laid down are:
� To carry out any necessary testing and examination.� To provide adequate information for the process operation or the
article’s use.� To ensure that any necessary research is carried out to eliminate, or
minimize, any risk to health or safety.
Internally this means that organizations have to take positive steps toprotect their employees and the public in general from the risk of injuryfrom a multitude of potential hazards. In 1992, the following specificsets of regulations came into force:
� Management of Health and Safety at Work Regulations: Identifyhazards and assess risks to eliminate or control them to anacceptable level.
� Workplace Health, Safety and Welfare Regulations: Lighting,heating, washing and sanitary facilities, traffic, glazing, etc.
� Provision and Use of Work Equipment Regulations: Work equip-ment must be safe, including use, maintenance and instructions.
� Personal Protective Equipment at Work Regulations: Personalprotective clothing selection, use and maintenance.
� Manual Handling Operations Regulations: Avoid heavy handlingbut, if required, assess the risk.
� Health and Safety (Display Screen Equipment) Regulations: Use ofcomputer workstations, including screen, desk, chair, keyboard, etc.and general environment. Establish eye care programme.
Formal risk assessment checks must be carried out, where risk refers tothe likelihood that a harm will arise and the severity of itsoccurrence:
� Identify all hazards, i.e. the potential to do harm: Noise, dust,electricity, hazardous material, sharp edges, fire/explosion, tripping,handling, vehicle movement, moving machinery, storage, cranesand lifting equipment, etc.
� Identify everyone who could be harmed by these hazards.� Evaluate risks arising and decide if they can be eliminated
(preferred) or reduced with adequate precautions installed.� Record findings and decisions/action taken.� Review assessments periodically and revise if necessary.
HAZOP (hazard and operability) studies involve examining alloperational plant and processes to determine the possibility of hazardsarising and designing procedures to eliminate them, reduce thepossibility of them occurring or to reduce the possibility of harm arisingto employees or the environment.
There has been a code of practice issued by the Health and SafetyCommission covering the Act (1974) and the subsequent regulations.Whereas this has no legal status, if not observed, it would weaken yourposition in any court proceedings. This code covers:
Risk assessmentHealth and safety management arrangements

52 Organizations and organizing
Health surveillance of employees and the general publicHealth and safety assistanceProcedures for serious and imminent danger and for danger areasInformation for employeesCo-operation and co-ordination of shared sitesPersons working in host employer’s undertakingsCapability and trainingEmployees’ dutiesTemporary workers
Action on all of these has all to be recorded if you have more than fiveemployees. The health and safety aspects are growing and breaches canhave severe consequences such as:
� An order not to use a machine, or process.� Criminal charges which could lead to a fine, or in extreme cases
imprisonment.
You are advised to consult the Health and Safety Commission or theHealth and Safety Executive whose inspectors may visit you at any timeunannounced.
Environmental management
Nowadays environment aspects are becoming more important to anorganization as governments continually expand the legislation dealingwith this matter. For example, the following are active in the UK:
Clean Air Act 1968Control of Pollution Act 1974Health and Safety at Work Act 1974Control of Industrial Major Accident Hazard (CIMAH) Regulations1985Road Traffic Act 1986Consumer Protection Act 1987Control of Substances Hazardous to Health (COSHH) 1988Water Act 1989Control of Industrial Air Pollution Regulations 1989Town and Country Planning Act 1990Water Resources Act 1991Environmental Information Regulations 1992Council Regulation (EEC) No. 1838/93The Environment Act 1995Control of Major Accident Hazards Regulations (COMAH) 1995Landfill Tax – in the Finance Act 1996Producer Responsibility Obligations (Packaging Waste) Regulations1997Integrated Pollution Prevention and Control, EC Directive 96/61
At present the EC and national governments are in discussion withindustry with the aim of structuring legislation and setting targets for therecycling of products which, if enacted, will have considerable furtherimpact. It is necessary that an organization carries out an immediate

Organizations and organizing 53
environmental impact assessment and if there is an environmentalimpact envisaged takes action to reduce or minimize it.
In the UK and the EC, there are four key principles that govern theapproach to environmental protection:
� Prevention: Priority should be given to anticipating and preventingenvironmental harm. This includes worst case scenarios andcontingency planning.
� Precaution: Here the concept is to minimize possible regrets, i.e. erron the pessimistic side, when considering possible harm. This hasfuelled the debate on genetically modified foodstuff.
� Polluter-pays principle: The producer of any environmental damagehas to meet the financial cost of that damage. This has led toproblems when the present owner of land that has been contami-nated is not the contaminator.
� Integration: Care should be taken that improvements in one area donot lead to reductions in another.
BenefitsThere is often a business case to be made for an organization that isconcerned with the environment but is unable to have an effect thereon.The case considers:
� Cost savings: Through reduced raw materials, reduced energy used,reduced transport and disposal cost, reduced risk of litigation andlower insurance.
� Marketing benefits: Improved public image, safeguards existingmarket and offers new opportunities in environmental products.
� Benefits for customer: Increased confidence, competitive pricing,better value, less risk.
� Benefits for employees: Improved working conditions, improve-ment to health and enhanced personal commitment.
� Benefits to environment: Reductions in raw material extraction,emissions, waste, odours, noise, energy use and the impact on theecosystem.
� Better relations with regulators and other authorities.
Organizations can be registered under various schemes such as BS7750, ISO 14001 and the EC’s Eco-Management and Audit Scheme(EMAS) – see Figure 1.4.2 for a comparison table between these. Theyall follow similar stages.
Environment reviewThe initial review requires top-level commitment through the formationof a team whose task will be to:
� Determine any significant impact on the environment.� Identify any breaches of existing, or proposed, legislation.� Quantify the emissions, discharges and wastes presently arising.� Identify improvement possibilities and prioritize them.
A useful initial step is to demonstrate the sources of waste using aprocess flow diagram (as in Figure 1.4.3) then calculate out a massbalancing calculation (see Figure 1.4.4.), quantifying complaints andsummating disposal costs.

54 Organizations and organizing
Requirements for BS 7750
Requirements of BS EN ISO 9000 Series
4.1 Management responsibility * * * *
4.2 Quality system * *
4.3 Contract review * * *
4.4 Design control * * *
4.5 Document control *
4.6 Purchasing * *
4.7 Customer supplied product *
4.8 Product identification *
4.9 Process control *
4.10 Inspection and testing *
4.11 Inspection, measuring and test equipment *
4.12 Inspection and test status *
4.13 Control of non-conforming product *
4.14 Corrective action *
4.15 Handling, storage, packaging and delivery * *
4.16 Quality records *
4.17 Internal quality audits *
4.18 Training *
4.19 Servicing * *
4.20 Statistical techniques *
COMMON FEATURES IN ENVIRONMENT REGISTRATION PROCEDURES
ISSUE ISO 14001 EMAS BS 7750
Environmental policy v v vEnvironmental effect aspects/
impactsv v
Environmental review Advised v AdvisedIdentification of significant environmental
effectsv v v
Legislative and other requirements v v vObjectives and targets v v vDraw up environmental improvement
programmev v v
Prepare Environmental Statement x v xEnvironmental Statement validated x v xDefine responsibilities v v vIdentify training needs v v vProcedure of operational control v v vProcedures for internal communication v x xExternal communication Consider
processes forsignificant
aspects
Giveinformation
to public
Contractors Communicaterelevant
procedures
Considerenvironmentalperformance
Communicaterelevant
proceduresMaintain documented systems v v vProcedure for controlling all required
documentsv x v
Records to be kept v v vConduct audits v At least every
three yearsv
Certification of company v x vVerification of site x v x
Man
agem
ent
syst
em
Env
iron
men
tal
polic
y
Org
aniz
atio
n an
d pe
rson
nel
Env
iron
men
tal
effe
cts
Obj
ectiv
es a
nd t
arge
ts
Man
agem
ent
prog
ram
me
Man
ual
and
docu
men
tatio
n
Ope
ratio
nal
cont
rol
Rec
ords
Aud
its
Rev
iew
s
Figure 1.4.2 Comparisonbetween quality andenvironmental standards. (GG43Environmental ManagementSystems in Foundries. CrownCopyright is reproduced with thepermission of the Controller ofHer Majesty’s Stationery office)
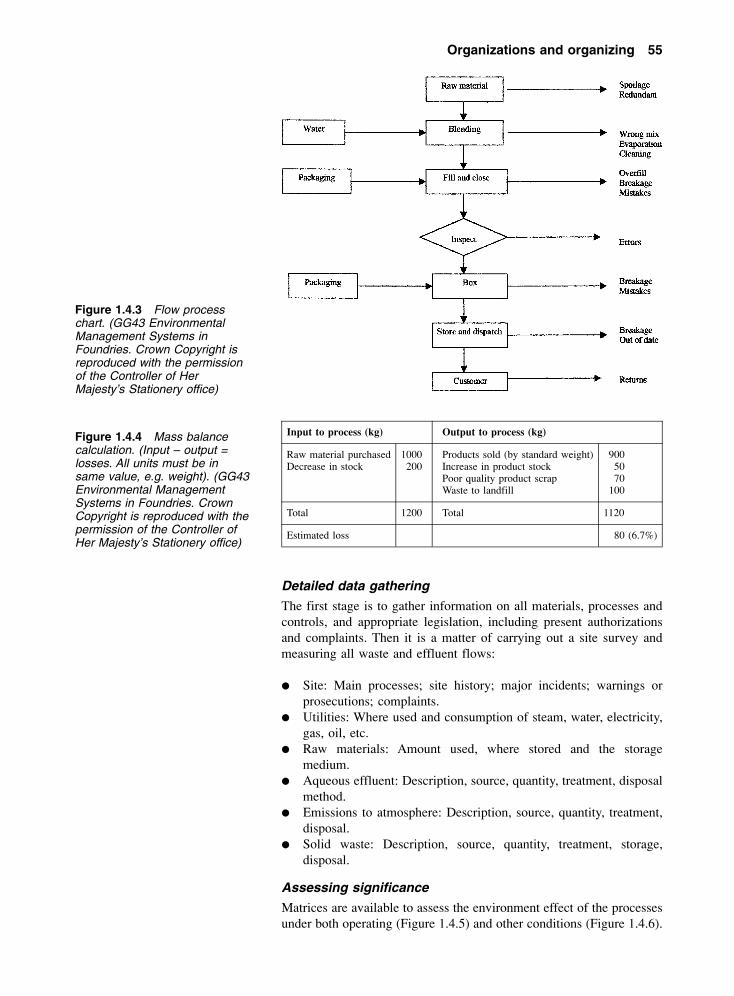
Organizations and organizing 55
Detailed data gathering
The first stage is to gather information on all materials, processes andcontrols, and appropriate legislation, including present authorizationsand complaints. Then it is a matter of carrying out a site survey andmeasuring all waste and effluent flows:
� Site: Main processes; site history; major incidents; warnings orprosecutions; complaints.
� Utilities: Where used and consumption of steam, water, electricity,gas, oil, etc.
� Raw materials: Amount used, where stored and the storagemedium.
� Aqueous effluent: Description, source, quantity, treatment, disposalmethod.
� Emissions to atmosphere: Description, source, quantity, treatment,disposal.
� Solid waste: Description, source, quantity, treatment, storage,disposal.
Assessing significance
Matrices are available to assess the environment effect of the processesunder both operating (Figure 1.4.5) and other conditions (Figure 1.4.6).
Figure 1.4.3 Flow processchart. (GG43 EnvironmentalManagement Systems inFoundries. Crown Copyright isreproduced with the permissionof the Controller of HerMajesty’s Stationery office)
Figure 1.4.4 Mass balancecalculation. (Input – output =losses. All units must be insame value, e.g. weight). (GG43Environmental ManagementSystems in Foundries. CrownCopyright is reproduced with thepermission of the Controller ofHer Majesty’s Stationery office)
Input to process (kg) Output to process (kg)
Raw material purchased 1000 Products sold (by standard weight) 900Decrease in stock 200 Increase in product stock 50
Poor quality product scrap 70Waste to landfill 100
Total 1200 Total 1120
Estimated loss 80 (6.7%)

56 Organizations and organizing
The process can score a maximum of 30 points under each of normaloperations conditions and possible variations aspects giving an overallmaximum of 60. The higher the score, the more impact on theenvironment. These also can be used to prioritize the processes to betackled – the higher the score the more significant the effect.
Thereafter processes similar to FTA and FMEA should be carried outto determine root causes and preventative measures that can be taken.
Environment policy
Following onto the environment review, a policy should be drawn uplisting the organization’s environmental objectives, staff responsibilitiesand their targets for improvement. An environment management manuallisting all the above and associated procedures needs to be drawn up.
The procedures should be subjected to audit at set intervals, aminimum of once each year. Any report of non-compliance shouldconclude with the action to be taken.
A validated environmental statement is required to be produced andmade available to the public under the EMAS scheme.
Certification and/or validation
Under BS 7750 and ISO 14001 an independent certifier certifies theEnvironmental Management System. Under EMAS an environmentalverifier carries out a similar process of accreditation. Being certified to
Score Weighting factor
3 2 1 0
Legislation Existing Impending None * 2 = a
Environmental impact Known detriment Possible detriment Limited detriment No detriment * 3 = b
Interested parties Considerable Moderate Little None * 2 = c
Quantity High Medium Low None * 3 = d
Normal operating conditions total score = a + b + c + d
Figure 1.4.5 Matrix to score environmental effects under normal operating conditions. (GG43 EnvironmentalManagement Systems in Foundries. Crown Copyright is reproduced with the permission of the Controller ofHer Majesty’s Stationery office)
Figure 1.4.6 Matrix to score environmental effects under other operating conditions. (GG43 EnvironmentalManagement Systems in Foundries. Crown Copyright is reproduced with the permission of the Controller ofHer Majesty’s Stationery office)
Score
12 6 3 0
Abnormal operations Increased environmentalimpact
No change Reduced environmentalimpact
= e
Accident/emergency Increased environmentalimpact
No change Reduced environmentalimpact
= f
Past activities Evident and requiresaction
Possible damage or damage difficult toevaluate
No damage = g
Planned activities Increased environmentalimpact
No change Reduced environmentalimpact
= h
Other operating conditions total score = e + f + g + h
Key point
Fault tree analysis (FTA)
FTA is the logical analysis ofthe chain of lower level eventswhich have to occur to causeanother event to happen. Infailure analysis it is used totrace back to find the rootcauses that allow systems orcomponents to fail.
Key point
Failure mode effects andanalysis (FMEA)
FMEA is a design procedurein which we investigate theconsequences that the poten-tial failures of a component orsub-system may have. Theprocedure starts from theopposite end to the FTA,which starts with an overallsystem failure. It can beapplied to a product or aprocess.

Organizations and organizing 57
BS 7750 normally suffices for EMAS, but some slight additional workmay be required if the certification is under ISO 14001.
The process starts with a report from a desk-top study and isconcluded by a site visit by the certifier/verifier.
Problems 1.4.1
(1) Look at the code for your profession and compare it with thatfor the Institute of Management. Do you see any majoromissions in either?
(2) Your company employs over 200 people. It is in severedifficulties and will go out of business if new orders are notgained. You are involved in sales negotiations when itbecomes clear that you will win an order that will save thejobs of your employees, if you pay a substantial bribe to thebuyer’s main negotiator. What do you do?
(3) Look up details of the Pinto small car made in the USA in the1970s and comment on Ford’s cost-benefit analysis regard-ing the fault discovered before its launch.
(4) Who do you think should pay to clean up if an organizationowns land that was polluted by another organization whichhas gone out of business?
(5) Do you think it is ever ethical for an organization to bind itsemployees in a non-disclosure contract?

2 Human resourcemanagement
Summary
It is often said that an organization’s main resource is its people and it is certainly true that withoutpeople the organization will neither exist nor function.
As both a manager and as an employee you will need to deal with selecting and getting thebest out of people. This chapter will introduce you to the many aspects of human resourcemanagement that you will need to know.
Objectives
By the end of this chapter, the reader should:
� be able to determine future manpower needs and how to meet them by recruitment andterminations (Section 2.1);
� understand how to make the most of people through motivation, job design, training anddevelopment (Section 2.2);
� understand the way people are rewarded by payment schemes and other benefits, includingjob evaluation and productivity payment (Section 2.3);
2.1 Themanpower plan– recruitmentand termination
The aim of human resource management (HRM) is to meet the manpowerneeds of the company, now and in the future. To this end it must beeffectively linked into the processes of recruitment and termination.
Manpower planning
The various stages of manpower planning are designed to ensure thatthe organization has manpower resources to meet the business needs inskills, number of employees and cost. It does this by:
� Determining future recruitment needs.� Making provision for training.� Anticipating wastage and redundancies.
In order to do this, we start with the future business plan and break itdown into the activities which will need to be carried out (Figure 2.1.1).

Human resource management 59
These activities then need to be expressed in the skills required and thenumber of people possessing them.
We then have to evaluate the existing manpower in skills andnumbers, calculate the expected losses and compare the resultantbalance to that required by the business plan. We have to bear in mindany major organizational or technological changes expected both withinand outside the organization.
Evaluate the existing workforce
Assuming that adequate personal records are available, it should bepossible to draw up a profile of the existing workforce:
� Skills available: Each skill used within the organization needsidentifying. This will include qualifications and experience of usingthe skill.
� Present training plan: This gives an idea of how present skill levelsare changing.
� Number of staff: Linked to skills will be the number of staff havingthat skill, and how they are at present structured.
� Levels: This relates to the structure within the organization, i.e.supervisors and managers.
� Age analysis: This is important and is tied to the above four factors.
Age Analysis
Few skills and departments within an organization will havean identical age structure. Analysing the age of the existingworkforce will not only give advance warning of any loomingretirement, but will also affect present policy and perhapseven training capability.
Examining Figure 2.1.2, which is the age profile ofengineers within a particular department, gives rise to twoobservations:
� There is a distinct low in the age group 25–35. Perhapsdue to recent restructuring, or it may denote an inability toretain younger staff.
� A peak in the age profile in the 55–60 age groups. Thisshows a potential retirement problem in the next five toten years.
Figure 2.1.1 Development of manpower plan

60 Human resource management
Allowing for change
It is possible by analysing past and present records, coupled to anyanticipated changes in conditions, to calculate what the probablechanges in the present labour force over the planning period will be.
Stability
Any group of people joining an organization will stay varying lengths oftime. Some will leave quickly, some will be promoted and the otherswill spend differing times with the organization, perhaps to retirementage or leaving due to health problems. It is common that a pattern is setup within a particular job role, which will repeat itself in the futureunless a change is made.
We calculate the number of survivors over time by comparing thepeople at the start of a time period with those still there at the end of thatperiod. We can then take the leavers during this period to find theaverage. This, combined with the age analysis, will enable us to makepredictions about the numbers leaving by natural wastage duringperiods of change.
Stability =
people employed at beginning of periodand still there at the end × 100
people employed at beginning of period
This can be shown graphically as in Figure 2.1.3, anddemonstrates that the stability of the assembly operators isless than the other categories.
Turnover =people leaving × 100
average number employed
The figures on stability and turnover can also indicate where a changein HRM policy may be required. It is costly in management time in
Figure 2.1.2 Age analysis ofengineers within an organization
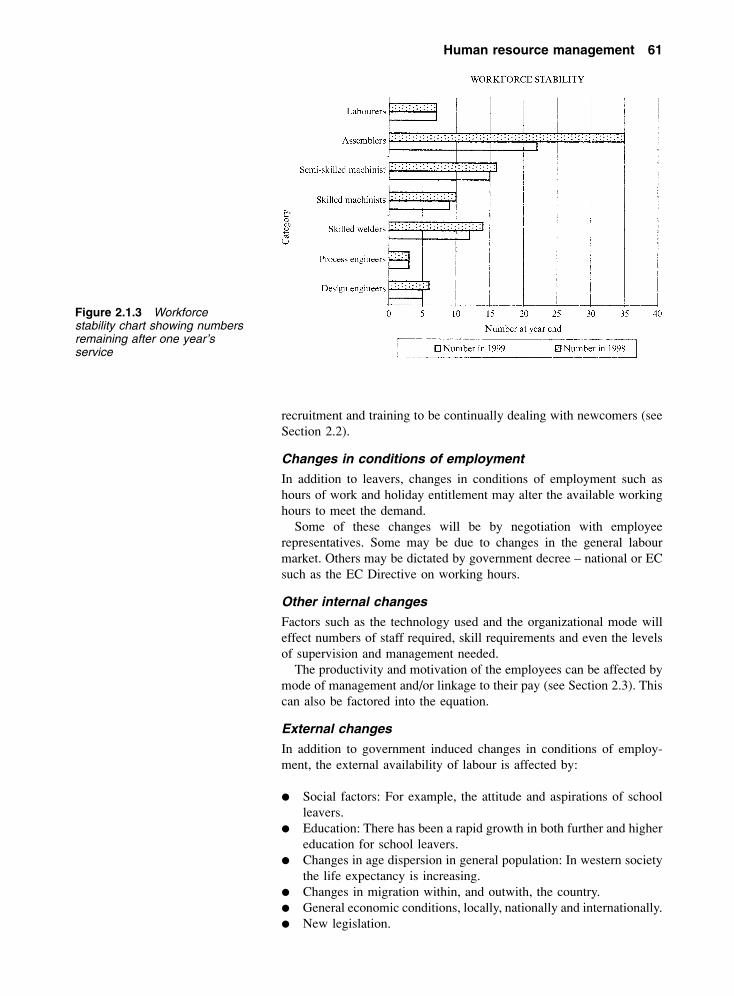
Human resource management 61
recruitment and training to be continually dealing with newcomers (seeSection 2.2).
Changes in conditions of employment
In addition to leavers, changes in conditions of employment such ashours of work and holiday entitlement may alter the available workinghours to meet the demand.
Some of these changes will be by negotiation with employeerepresentatives. Some may be due to changes in the general labourmarket. Others may be dictated by government decree – national or ECsuch as the EC Directive on working hours.
Other internal changes
Factors such as the technology used and the organizational mode willeffect numbers of staff required, skill requirements and even the levelsof supervision and management needed.
The productivity and motivation of the employees can be affected bymode of management and/or linkage to their pay (see Section 2.3). Thiscan also be factored into the equation.
External changes
In addition to government induced changes in conditions of employ-ment, the external availability of labour is affected by:
� Social factors: For example, the attitude and aspirations of schoolleavers.
� Education: There has been a rapid growth in both further and highereducation for school leavers.
� Changes in age dispersion in general population: In western societythe life expectancy is increasing.
� Changes in migration within, and outwith, the country.� General economic conditions, locally, nationally and internationally.� New legislation.
Figure 2.1.3 Workforcestability chart showing numbersremaining after one year’sservice

62 Human resource management
� Specific changes in the organization’s market:– new competition– new technology.
All of the above requires careful analysis to determine the potential ofthe existing staff resources and the labour market to meet the businessplan requirements.
Where a gap has been identified between the existing labour force’scapacity and that required by the business plan, the manpower plan laysdown how to bridge that gap. This will include recruitment, training,redeployment and perhaps redundancy.
Example 2.1.1
The following figures were calculated for an assembly shop:
1999Output: 750 000 unitsTotal hours worked by operatives: 70 000Employees: 38Annual hours per employee: 1842Standard available hours: 47 weeks at 40 hours per week
= 71 440Lost hours: 71 440 – 70 000 = 1440 = 2%
This led to the following plan for 2001:
Expected output: 850 000 unitsExpected productivity gain: 10%Required hours: 72 121Required hours plus 2% for losses: 73 564New standard annual hours per employee: 38 × 46 = 1748Number of employees required: 42Expect leavers and retirees: 8Number of new employees required: 12
Equal opportunity
At the manpower planning stage, it is useful to categorize employees bysex, ethnic origin and disability. This should include their level ofauthority, and will enable you to determine if there is under-representation of any of these group which may call for some positiveaction to redress this.
Finding the right person – recruitment
For an organization to be successful, it is important to have the rightperson in any job. The recruitment process is the entry point for allpersonnel, therefore this is the first opportunity to match what theorganization requires in its people.

Human resource management 63
The positive reasons are:
� The job will be carried out effectively in time, cost and quality.� Training time will be short.� The employee will remain with the organization.� The employee can change with the job.
The negative reasons are:
� The job will be carried out ineffectively, increasing cost and timeand reducing quality.
� Training will be long and perhaps ineffective.� The employee will leave within a short period – voluntarily or
otherwise:– requiring more recruitment time and cost– requiring further training time and cost.
� Other staff may be overworked to cope with one person’sshortcomings.
� Constant turnover effects employee morale.
It is important therefore that the recruiting process be:
� Effective: Finds and selects the correct person.� Efficient: Cost effective in staff time and advertising.� Fair: To all potential candidates, especially in legal terms.
The process involves identifying the requirements, attracting suitableapplicants and selecting the most suitable.
The job’s requirement
What is the job we need to fill?We need to examine both the present duties and skills required and
anticipate the changes that will likely occur within the near future.Consult the present job holder, colleagues, the supervisor and anyspecialists involved.
A vacancy may give an opportunity to revise that job and otherswithin the section in line with new technology or processes.
Job description
This document is the basis of many processes within HRM. It needs todescribe tasks and decisions made:
� Main purpose: A single sentence describing the job’s objective.� Main and minor tasks: What is done, including method and
equipment used including frequency.� Scope of authority: Decisions made, and referred.� Context: Who directly supervises, others reported to during work
day and any subordinates.� Working conditions: Physical, hours of work, shift pattern.� Special skill requirements.
An example is shown in Figure 2.1.4.

64 Human resource management
Personal specification
From the job description, we can decide the characteristics of a personwho would ideally fit the requirements of the job. As it is not alwayspossible to get the ‘ideal’, we should also indicate the minimumacceptable, e.g. someone with some of the characteristics needed whomay be fully trained and developed. We may also wish to attract peoplewho have the potential to move to other positions within theorganization.
We must ensure here that we do not introduce a bias against anyparticular section of the population by setting any unnecessaryrequirements. We may have to prove we are operating equal opportunityduring recruitment.
There are two commonly used systems for drafting a personnelspecification:
Alec Rodger’s Seven-point Plan:
� Physical make-up: Health, appearance, bearing, speech.� Attainments: Education, qualifications, experience.� General intelligence.� Special aptitudes: Mechanical, dexterity, words and figures.� Interests: Intellectual, practical, active, social, artistic.� Disposition: Acceptability, influence, steadiness, dependability,
self-reliance.� Circumstances: Ability to work unsociable hours, travel, move
location.
Munro Fraser’s Five-fold Grading System:
� Impact on others: Physical make-up, appearance, speech, manner.� Acquired qualification: Education, training, experience.� Innate abilities: Quick comprehension, aptitude for learning.
Job title: Maintenance technician Grade: 5
Reporting to: Directly to area maintenance engineer
Relationships: Co-operate with process supervisors and operators on shifts
Main job function: Maintain plant and equipment in optimum condition
Job content: Diagnose and rectify faults in electro-mechanical plant andequipmentCarry out minor alterations to plant and equipmentCarry out specified preventative maintenance tasksAssist production operatives in fine tuning operationalcontrol settingsInstall new plant and equipment
Qualifications: NVQ level 3 preferred
Experience: Three years minimum in similar job maintaining packagingmachineryExperience in microprocessor controls an advantage
Working conditions: Often will have to work in cramped and awkward positionsSubject to live electricity working, oil spillage and hotequipmentRequired to work shifts, periods of overtime and duringpublic holidays
Performance standards: Plant up-timeNumber of breakdownsSpares and other material usage
Figure 2.1.4 Job descriptionexample
Human resource management 65
� Motivation: Goals, consistency, determination, successes.� Adjustment: Emotional stability, stress handling, ability to get on
with people.
Attracting a suitable candidate
We need to select the process that gives the best opportunity of reachingthe target group of potential applicants:
� Internal: Often used for promotion, but can also be useful indeveloping present staff by widening their experience. It can also beuseful to move a person into a job that better matches their skill andaptitude. You do have more pertinent information on candidates, butmay be accused of favouritism. A point to note here is that beinghighly skilled at a particular task often has little relationship to anability to perform satisfactorily in a given one – perhaps ignoringthis has led to the Peter Principle that each employee will bepromoted up to his level of incompetence.
� Word of mouth of existing employees: Good for strong groupfeeling amongst workforce but will probably exclude some sectionsof the local population.
� Local education, schools, colleges, universities and career centres.� Media:
– local newspapers, etc. – especially for lower skilled personnel– national newspapers, etc. for higher skills– professional journals – for specialists.
� Recruitment consultants – temporary, specialists and senior posts.
Any advertisement should be carefully designed to attract mostly thosemeeting the personnel specification. It is as inefficient to attract theoverqualified as it is the underqualified.
Using application forms
Application forms are useful in providing in the same order all theinformation required to short list applicants. We should, however, use adifferent form for each type of job, only asking for the pertinentinformation against the personnel specification for ease of short listing.Unfortunately very few companies do so, which can put off potentialcandidates.
Selecting the best applicant
The initial stage is to prepare a short list from the applicants of thosewho appear to best meet the personnel specification. This reduceswasting both candidates’ and staff’s time and expenses. Wherepracticable reply to all applicants. You may want some applicants toreapply for other jobs later – if so, keep their particulars on files, and tellthem what you have done.
Inviting for interview
Short listed personnel should be invited for an interview/test. The letterrequesting attendance should explain to the candidates where and whento attend and also what they will be expected to be subjected to duringtheir selection.

66 Human resource management
This selection process, unfortunately, is full of opportunities forerrors. This is partially due to the methods employed, but also due to theartificial conditions where both sides attempt to match their needs,sometimes concealing the true situation.
Good selection has to be planned. Methods used include:
� Selection tests: Many jobs require skills which can be, and shouldbe, tested to determine competence levels. These can includemanual skills, writing and numeric skills, use of IT and even groupworking.
� Psychological: Although controversial, these are still often used todetermine attitudes and mental reasoning by larger organizations.
� Interviewing: The most common technique, but especially prone tosnap judgement. May be formal and/or informal. Methods are frominterviewing on a one-to-one basis by several people to beinginterviewed by a panel.
� It is common to have a form (see Figure 2.1.5) completed byeveryone involved in the process to ensure all candidates are judgedequally against the personnel specification criteria.
Bearing in mind time and cost, the more people who have connectionswith the post involved the better, to get a wide range of opinions. Makesure that they have received training in the selection process.
It is imperative that the direct supervisor is heavily involved forcommitment.
Criteria Minimum Candidates
Impact on others Confident approachand clear speaking
Attainment HND in electronics
Experience Two year similar
Comprehension Wide range ofproblem solving
Assertiveness Able to arguea point
Disposition Able to get peopleon their side
Self-motivation Involvement instudy and interests
Empathy Ability to see others’point of view
Circumstances Flexible
Figure 2.1.5 Interview criteria collection

Human resource management 67
Job offer
Bearing in mind the importance of this stage, it is necessary that thedecision is made to match the job requirement. Everyone involved mustaccept the decision made.
Remember that the unsuccessful candidates will be disappointed, butyou may still want to use them at a later date. Be courteous and informthem gently of your decision.
Make any job offer subject to receiving suitable references, butremember these may not convey the whole truth. They are best for factualinformation such as job title, length of service, attendance and duties, buta personal phone call may extract more useful background.
When making a job offer, always state any period of probationinvolved and the stages of review.
Finally, make arrangements for starting the new employee.
Contract of employment
The first legal step is taken here. Under the Trade Union Reform andEmployment Rights (TURER) Act 1993, employees must have withineight weeks of starting work an express statement detailing:
� Place of work.� Date of start.� Method of pay calculation.� Hours of work.� Holiday entitlement (and pay).� Sickness arrangements.� Period of notice.� Discipline and grievance handling procedures.
The Employment Protection (Consolidated) Act (EPCA) 1978 statesthat employees must receive a wage slip detailing deductions made. Italso confers rights against unfair dismissal after set time periods, whichare adjusted from time to time by different governments.
DiscriminationAt this stage make sure that you have covered yourself legally. Thepertinent Acts are:
� Equal Pay Act 1970: Equal pay for work of equal value.� Sex Discrimination Act 1975: No discrimination on grounds of sex
or married status.� Race Relations Act 1976: No discrimination on grounds of race,
colour and nationality.
Under these acts, it is not illegal to take positive action to encourageapplications from under-represented groups. It is illegal, however, tomake positive discrimination during the selection process. There areexceptions but they must be ‘genuine occupational qualified’, i.e. actors,care assistants, social workers dealing with particular ethnic groups.
� Disability Discrimination Act 1995: Grounds of physical or mentalimpairment.

68 Human resource management
Under this act, you must justify any decision not to employ a disabledperson and must make ‘reasonable adjustments’ to the workplace if thiswould aid the practical effects of the disability. Remember manydisabled people do make excellent employees.
Much of the disparity in pay is not due to the rate for the job itself,but could be due to a restriction in entry to the higher paying jobs. Equalopportunity policies are not yet required by law but are recommended.The Equal Opportunity Commission (EOC) have produced a modelpolicy which organizations are strongly recommended to mirror.
Summary of the EOC’s model EqualOpportunity Policy
(1) Introduction: Desirability of policy and need to be strictlyadhered to.
(2) Definitions: Direct and indirect discrimination defined.(3) General statement of policy: A commitment to equal
treatment and the belief that this is also in the interestsof the organization. Staff should be made aware of thispolicy and key personnel trained in the policy.
(4) Possible preconceptions: Examples of preconceptionsthat may be erroneously held about individuals due totheir sex or marital status.
(5) Recruitment and promotion: Care to be taken thatrecruitment information has an equal chance of reachingboth sexes and does not indicate a preference for onegroup of applicants. Care that job requirements arejustifiable and that interviews are conducted on anobjective basis. An intention not to discriminate inpromotion.
(6) Training: An intention to not discriminate with furtherdetails.
(7) Terms and conditions of service and facilities: Anintention not to discriminate.
(8) Monitoring: Nomination of a person responsible formonitoring the effectiveness of this policy and withoverall authority for implementation. An intention toreview the policy and procedures. Intention to rectify anyareas where employees/applicants are found to not bereceiving equal treatment.
(9) Grievances and victimization: An intention to dealeffectively with grievances and a note of the victim-ization clauses in the act.
There are other areas, such as age, where some discrimination appearsto take place, which are not at present covered by law. These are underdiscussion, but no legislation has emerged yet. Governments, however,are showing concern in these areas by requesting organizations toinclude discrimination practices such as ageism in their equal opportu-nity policies.
Human resource management 69
A body which has had some impact in employment matters is theEuropean Court of Justice. The EC is increasingly determiningemployee rights under legislation such as the Social Chapter with itsWorking Time Directive and Freedom of Movement for Workers withinthe EC. (Note that work permits are required for non-EC nationals,which can be a long and difficult process to gain.)
Terminating employee contracts
Eventually all employees will leave the organization – either voluntarilyor involuntarily. Sometimes this is because the employment contract hascome to a natural end – retirement or the end of a fixed-period contract.Sometimes it will be prematurely terminated by the employee or theorganization.
Whatever the reason, this process has to be managed to ensure boththat the employee is treated correctly and the organization does notsuffer.
Employee resignation
An organization has committed resources into selecting and thentraining and developing each employee. When an experienced employeeleaves, this investment goes with them and must be re-incurred. It willtake time and money to build up an equivalent competence level in anew employee – even when the selection process is efficient in findinga replacement.
In addition extra duties and responsibilities will probably have to beundertaken by the remaining staff. This can be difficult to do if staffnumbers are tight – for example, in a small company, and may affect theefficient operation of a section.
It is important that the organization establishes why the employeeleaves:
� The resignation may be due to factors unconnected with the jobsuch as family member moving to another location, looking afterchildren or old/sick relatives, returning to education, etc.
Examining these may lead to changes in conditions such aschildcare provision, job sharing, flexible time keeping, etc. to retainhighly competent staff.
� It may be a sign of problems in the job itself or the management ofit. If so then it may require input to prevent, or reduce the impact ofthe problem.
� It may be due to favouritism or harassment by other employees ormanagers which may come under headings such as sexual, racialismor bullying.
� It may be a sign that the recruitment process has:– incorrectly completed the job requirements, or personnel
specification– failed to select a suitable person.
� There may have been a failure in the training process, especially whenthe job has changed and training needs have not been identified.
� It may be that the organization has failed to recognize and makeprovision for the aspirations of the leaver.

70 Human resource management
� It may be that the job has changed resulting in a mismatch betweenthe holder and the new job requirements.
� Stress in the job.
It can be difficult to establish the full reasons why an employee decidesto resign, but careful questioning can prevent a costly repeat of asolvable problem. It will also limit the organization’s exposure to legalaction at a later date under unfair dismissal, or discrimination.
Note that when an employee has been ‘requested’ to resign and doesso, a court or tribunal may decide this was under duress and is in effecta dismissal. In addition a resignation gives the organization anopportunity to look again at its management of people and their tasksand could lead to improvements.
Natural ends of a contract of employment
Even where there is a natural end of contract, this requires managementfrom both the employee point of view and the organization.
Retirement
Normal retirement comes with plenty of advance notice giving theopportunity for succession planning and re-equipping the retiree for thenew phase of his life.
Some people will be looking forward to their retirement, but otherswill feel that it is the end of their usefulness. The latter will need carefulcounselling. The treatment of the retirees will be noted by the remainingpersonnel and may affect their commitment to the organization.
It may be that retirees will have an opportunity to assist in peak times,holidays or even maternity leave for a remaining member of staff. Somewill welcome short period or part-time work afterwards within theorganization. Their experience can often be useful.
Early retirement is also used for organizational and/or employeebenefit:
� It can ease redundancy situations.� It can reduce ‘log-jams’ in promotion.� It enables staff to pursue other interests, or start up their own
business.
The conditions attached to the pension scheme and any enhancementoffered by the organization will be critical here.
End of a fixed period contract
Because of the growth of this type of contract, the managing of itscompletion is important. The reasons include:
� You will need the holder to:– complete the time period– finish the work satisfactorily– hand over correctly to remaining staff– not take away important information such as customer details.
� You may require the leaver again in the future.� Your actions will be noted by any others on the same type of
contract.

Human resource management 71
It is no surprise that the construction and other cyclic industries such asship-building, suffer from a deluge of industrial action towards thecompletion of contracts.
You should treat end-of-fixed-contract leavers in a similar manner tothose leaving under redundancy. A court may even consider that becauseof the actual stay of an employee through renewal of short-termcontracts this constitutes actual normal employment and the leaver isentitled to redundancy terms and conditions.
Dismissal
Dismissal comes about by action from the organization to unilaterallyterminate the contract of employment.
It is another area where the law has introduced constraints uponorganizations to ensure that all dismissals are fair. Employees have theright to periods of notice, written reasons for dismissal and not to beunfairly dismissed under the Employment Protection Act 1978. This rightis normally tied to length of service which is set, and changed, bygovernment.
A dismissal can be considered fair on the grounds of:
� Lack of capability: Case needs to be shown of the lack in:– Skill or aptitude: Attitude may come under this heading.
Should have been addressed at the recruitment stage, butmistakes can be made there. A gross shortage needs to bedemonstrated that has not been remedied after repeated warningsand attempts at remedial action. Long periods of ignoring theshortfall by management will weaken the organization’s case.
– Qualifications: Simple misrepresentation is easy and may comeunder misconduct. Sometimes, however, the employment con-tract may require the holder to attain certain qualifications duringservice. A driver losing his licence would come under thisheading.
– Ill-health: Providing the circumstances are such that frequentabsence, or state of health, prevents the employee carrying out hisduties. Alternative methods of carrying out the job and alternativeposts need to have been considered.
� Misconduct: Very broad category, includes:– disobedience of a reasonable instruction– persistent absence or lateness– rudeness – especially to customers– criminal action– harassment of other staff.
� Redundancy: Can be under two circumstances:– employer ceasing to trade– work of a particular kind is no longer required.Note that redundancies also have to be discussed with the employeeand there is an obligation to inform the Department of Industry.
What courts and tribunals look at in these cases are:
� What is reasonable in the circumstances?� What procedure followed (not having suitable procedures is not a
defence)� Are all employees treated the same under the circumstances?

72 Human resource management
Awards may be financial compensation or an order to re-employ.Where the behaviour of management contributes towards an employee
leaving, the court may agree that there has been constructed dismissal.The employee may then have a case under unfair dismissal.
Redundancy
Although redundancy can be legally fair, is not usually due to the employ-ees’ direct actions and needs to be treated carefully to minimize the effecton those leaving and those remaining.
It must be continually stressed that it is the job which is redundant andnot the person as such. It can be fairly traumatic for an employee, aftermany years’ faithful service, to be coldly told that he/she is no longerrequired by the organization. Stress counselling will probably be requiredand assistance in finding new employment.
There is no legally recognized method of selecting those to be maderedundant. It must be shown to be on a reasonable basis. The conventionof last-in-first-out has no legal standing and often organizations make thechoice on a different basis – such as skill, competence or absences toensure they keep the employees they feel have most to contribute.
Often organizations employ means to encourage people to accept vol-untary redundancy by increasing their entitlement or granting enhance-ment to retirement schemes. The non-replacement of leavers is anothertechnique to allow natural wastage to reduce numbers.
Care should be taken that accepting volunteers does not result in somesections, or skills, undermanned and others with a surplus. Retraining andredeployment may need to be carried out to rebalance workloads.
Problems 2.1.1
(1) Why do you think some people stay longer than others in ajob?
(2) How would you describe the ideal person to carry out yourown tasks, using any of the plans.
(3) Look at the job adverts in local papers and professional jour-nals. Why are some more attractive to you than others?
(4) Think about any interview you have experienced. How wereyou greeted, put at your ease and questioned?
(5) Think about your place of work or study. What practical prob-lems are there in accessing and working for a person in awheelchair?
(6) Why have you left any position?(7) Under what conditions do you think both the employee and the
employer will feel comfortable in being re-instated after a tri-bunal decision?
2.2 Making themost of people –work design,training anddevelopment
For any organization to be fully effective, it must make full use of thepotential of its workforce. One route is motivation, which is a complexmixture, as this section demonstrates. Another is to train and develop thepresent employees to their maximum skill and potential.

Human resource management 73
The rise of scientific management
Previous to the rise of the human behaviour movement, management’sactions tended to reflect Theory ‘X’ of Douglas McGregor(1906–1964), that states that management saw workers as:
� By nature lazy and avoiding work if possible.� Lacking ambition and disliking responsibility.� Being self-centred and indifferent to organizational goals.� Resistant to change.
Much of the labour force were uneducated and in a different classstructure, which reinforced this view.
With the rise of the industrial revolution, traditional skills were nolonger in demand. For example, studies by Adam Smith, the eighteenth-century economist, into pin production demonstrated that the division ofjobs into small, highly specialized areas gave rise to large increases inproductivity. This division of labour gave an added advantage thatselection and training could more easily be carried out because of thelimited range of skills needed by the job holder.
In this climate, Fredrick W. Taylor’s (1856–1917) investigations atthe Bethlehem Steel Company gave rise to the birth of scientificmanagement. He proposed that:
� Work content (time) could be measured to determine a fair day’swork.
� Pay can be linked to this measurement.� All work could be studied to develop better ways of carrying out
tasks.� Workers should be trained in the best methods.� All planning should be a function of management.
Although Taylor’s theories came under severe attack, this has partiallybeen because of misapplication of his techniques by untrained, or evenunscrupulous, practitioners. His ideas and method of enquiry have givenbirth to work study and much of modern management thinking andspecialization’s – including HRM.
Henry Ford (1863–1947), amongst others, took these ideas further bydeveloping the system of mass production. This again substantiallyimproved output at that time, but led to severe deskilling coupled toclose control of work pattern and rate of working.
Motivation theories
Managers, and others, have always been interested in ways ofmotivating (and sometimes manipulating) the people under them. If anorganization can get its people involved, then hopefully they will bemore productive, make fewer mistakes and stay with the firm. There hasbeen an input into understanding what makes people functioneffectively. The driving force is:
UNDERSTAND >> PREDICT >> INFLUENCE
The leading theories put forward are:

74 Human resource management
Incentive theory
Here it is assumed that given the correct rewards (or punishment), theemployees will work harder. This lies behind the concept ofperformance related pay (see Section 2.3). The misapplication ofwork study has brought this into disrepute for hourly paid personnelbut surprisingly perhaps it is still used for senior executives today.
This theory states that an individual will increase his/her effort inorder to obtain a desired reward if:
� He/she has unfulfilled needs.� The reward meets this need.� The extra benefits are considered to be worth the extra effort.
Abraham Maslow (1908–1970) identified several layers of humanneeds:
� Physical: Air; food; water; warmth; sex; sleep.� Security: Safety; shelter; savings; no threats;
familiarity.� Social: Human contact; belonging; affection;
friendship.� Esteem: Self-respect; others’ respect; status; power.� Self-actualization: Fulfilment; realization of potential; doing
and enjoying what one does best.� Transcendence Spirituality.
Each layer is always in existence but one layer normally dominatesan individual at any one time (see Figure 2.2.1). Changes in personalcircumstances, such as losing a job, can change the dominatingfactor.
Figure 2.2.1 Maslow’s layersof human needs

Human resource management 75
Satisfaction theories
Fredrick Herzberg (1923–) identified that in most situations there areenvironmental factors that will motivate, or demotivate a person. Hetermed them motivators and hygiene factors. The factors are:
Motivators (satisfiers)� Achievement� Recognition� Work content� Responsibility� Advancement
Hygiene factors (dissatisfiers)� Company policy� Supervision� Salary� Relationships� Working conditions
The point he stresses is that should a motivator factor be consideredpresent it will normally motivate a person; however, if it is seen asmissing it will not necessarily demotivate that person. Similarly for thehygiene factor its presence, or perceived presence, demotivates but itsabsence will not produce motivation. Table 2.2.1 demonstrates thisconcept.
There is little evidence that satisfaction does in fact substantiallyincrease productivity. It undoubtedly does, however, appear to reducejob related stress and absenteeism and leads to long service.
The motivators link in with the incentive theory, if they are identifiedas rewards which meet some of Maslow’s hierarchy of needs.
Intrinsic theories
McGregor also offered an alternative Theory ‘Y’ to describe the averageworker:
� People are not by nature passive or resistant to organizational needs.They become so through experience within an organization.
� Work is a natural activity.� People will exercise self-control to meet objectives to which they
are committed.� People can work towards group goals, if they agree with them.� People can come to seek responsibility.� People are able to contribute creatively to workplace problems.
Table 2.2.1 Herzberg’s link to satisfaction/dissatisfaction
Existing Missing
Motivator Satisfied Not dissatisfiedHygiene Factor Dissatisfied Not satisfied

76 Human resource management
This, if true, presents a challenge to management to capture this naturalinclination and direct it towards organizational goals.
Human relations movement
Elton Mayo and his team carried out experiments initially to determinethe effect of rest and other improvements in conditions on accidents,absenteeism and labour turnover. Later studies, – the HawthorneExperiment – established that work groups, and modes of supervision,do significantly control the rate of output from a section. This happenedboth in positive and negative ways.
The problem is that man is a complex animal whose needs depend onhis inborn nature, his upbringing and education and how he perceives hisenvironment. Man is difficult to predict and cannot be generalized.
In addition, money is a general exchange good that can be given inreturn for the inconvenience of working and which can be exchanged forthings needed. This ability of workers to accept money and use it to meetneeds outside of the workplace clouds the whole area of motivation.
Job design
Early in the twentieth century, job design was all about worksimplification and cost minimization under three criteria:
� Breaking the work down into simple separate elements – deskilling.� Closely specifying the work to be done – no decision making.� Closely controlling the work rate – often using machinery to pace
actions.
This meant that jobs became extremely limited and did not require theemployee to make good use of their abilities. This resulted in alienation ofmuch of the workforce from the goals of the organization. Onemanifestation of alienation is absenteeism, another is a tendency forindustrial action to take place.
As more evidence became available, some organizations realized thatchanges in the working environment could lead to improvements inquality and output and reduce many of the negative incidents.
Early efforts centred around:
� Job rotation – moving operators around the simple tasks over theworking period.
� Job enlargement – increasing the number of simple tasks done by anoperative.
These did have some success in alleviating boredom, but still did notmake full use of the employee’s potential. Efforts since have movedonto:
� Job enrichment – both widening tasks done and increasing decisionmaking and creativity.
� Self-directed teams – giving a group substantial control over thetasks, including administrative tasks such as planning and commu-nication with other groups, in effect doing their own supervision.

Human resource management 77
The latter two have been shown to give better and longer lasting effects.Both have been used with substantial effect in both manufacturing andadministrative processes leading to reductions in technical support andmanagerial posts. A technique similar to work study has developedcalled Business Process Re-engineering (BPR).
Business Process Re-engineering (BPR)
The term was coined by Michael Hammer and James Champyin their book Reengineering the Corporation (1993).
BPR examines the core processes carried out within anorganization.
It is based on using work-flow analysis to identify how anorganization produces its product, or service. This highlightsthe key operations and decision-making points, especiallywhere they are done and who carries them out.
By using IT and different ways of organizing the workforce,substantial reductions in staff can be made whilst reducingthe calendar time taken.
An example would be the changes in a bank’s procedurefor granting personal loans. This used to take severalweeks with the application form going to a variety ofspecialist departments and passing though a number oflevels of authority regarding the amount. Now it is normallyhandled in minutes by one person using IT to access rulesand check pertinent information such as home address andcredit rating.
This has led to substantial restructuring and reductions inthe labour force – especially amongst specialists andmanagement.
BPR, like work study, has had some success and some failure. Theprobability is that the failures have been caused by mishandling inimplementation or resistance from corporate, or workforce, culture.
Improving employees – training anddevelopment
Assuming we have the right people working on correctly designed jobs,we have to ensure the holders receive sufficient and effective training tocarry them out.
There has been continual, but unfortunately continually changing,government interest in vocational training. This started back in 1964with the formation of Industrial Training Boards through to the Trainingand Enterprise Councils (TEC) in the 1990s and the introduction ofwork-based NVQs.
In 1991, the Investor in People (IIP) initiative was launched based onthe need to maintain and increase the UK’s competitive position inworld markets.

78 Human resource management
Investor in people
An Investor in People makes a public commitment from the topto develop all employees to achieve its business objectives.
� Every employer should have a written, but flexible, planwhich sets out business goals and targets, considers howemployees will contribute to achieving the plan andspecifies how development needs in particular will beassessed and met.
� Management should develop and communicate to allemployees a vision of where the organization is going andthe contribution employees will make to its success,involving employee representatives as appropriate.
An Investor in People regularly reviews the training anddevelopment of all employees.
� The resources for training and development should beclearly identified in the business plan.
� Managers should be responsible for regularly agreeingtraining and development needs with each employee in thecontext of business objectives, setting targets and stan-dards linked, where appropriate, to the achievement ofNational, or Scottish, Vocational Qualifications (or relevantunits).
An Investor in People takes action to train and developindividuals on recruitment and throughout their employment.
� Action should focus on the training needs of all newrecruits and continually develop and improve the skills ofexisting employees.
� All employees should be encouraged to contribute toidentifying and meeting their own job related needs.
An Investor in People evaluates the investment in training anddevelopment to assess achievement and improve futureeffectiveness.
� The investment, the competence and commitment ofemployees, and the use made of skills learned, should bereviewed at all levels against business goals and targets.
� The effectiveness of training and development should bereviewed at the top level and lead to renewed commitmentand target setting.
Investors in People Charter from the Employment DepartmentGroup’s 1990 Brochure. Crown Copyright is reproduced withthe permission of the Controller of Her Majesty’s Stationeryoffice).
The Investor in People initiative is interesting not only because of itshigh aims but also because of its tie-in of training and development tothe business plan of the organization.
This is where we will start – the business needs.

Human resource management 79
Identifying training needs
The events that trigger training needs include:
� New employee.� New technology, e.g. change from electromechanical design to
microprocessor control.� A change in working methods.� Increased flexibility – multi-skilling.� Promotion or transfer to another post.� Improvement of skills, e.g. to reduce quality problems.� Job enlargement/enrichment.� Changes in structure, e.g. a move towards self-managing groups.
Care is required that the identified need can be addressed by trainingand does not reflect some organizational or equipment problem.
Once we identify the actual need we need to break it down into whatwe are trying to install. The types of skills are:
� Cognitive skill: Basically thinking process – making decisions,analysing faults.
� Perceptual skill: Seeing and interpreting what we see – e.g. scanningan aircraft’s control panel.
� Motor skill: Controlling human physical movement; co-ordinationof limbs with senses such as sight and hearing often have to bemade.
Many jobs require a blend of each of these which is built up by trainingand requires continual practice to maintain at peak performance. Abilityin training terms is the level of competence in using a skill.
People do have varying degrees of ability in the different skills. Somedo appear innate, such as colour discrimination and spacial awareness.Most, however, can be developed, but not necessarily to the samedegree in everyone. For example, not everyone has the inherent abilityto develop to a world class athlete, but everyone’s performance can beimproved. Abilities are often transferable between jobs.
Where the required ability is difficult to develop, then the selectionprocesses must identify those who will struggle to attain them.
People also require core knowledge to be able to use skills effectivelyby having a background against which they can compare what ishappening. Knowledge required includes:
� Basic knowledge, which a trainee is expected to have beforetraining commences.
� Background knowledge about the company – especially so wheninducting a new employee.
� Knowledge specific to the job: Reporting relationships, procedures,equipment, materials, fault recognition and diagnosis, etc.
� Knowledge of Standards: Quality, output, attitude, etc.
We need to determine the blend of knowledge, skill and competencerequired to carry out the job. In other words we again have to carry outa job analysis – this time looking at these aspects (see Figure 2.2.2).
This information will come from a blend of observation andquestioning of employees, supervisors and sometimes suppliers (in thecase of new equipment or computer programmers).

80 Human resource management
It is the task then of how to install and develop this blend ofknowledge, skills and attitudes.
Designing training programmes
Approaches to operative and administration training:
� Learning-by-doing (sitting with Nellie): Often just informal bysitting with an experienced operator and observing and thencopying. Can be effective for low skilled tasks or where theexperienced operator is a trained instructor.
� On-the-job: Very common. Normally done by experienced operator/instructor or the supervisor of the post. Mainly on a one-to-one basisbut can be used for small groups.
� Off-the-job: Enables trainee to be introduced to new concepts andtheoretical information. Can suffer if relevance to job not seen.
Methods of training:
� Passive – lecture/demonstration: Passing of information frominstructor. Useful for blocks of new information.
� Active: Basically a learning-by-doing situation.� Workshops to discuss and develop skills.� Case study to analyse situations and approaches.� Simulation to practise skills and interpretations.� Computer-aided to learn and develop skills.� Distance learning.
Remember that learning is an inductive process – people need time toassimilate what they are learning. At the beginning they will require alot of guidance, so that they know what to do and this reduces thetrial-and-error sequence.
Feedback during the learning process is critical to attain a skill,knowledge or attitude. Constant repetition is required to attainfull mastery as most tasks move through the learning curve (seeFigure 2.2.3)
The induction of a new employee into an organization is normallya case of too much information too soon. This should initially belimited to the bare essentials of what they need right away with smallfeeder doses over the next few weeks – even using packages ofinformation to read.
Developing people
People need developing in many ways rather than through pure training.Many of the abilities can be shown but they need to be assimilated in thetrainee’s own way – especially in the field of management.
Figure 2.2.2 Breakdown of jobrequirements into componentparts
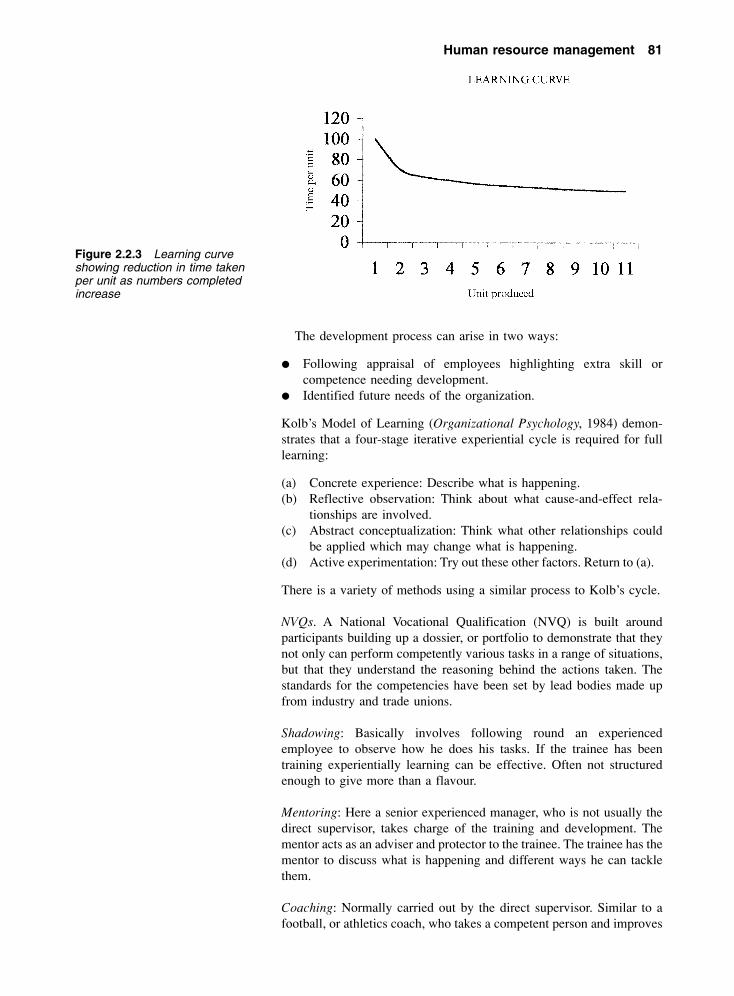
Human resource management 81
The development process can arise in two ways:
� Following appraisal of employees highlighting extra skill orcompetence needing development.
� Identified future needs of the organization.
Kolb’s Model of Learning (Organizational Psychology, 1984) demon-strates that a four-stage iterative experiential cycle is required for fulllearning:
(a) Concrete experience: Describe what is happening.(b) Reflective observation: Think about what cause-and-effect rela-
tionships are involved.(c) Abstract conceptualization: Think what other relationships could
be applied which may change what is happening.(d) Active experimentation: Try out these other factors. Return to (a).
There is a variety of methods using a similar process to Kolb’s cycle.
NVQs. A National Vocational Qualification (NVQ) is built aroundparticipants building up a dossier, or portfolio to demonstrate that theynot only can perform competently various tasks in a range of situations,but that they understand the reasoning behind the actions taken. Thestandards for the competencies have been set by lead bodies made upfrom industry and trade unions.
Shadowing: Basically involves following round an experiencedemployee to observe how he does his tasks. If the trainee has beentraining experientially learning can be effective. Often not structuredenough to give more than a flavour.
Mentoring: Here a senior experienced manager, who is not usually thedirect supervisor, takes charge of the training and development. Thementor acts as an adviser and protector to the trainee. The trainee has thementor to discuss what is happening and different ways he can tacklethem.
Coaching: Normally carried out by the direct supervisor. Similar to afootball, or athletics coach, who takes a competent person and improves
Figure 2.2.3 Learning curveshowing reduction in time takenper unit as numbers completedincrease

82 Human resource management
their performance by constructive critical comment and guidance.Regular feedback must take place for effectiveness.
Action learning: A similar concept to mentoring, except this time thementor’s role is undertaken by a group of the trainee’s peers. Basicallyapplies Kolb’s cycle. Being used significantly in post-graduate manage-ment studies and amongst self-development groups.
Evaluating the training
All training costs money and time. It should therefore be evaluatedagainst its aims of meeting the organizational and the individual needs.The evaluation should also check actual costs involved and benefitsreceived.
Records should be kept of what training staff have received and thelevels of skills attained. These should be periodically updated to reflectthe present competence level.
Methods of evaluating the training method include:
� Questionnaires: Immediate feedback from trainees – this evaluatesthe course more than the learning.
� Tests: Common on certificate courses. Can be used to test skills andknowledge competence. Can take the form of practical work such asa welding test.
� Pre- and post-questionnaires: To determine difference in knowl-edge. The post-questioning can be taken some time afterwards toshow retention.
� Post-training appraisal: Of the trainee by his supervisor aftertraining.
Problems 2.2.1
(1) Do you agree with McGregor’s Theory ‘X’ description of theaverage worker?
(2) What has personally motivated, or demotivated, yourecently?
(3) How would you reorganize the tasks in a McDonald’srestaurant?
(4) Why does training receive a low priority in manyorganizations?
(5) Think about a child learning to walk. How long does it takebefore he/she becomes fully competent?
(6) Do you think constant practice alone is sufficient to enableyou to master any task?
(7) Try to apply Kolb’s cycle to an activity which has been givingyou some problems in getting to grips with.
2.3 Rewardingemployees – payand benefits
Salary, especially when compared to others’ within the same organiza-tion, can be a source of discontentment as Herzberg stated (see p. 75).People often use salary, and other benefits, as an indication to theirrelative status within the organization.
Human resource management 83
This section examines different methods of payment and otherbenefits in use.
Objectives of a payment scheme
It is important that organizations design an effective payment system toavoid discontentment among staff. Such a system would have as itsobjectives:
External compatibility. Salaries and benefits should compare to thepertinent job market to attract new recruits and prevent losing existingstaff:
� Clerical and manual – local comparison.� Managerial and professional – national comparison.
Internal equity. Staff should recognize the fairness of:
� Equally graded jobs.� Differentials between grades.
Easily administered. To reduce cost and ensure the system is errorfree.
Easily understood. People should understand why their job is a certaingrade and why the salary for that grade is what it is.
Management controls. To ensure the best use of money spent onsalaries, there needs to be means of analysing and controlling the wagebill on basis of:
� Trends in numbers and various payment.� Controllability through standards and budgets.� Predictability over the short term.� Preventing drifting of earnings irrespective of output.� Ensuring match to skill needed and responsibility.� Retaining ability to be flexible and reactive to changes.
Participative. If the employees themselves are involved in the design,not only will their knowledge and judgement be involved, but it willprobably be more acceptable.
There are a variety of payment schemes which can be used alone orin combinations to match the needs of the organization and theemployees.
Payment schemes
Time rate
This is simply a set payment per hour, which is multiplied by thenumber of hours worked to reach due wage. There may be premiums forunsociable hours, overtime and even certain poor working conditions.

84 Human resource management
This is easily understood and aside from the differential issue seldomresults in disputes.
However, productivity is not usually measured and hence it isdifficult to control, except by budgets and close management. There isno direct incentive to improve output or reduce inputs.
Payment by results (PBR)
This is an effort to relate output/input usage directly to pay, whichstarted formally following Taylor’s work. It is best used where personalperformance greatly influences the output results.
Performance and PBR for an hourly paidoperator
The incentive paid is calculated from the operative’s overallperformance which is calculated out:
Performance (%) =
units produced ×standard time/unit × 100
time on standard work
Example:An operative works an 8 hour day, during which 160 units areproduced. Each unit had a work study issued standard time of3 min. During the day the operator attended a meeting lasting30 min and suffered from a machine breakdown lasting45 min.
Time on standard work = attendance time – time not onbonus work
= 480 (8 hours) – (30 + 45) min= 405 min
Standard min. produced = 160 units @ 3 min per unit= 480 min
Performance =units produced × standard time/unit × 100
time on standard work
=160 × 3 × 100
405
=48 000
405
= 119%
If the operative was on a straight proportional scheme whichpays a time rate at 75% performance and time + third at100% performance, then the pay would be 1.59 times time

Human resource management 85
rate – see Figure 2.3.1. This is calculated from time rate ×1.33 × (119 � 100).
Note: if the operator persuaded the supervisor to allow90 min instead of the actual 75 min incurred, then his timebooked on the work would decrease. In turn his performancewould increase to 123% and his pay to 1.64 times time rate.
Performance should be recorded for each individual overan extended period to give a history.
Performance can be used to judge the effectiveness of a group ofindividuals, such as a section or a department. Where used for paymentto large groups, a direct relationship between individual effort and paycan be difficult to discern. This overall performance could be used fora group bonus for supporting staff who are not on measured work.
The relationship between performance and pay can be geared toincrease incentive or reduce reward where varying conditions can affectoutput performance as in Figure 2.3.2.
PBR is expensive to install but initial gains in productivity to theorganization can be considerable. However, it must be well maintainedto hold accuracy of times set and prevent drift through ongoingimprovements by the operator.
PBR often results in friction between different workers when work isallocated due to perceived differences in ease of attaining targets. Thiscan be especially so when the process itself is highly automated andgives little opportunity for the operator to affect output – except inensuring the unit is constantly working.
PBR schemes will suffer credibility if management try to changetargets without justifiable reasons – such as a new method.
By far the main problems arise during periods of fluctuation in workload which could affect time on PBR, and hence earnings. This arisesfrom the frames of reference used by workers being different from thatof management:
Figure 2.3.1 Straightproportion payment-by-resultsscheme (showing relationshipperformance and pay)
Figure 2.3.2 Geared payment-by-result schemes

86 Human resource management
� Workers’ view: Over a period of time, they get used to receiving aset income under a bonus scheme. It becomes their norm. If for areason beyond the operators’ control, their performance drops, thentheir wage is decreased from this norm.
� Management view: Basic wage is the norm. Bonus payment underPBR is always an extra reward because of harder working. If for areason beyond the operators’ control, their performance drops, thenthey have not earned the portion of their wage related toperformance. Pay then moves towards the management norm.
Therefore we have a failure of minds meeting. This failure in commonthinking makes it easy for disputes to arise.
A linked problem is how to pay personnel who contribute towardsindividuals on PBR indirectly such as material handlers, inspectorsand even their supervisors. It is common practice to introduce apayment linked to the bonus received by PBR workers. This oftendoes not go down well with those whose have to expend extra effortto ‘earn’ their pay.
In addition to the normal measured PBR, there are other schemeswhich relate payment to performance:
� Sales commission: These are not based on the same detailedmeasurement of the work involved and are often based oncontribution analysis coupled to personal opinion. Few details areavailable on their make-up and effect.
� Management-by-target meeting: Some staff, mainly managerial,have pay directly linked to measurable output or to attaining setobjectives. Again few details are available on their effectiveness.
Measured day work
Because of the difficulty with PBR, and increased automation, manyorganizations have introduced this hybrid between time rate and PBR.
In this system the work content is still measured and targets set, butshort-term changes in individuals’ performance has no immediate effecton their wage. Some control is still obtained, and attitudes to changestend to be more flexible. The employee cannot directly influence hiswage by varying work rate.
However, in the short term, this tends to be more expensive than PBRbecause lower performance (whatever the reason) is not reflected in adrop in labour cost. Remedial action becomes a question ofnegotiation.
Plant and company schemes
These range from profit sharing to a value-added basis and increasinglythrough share options. These can catch employee interest because itreinforces the message ‘we are all in the same boat’.
It does have problems:
� Often payments are small in relation to the main paymentreceived.
� Because the efforts of many get amalgamated, the more contributingand harder working end up with the same benefit as less performingones.

Human resource management 87
� Because of the large time gap between an individual’s specific inputand payment the relationship to individual performance is muted.
� Payments can vary substantially, as much of the results aredetermined by market forces.
� Organizations’ fortunes depend on decisions contributed to by onlya few people – the top management.
� It is especially difficult to operate in adverse trading conditionswhere complex, uncontrollable external forces exist – often the timewhen employees have to work extremely hard and monetaryrewards are low.
Merit rating
This is a differential time-rate payment made to workers on the basis ofcertain attributes or skills. It often results in suspicion of favouritism.Considerable variation can occur between sections in a large organiza-tion. Over time there is a tendency for everyone to rise towards thehigher grades.
Appraisal related pay
More specific and open than merit rating, although it does share manyfeatures. Specially useful where individuals can be set targets and
Factor/Score 0 1 2 3 4 5 6 7 8 9 10
Timekeeping andattendance
Frequently late/poorattendance
Periodically late/occasional absences
Seldom late or absent Excellent timekeeperand attendance
Job knowledge Needs constantguidance
Needs regularguidance
Good knowledge ofjob
Excellent knowledgeof wide range of jobs
Quantity of work Unacceptable Occasionally fails toreach target
Targets regularly met Outstandingproductivity
Quality of work Requires constantchecking
Sometimes belowstandard
Satisfactory – usuallyaccurate
Consistent highquality
Relationships withothers
Does not get on wellwith colleagues
Co-operative, butpassive
Gets on withcolleagues
Very active teammember
Communications Poor communicatoroften misunderstood
Not alwaysunderstood
Satisfactory Thorough, accurateand clear
Problem solving Shows little initiative Able to solve minorproblems only
Good problem solver Shows flair andinitiative
Safety awareness Disregards own andothers’ safety
Often needs to bereminded re safety
Conscious ofimportance of safety
Sets example of safepractice
Acceptance ofresponsibility
Avoids responsibility Accepts someresponsibility
Accepts within ownjob responsibility
Frequently seeks extraduties
Forward planning Reacts only to events Limited to own taskonly
Good forward planner Highly proactive
Figure 2.3.3 Factors underappraisal related pay andassociated range of pointsagainst performance criteria(suggested by ACAS)

88 Human resource management
judged on their achievements. The award can be an extra percentage ora step up within grading. Differs from merit pay as the criteria are moreexplicit (see Figure 2.3.3) but scheme can suffer from similar suspicionand problems.
Performance distributions, e.g. a typical proportioning which can beused for setting payment differentials, are:
Exceptional 5% of staff paid + 10%Highly effective 15% of staff paid + 7.5%Effective 60% of staff paid + 5%Less than effective 18% of staff paid + 2.5%Unacceptable 2% of staff paid + 0%
Benefits
Pensions
There are three types of pension schemes.
State
There are two schemes administered by the UK government:
� Basic pension: This is contributed to and paid out from NationalInsurance contributions. It entitles all citizens to a basic pension. Inrecent years this basic state pension has been effectively reduced incomparison to the national average wage by successivegovernments.
� State Earnings Related Pension Scheme (SERPS) was an additionalpayment related to wage which built up credits towards additionalpension. It has been phased out.
Government pensions are funded out of present government income.The growth of people being entitled to the basic pension thoughincreased life expectancy has made government increased pressuretowards company and private schemes.
Company and industry schemes
There has always been advantages to both organizations and theiremployees from company pension schemes:
� Helps to recruit and retain employees.� Improves industrial relations.� Gives a mechanism for early retirement as part of redundancies or
long-term sickness.
Pension schemes vary considerably but normal provisions are:
� Condition of service for all staff.� Employee contribution based on salary.� Employee contributions may be ‘topped-up’ to increase
entitlement.� Employer matches employee’s contribution.� Contributions go into a separately managed fund.

Human resource management 89
� Pension is made based on final salary and years of service, althoughsome schemes work on average salary.
� Part of benefit may be taken as a lump sum.
Although men and women must have equal access to company schemes,different retirement ages and survivor payments are allowed.
Teachers’ pension scheme
Employee’s contribution 6% of salaryEmployer’s contribution 7.4% of salaryNormally employees contracted out of SERPS
Payment based on final salary multiplied by years of service(up to a maximum of 40 years) which is divided by a factor of80 to give a maximum pension of half salary. Extra years canbe purchased. Early retirement (below 60 years of age)results in decreased pension payments.
Example:A lecturer retiring from service in a further educationcollege.
Age 63 – no reduction in due amountFinal salary £26 000Years of service 25 years
Annual pension entitlement =25 × £26 000
80
= £8125
Lump sum entitlement = 3 × annual pension= £24 375
The government is keen that all employees become members ofcompany schemes as they are self-financing and reduce dependence onthe basic state scheme and back-up of social security payment.
Personal schemes
Although mainly for the self-employed, other people can take out theirown pension schemes or ‘top-up’ their company schemes.
Sick pay
As with pensions, sick pay is a mixture of state and employerfunded.
Statutory maternity pay (SMP)
An employee who is pregnant is entitled to Statutory Maternity Pay.This is for a period of 18 weeks, 90% for the first six weeks and 30%

90 Human resource management
for the remaining 12 weeks. These periods and payments may beextended in the near future. There are also rights for unpaid leave forfamily reasons for both mothers and fathers. This may become paidleave within the next few years.
Payment made is mainly recoverable from the Department of SocialSecurity (DSS). Many companies pay in excess of the minimum, butthis extra is not recoverable.
In addition the employee has the right to return to work for a periodof twenty-six weeks from the date of birth, and again this may belengthened.
Statutory sick pay (SSP)
Administered by the organization, the employer pays out a set paymentwhen the employee is off due to illness. This is later reclaimed from thestate. This is built up from:
� Qualifying days sick.� Waiting days – these are normally three days unpaid, but are linked
to any absence over the previous eight weeks.� Certification. A doctor’s certificate is required for over seven days,
but for less than this the employee provides self-certification.� Records must be kept for three years.
These payments can be transferred to the Department of Social Security(DSS) after twenty-eight weeks.
Company schemes
These can vary from the basic SSP to non-contributing schemes.These schemes normally have a qualifying period of service and pay
out full pay for a limited period followed by a reduced payment.
Absence and sick pay monitoring
Like any other benefits, this can be open to abuse by some employees.Most employees record low absences with small periods off. Othersconsider the scheme to be a right to take additional leave periods.
Careful monitoring is required – again bearing in mind equality andfairness in treatment.
Other benefits
There is a large range of extra benefits which organizations can offertheir staff:
� Reduced or non-contribution to pension schemes.� Private medical insurance.� Company car, or mileage, allowance.� Mortgage facilities and personal loans.� Subsidised meals.� Subsidised travel to work.� Clothing allowances.� Relocation allowances.� Discounts on products.� Education vouchers.� Childcare: Creches, nursery cost assistance, etc.

Human resource management 91
Initially these benefits arose as a cheaper alternative to making paymentdirectly to staff, therefore gaining an advantage through group schemesand a reduction in personal taxation. However, the tax authorities aregradually catching up demanding that tax be paid on the value of thebenefit received.
Some benefits are from time to time actively encouraged bygovernment, although sometimes different government regulationsappear to contradict this encouragement.
Job evaluation schemes
It is very unusual for everyone in an organization to be paid the samewage. This is understandably so, as different jobs require different skillsand have different responsibilities.
How does an organization decide on the ‘rate for the job’?The first way is to look at what the market pays and set the
organization’s rate around that. However, two factors cause problemshere:
� Local factors can often distort the rate for a particular job.� Similar names can be used for substantially different jobs.
Therefore if these rates are used they may be out of line with others inthe organization, which can cause feelings of unfairness.
Another way is to look internally at job rates – at least that is what thepresent employees are used to. This will result perhaps in a largenumber of different rates, which will need consolidating to around fouror five rates.
Reducing the number of job rates
If we take all the existing job rates, rank them numerically and thendraw a scatter diagram (see Figure 2.3.4), we should find:
� There is a considerable range.� There is a pattern – a trend upwards as the rates are pre-ranked.� There could be natural groupings.
Figure 2.3.4 Scatter diagramof existing hourly pay rates

92 Human resource management
If we carry out an exercise on this information (see Figure 2.3.5) wefind:
� There are four natural groups.� Two job rates do not fall into a particular group. These were found
to contain a pay element for supervision for leading a small team.� If we take an average for each group, this can enable us to select a
simple representative rate for that group.� When we compare the actual rate to that selected value, some rates
are higher and some lower. Therefore if we paid at the selected rate,there would be gainers and losers (see page 96 for benefits andproblems in job evaluation).
� When looking at the sex in each group, we find in the lower rategroups, it is predominately female and the reverse in the highergroups. This will need investigating to discover the reason – is it dueto real differences in value, or does it indicate a lack of either equalpay for equal work or equal opportunity in selection processes? Thisneeds investigating.
The basic remaining questions to be answered are:
� Is the rate a good indication of the value of the job to theorganization?
� Are the jobs on similar rates, close enough in characteristics to beclassified as having the same value?
If the answer to the latter two questions is yes, then it would be possibleto change into a reduced number of job rates.
However, changing technology and processes can often change theoriginal basis for differentials. We therefore need a method that canfairly differentiate between jobs, which is capable of slotting new jobsinto, or revising the rate for a changed job.
It must be stressed here that we are looking at the characteristics onlyof the job, not at how the present job holder performs in it.
Job rates Group Mid-pointvalue
Selectedvalue
Difference Number in GroupMales Females
£4.10 D £4.45 £4.50 £0.40 2 3£4.25 D £4.45 £4.50 £0.25 2 12£4.50 D £4.45 £4.50 £0.00 0 8£4.60 D £4.45 £4.50 –£0.10 3 24£4.80 D £4.45 £4.50 –£0.30 5 3
£6.00 C £6.28 £6.50 £0.50 5 15£6.33 C £6.28 £6.50 £0.17 3 2£6.50 C £6.28 £6.50 £0.00 20 44
£7.50 * 2 5
£8.75 B £9.00 £9.00 £0.25 15 5£9.00 B £9.00 £9.00 £0.00 1 2£9.25 B £9.00 £9.00 –£0.25 7 6
£10.50 A £10.94 £11.00 £0.50 5 0£10.75 A £10.94 £11.00 £0.25 15 3£11.00 A £10.94 £11.00 £0.00 12 2£11.50 A £10.94 £11.00 –£0.50 8 0
£14.00 * 5 0Figure 2.3.5 Analysis ofexisting wage structure showingrecommended grouping
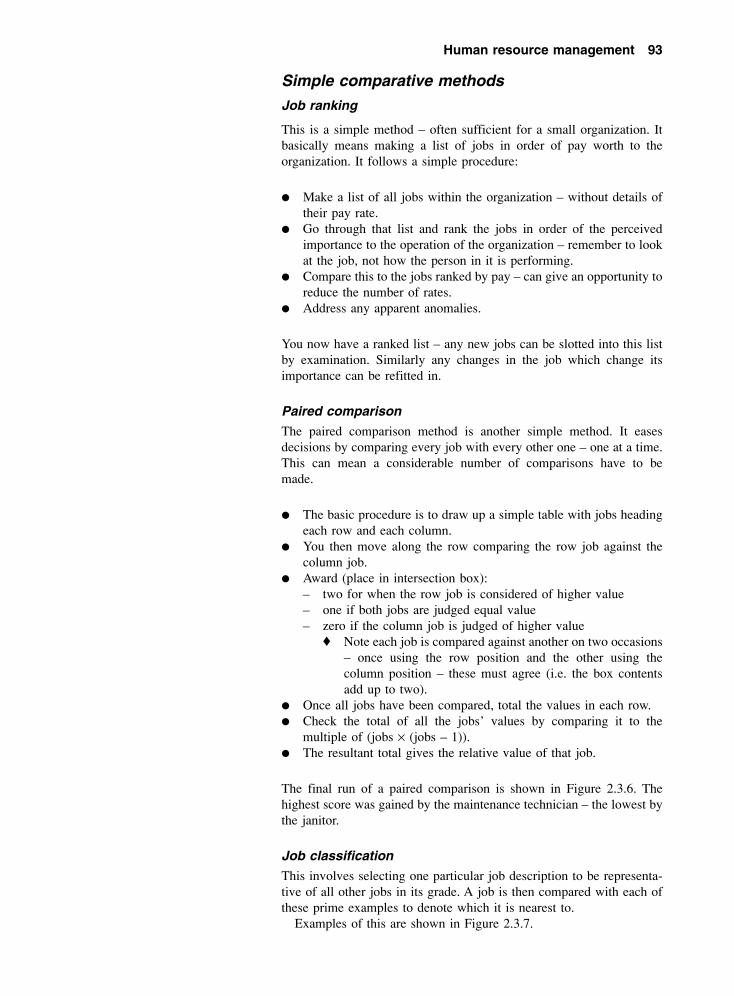
Human resource management 93
Simple comparative methods
Job ranking
This is a simple method – often sufficient for a small organization. Itbasically means making a list of jobs in order of pay worth to theorganization. It follows a simple procedure:
� Make a list of all jobs within the organization – without details oftheir pay rate.
� Go through that list and rank the jobs in order of the perceivedimportance to the operation of the organization – remember to lookat the job, not how the person in it is performing.
� Compare this to the jobs ranked by pay – can give an opportunity toreduce the number of rates.
� Address any apparent anomalies.
You now have a ranked list – any new jobs can be slotted into this listby examination. Similarly any changes in the job which change itsimportance can be refitted in.
Paired comparison
The paired comparison method is another simple method. It easesdecisions by comparing every job with every other one – one at a time.This can mean a considerable number of comparisons have to bemade.
� The basic procedure is to draw up a simple table with jobs headingeach row and each column.
� You then move along the row comparing the row job against thecolumn job.
� Award (place in intersection box):– two for when the row job is considered of higher value– one if both jobs are judged equal value– zero if the column job is judged of higher value
� Note each job is compared against another on two occasions– once using the row position and the other using thecolumn position – these must agree (i.e. the box contentsadd up to two).
� Once all jobs have been compared, total the values in each row.� Check the total of all the jobs’ values by comparing it to the
multiple of (jobs × (jobs – 1)).� The resultant total gives the relative value of that job.
The final run of a paired comparison is shown in Figure 2.3.6. Thehighest score was gained by the maintenance technician – the lowest bythe janitor.
Job classification
This involves selecting one particular job description to be representa-tive of all other jobs in its grade. A job is then compared with each ofthese prime examples to denote which it is nearest to.
Examples of this are shown in Figure 2.3.7.
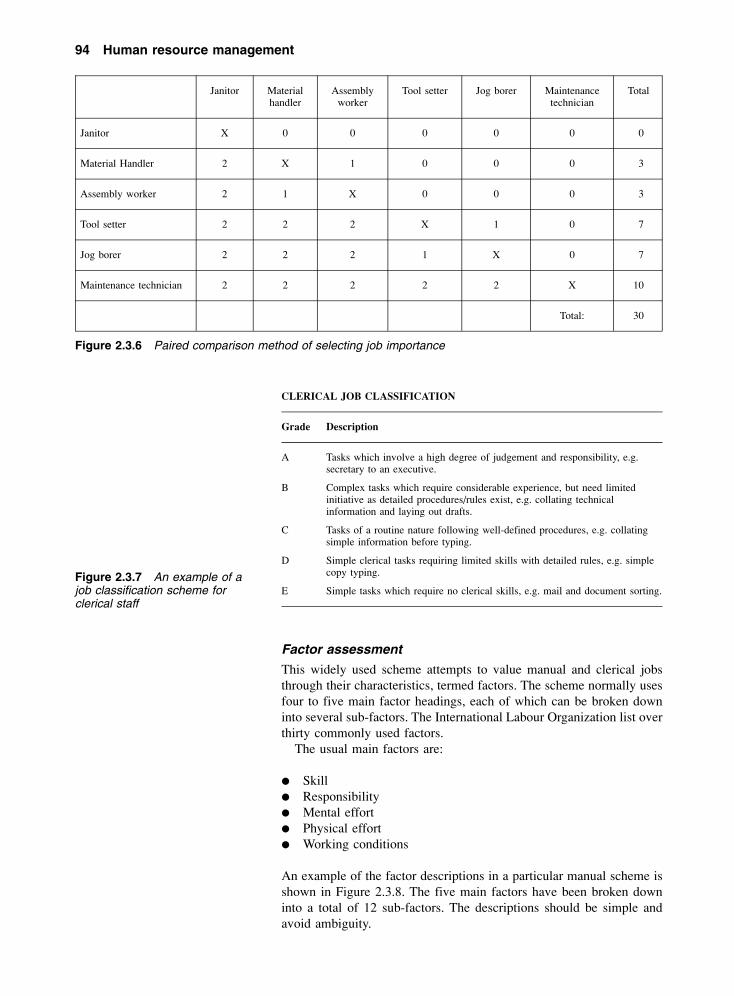
94 Human resource management
Factor assessment
This widely used scheme attempts to value manual and clerical jobsthrough their characteristics, termed factors. The scheme normally usesfour to five main factor headings, each of which can be broken downinto several sub-factors. The International Labour Organization list overthirty commonly used factors.
The usual main factors are:
� Skill� Responsibility� Mental effort� Physical effort� Working conditions
An example of the factor descriptions in a particular manual scheme isshown in Figure 2.3.8. The five main factors have been broken downinto a total of 12 sub-factors. The descriptions should be simple andavoid ambiguity.
Janitor Materialhandler
Assemblyworker
Tool setter Jog borer Maintenancetechnician
Total
Janitor X 0 0 0 0 0 0
Material Handler 2 X 1 0 0 0 3
Assembly worker 2 1 X 0 0 0 3
Tool setter 2 2 2 X 1 0 7
Jog borer 2 2 2 1 X 0 7
Maintenance technician 2 2 2 2 2 X 10
Total: 30
Figure 2.3.6 Paired comparison method of selecting job importance
Figure 2.3.7 An example of ajob classification scheme forclerical staff
CLERICAL JOB CLASSIFICATION
Grade Description
A Tasks which involve a high degree of judgement and responsibility, e.g.secretary to an executive.
B Complex tasks which require considerable experience, but need limitedinitiative as detailed procedures/rules exist, e.g. collating technicalinformation and laying out drafts.
C Tasks of a routine nature following well-defined procedures, e.g. collatingsimple information before typing.
D Simple clerical tasks requiring limited skills with detailed rules, e.g. simplecopy typing.
E Simple tasks which require no clerical skills, e.g. mail and document sorting.

Human resource management 95
JOB EVALUATION FACTOR DESCRIPTION
EXPERIENCE & TRAINING
EDUCATION: The minimum educational level necessary for a person to be capableof learning the job and reaching an acceptable standard of performance. Consider anymathematical or other skills required by the job.
EXPERIENCE: The accepted time after basic training to fully understand the jobtasks and deal with all but a few really exceptional circumstances which may arise.
TRAINING: The time required to receive basic training sufficient to be able to carryout the job.
PHYSICAL REQUIREMENTS
HANDLING: The exertion required to move materials or equipment during the job.Consider range of weights lifted and frequency involved.
WORKING POSITION: The extent to which discomfort is caused by any awkwardstance or position required to do the job.
MENTAL APPLICATION
COMPLEXITY/DEXTERITY: The extent to which the job requires concentrationand manipulative skills to execute variable sequences in the process and the frequencyof such use.
MONOTONY: The extent to which the job consists of short repetitive actions, orotherwise requiring no scope for selecting alternatives or other freedom of action.
RESPONSIBILITY
USE OF RESOURCES: The extent to which the job necessitates skill and care toimprove the utilization of resources or yield from materials used in the process.Consider the cost of a careless day.
JUDGEMENT/INITIATIVE: Responsibility for taking decisions for courses of actionto facilitate the flow of work to achieve targets, maintain quality levels, preventdamage to materials or equipment and ensure minimal equipment downtime occurs.
CONTACT RELATIONSHIPS: Regularity of contacts of a routine or complex naturerequired for giving or receiving instructions to control mechanical or manualoperations.
SUPERVISION
ADVISORY: Advises or explains tasks to other employees.
SUPERVISION & DELEGATION: Closely supervises work of other employeesand/or delegates’ work to others.
ENVIRONMENT
WORKING CONDITIONS: Those conditions in which the work is normally orperiodically carried out, e.g. in the presence of noise, dirt, fumes, damp, heat, cold.Consider the degree and combination of these factors.
HAZARDS: The unavoidable exposure to risk of possible injury, etc. after normalsafety precautions have been exercised. These apply both to the operator and othersnearby who may be subjected to the hazard.
The next stage is to decide for your particular organization whichfactor should contribute most towards people’s pay. This is highlysubjective and can differ between quite similar organizations. The objectis to achieve weightings which are understandable and fair to most staffin the organization.
The main factor weighting is then distributed across its sub-factors.Each sub-factor is then subdivided into 3–5 degrees normally withequal steps as in Figure 2.3.9. Note the points figure for a degree isindicative – actual points awarded can be between the values stated.
Figure 2.3.8 Job evaluationfactor descriptions. (Thecomments under each factormust be clear, measurable andsupportable)

96 Human resource management
The reason for having a total number of points available as high as the2000 shown here is simple. Even a low scoring job will end up with ahealthy looking number, hence protecting people’s pride.
Jobs have to have a detailed description using the same factors as thescheme before they can be evaluated. This requires training in thetechnique. Similarly the evaluation is best carried out by an experiencedteam to prevent bias creeping in.
The designed scheme must be tested against key jobs to ensure thatthe corresponding totals correlate to these job’s rankings. Only after thiscould the breakpoints between job grades be decided on.
You will find that the grade for some jobs has changed – up or down.When a job rate has reduced, it is common practice to protect thatperson’s salary for a set period – up to three years. During this period,the organization should attempt to find another post paying a similarrate to what the employee was receiving.
It also must be tested for any bias against any group of employees,such as women.
Management
There has been some attempts at evaluating executive positions but thesehave not been developed to a satisfactory conclusion because of the lackof standardization of roles and the relatively fewer posts involved.
These posts tend to remain outside formal job evaluation schemes andsalaries relate more to numbers of staff and turnover.
Problems 2.3.1
(1) What do you think is a fair basis on which to pay for differentjobs?
(2) If an operative is paid £6.00 per hour for first 37.5 hours withtime + half for overtime and works 48 hours what is his paybefore deductions?
FACTOR SUB-FACTOR TOTALPOINTS
MAXIMUMPER CENT
POINTSLOW MEDIUM HIGH EXCEPTIONAL
EXPERIENCE Education 500 5% 25 50 75 100AND TRAINING Experience 15% 75 150 225 300
Training 5% 25 50 75 100
PHYSICAL Handling 400 10% 50 100 150 200REQUIREMENT Working position 10% 50 100 150 200
MENTAL Complex/dexterity 400 14% 70 140 210 280APPLICATION Monotony 6% 30 60 90 120
RESPONSIBILITY Use of resources 400 10% 50 100 150 200Judgement/initiative 5% 25 50 75 100Contacts 5% 25 50 75 100
ENVIRONMENT Work conditions 300 10% 50 100 150 200Hazards 5% 25 50 75 100
TOTALS 2000 100% 500 1000 1500 2000
Figure 2.3.9 Points awardable against factors

Human resource management 97
(3) Should operators be paid the bonus rate for their fullattendance time, or just the time on bonus work?
(4) Which payment scheme would you personally prefer to bepaid by? Why?
(5) What percentage of final earnings do you think is fair to payas a combined state and private pension?
(6) Do you think continual ill health is a fair reason for dismissingan employee?
(7) What should you do if, following job evaluation, the rate for aparticular job involving a large number of staff comes out witha substantial increase?

98 Human resource management
AppendixProductivity
Any organization depends on producing a profit to survive. Profit isbasically the difference between the money earned and the money spentby the organization. Productivity is how well the organization makesuse of its resources, be it people, machines or material to produce a highprofit.
Basic work content of an operation
Most operation times are extended due to bad engineering ormanagement. Figure 2.3.10 gives an impression of the effect of differentfactors in determining the actual time taken to carry out an operation.
The basic work content is decided by the function of the part and isthe minimum (ideal) required to produce that function. The additionalfactors increasing the time taken from this basic time up until thatactually used are caused by:Work content added by poor design
� Designer selects material which is difficult to process.� Designer often selects process, which may not be ideal.� Design produces variety instead of standardizing hence adding to
non-value adding work.� Designer sets tolerances higher than function requires causing extra
processing.� Designer selects larger starting size than necessary causing extra
processing to reduce bulk.
Work added by poor methods
� Wrong process selected by designer.� Wrong machine selected by production engineering.� Wrong tooling selected by operator or production engineering.� Poor plant layout causing unnecessary material movement.� Process instructions wrong leading to extra reworking.� Machine operated incorrectly due to lack of training.� Insufficient handling devices extending process time.
Time lost by poor management
� Excessive variety of products leading to extra non-value addingwork.
Figure 2.3.10 Effect ofdifferent factors in the actualtime taken to carry out anoperation

Human resource management 99
� Lack of standardization leading to extra non-value adding work.� Many design changes leading to tool breakdowns and quality
problems.� Poor scheduling where similar work is not scheduled together.� Poor operational control extending process time.� Lack of raw materials leading to idle time.� Plant maintained poorly leading to extended process time.� Poor working conditions leading to lost time through extra rest
periods.� Poor safety precautions leading to lost time through accidents.� Poor training leading to inefficient operations and quality
problems.
Time lost by operative
� Poor method used different to that trained for.� Absence and lateness.� Slow work rate.� Carelessness.
There are a multitude of techniques which management use to reducethe actual time taken towards the basic required. They all rely onrecording and measuring what is happening now, developing bettermethods of working and then controlling to the new standardsproduced.
Work study
Work study is the systematic examination of all aspects of the workingoperation. Although it has been in formal use for almost a century, itsapplication has often been poor and has led to it having negativeimages.
The modern ‘in’ technique in management cost reduction – re-engineering – basically uses a similar technique. Work Study is usefulbecause of its systematic approach to identifying what is happening andthen developing improvements.
The two components of work study are:
Method study
To examine existing work methods and improve the effective use of:
� Material� Manpower� Machines� Movement� Space
Work measurement
To assess human effectiveness to give improved:
� Performance� Planning and control� Cost control� Incentives

100 Human resource management
Method study
The starting point for any change should be to examine and improve onwhat is presently happening – even before actually measuring the timetaken. In order of preference the basic objective for each task examinedis to:
� Eliminate� Combine, or� Make easier
The stages of method study are to select the operation to be studied onbasis of perceived importance:
� Frequent/common operation� High cost operation� High usage of a scarce resource (operative or machine)� Bottleneck operation� High scrap rates� Large time factor in critical lead time� New product/process
Record present operations using:
� Process flow charts� Flow diagrams� Multiple activity charts� String diagrams
These should include exact distances moved and the time taken but thisis not normally necessary the first time, as movement tends to be theeasiest task to alter.
The important tasks are the OPERATION and INSPECTION wherea material has work done to it or the material is counted orexamined.
Examine the present method, asking the following questions, andthen ask ‘WHY?’ to each answer received to the question:
� What is happening? WHY?� Where is it happening? WHY?� Who/what is doing it? WHY?� How is it being done? WHY?� What is the required specification? WHY?� What are the required standards? WHY?
Develop a better method by understanding and critically examining theWHYs collected. Follow the ‘WHY?’ by ‘WHAT ELSE COULD BEDONE?’ until ‘WHAT SHOULD BE DONE?’ is arrived at.
Common examples are moving operations in the sequence that theyare done so that the operative is carrying them out whilst the machineis working, as in Figure 2.3.11.
The proposed method should always be tested before finalizing.Define the agreed method so that it can readily be followed and act asa basis for later checking.
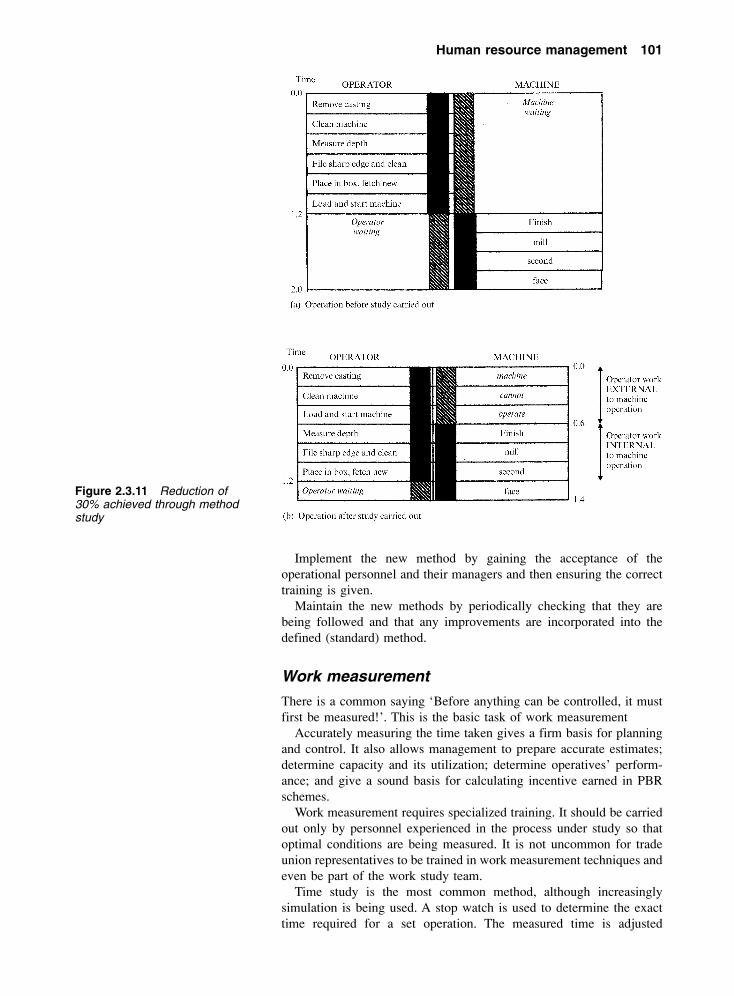
Human resource management 101
Implement the new method by gaining the acceptance of theoperational personnel and their managers and then ensuring the correcttraining is given.
Maintain the new methods by periodically checking that they arebeing followed and that any improvements are incorporated into thedefined (standard) method.
Figure 2.3.11 Reduction of30% achieved through methodstudy
Work measurement
There is a common saying ‘Before anything can be controlled, it mustfirst be measured!’. This is the basic task of work measurement
Accurately measuring the time taken gives a firm basis for planningand control. It also allows management to prepare accurate estimates;determine capacity and its utilization; determine operatives’ perform-ance; and give a sound basis for calculating incentive earned in PBRschemes.
Work measurement requires specialized training. It should be carriedout only by personnel experienced in the process under study so thatoptimal conditions are being measured. It is not uncommon for tradeunion representatives to be trained in work measurement techniques andeven be part of the work study team.
Time study is the most common method, although increasinglysimulation is being used. A stop watch is used to determine the exacttime required for a set operation. The measured time is adjusted

102 Human resource management
depending on the operative’s effectiveness to get a basic time. It is thenadjusted to give ample allowance for recovery from fatigue.
Rating
To measure work content, the work study observer has not only torecord the time taken but also has to apply a judgement on theoperative’s effectiveness. This judgement is called RATING and is acombination of effectiveness; speed; effort and attention.
The rating is carried out to a scale termed the BSI 0–100 scale. Thereare two fixed points on this scale – 0 for ‘not working’ and 100 for‘standard (incentive) performance’. Normally ratings only in the range75–125 are observed during a study. These can be described as:
� 125: A very high performance requiring a high degree of effort, skilland co-ordination. (Walking at 8 km per hour.)
� 100: A brisk performance. (Walking at 6.4 km per hour.)� 75: A steady, deliberate performance. (Walking at 4.8 km/hour.)
Taking the study
Just as in method study, there is a set procedure to ensure that the studyproduces an accurate and usable time:
� Set method: The study should only be carried out on an agreedmethod. This includes all data such as machine speeds and feeds,fixtures required, position of all tools and components.
� Divide complete job into elements: In order to ensure ease of takingboth elapsed time and rating, the entire job should be broken downinto easily recognizable small elements of between 0.1 and 1.0 min.The breakpoints between elements should be made easily recog-nized – e.g. laying down a tool, pressing a button, etc.
� Carry out study: Record start and stop times. Every event during thestudy should be noted.
� Work out study:– Standardize times: Convert every observed time into a normal-
ized time by multiplying by the observed rating:
Observed time = 0.45 minObserved rating = 90Normalized time = (0.45 × 90/100) = 0.405 min
– Select representative time: Table all standardized times for eachelement and select a representative time for that element:
ELEMENT STANDARDIZED TIMES
Load machine 0.40 0.43 0.42 0.39 0.550.39 0.41 0.23 0.42 0.410.41 0.39 0.40 0.41 0.40
Selected representative value by discounting any ‘odd’ values,such as those crossed out, and averaging the remainder:
This gives a selected time of 0.41 min.
� Apply compensating rest allowance (CRA) to each element tocompensate for energy expended carrying it out. This produces astandard time:

Human resource management 103
Standard time = normalized time × (100 + CRA)/100If normalized time = 0.41 and CRA is 15% thenStandard time = 0.41 × (100 + 15)/100 = 0.4715
� Decide frequency of element: Where an element occurs every time,its standard time will be allowed once per component.
Some elements, such as fetching material or tooling may nothappen once for each product. The selected time is reduced to thatproportionate for one product.
If an element only occurs once every 10 components then theallowed standard time for that element per component = standardtime per occurrence/10.
Add all allowed element times to give the standard time for thewhole operation. This is normally issued in two standard digitformats.
� Issue agreed standard time and output per hour at 100 performanceto operative and get their agreement.
Check the accuracy by carrying out production studies at set intervals.
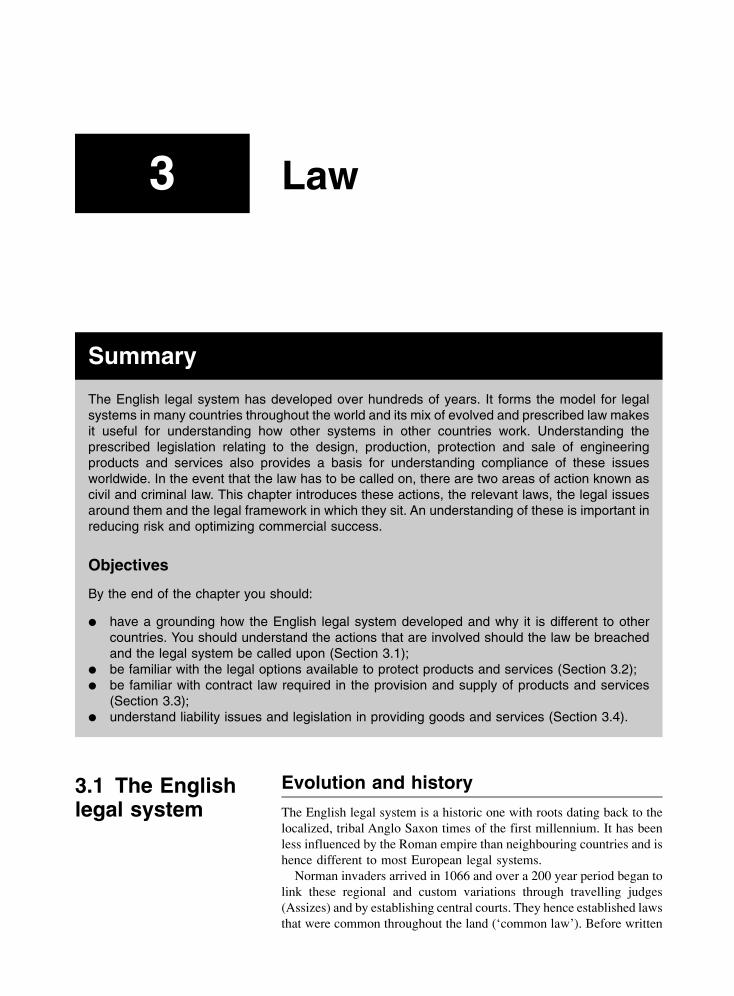
3 Law
Summary
The English legal system has developed over hundreds of years. It forms the model for legalsystems in many countries throughout the world and its mix of evolved and prescribed law makesit useful for understanding how other systems in other countries work. Understanding theprescribed legislation relating to the design, production, protection and sale of engineeringproducts and services also provides a basis for understanding compliance of these issuesworldwide. In the event that the law has to be called on, there are two areas of action known ascivil and criminal law. This chapter introduces these actions, the relevant laws, the legal issuesaround them and the legal framework in which they sit. An understanding of these is important inreducing risk and optimizing commercial success.
Objectives
By the end of the chapter you should:
� have a grounding how the English legal system developed and why it is different to othercountries. You should understand the actions that are involved should the law be breachedand the legal system be called upon (Section 3.1);
� be familiar with the legal options available to protect products and services (Section 3.2);� be familiar with contract law required in the provision and supply of products and services
(Section 3.3);� understand liability issues and legislation in providing goods and services (Section 3.4).
3.1 The Englishlegal system
Evolution and history
The English legal system is a historic one with roots dating back to thelocalized, tribal Anglo Saxon times of the first millennium. It has beenless influenced by the Roman empire than neighbouring countries and ishence different to most European legal systems.
Norman invaders arrived in 1066 and over a 200 year period began tolink these regional and custom variations through travelling judges(Assizes) and by establishing central courts. They hence established lawsthat were common throughout the land (‘common law’). Before written
Law 105
‘year books’ were used, legal issues resolved by one case set an examplefor other similar cases (the principle of ‘precedent’). Special cases weredealt with by the chancery under the principle of ‘equity’ (fairness) whichbecame precedential too. Common law and equity became combinedunder ‘the Supreme Court of the Judicature’ in 1873. Custom is hencenow succeeded by precedent but may still be applicable in certain cases,particularly in business. The precedent or case law system is voluminousbut is considered to be more flexible and realistic than the alternativeRomanized code or list-based systems used elsewhere.
Over the past 150 years, governments have contributed to the legalsystem by introducing legislation and statutes which overrule commonlaw. A government may also introduce a code (for example, highways,race relations, health and safety) which may not be actual law but mayinfluence a court in reaching a decision.
Legislation is interpreted by courts who must obey the law.Responsibility may, however, be delegated from the courts to subordinatebodies via enabling Acts. A lower court is bound by the decisions of asuperior court but not vice versa (although inferior court decisions andeven commonwealth court decisions may guide superior courts).
The absence of a written constitution, however, which would allowcourts to question legislation from the government, is sometimesconsidered as being unhelpful to the nation’s governance.
The Treaty of Accession with Europe in 1972 led to the EuropeanCommunities Act which allowed European Community (EC) legislationto be incorporated into United Kingdom law.
Most EC legislation is related to commercial and economic issuessurrounding Europe and the Community’s budget of around £50 bn. EClegislation comes in a variety of forms:
� Articles, which apply from person to person (horizontal) and personto state (vertical).
� Regulations, which are general and binding to all.� Directives, which are general but applied to particular states
(vertical).� Decisions, which are specific and have no legislative effect.
Common Market Law Reports, which are in themselves beginning toresemble a list of precedents, detail the legislation. The Council ofMinisters are sovereign representatives who act on Commissionproposals, and the European Court of Justice, assisted by the Court ofAuditors, ensures that the legislation is implemented.
Example 3.1.1
In R. v. Secretary of State for Transport, ex parte (on behalf of)Factortame Ltd (1991), Spanish fishermen were claimed to becatching part of the UK’s ‘quota’ of European fishing stocks byforming British companies and having their boats registered inthe United Kingdom. The government tried to prevent thisunder the Merchant Shipping Act 1988 and regulations madeunder it. The government lost the case and it was the first timethat the UK government itself had been deemed to be actingillegally.
Key point
The procedure for introducingnew laws is the circulation of aGreen Paper to interestedparties followed by a WhitePaper containing definitiveproposals. After approval bythe House of Commons,House of Lords and RoyalAssent it becomes an Act andis recorded in Halsbury’s Sta-tutes of England. An Act canonly be repealed, amended,consolidated (the grouping ofActs together) or codified (asummarizing of relevant caselaw and statutes). The Dereg-ulation Act 1994 also allowsthe Secretary of State torepeal primary business leg-islation without full parliamen-tary approval.
Key point
The European Commissionformulates the communitypolicy and drafts legislationand treaties which areenabled by administrativeActs. The European Parlia-ment contains 626 MEPs andacts as an advisory/consulta-tive, non-legislative body tothe Commission.
Key point
Around 70% of Britain’s busi-ness law now stems fromEurope. The transference oflegislative power towardsEurope is a concern to peo-ple who believe that legisla-tion should remain localized.

106 Law
How the system works
Civil law
Civil law concerns the resolution of disputes between individuals. Thedispute could be over a variety of issues such as small claims, contract,personal injury, land disputes or insolvency and usually involves anindividual seeking redress against another individual or against thecrown. Cases are referred to as plaintiff v. defendant.
An act with an element of blame leading to civil wrong is known asa tort (tort comes from the Latin ‘tortum’ meaning ‘wrong’). Fault canbe committed even without intention (‘mens rea’) which is known asstrict liability. Buying stolen goods, for example, could make you liableeven if you did not know the goods were stolen.
A careless action can lead to the tort of negligence provided thatthe ‘defendant’ had a duty of care, that the duty of care was brokenand that damage was suffered as a consequence. Designers andengineers have a duty of care towards their customers and hencedefective goods can lead to the tort of negligence (it can also lead toclaims for a breach of contract). With negligence claims, the onus isoften on the designer or manufacturer to prove their innocence. Avicarious tort occurs when a person is held responsible for a tortcommitted by others. For example, the partners or directors in a firmmight be held responsible by plaintiffs for the actions of a companyemployee which they know nothing about.
Cases of civil law generally start in one of the country’s 400county courts. A county court comprises circuit judges and solicitorsin gowns but not usually juries. Cases that are more complex cases,involve a higher magnitude of damages or require juries (such asdefamation) go directly to a High Court. There are 26 High Courtsorganized into three divisions; Queen’s Bench, Chancery and Family.It is the job of the District Registrar to determine where the case willstart.
County courts particularly are outgrowing the small disputes theywere originally set up to handle. Recent changes in proceedings forsmall claims are intended to make processing quicker and the use ofSpecial courts is also becoming more widespread. Special courts aregeared to specific cases such as restrictive trades court or patentdisputes. They comprise lawyers and High Court judges and have HighCourt status. Because they specialize they can be much quicker.Administrative tribunals are also used. These are smaller, less formalbodies that are subordinate to a court. They comprise lay members (thatis non-legal members of the public) looking at disputes such as socialsecurity, revenue or employment matters. If a tribunal oversteps itspowers the decisions can be questioned in the High Court and this isknown as a judicial review. A domestic tribunal will relate to matterssuch as trade unions and trade associations.
Court action takes the following steps:
� A writ (Queen’s Bench) or a summons (county court) is issued.� A preliminary hearing is held by the District Registrar.� A court appearance follows, usually by a solicitor(s) representing
the parties. The plaintiff proceeds by trying to prove guilt and theaction is then defended.

Law 107
A number of steps are, however, advisable before taking civil action:
� Are you in time? There are strict time limits by which time actionmust be taken and which depend on the type of dispute.
� Can you win your case? The decision will rest on the balance ofprobabilities. Even though you may be the damaged party you willhave to prove it.
� Can you afford to take action? Proceedings are expensive and youmay have to pay the other party’s costs if you lose. Legal aid coverscivil proceedings provided there is a reasonable case and insuffi-cient personal funds although it does not now cover personal injuryor administrative tribunals. Insurance may cover the legal costs oflosing and in certain cases it is worth discussing with solicitors ifthey would take a fee only if the case is won (a conditionalarrangement).
� Who should you sue? The purpose of suing is normally to extractdamages and it is sometimes necessary to claim from the moreaffluent party rather than the more guilty party. A pedestrian injuredby a poorly driven bus might sue the bus company rather than thebus driver, for example, because the bus company is more likely tobe able to pay a substantial sum than the driver.
� Is it worth it? How much will you receive? How long and howstressful will it be? Will you get bad publicity even if you win? Willor can the loser pay up?
� Can you negotiate a solution? Consider arbitration to help,particularly for resolving a contract difference. Arbitrators are oftenbased within the county court system and may refer just the legalaspect to a High Court (‘case stated’).
Criminal law
Criminal law is concerned with conduct and punishment for crimesagainst the state and public order, crimes against a person or property (acriminal act may therefore also lead to a tort) and others unclassified(such as traffic offences). Liability can again be strict. Cases are referredto as the Crown v. prisoner.
Magistrates’ courts contain a minimum of two Justices of the Peace(magistrates) who preside over minor offences, such as motoring, tradesdescriptions or breaches of the Factory Acts. Magistrates are lay personsappointed by committees and advised on legal issues by the Clerk to theJustices. Powers generally extend up to £5000 fine or 6 months’ jail, butthey can decide whether remand is necessary or whether the case isreasonable to go forward to crown courts. Crown courts have four levelsof seriousness ranging from trial by a High Court judge down to trialswith barristers with juries.
In criminal action, the steps are:
� The accused is summonsed. In criminal law there is no time limit toaction.
� The accused enters a plea and the prosecution (for example, theCriminal Prosecution Service or Factory Inspectorate) proceeds.Unlike civil cases which rely on the balance of probabilities, thereare strict rules and standards of proof which require absolutecertainty of guilt.

108 Law
� If proved guilty, compensation may be awarded to a victim, whichavoids a repeat case in the civil court.
� Appeals can be referred to a Divisional Court (two or three HighCourt judges) ruling on the procedure in questioned cases. TheCourt of Appeal (Master of the Rolls and Lord Justices) review thecase based on court and judges notes. The House of Lords is thehighest appeal source in the country and consists of ex-chancellorsand life peer Law Lords. Cases can be appealed directly here ifparties and the original judge agree. The European Court of Justiceis obligatory if no further internal appeal rights exist.
Problems 3.1.1
(1) What is the purpose of a Green Paper?(2) What is a Consolidation Act?(3) Explain why in the creation of legislation the European
Parliament is different to the British Parliament.(4) Explain why it is possible to be held responsible for
something you did not do?(5) In the civil case of Hedley Byrne v. Heller and Partners
(1963), a firm of advertising agents asked a bank to give areference for a customer they were considering giving creditto. The bank provided this but expressly disclaimed liabilitywhen giving it. The advertising agency extended creditfacilities but when the client failed to repay them the agencytook the bank to court arguing that the reference was givencarelessly. Who is the plaintiff and who is the defendant?Consider the issues and why the agency is suing the bankand not the customer. Consider whether you think the bankcould be held responsible.
Case study
The Gadget Shop v. The Bug Chain
The Gadget Shop Ltd (‘TGS’) ran shops selling novelty itemsthroughout the UK. In November 1999, the first defendant The BugChain (‘TBC’) opened a shop selling a range of similar products andemployed former employees of TGS. TGS issued proceedingsagainst TBC for attempting to deceive customers (in breach of thecommon law of passing off), infringing its shop fitting plans andclaiming that the former employees had improperly providedconfidential information relating to its product-knowledge file.
A court order was granted against TBC permitting the search forand seizure of its information. The order also restrained thedefendants from dealing with, using or disclosing any of theconfidential knowledge.
TGS sought a further order that a modified injunction becontinued until trial. TBC sought to set aside (annul) the searchorder on the basis that the legal procedures were not correctlyfollowed and that TGS had failed to make a full and frankdisclosure to the court.

Law 109
The judge held that there had been a number of administrativeand procedural errors. There were certain material departuresfrom the standard form of order about which the court was givenno opportunity to form or express a view. In particular, theomission to provide for a solicitor partner to be in the searchteams and the absence of any undertaking not to inform thirdparties of the order except for the purposes of the proceedings.TGS also did not disclose in its evidence, or inform the court, thatsince October 1999, the information contained in its product-knowledge file had been in the public domain via its website. Itwas improbable that, had the court been aware of the informationon the website at the application stage, the order would have beenmade at all, or at any rate in the form including the product-knowledge file. The order was discharged.
3.2 Productprotection
A company’s products and services, including its know-how, aresometimes referred to as its intellectual property (IP). It is important thatIP is protected to reduce the opportunities for other companies to copyit and to maximize its value.
There are many commercial ways of protecting IP including secrecy,technical complexity, being faster to the market place and branding.However, the law provides statutory methods known as the intellectualproperty rights. These are explained in the following section.
Intellectual property rights
The most common form of intellectual property rights (IPR) are patents,design rights, copyright and trade marks. There are different types ofright because each protects a different aspect of intellectual property:
� Patents protect technical or functional innovation.� Design rights protect shapes or configurations.� Copyright protects the representation of an innovation.� Trade marks protect a distinctive element.
Note that it is difficult to protect the idea in itself and that there must bea tangible element to the idea. You cannot protect the principle ofperpetual motion unless you have proved that it can be done!
Example 3.2.1
Aero by Nestle ®
Nestle would have found it difficult to protect the idea ofputting bubbles into chocolate per se. They can, however,patent the machinery and process that put the bubbles intochocolate, copyright the wrapper, trade mark the name andhave design rights in the shape of the bar.
Key point
Counterfeiting and piracy areestimated to cost companiesworldwide up to Euro 300billion per year, result in200 000 job losses worldwideand accounting for between5% and 7% of world trade invalue terms. The industriesmost affected are software,clothing and textiles, toys,music recordings, perfumes,publishing, pharmaceuticals,videos, car parts and sportsgoods.

110 Law
Activity 3.2.1
Imagine that the watch you use is a product that is new to theworld. Write down as many ways as you think possible toprotect it using the intellectual property rights available.
Activity 3.2.2
Form a design group and design a new type of folding bicyclethat will fit into the space usually provided in the boot of a carfor a spare wheel. Try to design in features that will allow youto protect the bicycle using intellectual property rights.
Patents
Description
Patents are governed by the Copyright, Design and Patents Act (CDPA)1988 which specifies that a legal monopoly is granted to an inventor fora limited period in return for payment of a small fee and for making theinvention known to the public. A patent can provide protection for atechnical or functional innovation. This covers the composition,construction, manufacture of a substance article or apparatus of aproduct or process. Excluded from patenting are artistic creations,mathematical methods, software, schemes, rules, discoveries of nature,biology, methods of treatment, surgery or therapy for humans oranimals. A number of exclusions, particularly in software, businessmethods and biotechnology, are, however, beginning to be accepted.
Benefits in owning a patent are not just in protecting the invention. Itincludes credibility, marketing tools and expansion through cross-licensing and technology transfer. It is also seen as helping to attractinvestment capital, particularly to internet companies which otherwiseoften lack tangible assets.
Example 3.2.2
Applications for computer related patents are growing at therate of 20%. Applications are more likely to be successful ifthey relate to ‘inventive software’, i.e. if the programdetermines the sequence of steps in a process which is to beprotected or if the software is embedded within a technicalapplication.
The Patent Office approved 301 patents for internetbusiness methods in 1999 compared to just 39 in 1998. TheUS Supreme Court (1999) upheld a ruling that an idea, in theform of a business method, was protectable by patentprovided that there was a useful result.
Key point
World trade in knowledge(IP) for the top economies isnow considered to be equalto that for goods and ser-vices.
Key point
In 1998 it is estimated thatthere were about 130 000new inventions leading to twomillion new patent applica-tions worldwide. This trans-lated into 640 000 registra-tions nearly triple the 220 000registrations made in the1960s. Sixty per cent ofthese were from Japan, 25%from the US and 11% fromEurope.

Law 111
This is leading to a growing number of court cases ascompanies battle over rights in the burgeoning IT world. Forexample, BT has announced that it holds the patent forhyperlink technology, the basis for surfing and linking theInternet. Internet companies are responding by claiming thatBT’s patent is invalid by saying that Apple’s hypercard systempreceded BT by four years and Project Xanadu (a webforerunner) beat BT by 20 years.
In the world of pharmacy and biotechnology, gene sequen-ces have traditionally been considered non patentable.However sequences are being patented provided they fulfilthe normal patent criteria, can be isolated, characterised,cloned and their function is known. Arguments over themorality and inventiveness of gene discoveries abound,leading to uncertainty in the law. This is again leading tobattles between companies.
Requirements
In order to be patentable an invention must be new, inventive andvaluable. To be valuable it must be useful in an industrial or agriculturalcontext. There is no lower limit on the level of value.
Example 3.2.3
Patents have been granted for inventions such as three-legged tights, cheese filtered cigarettes, kissing shields, beerbarrel hats and dogs’ ear protectors.
To be new the idea must not have been disclosed in any way, whetherwritten, oral or visually. Disclosure includes:
� Simply being made available to the public (it doesn’t even actuallyhave to be seen by anybody).
� Using e-mail which is not encrypted.� Trials to a third party or for profit.� Being made available to too many people or given to particular key
parties even if marked ‘confidential’. For example, a report marked‘private and confidential’ was disclosed even though it wascirculated to just 10 members of a 350 strong group.
Example 3.2.4
Confidential information
Any information is capable of protection if it is imparted inconfidence and if it is equitable. Confidential information istherefore information that must be of quality, have beenimparted obliging confidence and must have a use for theowner. Novelty is not a prerequisite.
Key point
In law, disclosure is oftenconsidered a grey area andthere is evidence of a move-ment by courts towards somedisclosure being allowed pro-vided that there is no chanceof analysis. A six-monthallowance is also made fordisclosure by theft or releaseat a trade conference.
112 Law
Confidentiality agreement clauses should identify back-ground knowledge, third party acquisition and duration.Courts use a springboard principle (a look at future events) indetermining the validity of the duration period.
Agreements do not guarantee against accidentaldisclosure
There is no definition of what comprises an invention but to beconsidered inventive the idea must not be ‘common general knowledge,not be obvious and beyond what is currently “state of the art”. Thesimpler the invention is the harder it is to prove inventiveness. It is alsohindered by hindsight. An inventive step can also be destroyed by acombination of documents which pieces together a solution (mosaic-ing). Success can be improved if the invention goes against generallyaccepted views or if the idea is commercially successful.
Application and procedureOwnership
A patent will usually belong to the inventor, except where ownershiphas been contracted otherwise, for example with consultants. It alsoincludes employment contracts and a company has ownership rights ifan invention is made in the course of specified (express) duties ornormal duties (expressed or implied). Innovation achieved in anemployee’s own time is a grey area if it relates to their normal job.
Application
The patent must be applied for. It is a generally recommended rule ofthumb not to apply for a patent if work to complete an invention willtake more than one year. Time, however, is strictly of the essencebecause in the UK the first to file a patent is the owner.
Example 3.2.5
Alexander Graham Bell filed the patent for telephones justtwo hours before Elisha Gray.
It is hence better to patent little and often rather than waiting for ‘the bigone’. It is also common practice to use many patents for one device.Kodak’s disc camera, for example, has over 100 patents. Somecompanies such as Canon create a citadel of patents, using many patentssurrounding the concept but without actually patenting or revealing thekey technology. The procedure for patent applications is straightforwardbut can be lengthy:
Unofficial search
Undertaking a patent search before applying prevents wasting timeand money. You can search for free but there are 36 million patents
Key point
A ‘selection’ invention is thename given to something thatis not new, but is applied in anovel or previously uncon-sidered way.
Courts use a person who is‘skilled in the art’ to determineinventiveness. They aredeemed to be experts whoare intelligent but unimagina-tive. If they can generate thesame solution given the sameproblem then the invention isconsidered obvious.
Key point
Note that claims can beamended (but not appended)up to 12 months after anapplication. It is also possibleto withdraw and reapply 12months later. Lapsed appli-cations are still confidentialand allow details of inventorsand owners to be establishedand corrected later.

Law 113
and only recent applications are electronically stored. Their organiza-tion has also undergone several major revisions and in order to carryout a complete search over the whole period of time, three searchclassifications with backwards and forwards concordances have to beused. A professional search service is therefore advisable. Patentagents, for example, charge around £100 for overviews and £1000 forsummaries (including translated texts). The Patent Office also offers aPatent On Line Search Service.
Filing
Filing an application involves completing Patents Form 1/77 andsupplying the following information:
� A bibliography comprising:A numberB nameC abstract.
Any named inventor on the patent must have contributed to theintellectual effort.
� A description and title.Entries in the following sections:
5–9 technical field10–31 background35–50 essential technical features54–90 list of drawings91 + particular description
Careful wording is required. For example:
� ‘Display means’ for a monitor is far more encompassing than‘screen’.
� ‘X for use as’ covers X for a wider range of uses than ‘the use of Xas’.
� Use ‘between the range’ and ‘preferably’ when referring tonumbers.
� Use ‘vertically, or nearly so’ in preference to saying just‘vertically’.
� Claims entered in the following sections:1 and 21 the main claims2–20 and 22–28 appendants (supplementary built on the main),29 commercial reasons31 omnibus (final catch all)
� A search report if applicable.
Careful phrasing is also required. For example:
� It has to be detailed enough so that another person of equalknowledge to the inventor could recreate the invention. ‘Real’patents are descriptive and intend to stop use by others. However,whilst these are easy to define in court they are more technicallyeasy to infringe.
� ‘Defensive’ patents are vague and aim to have the widest scope foran invention so that it can be exploited to the maximum. An
Key point
Limited searches can be ach-ieved using the internet. Try:
www.patent.gov.ukwww.patents.ibm.com

114 Law
example would be Intel patenting ‘microchips’, or Henry Fordpatenting ‘the car’. However, whilst these are harder to infringe theyare harder to enforce.
Courts are moving towards a purposive rather than exactingdefinition of the text, meaning that text is viewed as a signpost ratherthan a fencepost (Catnic case). Software is available to help withcomposing but professional help is always advised. The charge forwording a simple invention might typically cost around £800.
Example 3.2.6
James Watt was advised to write a vague defensive patent inhis application for a patent for the separate condenserprinciple (which formed the key element of his steam engineinnovation) in an attempt to broaden its applications. Watt’soriginal intention of a purposive patent would have subse-quently been better in warding off infringers of which therewere to be many. Watt particularly hated the Hornblowerfamily who invented the compound engine, referring to themas the ‘horned imps of Satan’. The government of the timewas not sympathetic to Watt, viewing any monopolisticcontrol of the fledgling power industry as unhealthy for Britishinterests.
Activity 3.2.3
Try drafting a 150 word application for your own product (orfor a rotary clothes drier).Examine somebody else’s application and see if you cancreate a similar invention without infringing the patent.
Filing a UK applications is free and the day of filing establishes apriority date which is a key reference point for UK patents. Theinformation is not released generally but the application is reported inthe Official Journal (Patents) OJ(P), usually around three months afterfiling.
An official search
An official search must be started within 12 months of the priority date.This is done by the Patent Office and costs around £200.
Publication
The results of the search are usually published 18–21 months after filingand are reported as the ‘A’ specification.

Law 115
Examination
Examination for the Patent/Office to consider whether the inventionusually is patentable must be done within six months of publication.This is now 39 months after the filing date.
Grant
The final approval or grant of the patent is known as the ‘B’specification. The normal duration for this stage is 51 months afterfiling. There is also a ‘fast track’ option for combined filing andsearching at the same time. This approach helps to reduce the additionaltime needed for searching and hence quickens the entire process.Subject to renewal actions every four years, the patent can be held up toa maximum of 20 years.
Activity 3.2.4
Find and comment on the applicability of the internationalpatent application PCT 94/20041 on vacuum assisted woundtreatment.
Infringement
Patent infringement is a civil matter. The infringement can be direct orindirect but must be for commercial reasons. You should communicatethe problem and the remedy to the infringer before taking legal action.A patent and number stamped on your product improves the argumentthat infringement has occurred intentionally. With cases of jointownership, a single owner can sue for infringement. The joint owner canthen be sided with the defendants but does not incur those costs.Damages are restricted to an account of profits or a loss of sales.
Example 3.2.7
Pure research and experimentation is not necessarily aninfringement but could be if the results have a commercialend (even if the research is early and commercialization is along way off). Similarly the mere repair of a patented articlewould not normally amount to infringement of a patent unlessit was construed as manufacture.
International
A UK patent can be infringed in other countries unless protection is alsosought overseas. Under the Paris Convention of 1886, the priority filingdate established in the UK allows a 12 month period between filing inother countries (with the exception of Taiwan). A UK patent must besought before an overseas patent can be sought and, if necessary,permission must be sought from the Ministry of Defence and the
Key point
Patent agents can now act aslitigators in the UK HighCourt in intellectual propertyrights cases, following thedesignation of the CharteredInstitute of Patent Agents(CIPA) as an authorizedbody. This gives companiesand individuals a simpler,more open and cheaper wayof pursuing intellectual prop-erty right claims. Previouslypatent agents could only actin the county courts.

116 Law
Department of Trade and Industry. Patenting overseas is time consum-ing and expensive. Foreign patents must also be reproduced in thelanguage of the host country (BASF, 1999).
The European Patent Organization (EPO) does co-ordinate a‘European patent’ (EPC) to which 19 states subscribe and which from2002 will include East European countries. The European Commissionhas also adopted a proposal for the introduction of a single communitypatent, which should be available by the end of 2001. The WorldIntellectual Property Organization also administers a Patent Coopera-tion Treaty (PCT), which covers many of the industrial states but costsupwards of £20 000.
One problem with establishing a common ‘worldwide’ patent thatwould reduce the cost is that different countries have different patentrules. The US and Japan operate a first to invent system rather than afirst to patent system. Filing can take place up to 12 (six) months afterthe disclosure of an innovation. Japan also has a less inventive‘utility’ measure midway between a patent and a design. The US andJapan also have an ‘inventor owns’ system rather than a companyowns system and assignment is then given to the company by deed ornominal payment.
Design rights
Design right (unregistered)
Design right is concerned with protecting the shape and form of aninvention, as detailed in Part III of the CDPA. Work must be original,more than copyright but less than an inventive step and includesmicrochips but not 2D designs or surface decorations (such aswallpaper).
Design right is granted automatically to the designer or originator,again unless contracted otherwise such as in employment. In acommissioned work it usually belongs to the person who commis-sioned the work rather than the designer. It is not a monopoly as thesame design can be repeated elsewhere if an originator comes up withthe same creation independently. It does prevent outright copying orcopying by reverse engineering for a period of up to 15 years from thetime of the design or 10 years from the first sale. The design shouldhence be publicized as soon, as loudly and as widely as possible to tryand diminish an argument that a similar design was producedindependently.
Registered design
An invention that has an aesthetic element as well as shape and formcan be registered, as detailed in the Design Act 1949. The act definesaesthetics as features that ‘appeal to the eye’ and includes patterns and2D designs. ‘Must fit’ and ‘must match’ articles such as functional carbody panels are however specifically excluded (BLMC v. Armstrong(1986)).
Registration is through the Patents Office. An application is around£260 plus any agent fees with subsequent five yearly renewals up to 25
Key point
A ‘first to invent’ systemrequires additional documenta-tion and evidence to corrobo-rate the date that the inventionwas conceived. It must beshown that diligence was exer-cised throughout the innova-tion process and that it wascontinual and uninterrupted.
Notebooks should therefore bekept that include facts andexperimental details, days offand why, be legibly numbered,signed off, have no blankspaces, have additional evi-dence glued in and excludingopinions, slang or jargon.
Key points
The World Intellectual PropertyOrganization (WIPO) is a spe-cialized United Nations agencywith 169 member states whosepurpose is the protection ofintellectual property rightsthroughout the world.
The ‘utility’ model is a Euro-pean proposal for protectinginnovation specifically aimed atSMEs. It will be similar to apatent and aimed at technicalinventions, products and pro-cesses and excludes discov-eries, theories, mathematics,aesthetic creations, schemes,information, biological materi-als, chemical or pharmaceut-ical substances/processes butwill be industry specific, willrequire a lower level of inven-tiveness (not very obvious tosomeone skilled in the art),simpler description, claims,drawings, abstract, filing fee,have one invention onlyembodying the underlying con-cept and provide protection forsix years. Combined with a onecountry does all method theutility model will be easier,quicker and have 50% lowercosts than patenting and with-out the necessity of searchingand novelty proof.

Law 117
years. In infringement cases, proof is by a consumer’s ‘imperfectrecollection’. In other words would a user confuse a registered designwith an infringing design.
Between 8000 and 10 000 designs have been consistently registeredthroughout the 1990s. Patterns and 2D designs are less frequentlyprotected because they tend to go out of fashion fairly quickly, but highlevels of filings are evident in electronic apparatus (walkmans, pagers,radios), containers and measuring instruments, with games, toys andpackaging showing the biggest area of growth.
Protection is automatic in some countries, but protection in the UKdoes not automatically extend abroad as the UK does not subscribe tothe international treaties that exist. Applications must therefore besought in individual countries (at roughly double the UK cost percountry). Registering a UK design right does though establish a sixmonth priority date, which can be carried forward into other countries inmuch the same way as a patent application.
The European Directive 98/71/EC proposes a Community-wideright, similar to the UK’s design right but with a shorter term of threeyears. A Community-registered design will be a single right, whichwill be effective throughout Europe. Nominated national courts ineach member state (for example, the High Court in the UK) havejurisdiction as Community trademark or designs courts in order toallow the enforcement of such rights. The Directive requires memberstates to implement the new legal framework into their law byOctober 2001. The Directive agrees to disagree on certain matters,most crucially the ‘right to repair’, leaving this up to national law forthe time being.
Copyright
Description
Copyright is the protection applied to the expression of an idea ratherthan the idea itself, as described in the CDPA. Originally this protectionestablished the rights of ownership of literary work but now includesartistic works such as sculptures and period furniture, dramatic works,musical works and arts (LDMA) as well as graphics, typography andcomputer programs. Generally speaking if the expression of an idea isworth copying it is worth protecting and is therefore copyrightable. Itrequires intellectual effort through skill and labour and not necessarilynovelty or innovation. Facts, ideas and names, for example, are notcopyrightable but compilations of facts are.
Example 3.2.8
Drawings are considered artistic works and are thereforecovered by copyright but not the subject of the drawingunless that is itself artistic. Similarly a film may be copyrightedbut there should be skill and care in taking the photograph.Photographing a three-dimensional object for an exhibitioninvolving positioning an object, the angle at which the shot

118 Law
was taken, lighting, focus and choosing the particular objectto exhibit, for example, are matters of judgement and skill thatcould be copyright protected (Antiquesportfolio.com plc v.Rodney Fitch & Co. Ltd). If the subject of the photograph ishuman then the photographer could be infringing thatperson’s copyright in their face and their privacy rightsparticularly if the photograph is commercially exploited.
Application
The originator of a work is the owner of the copyright althoughemployers have an automatic right of assignment if the work isproduced as part of the employee’s normal duties. Ownership ofcommissioned, consultative or independent consultant work is less clearbut the originator is usually the owner unless agreed otherwise.
Copyright is granted automatically. It is not necessary to use thesymbol ©, which has never officially been given legal status in the UK,but courts may find it helpful in establishing dates of authorship.Unopened, stored documents may also help in this respect. The ©,however, may be needed overseas and exports should always include acopyright warning.
Protection commences when the work is first recorded and lasts 70years after death. The period of protection is reduced if items (typicallymore than 50) are sold as they are then to be considered industriallyexploited. Protection is also less (50 years) for computer generatedworks, sound recordings (50 years) and typography (25 years).
Copyright is a ‘negative right’ in that it prevents copying, issuing,performing or adapting the work. Independent creation is not infringe-ment. There are also certain automatic rental and public lending rights.‘Fair dealing’ allows for some copying without owner’s permission.
Infringement, however, can be primary (for example, by directcopying) or secondary (for example, by using material that has beencopied). Therefore assume that all works are copyrighted to someone,somewhere unless the work specifically states that it is for public usedomain. Even basing work on someone else’s work requires permission,e.g. a story using somebody else’s characters (except for parody).
Current legislation imposes the burden of proof on copyright owners.At present, proceedings can fail because a well-advised and publiclyfunded defendant is able to drag out a good case by pleading not guiltyand requiring the copyright owner to prove all aspects of copyright(subsistence of copyright, authorship, chain of title, assignments). Thisconsiderably increases the length and the cost of the trial, and oftenfrustrates meritorious cases.
International
Unlike the UK, copyright in the US is not automatic and must beregistered. Also, where work in the UK is copyrightable if it is formedwith effort (i.e. skill or labour), in the US there must be some creativeeffort. The US also has a very low threshold of infringement which isdeemed a criminal matter.
Generally, however, similar rules for copyright exist as they do fordesign. These are covered by the Bern Convention, Universal Copyright
Key point
‘© Copyright (date) by(author/owner)’ is the usuallypreferred form of notice.
Key point
For education purposes, fairdealing allows reporting,research, abstracts, review,a 400 word text, multipleextract text totalling below800 words, and copying forcurrent events (excludingphotographs and filming).Individual establishmentsmay also have their ownarrangements.
Key point
A lax organizational attitudeto copyright infringementmakes the managing directorliable. Make sure, for exam-ple, that photocopiers haveadjacent warning notices.

Law 119
Convention, Rome Convention and various EC Directives (includingthe Protection of Computer Programs, Rental and Lending Rights,Television without Frontiers, Cable and Satellite, Terms of Protection,Protection of Databases).
WIPO attempts to harmonize global copyrights in 1997 led to thesubsequent EU Copyright Directive and related Acts (Rights in theInformation Society) which may ultimately give rise to changes in UKlaw. These might include:
� Broader reproduction rights (including temporary copying).� Rights to communicate works to the public.� Protection against technical circumvention.� Copying some text commercially onto paper for fair compensation.� Copying for private non-commercial in return for fair compensation.� Copying in libraries and universities including use for teaching or
science which is not commercial and which must be acknowledged.
Related rightsMoral rights
Moral rights are related to copyright but are concerned with the right tobe recognized as the originator of the work rather than the owner of thework. Moral rights do not apply to computer programs, computergenerated works, typefaces, news and current events work, collectivereference works. A moral right is an inalienable right (which means thatit cannot be transferred unless it is in a will) but it is a right which mustbe asserted. It covers the following for which infringers can be sued:
� Paternity or the right to be identified and credited as the originatorof the work.
� Integrity and the right not to have work subjected to derogatorytreatment. Work protected by moral rights should not be intentionallydestroyed, damaged, altered, retouched, modified or changed in anyway whatsoever without the written permission of the originator.
� The right not to have false or joint work incorrectly attributed to youor by others.
Performing rights
Performing such as street theatre or singing is normally considered asthe delivery of a performance which is viewed as the supply of a servicerather than a product. Current legislation implies that the free circulationof such services is freely applicable. However, more recently courtshave determined that Article 59 of the Copyright Act applies whichwould exercise the same rights as exists for goods. The re-enactment ofa performance may hence be an infringement if the performer is offeringthe performance in your guise. Rights in performance, however,represent protection against unauthorized recording, broadcasting,copying, issuing, showing of a live or pre-recorded show including theWeb. Reproduction, distribution and rental rights are transferableproperty rights with protection that lasts for 50 years.
Digital copyright
Electronic information receives the same copyright protection as writtenor printed matter. Unless covered by contract or fair dealing,

120 Law
infringement of copyright includes, scanning, rekeying, downloading orsending copyright material on a LAN or fax. Copyright was, however,created for a paper world and the facility to gather, clone, manipulateand distribute information without detection makes its application in themodern electronic world problematic. The problem is likely to increaseas processing, compression and bandwidth technologies improve and asknowledge and ‘virtual companies’ become more important. Testing thelaw in the cyber world is also often new and untried.
Database right
Databases qualify for copyright protection under the ‘compilation’ ruleof the CDPA. Hence copyright exists where authors have selected andarranged database contents using intellectual means. This would, forexample, exclude a telephone directory. ‘Database rights’ also existwhere a substantial investment has been made in obtaining, verifying, orpresenting the contents of a database. It is an automatic right thatprevents unauthorized use or extraction from the database. Protectionlasts for 15 years but major revisions will continue to generate 15 yearextensions.
The Web
Net published work is copyrighted with the exception of URLs ande-mail addresses which are facts and therefore not applicable. Readinga web page automatically involves making a copy of the page andstoring it in a computer’s RAM which might in itself be viewed as acopying infringement and make both user and internet service provider(ISP) liable. It is, however, generally accepted that there is an impliedlicence to do this provided the provider has the right to offer the pageinitially.
In the UK, ISPs are considered publishers in common law becausethey have the power to store and delete information from authors(Godfrey v. Demon) and they are therefore liable to claims againstinfringement. Preventative steps should include limiting the number ofnewsgroups, restricting links and access to personal sites, publishing acontact’s name, observing information regularly and removing con-tentious information immediately. Beware also of the Obscene Publica-tions Act 1959 which covers simply making such material available. AnISP would be responsible if it failed to remove the material once itsobscene nature was determined.
The Shetland Times case has, however, raised the issue of copyrightinfringement of one site linking to another. An interactive site can beconsidered a web, with this implied licence for all to use, but a non-interactive site might be considered a cable television service whichwould put the onus of infringement on the viewer rather than the serviceprovider.
This perspective stands more akin to US rulings which consider ISPas providers of equipment similar to telephone service providers. TheUS Online Copyright Infringement Liability Limitation Act givesgreater power to copyright owners over digital reproduction but limitsthe liabilities of ISPs at the expense of users. The ISP must not be awareof infringement, should not receive a direct benefit from the infringingarticle and acts rapidly when made aware. The Digital MillenniumCopyright Act (World Trade Organization) endorses the US stance ofuser rather than provider liability.
Key point
The global nature of the Web,makes it easy to infringe avariety of laws in other coun-tries including copyright andobscenity.

Law 121
Example 3.2.9
As an example of the dangers to users, a US Federal DistrictCourt in Utah has issued a temporary injunction against aSalt Lake City non-profit organization that admittedly pub-lishes ‘critical research’ on the Church of Jesus Christ ofLatter-day Saints, also known as the Mormon Church.According to reports, the ruling was intended to stop the UtahLighthouse Ministry from posting e-mail messages on itswebsite telling readers where to find online copies of a bookpublished by the Mormon Church. In essence, the courtupheld the contention of the Mormon Church that theLighthouse Ministry was guilty of ‘contributory infringement’of the Mormon Church’s copyrighted Handbook of Instruc-tion. The implication is that simply providing an address orlinks could be a copyright infringement.
Software
Rules for software are covered by the Copyright (Computer Programs)Regulations 1992 appended to the Copyright Act 1988. Independentcreation is allowed and software companies separate departments whichanalyse competitive and market information from departments whichwrite software, to ensure that independent creation is seen to be done.
The United States Department of Justice, the Federal Bureau ofInvestigation and the United States Customs Service have established alaw enforcement initiative aimed at combating the growing challenge ofpiracy and counterfeiting both domestically and internationally. TheIntellectual Property Rights Initiative will focus on people who stealtrade secrets, counterfeit chips and software, and pirate programs overthe Internet. The US No Electronic Theft (NET) Act was passed in 1997specifically to close a loophole in piracy laws, which previously meantthat it was illegal only to sell copyrighted software and other electronicmedia.
Electronic mail
Technically even forwarding an e-mail sent to you requires theoriginator’s permission. E-mail messages sent to a public list areregarded as having an implied licence for publication, which will allowothers to keep a copy, quote and forward the piece. Beware of distortionof the message and false attribution which may infringe moral rights,however.
Case studies
(1) The United Kingdom recently upheld the decision to grant asoftware company only limited injunctive relief against suppliers,who were found to be using counterfeit software and dismissedthe appeal. The court found that there was no invariable rule orprinciple as to the relief to be granted in intellectual propertycases. The judge had found that the infringements were relatively
Key point
It is estimated that of the 615million new business soft-ware applications installedworldwide during 1998, 231million or 38% were pirated.
Key points
Be particularly aware of acci-dental infringement. Justbecause work may be offeredfree, on the Web, for exam-ple, does not mean it is notcopyright protected andindeed the offer may notcome from the originator.Making use of such informa-tion is a breach of copyright ifthe owner loses income orthe breacher gains income.Even forwarding materialsent to you may be in breachof copyright and it may beadvisable to destroy elec-tronic copy once used. Pass-ing on information as towhere to find downloadabledata is also illegal.
The arguments for andagainst greater control arewide ranging and include theright to reward for innovatingagainst the right to the free-dom of information.
Technological protectionmay anyhow provide bettersolutions than the law. ‘Digi-tal guardians’ include know-how, encryption, electroniclocks, ‘watermarked’ picturesand passwords. Companiesare now producing softwarethat can protect either theprinting or downloading of apart or a whole document,including the source code toprotect the web designitself.

122 Law
minor and unintended. This fully entitled the judge therefore torestrict the relief, tailoring it to match the wrong that had beencommitted. The case in point dealt with software, supplied to thecompany acting on behalf of inquiry agents employed byMicrosoft, purporting to be Microsoft’s Windows 95 software. Theywere in fact counterfeit and had been purchased by the companyfrom an existing customer with whom it had longstandingbusiness dealings. The company denied knowing that thesupplies were counterfeit. The judge found that the company hadinfringed Microsoft’s intellectual property rights, but only in arelatively minor and unintended way and in circumstances inwhich there was no evidence of any intention of repeating theinfringements.
(2) The US Department of Justice won its first MP3 case againsta University of Oregon student for illegally distributing copyrightmaterial (MP3, or Mpeg 3, enables digital audio material to becompressed into compact file sizes and transmitted on theInternet or burned onto recordable CDs). A United States FederalCourt has also heard a plea of guilty from a counterfeiter andsoftware pirate, who faces charges of distributing more thanUS$13 million worth of counterfeit compact discs and computersoftware programs. Using state of the art copying equipment thedefendant operated two warehouses, where CDs were copied bythe thousands, according to prosecutors. The counterfeit discsincluded Microsoft Office 97 programs and an assortment ofpopular musical CDs. The defendant admits to distributing morethan 332 000 counterfeit musical CDs and more than 50 000copies of Microsoft software programs. The musical CDs whichwould have had a legitimate retail value of about US$16 each,sold for about US$10 on the black market, while the Microsoftprograms, costing about US$400 at legitimate retail outlets, had astreet value of about US$200 according to prosecutors.
Trade marks
Description
A trade mark can be any representation that differentiates goods andservices, goodwill and reputation. The common law of ‘passing off’affords some protection against the copying of these trade marks butyou must prove your historic ownership, an intention to confuse/deceive, a tangible loss and demonstrate rigorous active protection.Being proactive in trade mark protection helps, such as indicating yourrecognition of your trade marks by the use of the symbol ‘TM’.
It is, however, possible to afford stronger protection by registering thetrade mark. Registration used to be limited to words and logos butfollowing the Trade Mark Act 1994 the scope has widened to includeother distinctive features such as three-dimensional shapes, three letterwords, acronyms, uncommon words, foreign surnames, small places,foreign places, slogans, a descriptive word with a logo, sounds, colourand even smell. Registration is still excluded for common words,
Law 123
surnames or phonetical similarities which require proof of distinctive-ness and where others have ‘honest concurrent use, shapes by nature orfunctions which add value’. Liability for breach is strict but the onus ofproof of distinctiveness is with the originator.
Example 3.2.10
Coca Cola has not only registered its name as a trade markbut also the shape of its bottles. Also registered are the shapeof Toblerone bars, the colours green for BP petrol forecourtsand turquoise for Heinz beans cans, the Direct Line insur-ance jingle, Mr Kipling’s ‘exceedingly good cakes’ slogan andthe smells of Chanel perfume and beer scented darts.
Application
It is generally advisable to conduct a search before applying for a trademark to assess whether the mark is likely to encounter any difficultiesas a result of its use and registration. A self-search using proprietaryCDs might cost £15 and the Patent Office may charge £100. The markmust then be registered within one or more of 42 classes of goods orservices available. The registration is renewable every 10 yearsindefinitely costing around £200. Once granted, the ® symbol can beused to show that the mark is registered.
Example 3.2.11
An educational CD may have two classes:
� Class 9 (CD ROMS and computer software goods)� Class 41 (educational and training services)
Internationally, the recommended approach is to search in the countriesthat are of interest. A typical search by patent agents may cost between£250 and £600 per country but it is also possible to do a ‘World WideIdentical Screening Search’ (WISS). WISS is limited to using identicaland phonetically identical trade marks published since January 1976 butat £550 is a cheap and quick guide. Application costs vary per countrybut the average is around £700 to £800 per country per class.
The 1994 Trade Mark Act harmonized and simplified the rules withinthe EU enabling a commonly available Community Trade Mark (CTM).The cost of filing the application is approximately £700 but this coversup to three classes. When the mark is accepted there is an additionalregistration fee also equal to around £700.
Under the Madrid Protocol, an International Registration (IR) canalso cover a number of associated countries worldwide. Each applica-tion is examined separately by the relevant national trade mark
Key points
It may be difficult to registeryour trade mark if it hasbecome a generic name forproducts of that type through-out industry.
Anybody attaching metatags(hidden lines of code) to theirweb pages to attract atten-tion, and providing unauthor-ized linking of your productwith other sites/products,may be infringing trademarks. In a move to exercisecontrol over who has the rightto offer links to its site, Uni-versal Pictures has threat-ened a website (www.movie-list.com) with legal action if itdid not remove links from itswebsite to movie trailers atUniversal’s own site (www.u-niversalpictures.com). Thisaction places a questionmark over the whole legalityof hyperlinking.
Key point
Trade mark applications arerising at a rate of 5% overprevious years.
Key point
An objection to the registra-bility of the trade markbecause it is phoneticallyidentical to a common sur-name is less likely to ariseusing the CTM rather than aone country only route.

124 Law
authorities so there is a risk that an objection concerning a commonsurname may be raised. The cost of filing an IR is about £800 for up tothree classes with an additional cost payable for each designated countryof approximately £100. The additional cost of a prior UK applicationshould also be taken into consideration. The application can be filedcentrally and is worthwhile if protection is sought in approximatelythree or more of the associated countries.
Domain names
The registration of trade marks and internet domain names is not linked.Domain names are allocated on a first come first served basis andownership of a registered trade mark does not automatically entitle youto ownership of the domain site. The disparity has resulted in a greatdeal of confusion and litigation around this issue, particularly in relationto people owning domain names that trade mark owners would like(‘cybersquatters’). Where there is dishonest intention (such as ‘passingoff’) then the trade mark owner is more likely to be successful inclaiming against the domain name owner.
A small company with the same name as a large company with asimilar name can legitimately register the domain name at the expenseof a big company (Prince v. Prince Sportswear).
The World Wrestling Federation Entertainment claimed that theowner of the domain worldwrestlingfederation.com registered the newlyavailable address and then attempted to sell it to the wrestling promotersfor a hefty profit. The name was ordered to be handed over to theWWF.
WIPO has also upheld the claim of US actress Julia Roberts againstthe domain name owner of juliaroberts.com. The tribunal ruled that thedomain name owner had ‘no rights or legitimate interest in the domainname’ and had registered it in bad faith. The domain name has also nowto be transferred to the actress.
In Marks and Spencers v. One in a Million, One in a Million arguedthat they were not passing off because they were not intending todeceive, they merely intended to sell the domain name to M & S. Theargument was overruled and M & S were given the domain name siteand One in a Million (a collection of students) were handed a £65 000legal bill.
However, failure to prove dishonest intention (particularly if thedomain name owner has not attempted to sell the name) may be difficult.The owner of the domain name may be prevented from using it if itinfringes a trade mark but will not necessarily result in the trade markowner gaining ownership of the domain name (Shetland Times).
Problems 3.2.1
(1) In Evans & Sons Ltd v. Spritebrand Ltd (1985), a companywas sued for breach of copyright. Could a director be heldpersonally responsible as well?
(2) Comment on the application of copyright, design right andregistered design right protection for computer generatedkitchen scales created for the commercial market.
Key point
InterNIC is the American-based body which allocatesdomains. In the UK it isNOMINET. There is a greatdeal of activity within thedomain naming system. InJuly 1999 there were over6.8 million registereddomains for the top five toplevel domains (com, net, org,edu, int).
Key point
Registering ‘keywords’ withgateway sites may alsoinfringe a trade mark.
Law 125
(3) In January 1995, Glaxo announced a bid for the companyWellcome with the intention of forming a combined businesscalled Glaxo Wellcome plc. A day after the announcement, Xregistered the company name of Glaxowellcome Ltd andoffered the name to Glaxo for £100 000. Glaxo took X tocourt to insist that X did not have the rights to register thename in the first instance. Was Glaxo successful?
(4) If you receive an e-mail from a friend, explain why you mightneed to be careful if you decide to forward it to someoneelse.
Case study
Affymatrix is a biotech company that invented the use ofphotolithography to place biomaterials onto a small chip, aprocess similar to integrated circuit production. It is the tool thatenables others to explore genes. Affymatrix has adopted thefollowing intellectual property strategy:
� Patent protect everything using broad ‘defensive’ patents thatseek to protect all aspects and possibilities for the invention, inthis case all dense placement of biomaterials in small areas.
� Offer licences to anyone who asks but avoid arguments overroyalties by selling expensive bundled packages, that includeknowledge, computers and machinery, and attempting tomake the format world standard.
� Fight all infringers.
The problems it faces are being reliant on one key patent whichmay be liable to attack. The stance also alienates highereducation and cash short companies who will find other solutions.Affymatrix faces counter alliances from 3M, Motorola, PE (ownerof Celera), Hewlett Packard and Hitachi ready to break into themarket. Litigation also ensues with antagonized competition. Inthis case by compeitors backing the work of Edwin Southern atOxford University who patented an early gene sequencingtechnique. Suing and counter suing is prevalent with Incyte andHyseq.
3.3 Contracts Agreements are made between suppliers and buyers of goods but can bemade between people or organizations for a variety of reasons.Agreements form a regular and important part of business and thissection provides an overview of the formal creation of an agreement.
Requirements
The definition of contract from the Oxford English Dictionary is that inits simplest form it is ‘a mutual agreement between two or more parties
126 Law
that something shall be done or foreborne by one or both’. It is alsocommonly interpreted as ‘an agreement enforceable by law’. A contractis hence a step beyond a promise or an understanding that forms alegally binding agreement. It can be implied, by actions or under-standings, or it can be expressed in written terms. Certain essentialelements are, however, necessary to form an enforceable contract andthese are intention, consideration and agreement.
Intention
Both parties must have an intention to create a legally bindingcontractual relationship.
The ‘offer’ is an expression of willingness by one party (usually theseller) to enter into a legally binding relationship. The offer must becommunicated to the offeree by the offerer or his agent. It may beexpressed or implied and the test of whether a statement is an offeris objective. Its legal validity depends on whether the offerer wouldreasonably have been understood as making an offer and not whetherhe thought he was making an offer. The following are normally heldto be offers:
� Quotations� Estimates� Orders
Distance selling includes offers by e-commerce, mail order andtelephone sales and legislation includes the Mail Order Transactions(Information) Order 1976. The legislation excludes one-off transac-tions. The minimum information required for electronic transactionsmust include the identity of the sending party. E-mail is nowconsidered to have the same status as letters so that all e-mails mustbear the company’s place of registration, registration number andregistered address (section 351 of the Companies Act 1985). Theseller must also provide information on the main characteristics ofgoods, special conditions, price, payment details and details on theright to withdraw information. Hard copy details must include a sevenday right to retract, without reason or penalty starting from the dateof goods received. There is also a requirement to identify further junkmail (spam).
An offer may be made in a conditional form which is divided into twogroups. Conditions precedent (suspensive conditions) and conditionssubsequent (resolutive conditions). Clauses inserted into offers whichare commonly encountered in commercial transactions include thephrase ‘subject to contract’ (i.e. subject to the making of a formal,written contract) and ‘effectiveness clauses’, covering matters such asthe obtaining of licences, finance and so forth necessary for theperformance of the contract. Clauses of this type usually create acondition precedent, but in some cases a party may be under acontractual liability in respect of the condition, for example there maybe a duty to obtain an import licence.
An offer may lapse for a number of reasons:
� Because the time specified for its validity expires.� Because the offer is communicated as being terminated. The offerer
can also withdraw the offer at any time, even if he has promised to
Key point
Non compliance with a con-tracted offer can result inCourt action but may notnullify the contract.
Key point
Cyber contracts are conten-tious because it is not pre-cisely clear where the con-tract is made which makes itdifficult to apply the normallegal framework.

Law 127
keep the offer open, unless he has contracted (for good considera-tion) to keep it open.
� Because of a counter-offer which kills off the original offer.� Because the offer is rejected.
An offer is usually contrasted with an invitation to treat which is aninvitation to the other party for them to make an offer. The following areusually held to be invitations to treat:
� Advertisements� Circulars� Price lists� Displays of goods in a shop� Tenders. When a contract is made by tender, the invitation to tender
is construed as an invitation to treat, the tenders are construed asoffers and it is then up to the invitor to decide which tender (if any)he will accept. Particular care should be exercised in dealing with‘acceptances’ in the form of letters of intent. These almost certainlydo not create a binding contract, except in so far as they induce thetenderer to do specific things in response to the terms of the lettersof intent.
Consideration
A contract must be supported by consideration. This means money to bepaid or obligations undertaken in return for the goods or services to beprovided. Any party wishing to sue upon the contract must prove thatthey put something into the bargain struck between the parties. Theobligations and contents of the contract are called its terms and consistof the consideration and other promises which the parties have made toone another in respect of their duties under the contract.
Example 3.3.1
Common areas covered by terms include:
the people or organizations involved (these must be legalentities and are called the parties)introduction (or preamble)definitionsthe work to be undertakenquality of the workproduct variationsdefectsintellectual propertypricepaymentterms of paymenttime for performanceschedulesdelays and conditions for extensionstorageinspection, testing and rejection

128 Law
deliveryacceptancepassing of ownershippassing of riskliabilityinsurancewarrantiesindemnitiesperformance defectscontractor’s defaultbankruptcyarbitrationexemptionterminationforce majeureexit clausescontract variationsarbitrationregulatory law
A distinction is drawn between express terms (the things which theparties explicitly agreed) and implied terms (whose existence a courtwould infer from the circumstances surrounding the making of thecontract). Terms may then be discovered from any documents which theparties used to record their agreement and/or any oral communicationsbetween them forming their agreement or part of it.
In any disputes, a court will attempt to decide upon the basis of thewritten and oral evidence what the parties intended to include in thecontract. The court will usually imply only such terms as are necessaryto give the contract ‘business efficacy’. It is particularly influenced bythe relative importance of what was said or written in relation to thesubject matter of the contract. However, courts do not permit oralevidence to be given which would vary, contradict or add to the writtenterms if the parties have reduced the whole of their agreement to writing(the parol evidence rule).
Careful wording is required when drafting sentences, otherwiseproblems can also be encountered in interpreting terms even when they areexpressed in writing. Unless undertaken by a qualified legal expert,contracts should be drafted in simple language, avoiding the use of Latin,jargon or slang, and progress in a logical fashion using clear punctuation.
Activity 3.3.1
Consider the construction problems in these contract termsand consider how they might be redrafted.
(a) Acceptance of these terms shall be by signature of adirector of the company. The usual conditions ofacceptance shall apply.
(b) The price of the goods is £2500 and will be paid onstandard hire purchase terms.

Law 129
(c) We shall meet 12 months after the first product is sold todecide on a suitable royalty.
(d) Disputes between us arising out of this contract shall bereferred to two valuers, one to be nominated by eachparty.
(e) The goods shall be delivered to the buyer.(f) Tenders are to be submitted on the following terms,
namely that tenders are a single offer for all shares heldby us. We bind ourselves to accept the highest offerprovided that such offer complies with the terms of thistelex.
(g) This policy does not cover any consequence of con-fiscation, nationalization requisition or damage to prop-erty by under or through the order rule or regulation ofany government public statutory municipal local cus-toms or health authority.
(h) The tenant agrees that the landlord may take the lifts outof service for emergency repairs and maintenance.
(i) The contract between us will run for six months. If we assellers are satisfied with you as a customer, the contractis automatically extended for six months. All the condi-tions of the first contract will then continue to apply.
(j) Either party may determine this agreement by notice inwriting if the other shall have committed a materialbreach of its obligations hereunder.
Example 3.3.2
Incoterms as defined by the Institute of Chambers ofCommerce are common ways of clarifying the point at whichownership (and risk) are transferred from one party to another.For example, FOB is the delivery of goods by the seller ‘Freeon Board’ to a ship. They become the responsibility of thebuyer as they pass the ship’s rail (see Fig 3.3.1 overleaf).Other examples include:
� Ex works delivered to the seller’s factory gates.� C & F delivery includes cost of transport and
freight.� CIF delivery includes cost of transport,
insurance and freight.� Ex ship delivery to the buyer’s port.� Ex quay delivery to the nominated quayside.� DDP delivery to the nominated dock or port
storage.� Franco domicile delivery to the buyer’s premises.
A convenient solution to the problem of ascertaining the terms of thecontract is to employ a printed standard form containing terms suitable

130 Law
for a variety of transactions of the same type. These must still be usedwith caution, however, as they effectively reduce the ability of one partyto negotiate and are hence open to criticisms of unfairness. An unfairterm is one that has not been individually negotiated and causes animbalance to the detriment of the consumer. This may render thecontracts ‘champertous’ (illegal). Consumers are protected againstunfair terms by the Consumer Contracts Regulations 1999 which havereplaced the unfair terms legislation of 1994. The new Act allowsTrading Standards to prosecute on behalf of the consumer. Standardforms are also restricted on exemption clauses that they can include.
Making quotations and placing orders with standard conditionsattached, usually in small print, can also produce a ‘battle of forms’between organizations where each side seeks to impose its terms andconditions over the other. The best solution to this problem is not to getinvolved in it at all, but to endeavour to reach an agreement with theother party on disputed terms.
Terms of the contract must be distinguished from ‘representations’which are statements that do not form part of the contract but whichinduced the making of the contract. When such a statement is false, thisamounts to misrepresentation. No damages for misrepresentation can bemade with respect to the contract but tort damages are available forfraudulent or negligent misrepresentation. Any remedy for mis-representation will depend on factors such as the degree of fault of themaker of the statement:
� Intention of the parties.� Timing of the statement.� Incorporated into written contract.� Indication of importance of issue.� Special knowledge of statement maker.� Made on purpose to induce contract.� The state of mind of the maker of the statement and whether the
statement was fraudulent (where the maker of the statement knew itto be false, negligent (where the maker of the statement was carelessin determining the truth) or innocent (where the maker of thestatement believed it to be true and had reasonable grounds forbelieving that).
Figure 3.3.1 Incoterms
Key point
To avoid accusations of unfairterms in standard forms, it issometimes advisable to use aneutral parties standard formcontract. Institutions and pro-fessional bodies often pro-vide model contracts.
Key point
If you are concerned withsigning a standard contractyou should do nothing toindicate acceptance of theother party’s terms.

Law 131
Agreement
In order to complete the agreement the offeree must accept the offer andcommunicate his acceptance to the offerer. This means that there will bean agreement where one party has made an offer to the other to enterinto a contract on certain terms, and the other has accepted on thoseterms. If the other party fails to accept all of the conditions and terms ofthe offer, or adds any further conditions and as such supersedes theprevious offer, this is in itself a new offer which can be open toacceptance. In order for a party to show that the other party is bound bya particular offer he must show that the other party either (a) signed it,or (b) entered into the contract with notice of it. This notice must begiven before the contract was made.
The offerer can specify the way in which the offeree is to signifyacceptance. This could be assigning of the contract by hand or under sealbut any reasonable means of communication is acceptable, including:
� Word of mouth� In writing� Conduct
The acceptance must usually come to the attention of the offerer, butthere are some exceptions such as the rule that a postal acceptance iseffective as soon as it is posted. Unilateral contracts are made to anunspecified party and also differ in that:
� The offeree does not have to communicate to the offerer the fact thathe is accepting the offer.
� (Probably) it is unnecessary for the offeree to know of the offer atthe time when he performs the act required in order to bind theofferer.
� The offeree is never bound to perform the act required by theofferer.
In the event that legal action is required to determine whose terms arevalid in a battle of forms dispute, the courts usually consider theprocedural circumstances of offer, counter-offer, rejection, acceptanceand so forth (Trollope & Coils Ltd v. Atomic Power Constructions).Courts will determine whether they have reached agreement on allmaterial points, even though there may be differences between theforms and conditions printed on the back of them. Applying this guide,it will be found that in most cases when there is a ‘battle of forms’ thereis a contract as soon as the last of the forms is sent and received withoutobjection being taken to it. In some cases the battle is won by the manwho fires the last shot. In other cases, however, the battle is won by theman who gets the blow in first. The deciding factor is often the scope ofany differences and whether or not these were pointed out.
Case study
The chain tensioning device
On 8 September 1978, the sellers (the defendants) offered to sellthe buyers (the plaintiffs) a device for tensioning the chains on a

132 Law
motoring buoy in the Buchan Field in the North Sea. The offerincorporated the defendants’ terms and conditions includingconditions that any disputes should be settled by arbitration inCalifornia and that Californian law should govern the formation,construction and performance of the contract. The price quotedwas FOB factory in California and the offer covered theengineering, design and fabrication of the device.
On 29 September the buyers sent the following telex to thedefendants, referring to the quotation and stating inter alia: ‘It isour intention to place an order for one chain tensioner . . . withyour goodselves. A purchase order will be prepared in the nearfuture but you are directed to proceed with the tensionerfabrication on the basis of this telex. A purchase order will beissued subject to our usual terms and conditions.’
Three days later the buyers sent the sellers their purchaseorder dated 5 October which contained the following clauses: Alldisputes arising in connection with the contract shall be settled byarbitration. The arbitration shall be held in the UK and conductedin accordance with UK law. The written acceptance of thiscontract, the commencement of performance pursuant hereto . . .by the sellers constitutes an unqualified acceptance by the sellerof all of the terms and conditions of this contract. This contract . . .constitutes the entire agreement between the parties, either oralor written.
This purchase order led to a number of telexes between thebuyers and the sellers. The sellers commented on the purchaseorder complaining that they had proceeded with the work on theunderstanding that their offer was acceptable and were nowfacing ex post facto contract terms but made no objections orcomments to either the arbitration clause or acceptance clause.Negotiations continued between the parties and agreement wasreached on variations to the plaintiffs’ purchase order.
On 20 October the buyers sent a telex to the sellers agreeingthe one outstanding point and asking the sellers whether inview of the changes they would prefer that the buyers reissuedthe purchase order. On 20 December the sellers replied to theeffect that they saw no need for the reissue of the order, andenclosed their formal acknowledgement order which containedthe following clause. ‘Acceptance of buyers’ order is conditionaland subject to the following conditions . . . unless the buyershall notify seller in writing to the contrary within 5 days ofreceipt of this document the buyer shall be deemed con-clusively to have accepted the exact terms and conditionshereof. The copy was signed by the buyers and returned on 3January 1979.
The buyers alleged that defects in the system were discoveredwhen it was being installed in the North Sea in July 1979. On 29July 1980, the buyers issued a writ in the UK court against thesellers claiming damages for breach of contract. On 7 August1980, the sellers commenced proceedings in the Californian courtalleging inter alia that the disputes should be referred to arbitrationin California and that Californian law applied to the contract. On 7November the Californian court having heard argument on theissue, concluded its judgment with the request that the English
Law 133
court should either on its own initiative or on motion stay furtherproceedings in this action. However, on 11 November, the buyerswithout notice to the defendants and without informing the court ofthe request entered judgment in default, and on 21 November thesellers applied to the court for
(a) An order that all further proceedings in the action be stayedpursuant to s. 1 of the Arbitration Act 1975, or the inherentjurisdiction of the court.
(b) An order that the judgment entered on 11 November be setaside. It was accepted by the sellers that the applicationunder the Arbitration Act 1975, s.1 would fail unless theycould establish that the contract incorporated the Californianarbitration clause.
It was held by the court that:
(a) The buyers’ telex of 29 September was not an acceptance ofthe sellers’ offer of 8 September and its only effect was toenable the sellers to recover on a quantum merit for workdone pursuant to the direction.
(b) The purchase order by the buyers of 5 October was inEnglish law a counter-offer which destroyed the original offerin toto (and was not that form of counter-offer whichincorporated the original offer because it so was specificallyvaried).
(c) On 20 October, in English law, the contract was concludedbetween the parties and it was well understood by the sellersthat it did not incorporate any part of the original offer.
(d) The sellers’ submission that the final exchange between theparties on 20 December and 3 January 1979 constituted thecontract with the Californian arbitration clause incorporationwould be rejected in that the clause in the sellers’ letter of 20December was meaningless since there was nothing left toaccept; the contract had already been made and thatdocument was not, and was not intended to be, anythingmore than a mere formality and the reference to the originaloffer was for identification only.
(e) In the circumstances the contract did not incorporate thesellers’ terms and conditions and thus did not incorporateeither the Californian law clause of the Californian arbitrationclause; it was a contract upon the terms of the buyers’purchase order as subsequently varied by the telexes up toand including the telex of 20 October.
(f) The sellers’ contention that the original offer expresslylimited acceptance to the terms of that offer and the telex of29 September was self-evidently a definite and reasonableexpression of acceptance would be rejected in that the telexstated that the buyers intended to place an order, theinstruction to proceed was in respect of part only of thegoods offered and it was made plain that when the order didcome it would be subject to terms and conditions so that thetelex of 29 September could not be regarded as a definiteexpression of acceptance.
134 Law
(g) In the light of the telexes the intention of the sellers was toaccept all those proposals save those to which they hadraised objection and specifically negotiated and since noobjection had been taken to either there was acceptance ofboth these clauses.
(h) Even if Californian law was the relevant law for the purposeof determining what was the contract between the parties,under the law the sellers’ Californian arbitration clause wasnot, and the buyers’ UK arbitration clause was included; andthe sellers’ first application to stay the proceedings under theArbitration Act 1975 failed.
(i) Since none of the sellers’ terms and conditions wereincluded as a matter both of English and Californian lawthere was no basis upon which, under the inherent jurisdic-tion, there could be a stay to enable the Californian court todecide that matter; and in the event the evidence was thatEnglish law was the proper law of the contract.
(j) As the buyers had regularly begun their action here andsince the dispute itself both as to liability and damagesinvolved matters occurring in this country and since thedefendants could have applied for a stay without everresorting to the Californian court it would be manifestly unjustto the buyers to grant a stay.
(k) The sellers were unable to rely upon their standard termsand conditions, there was no positive defence shown and asthere was nothing left but a mere non-admission of liabilitythis was not sufficient ground upon which to set aside thejudgment.
(l) On the facts, the buyers had an early opportunity to inspectthe defects on the system and knew what was beingalleged and since they did not challenge any of theallegations but only made an effort by resort to theCalifornian court to include their terms and conditions andsought to rely on such conditions there was in the circum-stances no arguable defence on liability and no othersufficient reason for the action on liability to be tried and theapplication to set aside failed and the sellers’ summonswould be dismissed.
It has been argued that this traditional analytical approach to battles offorms is out of date. The difficulty is to decide which form, or whichpart of which form, is a term or condition of the contract. The better waymay be to look at all the documents passing between the parties andglean from them, or from the conduct of the parties, the intention (LordWilberforce, New Zealand Shipping Co. Ltd v. A.M. Satterthwaite). Inother words extend the evaluation over a wider area and look into theminds of the parties to make certain assumptions. In this way there maybe a concluded contract in which the terms and conditions of bothparties can be construed together to give a harmonious result. If thedifferences are irreconcilable, so that they are mutually contradictory,then the conflicting terms may have to be scrapped and replaced with areasonable implication.

Law 135
Performing the contract
Once a contract has been concluded between the parties, it should thenbe clear what each party is obliged to do in order to perform the contracteffectively, and the extent to which each party will undertake liability. Ifthese obligations are not met, then an action for breach of contract canbe brought leading to damages and other remedies. The general rule isthat liability for failure to perform is strict, i.e. it is not a defence to showthat you did your best to perform the contract.
The doctrine of ‘discharge by frustration’ is concerned with thesituation which arises when, by reason of some event occurring after thecontract was made, it is physically or commercially impossible toperform the contract. The effects of frustration upon the rights of theparties to payment is governed by the Law Reform (FrustratedContracts) Act 1943, which provides that all sums paid or payable by aparty before the frustrating event may be recovered or cease to bepayable as the case may be, subject to the right of the other party toclaim payment for expenses properly incurred by him before thefrustrating event. The kinds of event capable of frustrating a contractinclude:
� A change in the law making performance of the contract illegal.� Outbreak of war.� Destruction of the subject matter of the contract.� Cancellation of an expected event.� Requisitioning of the subject matter of the contract.
Because of the very narrow scope of this doctrine it is sound practice toinclude in contracts a force majeure clause which relieves the partiesfrom obligations if the duty to performance becomes onerous orimpossible because of some clearly unforeseeable event, such as strikesor delays in transport.
A difficult issue arises when a party wishes to know whether a breachby the other party entitles them to refuse to continue their obligations ofthe contract. The basic approach of the courts is to draw a distinctionbetween ‘conditions’ which are more important terms and ‘warranties’which are less important terms. A breach of condition will give rise toa right in the innocent party to terminate the contract, whereas a breachof warranty merely gives rise to a right to claim damages. However,recent cases have held that minor breaches of condition may not inthemselves entitle the innocent party to terminate.
A failure by a party to perform the contract strictly on time does notusually entitle the innocent party to terminate the contract, unless:
� The parties have expressly agreed that time is to be of the essence.� Where the contract is of such a nature that a time fixed for
performance must be strictly complied with.� Where time was not originally of the essence, but one party has
been guilty of delay and the other has given notice requiringperformance within a reasonable time.
Misrepresentation can also render a contract voidable and the injuredparty may seek to have the contract rescinded (set aside) which puts theparties back into their original positions. No rescission is available

136 Law
where the injured party delays too long or where third party rights haveintervened so that there is no possibility of restoring parties to theiroriginal positions. Contracts created by duress may also be voidable.
Licensing
Often it is more preferable for others to exploit your ideas or productson your behalf. In return for a lump sum payment and/or a royalty IPownership could be transferred to others via an assignment. Ownershipcan also be temporarily transferred in return for a lump sum and/or aroyalty and this form of agreement is detailed in a licence. Most licencesare reduced to the written form as per a normal contract. Because theyare tailored to a variety of situations there standard forms are less likely.They also have specific terms that relate to the grant of rights,consideration and specific obligations.
Example 3.3.3
Licensing is a common form of agreement in business andevery day life. By buying this book, for example, the authorand publishers have implicitly granted you a licence to readthe material in it. They may also have explicitly explainedwhen and how you may reproduce parts of it.
If you have eaten a meal today containing geneticallymodified food you may not actually own what is inside yourstomach. You have, however (probably), been given a licenceto place this food there by the biotechnology company thatcreated it.
Grant of rights
The grant of rights establishes the details behind what is being licensedand how:
� Is it the product and/or the ‘know-how’ behind the product that isbeing licensed? Is it defined by a patent? Potential licensors shouldalways check to ensure that the licensee actually has the rights toown or license what is being offered (‘due diligence’).
� Is the product/know-how being transferred in part or in totality?� Is the transfer a simple once and for all deal or does it include future
improvements?� Are the rights existing or prospective?� What is the geographical extent to which rights are granted?� What is the duration of the grant of rights?� Will the licence convert to an assignment?� Is the grant exclusive to the licensee in which case only the licensee
has the right of use? The licence may otherwise be non-exclusive inwhich case the licensor may grant rights to other parties. It may alsobe a sole licence in which case both the licensee and licensor haverights.
Key point
The Rights of Third PartiesBill has abolished the privityof a contract. This will allow athird party specified in a con-tract (but not an actual partyin the contract) to sue on thecontract. It will, for example,allow consortiums to suesub-contractors or the ‘prom-isor’. Large co-ordinatingcontractors may be able todownload responsibility ontosmaller contractors by mak-ing them directly liable.
Key point
It is estimated that 80% of theinventions developed by cor-porations worldwide areunused and unexploited withan estimated $115 billion(120 billion euro) of unusedtechnology assets in the USalone. This could be licensedto organizations that woulduse it. Many ‘technologytransfer’ organizations alsonow offer services that matchpotential licensees withlicensors.

Law 137
In establishing the rights it is important to avoid unfair terms and createmonopoly situations. These are prohibited by the Treaty of Rome (Article85(1)) and enacted in the UK by the Competition Bill 2000. Exceptions tothis can be allowed for technical or economic progress (Article 85(3)).For example, price fixing would not be allowed and feature on a ‘blacklist’ of unacceptable exclusions. Allowances on a ‘white list’ wouldinclude sole or exclusive licences if granted in specific areas. Any doubtsshould be referred to the EU for clarification.
Consideration
Consideration in respect of the grant of rights might be a lump sumpayment or a royalty. Often it is a combination of both with an upfrontlump sum payment followed by a royalty stream. A royalty stream is thelicensor’s remuneration based on the licensee’s use of the transferredgoods. It is usually based on a percentage of the profits the licensee canmake. A reducing sliding rate is normal and it is often preferred that thereturn is based on the number and price of trade sales, rather then end-user sales, as this is easier to check. There may also need to beclarifications on whether sales include or exclude any taxes.
It is important not to undervalue the goods and services you areintending to license. IP is traditionally underrated because the technicalexpert who developed the IP may not have the same commercialexpertise. The value should be based not on the cost incurred in makingthe goods or in replacing the goods but on the sales value to the licensee.
Example 3.3.4
Watt patented the piston effect in 1769 and later itsapplication to wheeled carriages in 1784 but remainedactively opposed to the desire amongst his team to developthe steam driven locomotive. He wrote to his partner MatthewBoulton stating ‘I wish we have what could be brought to doas we do, to mind the business in hand, and not to huntshadows’ (it was left to Stephenson to invent the train).
Mary Jacobs patented the bra in 1913. The devicecomprised two handkerchiefs tied together by a ribbon. Shesold the idea to Warner brothers for $1500 who made £15million from it over the next 30 years.
In the 1940s a classification system using four black lineson white card was patented. Today 5 billion bar codes arenow scanned each day.
The great inventor Edison actually saw little value in hislight bulb and made little money from it. In Germany shortlyafter, however, Professor Nernst sold his similar idea to AEGfor £250 000.
Specific obligations
Because there are now two parties with an interest in the goods orservices, i.e. the licensee and the licensor, it is important in the licenceagreement to clarify which party has any specific obligations. Thesemight include:
Key points
Many organizations offer servi-ces that help potential licenseesgain access to copyright material.These include the Licensing andCollection Society which can col-lect on behalf of authors, PilotSite Licence Initiatives, NationalElectronic Site Licence Initiative.The Copyright Licence Agency(CLA) can arrange terms andpayment systems for organiza-tions wishing to regularly usecopyright material belonging toothers. Newspaper LicensingAgreements (NLA) can bearranged for organizations wish-ing to use newsprint material. It is,for example, illegal for a companyto photocopy a business articleand distribute this to its employ-ees without permission. Parlia-mentary Copyright covers workderiving from Parliament andadministered by HMSO. Itincludes Parliamentary reportsand papers, Acts and press relea-ses. Use of this material is usuallyfree subject to certain conditions.Guidelines on the use of theseand materials from other govern-ment agencies can be soughtfrom the Crown Copyright Unit.
Software licences vary butusually invoke some of the follow-ing terms:
� One licence for one machine.� Shareware is copyrighted
and not free.� Public domain is not copy-
righted and may be usedfreely.
� Shrink wrap displays condi-tions to which you agreewhen you open the softwarepackaging.
� Click wrap displays condi-tions which you must agree tobefore you can enter or down-load software.
� Escrow is a deposit (soft-ware) placed in third partyorganizations in case a smallcompany servicing a largecompany goes bankrupt.
Many of these licences are con-tentious, sometimes discriminat-ing against the user and othertimes against the supplier. Underthe terms of any licence, how-ever, you may back up, observe,test or study, to operate with otherprograms.
138 Law
� What happens if the licensee does not meet a minimum level ofperformance?
� Accountability and penalties for late payments.� Who will maintain any intellectual property rights such as patents
and who will confront any infringers?� What happens if either party makes any improvements to the goods?� Does the licensee have any right to sub-license?� The confidentiality of knowledge and trade secrets.
The changes in the privity law also affect licences. For example, asoftware developer may enforce licence terms on a user even if acontract only exists between the user and the selling organization.
Problems 3.3.1
(1) What is a letter of intent?(2) What are the three components necessary to form a legally
binding contract?(3) Decide if there is a valid contract and if so, is it subject to the
buyer’s terms or the seller’s terms?(a) Buyer sends an enquiry to seller (no condition of
contract proposed).(b) Seller submits a quotation together with his standard
conditions of sale which include a Contract PriceAdjustment formula. The quotation also includes thesentence ‘Our conditions of sale attached override anyconditions incorporated in any resulting purchaseorder’.
(c) Buyer sends purchase order with his Standard Condi-tions of Purchase which state that contract price isfixed. The purchase order has a tear-off acknowl-edgement slip.
(d) Seller signs and returns the acknowledgement with aletter in which it is stated that the agreement is in theseller’s terms.
(4) Consider the following cases:(a) In Neale v. Merrett, the seller offered to sell a piece of
land to a buyer for £280. The buyer ‘accepted’ this offerand sent a cheque for £80 with a promise to pay theremainder by instalments of £50. Was there a contractor not?
(b) In Victoria Laundry (Windsor) Ltd v. Newman IndustriesLtd, the Newman laundry firm ordered a new boilerwhich arrived late causing Newman to consequentlylose a large new contract. Were they entitled to recoverdamages for normal loss of profits from the supplier?
(c) In the Heron II case, a ship was late in delivering acargo of sugar to the busy port of Basra, and by the timethe delivery was actually made the market price hadfallen. Could the normal loss of profits be recoveredfrom the ship owner?
(d) In Tulk v. Moxhay, the owner of land which includedLeicester Square in London sold the Square itself but

Law 139
retained some land round it. The buyer contracted not tobuild on the Square. He later sold the land and it thenpassed through several hands. Ultimately the new ownerproposed to build on it. Could they build or not?
Activity 3.3.2
The following Patent Licensing Agreement has been drafted betweentwo parties. Examine the agreement and consider where the contentis weak and where future problems may lie. Suggest changes thatwould overcome these difficulties:
Parties1. Portsea Ltd located at Port Road, Portsmouth (‘Port’)2. EMCA Sales Division located at London Road, Crawley
(‘EMCA’)
Preamblei) Port is prepared to grant a licence to EMCA and TJ
1. DefinitionsProduct any commercial commodity containing the innova-
tion detailed in the PatentPatent shall be as Patent number 1,XXX,XXX
2. Grant2.1 Port grants to EMCA a sole and exclusive licence to
i) import, manufacture and sell products using tech-nology identified in the Patent
ii) adapt the technology for future development2.2 This licence shall not confer on any third party the
rights to use the technology2.3 A shall procure that any customers purchasing the
Product shall be enjoined from resale of the commodityoutside the territory
3. Consideration3.1 On execution of the agreement EMCA shall pay Port a
one sum payment of £10 000 Plus £3.00 for everyproduct sold
3.2 EMCA shall sell the products at £15.00 per unit4. Payment
4.1 Payment shall be made by the due date into the Bankof Brighton
4.2 Port shall have the right to inspect EMCA’s financialledgers to determine that all Transactions and Pay-ments are in order
5. Obligations5.1 EMCA shall not be permitted to decompile the inherent
software5.2 Any improvements by EMCA shall be disclosed to Port
who shall thereon become the exclusive owner6. General
6.1 Failure by EMCA to adhere to the terms of thisagreement shall allow Port to terminate the agreement
Signed by J. Blake ...........................................................................(personal assistant to the director)

140 Law
3.4 Liability Liability for the production and sale of products has emerged through aseries of legislation over a number of years. This section provides asummary of the relevant legislation and the key issues that they cover.
Sale of Goods Acts 1893 and 1979
The Sale of Goods Act was created to protect the interests of bothbusinesses and individuals with respect to both buying and selling(excluding bartering and hiring). The legislation clarifies and definesterms and makes it easier for one party to take action against another inthe event of any irregularities.
A summary of rights in relation to selling is:
� To be able to sell goods.� To be free to sell goods without interference.� To have agreements (which may be oral with the exception of credit
arrangements).� To claim for damages (the difference between contracted price and
subsequent resale), withhold delivery and reclaim goods where titleas been reserved for non-payment or acceptance of an agreed sale.
� To quantify the point at which ownership transfers from the seller tothe buyer.
A summary of rights in relation to buying is:
� To be recognized as an outright owner (quiet possession).� To buy goods that match their description.� To buy goods that are of merchantable quality (unless defects are
highlighted).� Buy goods that are reasonable for the purpose required.� Have terms of sale created by implication in the way the goods are
used.
If any of the buyers rights are broken, the conditions of contract arebroken (‘breach of contract’) and damages for injury and loss of profitmay be claimed from the seller. Liability is strict. Note that the contractitself is not invalidated if the buyer has paid or accepted the goods.
Privity has traditionally allowed only the contracting parties to takeaction against each other, hence the buyer must sue the immediate seller. Ifgoods have passed through a series of sellers this may become a chain ofactions, but time, or one good argument, may break the chain, protectingthe first seller (e.g. the manufacturer). The changes in privity law mayreduce the protection afforded by privity. A collateral contract (e.g.manufacturer’s guarantee, manufacturer’s advertised claims) may pass onto subsequent buyers and hence may also render a manufacturer liable.
A tort action, such as negligence, will also overcome the issue ofprivity and allow the buyer to take action beyond the immediate seller,e.g. to the manufacturer directly. It also allows people affected by but didnot buy the product to take action (i.e. not the buyer of a car but apassenger). Negligence occurs when the common law duty of care is notapplied creating physical or (more rarely) economic harm. It is not‘strict’ but would include design or manufacturing faults, inadequatetesting or poor quality control. The burden of proof of innocence mayfall on the producer.
Key point
‘Unless otherwise agreed,the goods remain at the sell-er’s risk until the property inthem is transferred to thebuyer. Whereby the goodsare at the buyer’s riskwhether delivery has beenmade or not.’ (Sale of GoodsAct 1979)
Law 141
Where it is financially prohibitive for a buyer to take a private tortaction against suppliers of faulty products then they may be able to claimbreach of the Trades Descriptions Act to enable criminal liability.Similarly a breach of warranty may provide an avenue for damages ifadvertising promotes an image of a product that does not bear witness inreality.
Consumer Protection Act 1987
As a result of the European Directive on Product Liability, safetyregulations after 1987 became proactive rather than reactive. TheConsumer Protection Act (CPA) provides civil remedies for injuries ordamage to property to individual consumers by defective goods whichare devoid of contract or negligence issues. The Act includes non-consumer goods including raw materials and components but notbuildings, printed matter, stated poor quality or older products(superseded by newer, safer products).
Defective is defined as ‘there is a defect in a product . . . if the safetyof the product is not such as persons generally are entitled to expect, andfor those purposes “safety” in relation to a product shall include safetywith respect to products comprised in that product’. There may be threetypes of defect – design (generic), manufacturing (one off) or marketing(poor instructions).
Liability on the supplier or manufacturer is strict and all parties maybe sued. Claims must begin within three years. Defences includecontributory negligence by user, that goods were not faulty at the time ofsale, that the product conformed to the state of knowledge at that time,that the component was placed later into someone else’s system whichwas faulty (or vice versa) or that the component supplied was requestedwith poor specifications.
Example 3.4.1
In January 2000, a woman sued LRC Ltd (formerly theLondon Rubber Company) because she became pregnantafter a condom she was using split. Damages includedtrauma and the cost of bringing up the child and the claim wasbased on the negligent manufacture by LRC. LRC claimedthat the product must have been made faulty after being sold.The judge dismissed the case arguing that there was no caseto answer under the CPA.
Further protection is afforded to the consumer by the Data Protection Act1998 which seeks to prevent misuse of data. The Act has established aData Protection Commissioner, ensures enhanced privacy and increasesaccess to health, education and credit files. It includes manual registersas well as computer processed records.
Key point
Surveys show that more cus-tomers are complainingabout faulty goods and ser-vices. Those that do not com-plain are often not satisfiedbut believe complaining is awaste of time. They mayhave a point since fewercompanies are addressingfewer complaints. Most com-plainers, however, aren’tlooking for recompense –only that things are putright.

142 Law
General Product Safety Regulations 1994
The General Product Safety Regulations (GPSR) introduced the conceptof a ‘safe product’ with a duty not to knowingly distribute, supply orintend to supply unsafe products. It applies to new, used andreconditioned consumer products (except antiques) that are bought forcommercial purposes but includes industrial goods that may end up inthe consumer market. The regulations are intended to support rather thansupersede specific protective legislation and are enforceable by theTrading Standards Office.
The duties of anybody supplying goods are:
� Make products safe.� Supply appropriate information including the risks involved using
the product and the precautions needed.� Batch mark products.� Sample test products.� Investigate complaints.� Monitor product performance.
Liability is strict with designer, senior managers and/or the corporationall liable. Infringement is a criminal offence. The degree of safety isconjunctive and assessed on:
� Product characteristics.� Packaging.� Instructions for assembly, use and disposal.� Effect on other products.� Labelling.� Those at risk (e.g. children).� Conformity to standards – voluntary, EU, community technical
specifications, industry codes of practice.
Defence includes demonstrating that all reasonable steps have beentaken, that due diligence had been exercised and that relying on theinformation of others had been reasonable to do (which might then makethese people liable).
Some products carry further legislative consumer protection, partic-ularly, for example, food and vehicles. The European New ApproachDirectives detail requirements for specific products such as toys andpersonal protective equipment.
The Competition Act 2000
Free trade is a cornerstone of westernized market principles and inEurope is defined by Articles 81 and 82 of the European Union Treatywhich seeks to restrict anti-competitive practices.
The Competition Act represents the incorporation into English lawof the European legislation. It focuses on effects rather than thepurposes of actions formerly detailed by the Restrictive Trades Act1976, the Resale Prices Act 1980 and the Fair Trading Act 1973 whichit has replaced. Uncompetitive undertakings and practices (such asprice fixing) which restrict or distort competition or trade are illegaland the prevention of unfair dominant trading positions is sought. Thelegislation comes in two parts:
Key point
A safe product is defined as‘any product which, undernormal or reasonably fore-seeable conditions of use,including duration, does notpresent any risk or only theminimum risks compatiblewith the product’s use, con-sidered as acceptable andconsistent with a high level ofprotection’ taking intoaccount the product’s char-acteristics, effect on otherproducts, presentation andcategories of users.
Key point
In the US, following theinvestigation into the domi-nant position of Microsoft, thesecond largest anti-trust(anti-monopoly) action hasbeen bought against a num-ber of biotechnology com-panies including Novartisand Monsanto by US farmersprotesting against the licens-ing and ownership termsbehind the buying and sellingof genetically modifiedfoods.

Law 143
Prohibition IThere must be no agreements or practices which prevent, restrict ordistort competition between organizations. This includes fixing pricesor trading conditions, controlling technology, production, marketingor investment, market or supply sharing, and discriminatory obliga-tions against businesses.
Exemptions from this can be sought from the Office of FairTrading (OFT) if the benefits to the public can be demonstrated tooutweigh any anti-competitiveness. The EU can also create blockexemptions. Tests for anti-competitive behaviour are based on ananalysis of the public interest and the degree of competition. Theprohibition is unlikely to effect businesses with less than a 25% shareof a market.
Prohibition IIProhibits abusive behaviour by any business in a position to dominatea market, either by nature of the product they are selling or bygeography. This includes, for example, actions which may inhibit newentrants to a market such as loss leaders, seasonal exploitation,technical innovation without purpose, or holding technology back.Consideration of whether the action is illegal includes the actuallikelihood of new competition arising, the prices charged, conduct,vertical restraints (that is the number of suppliers and buyers in thesupply chain) and refusals to supply. It may not apply if the marketshare of the dominant company is less than 40%.
The Act is concerned mostly with large organizations and the ‘SmallAgreements’ regulations will exempt companies with a turnoverunder £20 million. All companies, however, are advised to take basicprecautions such as:
� Checking management procedures� Checking specific regulations� Installing quality assurance systems� Maintaining business insurance� Monitoring and record keeping� Undertaking risk assessments� Providing continuing Professional Development (CPD) for staff
Breaches of the Act are investigated by the OFT. The OFT powersare strong and include seizure and ‘dawn raids’. Penalties forinfringement are based on turnover (nominally around 10%) but donot preclude the termination of agreements and being sued bydamaged parties. Guidance on proposed actions can be obtained inadvance from the OFT and usually cost between £4000 and£10 000.
Health and safety
In addition to protecting the consumer, there is a great deal of legislationframed to protect employees. There are broad Acts including, forexample; the Management of Health and Safety 1992, the Provision andUse of Weights (PUWER II), Workplace Health and Safety Welfare, and

144 Law
there are specific regulations that relate to focused areas such as dealingwith asbestos or use of compressed air. Legislation used to beprescriptive but is now wider and more vague placing the onus onemployers to ensure that they are acting reasonably.
For any employer:
� The Health and Safety at Work Act (HSWA) 1974 requires thatemployees have a safe place to work.
� The Factories Act 1961 and the Offices, Shops and RailwayPremises Act 1963 have been largely superseded by Work PlaceHealth, Safety and Welfare Regulations 1992, and the Manage-ment of Health and Safety and Welfare at Work Regulations 1992still applies requiring care on temperature, conditions etc. Regis-tration of offices and shops is required.
� Good practice requires a written statement on safety coveringhazards, evacuation, medical emergencies etc.
� Employers Liability Insurance certificates must be displayed.
Employing more than five staff requires:
� A written statement on safety covering hazards, evacuation,medical emergencies must be published and available.
� There is a duty to ensure adequate staff training and a safetycommittee if requested by the unions. More stringent requirementson fire precautions are required by the Fire Precautions Act1971.
� The Health and Safety (First Aid) Regulations 1981 advise onefirst aider per 50 staff and a first aid room for staff numbers over400.
� Injuries must be recorded and reported to the Health and SafetyExecutive if serious (Records and Notification of Injuries, Dis-eases and Dangerous Occurrences Regulations 1985).
� The Management of Health and Safety Regulations 1992 requiresthat health and safety risks are assessed against industry standardsand accident prevention measures are taken.
Tort actions may also be taken against employees who feel thatemployers are liable for injuries they have received.
The Health and Safety Executive (HSE) frames the legislationbehind employee protection. Its mission is ‘to ensure that risks topeople’s health and safety from work activities are properly con-trolled’. The Health and Safety Commission ensures that the legisla-tion is complied with.
Problems 3.4.1
(1) A consumer cannot sue a manufacturer if they bought adefective product through a retailer. Discuss.
(2) All companies who engage in anti-competitive actions areliable to closure. Discuss.
(3) What defences might a designer use against a claim fornegligence?

Law 145
Chapter review questions
(1) Comment on the application of copyright, design right andregistered design right protection in the following inventions:(a) a new car exhaust system;(b) a specially made suit from a new design (comment also on
the issue of ownership between designer and wearer).(2) X registered the name Harrods.com long before the Harrods store
wanted to claim it. Harrods took the case to interNIC whosuspended the name but X refused to give the name up. Harrodstook X to court claiming trade mark infringement, passing off andconspiracy to injure. Was Harrods successful?
(3) The trefoil rotary shaver head was registered by Philips as a trademark but the legitmacy of this was challenged by Remmington.Was Remmington’s challenge successful?
(4) In the US, X conceived an idea but although being diligent in‘reducing the invention to practise’ Y was the first to actuallycomplete the product. X filed for a patent in the US but Y objected.Who should win the patent rights?
(5) X commissions Y to paint a portrait but is so incensed with thepainting that he destroys it. Y sues claiming under the integrity ofmoral ownership issue, X has treated his painting in a derogatorymanner. Is Y successful?
(6) (a) ® is the symbol for a registered design – true or false?(b) What are the three requirements of a patent?
(7) The small son of an inventor accidentally picks up some of hisfather’s papers which includes a draft patent application. He thenleaves the papers at school on his desk overnight. In the morning,the inventor rushes to the school and collects the application whichis undisturbed on the desk. Can he still pursue the patent?
(8) A plaintiff made a short film, Joy, which he sent on a show reel tothe first defendant, an advertising agency. It was a film of one mandancing to music. The plaintiff had made extensive use of jumpcutting, an editing process whereby pieces of the film within asequence of movements by the actor were excised. The result wasthat the actor appeared on the edited version to have performedsuccessively and without an interval movement, which in realitycould not have succeeded each other. The first defendant, wishingto make an advertisement based on Joy, produced Anticipation, afilm with a different actor and different story but with extensiveuse being made of the plaintiff’s jump cutting technique.Anticipation was subsequently used as a Guinness advertisement.Was the plaintiff successful in suing the defendant for copyrightinfringement?
(9) (a) In Mutual Life Assurance v. Evatt (1971), an insurancecompany made negligent statements to Mr Evatt about thefinancial state of an associated company. In reliance on this,Evatt invested money in the other company and, as a result,suffered financial loss. Could he recover damages from theinsurance company?
(b) In Sayers v. Harlow UDC (1958), Mrs Sayers found herselflocked in a public lavatory. Unable to summon help, she triedto climb out over the top of the door. She found thisimpossible and, when climbing back down, allowed her
146 Law
weight to rest on the toilet roll which ‘true to its mechanicalrequirement, rotated’. Mrs Sayers fell and was injured. Couldshe sue the council?
Activities
(10) Machine Tool Company v. Corporation LtdA Corporation (the buyer) made an enquiry to a Machine ToolCompany (the seller) concerning the purchase of a machine tool.In response, the sellers made a quotation offering to sell amachine tool to the buyers for the price indicated with delivery inten months’ time. The offer was stated to be subject to certainterms and conditions which ‘shall prevail over any terms andconditions in the Buyer’s order’. These conditions included aprice variation clause providing for the goods to be charged at theprice ruling on the date of delivery.
The buyers replied by placing an order for the machine. Theorder was stated to be subject to certain terms and conditions,which were materially different from those put forward by thesellers and which in particular, made no provision for a variationin price. At the foot of the buyers’ order was a tear-offacknowledgment of receipt of the order stating that ‘we acceptyour order on the Terms and Conditions stated thereon’.
The sellers completed and signed the acknowledgment andreturned it to the buyers with a letter stating that the buyers’order was being entered in accordance with the sellers’quotation.
When the sellers came to deliver the machine costs hadincreased so much that the sellers claimed an additional sum dueto them under their price variation clause. The buyers refused topay the increase in price and the sellers brought an actionclaiming that they were entitled to increase the price under theprice variation clause contained in their offer.
The sellers argued that they had stipulated there would be anincrease in the price if there was an increase in costs and so forthin the terms and conditions on the back of their quotation form.The buyers rejected the excess charge, relying on their own termsand conditions. They said: ‘We did not accept the sellers’quotation as it was. We gave an order for the self-same machineat the self-same price, but on the back of our order we had ourown terms and conditions. Our terms and conditions did notcontain any price variation clause’.
Who is correct, the buyers or the sellers? Discuss the issues indetermining this case. What would your judgment be?
(11) Produce a product protection plan for a product of your choice. Aproduct protection plan in the main should be applied to theactual protection of a particular product in question within thecontext of the real world. It should hence show a consideration ofthe competition, evidence of commercial understanding and alogical application of techniques and ideas.
(12) By following and reviewing the history of an innovation whichhas ended up in litigation, your role is to provide an appraisal of‘what went wrong’. You should be able to broaden your analysis

Law 147
so that it applies to all new innovation. You should alsofamiliarize yourself with the workings of the legal system.
(13) List the points you would need to agree on if you werenegotiating with a colleague who wanted to borrow yourcomputer or car for the week. A list of points is referred to as‘heads of agreement’. Using the heads of agreement draft aformal licence.
Further reading Barker, D. & Padfield, C. (1996). Law. Butterworth Heinemann.Clayton, J. (1999). Law for Small Business. Kogan Page.Dworking, G. (1996). Copyright, Designs & Patents. Blackstone.Marsh & Soulsby (1996). Business Law. Stanley Thomas.Smith, J. and Thomas, ?. (1992). Cases on Contract. Sweet and
Maxwell.Whincup, Michael (1999). Sales Law and Product Liability. Gower.

4 Projectmanagement
Summary
We spend much of our life, both in work and at home, being involved in projects of various sizeand complexity. Some projects appear quite simple and we think we do not need to plan them,but just rush in and start them. Often, as a result, these are the ones that drag on and never getfinished satisfactorily.
Most projects, even the simpler ones, must be carefully planned to make sure they aresuccessful. This requires that the project be tackled in phases, breaking it down into variousinterdependent activities and then allocating people and other resources to carry these out. Thischapter takes you through these important phases.
Objectives
By the end of this chapter, the reader should:
� understand the importance of the initiation phases in projects, where the aims and objectivesare formed and how to carry out the initial planning stages (Section 4.1);
� be able to detail plan a project using network diagrams, Gantt charts and allocate the requiredresources (Section 4.2);
� use Goldratt’s Critical Chain methodology to allow for uncertainties in activity times byapplying project and feeder buffers at critical points (Section 4.3);
� be able to control, and report on, progress, including managing change and analysingvariances and then conducting an end audit (Section 4.4).
4.1 What isprojectmanagement?
This section introduces the topic of project management and theimportance of the activity. It briefly describes the initial stages of a projectsuch as the setting of objectives, the team selection and the feasibilitystudy. The section concludes with the start of the planning operationwhere the activities are quantified and dependencies derived.
As discussed in Chapter 1, organizations exist to provide a product ora service and that is where their main day-to-day effort is directed.However, not all the activities within the organization are concerned

Project management 149
with these repetitive operational issues. Some activities are part of aone-off effort directed towards a major change within the organization– these are termed projects. They have to be carried out alongside thenormal activities with minimum disruption.
Project management deals with the organization and control of theactivities involved in planning and carrying out these projects. Projectscome in all sizes and shapes from relatively short, one-man affairs tolarge multi-million pound projects involving hundreds of people andeven several organizations.
Examples of projects vary from highly technical ones, e.g. the designof a new aircraft, to organizational ones such as discussed in Chapter 2.Although each project tends to be unique from previous projects, thereare sufficient similarities in the approach needed, and the problemsencountered, that we can examine and learn from.
A major project goes through several stages:
� Concept: Here the initial need for the project evolves. This stageidentifies an opportunity of some importance to the organization tojustify the diversion of resources from the normal day-to-dayactivities.
� Feasibility study: This is where the project gets firmed up, ordiscarded. An initial examination is needed to check the technicalfeasibility, the time and cost involved and the resources required.Many companies fail to invest sufficient effort here. A projectmanager is often selected at this stage, although this may be leftuntil the next stage.
� Project specification and initiation: This is where the project startsto fill out with clear goals and constraints laid out in the terms ofreference. The project manager and the initial team are confirmed.The team could change through the project stages, but the projectmanager should stay with it.
STAGE
Identify need�
Executive agreement�
Feasibility study�
Executive agreement�
Project specification�
Executive agreement�
Project schedule�
Executive agreement�
Application�
Completion�
Project audit�
Executive agreement
COMMENTS
Brief initial investigation to quantify project
Detailed investigation into benefits, cost, time and resourcesrequired
Selection of team. Detailed terms of reference
Develop activities and resource requirements and prepareproject plan
Run project. If possibility of major changes to objectives,costs or time arise, then requires further executive agreement.Official handover to operations
Report on project attainment, including further plans
Official sign-off
Figure 4.1.1 Flow chart of thestages of a major project. (Notethe need for executiveagreement at key stages)
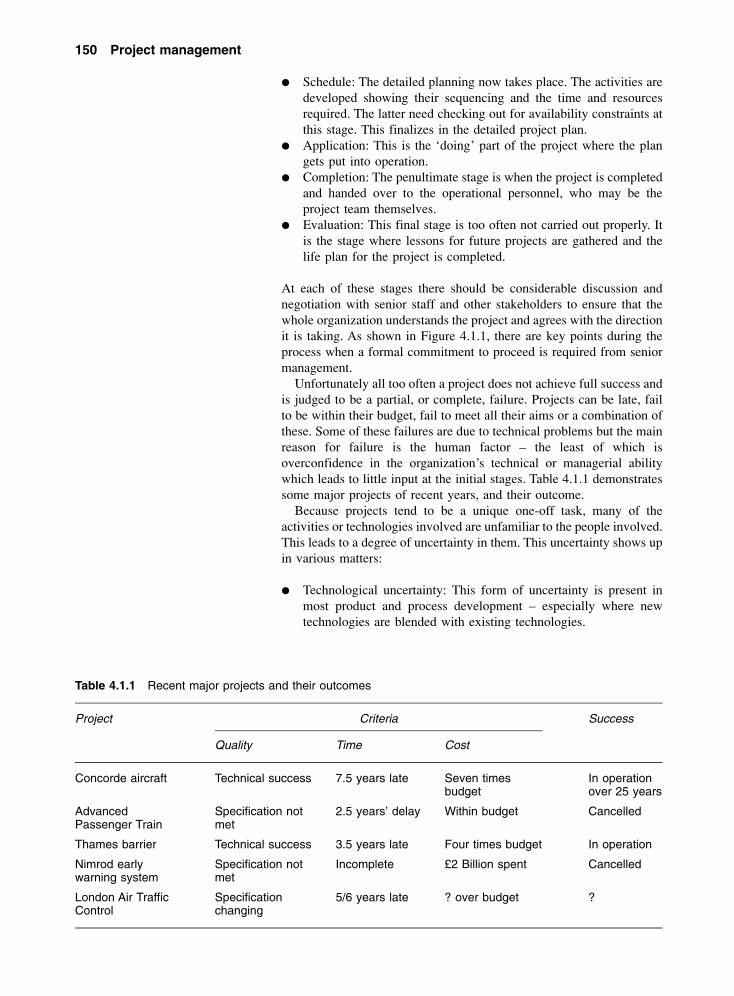
150 Project management
� Schedule: The detailed planning now takes place. The activities aredeveloped showing their sequencing and the time and resourcesrequired. The latter need checking out for availability constraints atthis stage. This finalizes in the detailed project plan.
� Application: This is the ‘doing’ part of the project where the plangets put into operation.
� Completion: The penultimate stage is when the project is completedand handed over to the operational personnel, who may be theproject team themselves.
� Evaluation: This final stage is too often not carried out properly. Itis the stage where lessons for future projects are gathered and thelife plan for the project is completed.
At each of these stages there should be considerable discussion andnegotiation with senior staff and other stakeholders to ensure that thewhole organization understands the project and agrees with the directionit is taking. As shown in Figure 4.1.1, there are key points during theprocess when a formal commitment to proceed is required from seniormanagement.
Unfortunately all too often a project does not achieve full success andis judged to be a partial, or complete, failure. Projects can be late, failto be within their budget, fail to meet all their aims or a combination ofthese. Some of these failures are due to technical problems but the mainreason for failure is the human factor – the least of which isoverconfidence in the organization’s technical or managerial abilitywhich leads to little input at the initial stages. Table 4.1.1 demonstratessome major projects of recent years, and their outcome.
Because projects tend to be a unique one-off task, many of theactivities or technologies involved are unfamiliar to the people involved.This leads to a degree of uncertainty in them. This uncertainty shows upin various matters:
� Technological uncertainty: This form of uncertainty is present inmost product and process development – especially where newtechnologies are blended with existing technologies.
Table 4.1.1 Recent major projects and their outcomes
Project Criteria
Quality Time Cost
Success
Concorde aircraft Technical success 7.5 years late Seven timesbudget
In operationover 25 years
AdvancedPassenger Train
Specification notmet
2.5 years’ delay Within budget Cancelled
Thames barrier Technical success 3.5 years late Four times budget In operation
Nimrod earlywarning system
Specification notmet
Incomplete £2 Billion spent Cancelled
London Air TrafficControl
Specificationchanging
5/6 years late ? over budget ?

Project management 151
� Scheduling uncertainty: When people are doing something new,they will be unable to predict accurately how long it will take them,or others, to complete their tasks. There may even be doubts abouttheir release from other ongoing tasks.
� Cost uncertainty: The uncertainty in the time factor means it isdifficult to anticipate associated spending. In addition the full costof equipment suffers from a similar lack of identification.
� Organizational/Political: This is where many projects get into realdifficulties. Part of this is the struggle for scarce resources to meetpersonal targets and part is the rearward action of the potentiallosers in any change.
� Staff turnover: The longer a project runs the more chance that keystaff involved will change. This leads to loss of time as thereplacements come up to speed and develop the requiredknowledge.
� Environment: New legislation and competitors’ actions may affectthe marketplace.
Any project plan therefore must anticipate these problems and seek toeliminate, or minimize, them by careful contingency planning andmanagement to reduce the risks involved.
Project initiation
A project is started with the identification of a need for a change. Thisneed can arise from many reasons some of which will be proactive, i.e.an attempt to evolve, or use, a new technology, and others will be inreaction to events in the organization’s marketplace. The needs cancome from a variety of sources, such as a SWOT analysis (see page305). The following give an indication of some project aims:
� Developing a new product.� Entering a new marketplace.� Installing a new computer system.� Selecting and installing a new process.� Retraining in new technologies or techniques.� Improving quality levels.� Reducing operating costs.� Refocusing managerial priorities.� Meeting new legislation.� Solving a major environmental problem.� Amalgamating with another organization.
Whatever the need identified, for it to be accepted as a project it mustprimarily contribute to the business objectives of the organization, andbe formally recognized by senior management.
At this stage the full solution will probably not be known. In facttoo often an intuitive jump to a solution is made without fullyexamining the implications or the alternatives. Instant answers andquick commitments may look good, but quite often they contribute tothe lack of success as organizations become committed to onesolution. It then becomes emotionally difficult, and costly, to changelater as shown in Figure 4.1.2.

152 Project management
The project team
Early on in the project life, a team must start to be formed to carry outthe detailed planning and control activities.
The first appointee is not the project leader, but the project sponsor orchampion. This is a member of senior management who is responsiblefor the progress and success of the project. This gives the project statusand top level access and commitment. The sponsor may delegate mostof the planning and control of the project to a team, but must retain a fullcomprehensive involvement in the progress.
The next decision is how to manage the project. Depending on its sizeand complexity, it may be manageable within existing structures withone manager, or technical expert, in control. It may require a teamwhich could be a task force made up of managers and others involvedon a part-time basis, or it may require a full-time focused team.
The important thing is the composition of skills, attitudes andcommitment required to fully understand and manage all the differentaspects of the project. These cannot all be learned during the project sothe team needs to bring most of these with them. The team thereforeneeds both technical knowledge and the ability to carry out thefollowing management tasks:
� Leading� Planning� Organizing� Co-ordinating� Budgetary control� Communicating� Negotiating� Managing user’s expectations
The key person is the project manager, who is usually full time on theproject from start to finish, although other members of the team maychange. This individual could be someone from the area most involvedin the project, but choice may be limited. The person requires a broadrange of experience, ability and organizational standing which may notbe available, therefore the appointment of someone from outside theimmediate area often has to be made.
Figure 4.1.2 Problems inchanging project details as timeprogresses

Project management 153
The team itself needs a blend of personalities as well as skills andexperience. They must be able to work together openly. This does notmean submerging into one homogeneous group but a willingness toopenly respect and discuss points of difference and come to a groupconsensus which is acceptable to everyone. To aid this blending, thegroup size must be limited and made up of people without too wide astatus within the organization.
Terms of reference
This is the important authority to proceed document. It sets theobjectives, the scope and constraints of the project. This can be briefinitially, i.e. prior to the feasibility study, but must be firmed up beforethe main project goes ahead. Areas needing detailing are:
� Authority and sponsorship – identification of project sponsor.� Contact with users.� Objectives: few in number:
– Alignment with business objectives.– Measurable in quantity, quality, time, cost and end product.– Consistent, understandable and achievable.
� Scope – departments, people, products, processes, etc.� Constraints.� Budget and timings of cash flows.� Resources required.� Interim deliverables.� Timetable showing phases and involvement.� Risks foreseeable and factors outside influence:
– Identified assumptions including probability of occurrence.– Impact assessment and contingency plans.
� Team roles and responsibilities.
This requires firm agreement at top level.
The feasibility study
A comprehensive feasibility study is not just directed to answering thequestion ‘Can it be done?’ It is better that this stage be carried out by theproject team, although some organizations use consultants for initialconfidentiality. Whoever does it, they must address all the questionssurrounding the issue such as:
� What are the alternatives?� How technically feasible are the alternatives?� What is involved in doing it?� Do we have the internal skill and experience to carry it out?� Who needs to be involved during the process?� What are the potential problems that may arise?� What training will be required?� When can it be done?� What disruptions will it cause?� Areas of potential controversy and disagreement?� What will be the effect on people directly, and indirectly, involved?

154 Project management
� What is needed in resources?� How much will it cost?� How long will it take?� What are the dependency chains?� What are all the benefits?� Are there existing benchmarks available to use to set targets?� Is there legislation that needs consideration?
For these questions to be fully answered will take a fair degree ofinvestigation to gather facts and opinions. This may mean visiting otherestablishments and suppliers, use of consultants, etc. During thisinvestigation there will have to be considerable discussion with thosedirectly, and indirectly, affected to determine their support, or resistance.
There will be resistance to spending a considerable amount of timeand money at this stage and impatience to get on with the job. Althoughit is important to be cost effective and efficient in carrying out thefeasibility study, stinting it too severely can easily lead to problems lateron in the main project itself.
The final stage of the feasibility study should be the selection fromthe available alternatives.
Selection process
The final point of the feasibility study is where the alternatives areevaluated, compared and one selected as the preferred option.
Each of the alternatives can be compared under as many aspects asdeemed desirable, perhaps by ranking them using the paired comparisontechnique (see Chapter 2) to reduce them to the one or two maincontenders. These remaining contenders then need to be put through theorganization’s economic appraisal system (see Chapter 4) to determinetheir economic standing.
Another way of selecting can be by a similar process to that used indesign, i.e. by ranking each alternative’s match to a set of key criteria.This can be carried out by producing a matrix, in which each alternativeis scored on a scale from a relative value, or cost, viewpoint, i.e. a lowof one up to a high of ten under a range of significance criteria.Depending on the circumstances, one set of criteria may be:
� Operational capability: This judges the degree of internal skill andexperience available to operate and maintain an alternative. A scoreof one means that there is very little internal ability and a score often means that internal abilities are more than sufficient.
� Technical capability: This is looking at the match between the projectteam’s technical competence to design and evaluate an alternative. Itmay show that the project will need outside support of consultants.
� Financial investment: The full cost-benefit analysis will show up thetotal amount of investment required. Here a very high capitalinvestment scores just one – with little or no investment scoring ten.
� Financial return: The time to payback and total return can be judgedhere to determine future financial benefits.
� Time scale: The ability to complete the project within a certain timeframe which can be set by the organization. The longer thetimescale, the lower the points gained. It is often easier and better tohave several limited connected projects than to try and have themrolled into one big project.

Project management 155
� Disruptions to present activities: This judges the disruptions topresent activities that an alternative will involve.
� Ability of the alternative to meet aims such as quality, deliveryspeed, etc.
All the criteria need not carry the same weighting. A survey of topmanagement may decide at a particular time that the criteria may beweighted as follows, with three being the most important aspects inpresent circumstances:
� Operational capability: 2� Technical capability: 1� Financial investment: 2� Financial return: 1� Timescale: 3� Disruptions: 1� Meeting aims (each aim): 3
At another time they may increase the weighting of the financialinvestment to 3 because of plenty of available cash funds, or reduce itto 1 where investment needs to be curtailed due to lack of funds.
For the scoring we can produce a decision grid as in Figure 4.1.3. Thecolumns show the total score against each alternative under bothweighted and non-weighted conditions. From these, the alternative withthe highest weighted score would be selected for first choice – in thiscase project B.
The result of the feasibility study and the basis of selecting aparticular alternative would be presented to the management committeefor approval before proceeding to the detailed planning stage. It is at thisstage that the main direction and cost of the project is decided. It will bedifficult, but not impossible to change these later.
Initial project planning
As with any job, the key to a successful completion lies in thepreparatory work carried out beforehand, in this case the detail projectplan. Planning projects involves several stages:
� Logical analysis of the many different activities to be done.� Estimating the resources and time required for each activity.
Criteria Weighting Alternative A
Raw score Weighted score
Alternative B
Raw score Weighted score
Alternative C
Raw score Weighted score
Operational Capability 2 7 14 6 12 5 10Technical Capability 1 5 5 3 3 7 7Financial Investment 2 4 8 3 6 8 16Financial Return 1 4 4 9 9 6 6Time scale involved 3 2 6 7 21 4 12Disruptions involved 2 8 16 3 6 6 12Meeting aims 3 9 27 9 27 6 18
TOTALS 39 80 40 84 42 81
Figure 4.1.3 Decision matrix comparing alternative solutions to meeting project aims

156 Project management
� Calculating the costs involved.� Setting these activities in a sequence of dependency.� Scheduling the activities.� Preparing a cash flow requirement.� Setting milestones to denote important stage completion.� Identifying potential problems and making contingency plans.
Quantifying the activities
Use people familiar with the work involved to gradually break down themain activities into smaller component activities at lower levels.Initially this should stop at a department or section level. The moredetailed breakdown can be done by the managers within these areas.
The main characteristics of an activity at this level should be that it hasa clear start and end point which can be measured by an end product. Oncethis is established, then the activity can be quantified in cost, effort,resources and time. This should be under the clear responsibility of oneperson, not necessarily the one who will be actually carrying it out.
The Information required is:
� Description� Inputs and preconditions� Deliverables� Resource requirement� Skill requirement� Estimated cost and time� Assumptions made� Degree of variability� Causes of variability
Because of the uncertainty that is often involved at the planning stage,there may be difficulty in arriving at an estimate of time and cost. Whatis required is a reasonable, honest figure which is based on usingcommitted, skilled staff. Depending on personalities involved and theculture of the organizations there will be a tendency to over- orunderestimate the task needs:
� Overestimation occurs when there is a blame culture and people arewary of committing themselves when the consequences of doing somay rebound on them, this leads to extra padding being inserted as asafety margin. Overestimation may also be based on concerns aboutthe complexity of the task, or may be based on overengineering.
� Underestimation occurs when people are overconfident and takerisks or make false assumptions about what is required to be done,perhaps because they do not realize the complexity, or what isrequired of them.
Both need guarding against because of the overall picture.
Dependency
Alongside the breakdown of the work involved into smaller activities,we need to determine the sequence in which these must be carriedout.

Project management 157
This is arrived at by looking at what needs to be complete before eachactivity can start. Sometimes this will be information but at other timesthere will need to be a physical entity available such as an object orperhaps an area being made available or prepared.
When this condition is arrived at in another activity, then we say thereis dependency on that activity. The point need not be at the end of anactivity, but needs to be clearly identified.
Where there is no dependency, it may be possible to carry out severalactivities at the same time, i.e. in parallel.
However, when there is dependency this controls the sequence thatthe activities have to be scheduled. The normal type of dependency isthat of waiting until the end of the preceding activity, but the start signalcan arise at any point – even at the beginning where some degree ofoverlap can take place. In a few cases, the dependency can come fromthe ending of two separate activities, i.e. we may need them both to becompleted before we can start the next activity.
Once we have all the information about the activities, we can thenschedule them together to make up the overall project plan, and then geton with the project.
Problems 4.1.1
(1) Think of all the different types of projects you have beeninvolved in – what made you think of them as a project?
(2) Why do you think the terms of reference for a project requiretop level agreement?
(3) Under what circumstances do you think that financialconsiderations will play a minor part in deciding a project hastop priority?
(4) How long would you say it takes to travel from your home toyour place of work or study?
(5) Can you think of an activity in your daily life that can start onlyafter another activity has started?
4.2 Projectscheduling – thecritical path
This section looks in detail at scheduling activities within a project to findproject completion dates by using dependencies between activities andestablishing float (spare) times associated with these activities. This isexamined first in small projects and then the effect of combining thesesmall projects into one larger project is investigated. Methods ofchanging activities and resource allocation to alter the overall completiontimes are also addressed. Network diagrams and Gantt charts areintroduced using Microsoft™ Project to provide the illustrations.
Assuming that all the activities and dependencies have been correctlyidentified, we now need to complete a schedule showing when eachactivity should start (and finish), the use of resources especially whenmoney needs to be made available and of course when the project willbe complete. This will identify those activities which must be completedon time and those where some spare time exists.
There are dozens of different software packages available to assistproject scheduling. In this textbook Microsoft™ Project is used forillustrating software usage. This is merely for convenience – if you wish

158 Project management
Figure 4.2.1 Breakdown of main (summary) tasks into sub-tasks
to purchase a suitable package, you are recommended to conduct yourown investigation to meet your particular requirements. A good place tostart is the annual Source Book published by Project Manager Today.
To explain the stages in scheduling we will use three interconnectedprojects:
� The construction of a new building.� The design and prototyping of a new product.� Installing the manufacturing process for the new product in the new
building.
Each will be used to explain a principal technique and then they will beamalgamated to show the problem in scheduling multi-projects.
When scheduling projects we need to have a manageable number ofactivities, say a maximum of twenty. As most projects will consist of alarge number of small activities, it is best to group these logically intohigher level groups as in Figure 4.2.1. The lower level activities can bescheduled interdependently within Microsoft™ Project. In this softwarewe refer to the upper level activities as summary tasks and the lowerlevel activities as sub-tasks.
Project 1 – the new building: Gantt chartsand cash flow
The higher level activities involved in this project are shown in Table4.2.1. The times and costs are just for demonstration purposes. For thepresent, let us ignore the resources required, assume that the durations
Table 4.2.1 Activities involved in constructing the new building
Ref. Activity Durationweeks
Immediatepredecessors
Cost£
B.1 Design 6 – 12 500B.2 Site acquisition 6 – 75 000B.3 Planning application 12 B.1 and B.2 7000B.4 Site preparation 3 B.1 and B.3 9000B.5 Order materials 5 B.1 15 000B.6 Install drainage 3 B.4 and B.5 5500B.7 Erect structure 2 B.4 and B.5 7500B.8 Clad structure 3 B.7 and B.5 6000B.9 Install flooring 2 B.6 and B.8 4500B.10 Install services 2 B.9 8000B.11 Finish interior 3 B.10 3500
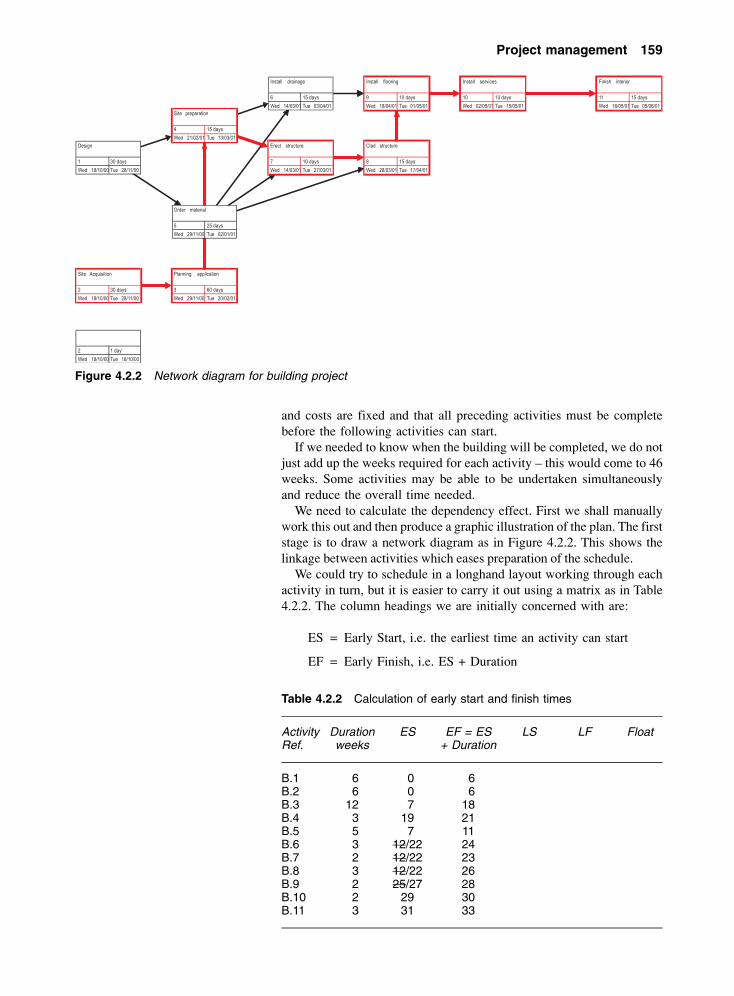
Site Acquisition
2 30 days
Wed 18/10/00 Tue 28/11/00
Planning application
3 60 days
Wed 29/11/00 Tue 20/02/01
Site preparation
4 15 days
Wed 21/02/01 Tue 13/03/01
Order material
5 25 days
Wed 29/11/00 Tue 02/01/01
Install drainage
6 15 days
Wed 14/03/01 Tue 03/04/01
Erect structure
7 10 days
Wed 14/03/01 Tue 27/03/01
Clad structure
8 15 days
Wed 28/03/01 Tue 17/04/01
Install flooring
9 10 days
Wed 18/04/01 Tue 01/05/01
Install services
10 10 days
Wed 02/05/01 Tue 15/05/01
Finish interior
11 15 days
Wed 16/05/01 Tue 05/06/01
Design
1 30 days
Wed 18/10/00 Tue 28/11/00
2 1 day
Wed 18/10/00 Tue 18/10/00
Project management 159
and costs are fixed and that all preceding activities must be completebefore the following activities can start.
If we needed to know when the building will be completed, we do notjust add up the weeks required for each activity – this would come to 46weeks. Some activities may be able to be undertaken simultaneouslyand reduce the overall time needed.
We need to calculate the dependency effect. First we shall manuallywork this out and then produce a graphic illustration of the plan. The firststage is to draw a network diagram as in Figure 4.2.2. This shows thelinkage between activities which eases preparation of the schedule.
We could try to schedule in a longhand layout working through eachactivity in turn, but it is easier to carry it out using a matrix as in Table4.2.2. The column headings we are initially concerned with are:
ES = Early Start, i.e. the earliest time an activity can start
EF = Early Finish, i.e. ES + Duration
Figure 4.2.2 Network diagram for building project
Table 4.2.2 Calculation of early start and finish times
ActivityRef.
Durationweeks
ES EF = ES+ Duration
LS LF Float
B.1 6 0 6B.2 6 0 6B.3 12 7 18B.4 3 19 21B.5 5 7 11B.6 3 12/22 24B.7 2 12/22 23B.8 3 12/22 26B.9 2 25/27 28B.10 2 29 30B.11 3 31 33

160 Project management
We start with identifying which activities can start at any time, i.e. theyhave no predecessors. In this case this only applies to activities B.1 andB.2, the design and site acquisition activities, and they therefore have anES of zero. We then proceed to start any follow-on activities when itspredecessor ends, i.e. the week following their EF.
Where there is more than one predecessor, we take the latest EF valueby which all the predecessors finish. This is shown in the matrix byscoring out the ES values which are not selected.
By looking for the highest EF time we can see how long the projectwill take to complete. In this case it is the EF for activity B.11, i.e. 33weeks, assuming all the activities are completed on time. However, dowe need to start every activity at its earliest start time? The way todetermine this is to complete the next two columns in the matrix as inTable 4.2.3. These are:
LF = Latest Finish, i.e. the latest time an activity can finish toprevent extending the overall project completion time
LS = Latest Start, i.e. LF – Duration
This time we take the final activity, i.e. B.11, and put its EF value into itsLF box and then work backwards to see when all predecessors have to becompleted by. This is found by transferring the LS value less one weekinto all immediate predecessors’ LF boxes. If an activity has no follow-onactivities, it would share the LF time with the final activity.
Where an activity is directly preceded by more than one activity, weuse the earliest LS value by which all the follow-on activities start. This isshown in the matrix by scoring out the LF values which are not selected.
The float, or slack as it is also called, value is the time that anactivity’s EF time can be delayed without affecting the end date of theproject. It is shown in Table 4.2.4 and calculated from:
Float = LF – EF
The only activities with a float are B.5 and B.6. This means thatactivity B.5 could either start up to ten weeks after its ES time, or taketen weeks longer than estimated, and not affect the overall project time.Similarly activity B.6 has two weeks’ float available.
Table 4.2.3 Calculation of latest start and finish times
ActivityRef.
Durationweeks
ES EF LS = LF– Duration
LF Float
B.1 6 0 6 0 6/18B.2 6 0 6 0 6B.3 12 7 18 7 18B.4 3 19 21 19 21/28B.5 5 7 11 17 26/21/28B.6 3 22 24 24 26B.7 2 22 23 22 23B.8 3 24 26 24 26B.9 2 27 28 27 28B.10 2 29 30 28 30B.11 3 31 33 31 33

ID ID Task Name Fixed Cost
1 1 Design £12 500.00
2 2 Site Acquisition £75 000.00
3 3 Planning application £7 000.00
4 4 Site preparation £9 000.00
5 5 Order material £15 000.00
6 6 Install drainage £5 500.00
7 7 Erect structure £7 500.00
8 8 Clad structure £6 000.00
9 9 Install flooring £4 500.00
10 10 Install services £8 000.00
11 11 Finish interior £3 500.00
12 12 Site acquired £0.00
13 13 Planning permission received £0.00
14 14 Site ready £0.00
15 15 Building complete £0.00
28/11
20/02
13/03
16 23 30 06 13 20 27 04 11 18 25 01 08 15 22 29 05 12 19 26 05 12 19 26 02 09 16 23 30 07 14 21 28 04
November December January February March April May June
Page 1
1 Project:IIEbuild
Date: Fri 20/10/01
Task
Split
Progress
Milestone
Summary
Rolled-up task
Rolled-up split
Rolled-up milestone
Rolled-up progress
External tasks
Project summary
Project management 161
The other activities are critical to the project finishing in 33 weeks,i.e. they must be started at their ES time and take no longer than theirestimated duration. These lie along what is termed the critical path, i.e.the path along which all activities must adhere to their expected time sothat the project is completed in the minimum possible time. This criticalpath is indicated as a heavy line in the network diagram in Figure 4.2.2.Any activity that takes longer than its estimated duration plus anyassociated float will increase the overall project completion time.
To ease communication of the sequence in which the tasks requirecompletion, tasks can be portrayed in a Gantt, or bar, chart as shown in
Table 4.2.4 Calculation of floats
ActivityRef.
Durationweeks
ES EF LS LF Float =LF – EF
B.1 6 0 6 0 6 0B.2 6 0 6 0 6 0B.3 12 7 18 7 18 0B.4 3 19 21 19 21 0B.5 5 7 11 17 21 10B.6 3 22 24 24 26 2B.7 2 22 23 22 23 0B.8 3 24 26 24 26 0B.9 2 27 28 27 28 0B.10 2 29 30 28 30 0B.11 3 31 33 31 33 0
Figure 4.2.3 Gantt chart forbuilding project

162 Project management
Figure 4.2.3. The Gantt chart shows the activities on a timescale andtherefore is easy to understand. The linkages and floats also stand out.This chart shows the ES values of each activity and certain key events,e.g. planning permission received, have been selected as milestones, i.e.important points during the project’s life.
Having scheduled the activities, we now need a schedule of cash flowso that the accounting department can ensure money is available whenrequired. To do this, we need to determine the cash flow for eachactivity as in Table 4.2.5.
Using this and the information on the activity’s ES and EF times fromTable 4.2.3, we can complete a spreadsheet showing the cash outflow oneach week, as in Table 4.2.6. From this we can show a graph of weeklyand accumulated cash flow as in Figure 4.2.4.
However, if we go back to Table 4.2.4, we see that activities B.5 andB.6 have float associated with them. If we delay these two activities’start dates to the LS times, we also delay when their costs need to beincurred. This delay can earn interest on that money for this time. Thedifference in cash flow is shown in Figure 4.2.5.
Table 4.2.5 Cash flow per activity
Ref. Activity Cost £ Cash flow pattern
B.1 Design 12 000 Even spreadB.2 Site acquisition 75 000 £5000 week 1 and balance at endB.3 Planning application 7000 £2000 weeks 1–3, balance at endB.4 Site preparation 9000 Even spreadB.5 Order materials 15 000 One month after deliveryB.6 Install drainage 5500 Even spreadB.7 Erect structure 7500 Even spreadB.8 Clad structure 6000 Even spreadB.9 Install flooring 4500 Even spreadB.10 Install services 8000 Even spreadB.11 Finish interior 3500 Even spread
Figure 4.2.4 Cash flow forearly start times
Figure 4.2.5 Difference incash flows for early start andlate start times

Project management 163
Table 4.2.7 Activities involved in new product design
ActivityRef.
Activity Precedeby
Estimated durations(weeks)
Expectedduration
StdDev. Variance
Optimist Likely Pessimist = to + 4 t l + tp
6
to + tp
6
to t l tp te � �2
D.1 Market research – 25 fixed timeD.2 Concept design D.1 5 10 25D.3 Detailed design D.2 25 30 35D.4 Produce prototype D.3 10 10 15D.5 Engineering tests D.4 5 fixed timeD.6 Test market D.5 5 fixed timeD.7 Finalize design D.4 10 15 15
Table 4.2.6 Cash flow for build project
Week Activities funded
Activity Amount Activity Amount
Cashout
Early startsaccumulative
cash flow
01 B.1 £2 000 B.2 £5 000 £7 000 £7 0002 B.1 £2 000 £2 000 £9 0003 B.1 £2 000 £2 000 £11 0004 B.1 £2 000 £2 000 £13 0005 B.1 £2 000 £2 000 £15 0006 B.1 £2 000 B.2 £70 000 £72 000 £87 0007 B.3 £2 000 £2 000 £89 0008 B.3 £2 000 £2 000 £91 0009 B.3 £2 000 £2 000 £93 000
10 £0 £93 00011 £0 £93 00012 £0 £93 00013 £0 £93 00014 £0 £93 00015 B.5 £15 000 £15 000 £108 00016 £0 £108 00017 £0 £108 00018 B.3 £1 000 £1 000 £109 00019 B.4 £3 000 £3 000 £112 00020 B.4 £3 000 £3 000 £115 00021 B.4 £3 000 £3 000 £118 00022 B.7 £3 750 B.6 £1 833 £5 583 £123 58323 B.7 £3 750 B.6 £1 833 £5 583 £129 16724 B.8 £2 000 B.6 £1 833 £3 833 £133 00025 B.8 £2 000 £2 000 £135 00026 B.8 £2 000 £2 000 £137 00027 B.9 £2 250 £2 250 £139 25028 B.9 £2 250 £2 250 £141 50029 B.10 £4 000 £4 000 £145 50030 B.10 £4 000 £4 000 £149 50031 B.11 £1167 £1167 £150 66732 B.11 £1167 £1167 £151 83333 B.11 £1167 £1167 £153 000

164 Project management
Project 2 – new product design: variableestimates
In the previous project, we assumed that all the activity durations werefixed. However, in practice, we do not always know exactly in advancehow long an activity will take – especially if we have not done that exacttask before. What we often have to do in that situation is seek a rangeof possible estimates and use these to calculate an expected duration.
Let us assume the second project is such a case and we have threeestimates for the durations for some activities as shown in Table 4.2.7.The others still have a fixed estimate for their duration. The threeestimated durations are based on:
� Optimist: Everything goes exactly right – no problems.� Likely: Normal activity – some minor problems.� Pessimist: Everything goes wrong – many problems.
Where we have a fixed duration activity, this will become theexpected duration. However, to calculate an expected duration for thevariable activities, we apply the formula:
Expected duration = (optimist + (4 × likely) + pessimist) ÷ 6
i.e. te = (to + (4 × tl) + tp) ÷ 6
If we take as an example the estimated durations for D.2, the conceptdesign activity, then the formula fills out to:
te = (5 + (4 × 10) + 25) ÷ 6= (5 + 40 + 25) ÷ 6= (70) ÷ 6= 11.67 weeks
Activity 4.2.1
Use a spreadsheet and calculate the expected duration foractivities D.3, D.4 and D.7.
You can also have software calculate the expected time, e.g. Micro-soft™ Project using its PA_PERT Entry Sheet view, but this does notcalculate out a standard deviation for the activity (see later). Once wehave all expected durations calculated, we can complete the matrix as inTable 4.2.8.
Note that the expected durations are not the same as the likelydurations, but are altered by expectations about how the activity mayvary.
We can now schedule this project using the expected durations and anetwork diagram as per Figure 4.2.6 to produce the project Gantt chartas per Figure 4.2.7.

Concept design
2 11.67 days
Wed 22/11/00 Thu 07/12/00
Detailed design
3 30 days
Thu 07/12/00 Thu 18/01/01
Produce prototype
4 10.83 days
Thu 18/01/01 Fri 02/02/01
Engineering tests
5 5 days
Fri 02/02/01 Fri 09/02/01
Finalize design
7 14.17 days
Fri 09/02/01 Thu 01/03/01
Test market
6 5 days
Fri 09/02/01 Fri 16/02/01
Market research
1 25 days
Wed 18/10/00 Tue 21/11/00
Task
Split
Progress
Milestone
Summary
Rolled-up task
Rolled-up split
Rolled-up milestone
Rolled-up progress
External tasks
Project summary
ID WBS Task name Duration Start Finish
1 D.1 Market research 25 days Wed 18/10/00 Tue 21/11/00
2 D.2 Concept design 11.67 days Wed 22/11/00 Thu 07/12/00
3 D.3 Detailed design 30 days Thu 07/12/00 Thu 18/01/01
4 D.4 Produce prototype 10.83 days Thu 18/01/01 Fri 02/02/01
5 D.5 Engineering tests 5 days Fri 02/02/01 Fri 09/02/01
6 D.6 Test market 5 days Fri 09/02/01 Fri 16/02/01
7 D.7 Finalize design 14.17 days Fri 09/02/01 Thu 01/03/01
8 8 MR report due 0 days Tue 21/11/00 Tue 21/11/00
9 9 Initial design complete 0 days Thu 18/01/01 Thu 18/01/01
10 10 Final design complete 0 days Thu 01/03/01 Thu 01/03/01
21/11
18/01
16/10 30/10 13/11 27/11 11/12 25/12 08/01 22/01 05/02 19/02
November December January February M
Page 1
Project: Project1
Date: Fri 22/10/00
Project management 165
Figure 4.2.6 Network diagram for design project
Figure 4.2.7 Gantt chart for design project
Table 4.2.8 Expected times for activities
ActivityRef.
Activity Precedeby
Estimated durations(weeks)
Expectedduration
StdDev. Variance
Optimist Likely Pessimist = to + 4 t l + tp
6
to + tp
6
to t l tp te � �2
D.1 Market research – 25 fixed time 25D.2 Concept design D.1 5 10 25 11.67D.3 Detailed design D.2 25 30 35 30D.4 Produce prototype D.3 10 10 15 10.83D.5 Engineering tests D.4 5 fixed time 5D.6 Test market D.5 5 fixed time 5D.7 Finalize design D.4 10 15 15 14.17

166 Project management
Activity 4.2.2
Complete a matrix similar to Table 4.2.4 for this project usingthe expected durations for each activity. Calculate the ES, EF,LS, LF and floats values.
Figure 4.2.6 shows the critical activities to be D.1, D.2, D.3, D.4 D.5then D.7. These total to 96.17 weeks based on the expected times.Activity D.6 alone has a float – equal to 9.17 weeks.
Maths in action
Patterns in an activity’s duration
If we drew graphs of the possible durations for each of thevariable activities, we would get distinctly different patterns asshown in Figure 4.2.8. These show:
(a) Long tail, e.g. activity D.2. On occasions may possiblysuffer a major problem, or need an extended examina-tion and therefore take a much longer time.
(b) Normal bell-shaped distribution, e.g. activity D.3.(c) Most likely to be short, a few may have problems and
take longer, e.g. activity D.4.(d) Most likely to be long, a few may go well and take
shorter, e.g. activity D.7.
The expected duration is only a calculated value – this means that 50%of the time it will be less than this, and 50% of the time it will be more.Many organizations are unhappy with scheduling a project with only a50% probability that some activities’ duration will be within that usedfor planning. They may wish to schedule a longer duration than thatcalculated as expected to ensure a higher probability of the scheduledduration being met.
The extra time added will depend on the desired probability and thedistribution pattern of the activity. In a normal distribution, a good valueto take is that of the standard deviation (SD). Unfortunately we do nothave sufficient values to calculate out a true SD – the practice in projectplanning is to calculate an approximate SD, as follows:
SD ≅ (pessimist value – optimist value) ÷ 6
If we take activity D.2 as an example, this works out to:
SD ≅ (25 – 5) ÷ 6≅ (20) ÷ 6≅ 3.33
Note: use this approximation with care as it assumes a normaldistribution which is often not the case, e.g. the pattern for D.2 showsa long tail rather than the normal bell shape.

Project management 167
Activity 4.2.3
Calculate out the approximate standard deviation (SD)values for activities D.3, D.4 and D.7. Also calculate thevariance which is the square of the SD – we’ll come to whywe calculate these variances later.
Putting the approximate standard deviations into the matrix, we haveTable 4.2.9. We enter the variations and then sum these variations on thecritical path activities.
Figure 4.2.8 Commondistribution of times taken tocomplete activities

168 Project management
Maths in action
Normal distribution
In any situation where we have a range of variables, wenormally expect a completely random variation created byrepeating common causes. A histogram of the measurementof the output would then create a normal distribution curve, asshown in Figure 4.2.9.
With a normal distribution an indicator for the probability ofbeing within a set value from the mean value is the standarddeviation. Table 4.2.10 gives a sample of these probabilities:
Table 4.2.10 Relationship between probabilities and standarddeviations
Desired probability of meeting value 50% 75% 90% 95% 99%Standard deviation from mean 0 0.67 1.28 1.65 2.33
Figure 4.2.9 Normaldistribution curve showingpercentage values withinmultiples of the standarddeviation
Table 4.2.9 Standard deviations for activities
ActivityRef.
Activity Precedeby
Estimated durations(weeks)
Expectedduration
StdDev· Variance
Optimist Likely Pessimist = to + 4 t l + tp
6
to + tp
6
to t l tp te � �2
D.1 Market research – 25 fixed time 25 0 0D.2 Concept design D.1 5 10 25 11.67 3.33 11.11D.3 Detailed design D.2 25 30 35 30 1.67 2.78D.4 Produce prototype D.3 10 10 15 10.83 0.83 0.69D.5 Engineering tests D.4 5 fixed time 5 0 0D.6 Test market D.5 5 fixed time 5 0 0D.7 Finalize design D.4 10 15 15 14.17 0.83 0.69
Total of variances on critical path 15.28

Project management 169
This means that if we wish activity D.2 to be met on 90% of occasions,then we take the expected duration and add to it (1.28 times the SD), viz:
D.2’s new duration = expected duration + (1.67 times SD)= 11.67 + (1.67 × 3.33)= 11.67 + 5.56= 17.23
This is quite a large increase – imagine what it would do if we had toapply the same calculation to each activity on the critical path to arriveat a value by which we have a 90% probability of completing the wholeproject. Fortunately we do not.
As the critical path is formed from a string of activities, we canassume that some of these activities will take longer and some will takeless than their expected values. These ups and downs will offset eachother to some degree and we can allow for that by calculating the overallSD for the project using the variation values for each activity on thecritical path. We then find the overall SD by summing the critical pathvariances and finding the square root of this sum. Note: only these onthe critical path are used.
Project SD = square root of (sum of variances on critical path)
Therefore, for this project,
Project SD = √(15.28) = 3.91
If we wish to calculate for the project a new overall completion timewith a set probability, we use the overall expected completion time andadd to it a multiple of the project’s SD value. For example, if we wishto find the overall completion time with a 90% probability of being met,we have:
Project’s new duration = expected duration + (1.67 times SD)= 11.67 + (1.67 × 3.33)= 96.17 + (1.67 × 3.91)= 96.17 + 6.53= 102.80 weeks
We can set the project end date in Microsoft™ Project based to this newvalue and it will show up an overall project float of 6.53 weeks. We canthen use this overall float as a buffer in managing the project.Microsoft™ Project cannot accommodate variable activities except inthis way. In Section 4.3, however, we introduce add-in software whichdoes allow variable activities to be coped with and makes use of buffersthroughout the project.
Project 3 – new plant installation:changing the overall time
The activities for this project are given in Table 4.2.11. and the networkin Figure 4.2.10. Let us assume that the durations are fixed for theseactivities. Resources will be needed for all the activities, but this time

Install plant
5 5 days
Wed 06/06/01 Tue 12/06/01
Procure tooling
2 20 days
Thu 19/10/00 Wed 15/11/00
Training
5 5 days
Thu 19/10/00 Wed 25/10/00
Trials
4 11 days
Thu 18/01/01 Thu 01/02/01
Build up inventory
6 10 days
Fri 02/02/01 Thu 15/02/01
Install plant
3 5 days
Thu 11/01/01 Wed 17/01/01
Procure plant
1 60 days
Thu 19/10/00 Wed 10/01/00
170 Project management
we will look only at the plant operatives which are required on activitiesP.4, P.5 and P.6.
Activity 4.2.4
Complete for this project a matrix similar to Table 4.2.4 usingthese expected durations for each activity. Calculate the ES,EF, LS, LF and floats values.
The Gantt chart for the project is shown in Figure 4.2.11. This has beenprepared using the latest start times for activities P.2 and P.5 as bothhave a considerable degree of float available.
The resource information for the plant operatives is shown in Figure4.2.12. In here the details entered are:
� Max. units – express as 100% = 1 unit, i.e. 300% = 3 operatives.� Std rate – enter full cost rate (see pages xxx–xxx).� Ovt. rate – enter overtime full cost rate. Unfortunately only one rate
can be entered in Microsoft™ Project which will need considerationif several different rates are paid, e.g. different rates at differenttimes of the week.
Figure 4.2.10 Networkdiagram for production project
Table 4.2.11 Activities involved in plant installation
ActivityRef.
Activity Duration(weeks)
Precedeby
Resource used
P.1 Procure plant 12 – EngineersP.2 Procure tooling 4 P.1 EngineersP.3 Install plant 1 P.2 FittersP.4 Plant trials 2 P.3 3 plant operativesP.5 Operator training 1 – 3 plant operativesP.6 Build up inventory 4 P.4, P.5 3 plant operatives

ID Resourcename Initials Group Max. units Std rate Ovt. rate Cost/Use Accrue at Base calendar Code
1 Plant operatives PO Operatives 300% £10.00/hr £12.50/hr £0.00 Prorated Standard
IIEpreproduction
Page 1
Task
Split
Progress
Milestone
Summary
Rolled-up task
Rolled-up split
Rolled-up milestone
Rolled-up progress
External tasks
Project summary
ID Task name Duration Start Finish
1 Procure plant 60 days Thu 19/10/00 Wed 10/01/01
2 Procure tooling 20 days Thu 14/12/00 Wed 10/01/01
3 Install plant 5 days Thu 11/01/01 Wed 17/01/01
4 Trials 11 days Thu 18/01/01 Thu 01/02/01
5 Training 1.67 days Tue 16/01/01 Wed 18/01/01
6 Build up inventory 6.67 days Fri 02/02/01 Mon 12/02/01
7 Plant delivered 0 days Wed 10/01/01 Wed 10/01/01
8 Ready for production 0 days Thu 01/02/01 Thu 01/02/01
9 Inventory built up 0 days Mon 12/02/01 Mon 12/02/01
Plant operativ
Plant operatives [300%]
Plan
10/01
01/02
12/
16/10 23/10 30/10 06/11 13/11 20/11 27/11 04/12 11/12 18/12 25/12 01/01 08/01 15/01 22/01 29/01 05/02 12/02
November December January February
Page 1
Project: IIEpreproduction
Date: Fri 22/10/00
Project management 171
Figure 4.2.11 Gantt chart for production project
Figure 4.2.12 Resource information report

ID Resource name Work
Unassigned 0 hrs
Procure plant 0 hrs
Procure tooling 0 hrs
Install plant 0 hrs
Plant delivered 0 hrs
Ready for production 0 hrs
Inventory built up 0 hrs
Plant operatives 464 hrs
Trials 264 hrs
Training 40 hrs
Build up inventory 160 hrs
Details
Work
Work
Work
Work
Work
Work
Work
Work
Work
Work
Work
M T W T F S S
15 Jan '01
16h 24h 24h 24h
24h 24h
16h 24h
IIEpreproduction
Page 1
172 Project management
Figure 4.2.13 Resource usagecalendar
� Cost/use – this is accumulated during project running based onhours and associated rate that have been used.
� Accrued – indicating basis of adding up the cost as the resource isactually used during the project.
When we tie the resource used to the activities, we can see on a resourceusage calendar the total hours planned against each activity and thehours planned on any particular day (see Figure 4.2.13). We can also seeon the overall project calendar which activities are planned for any dayin any month (see Figure 4.2.14).
Changing the completion date
Having worked out a project’s completion date, we may find that thisdate is not acceptable.
To move the completion to a later date is easily achieved by simplydelaying the start of the project, or one of the activities along the criticalpath. But how do we proceed if we need an earlier completion date?
To shorten, or crash as it is often referred to, the overall duration ofa project we have to shorten some of the critical path activities withinthe project. There are various ways of doing this, for example:
� Changing the specification so that less is achieved, e.g. in thisproject reducing the weeks scheduled to build up the inventory andending up with a smaller inventory to support the product launch.
� Working extra hours on the project:– Using overtime, e.g. having the plant operatives working more
than 40 hours per week.
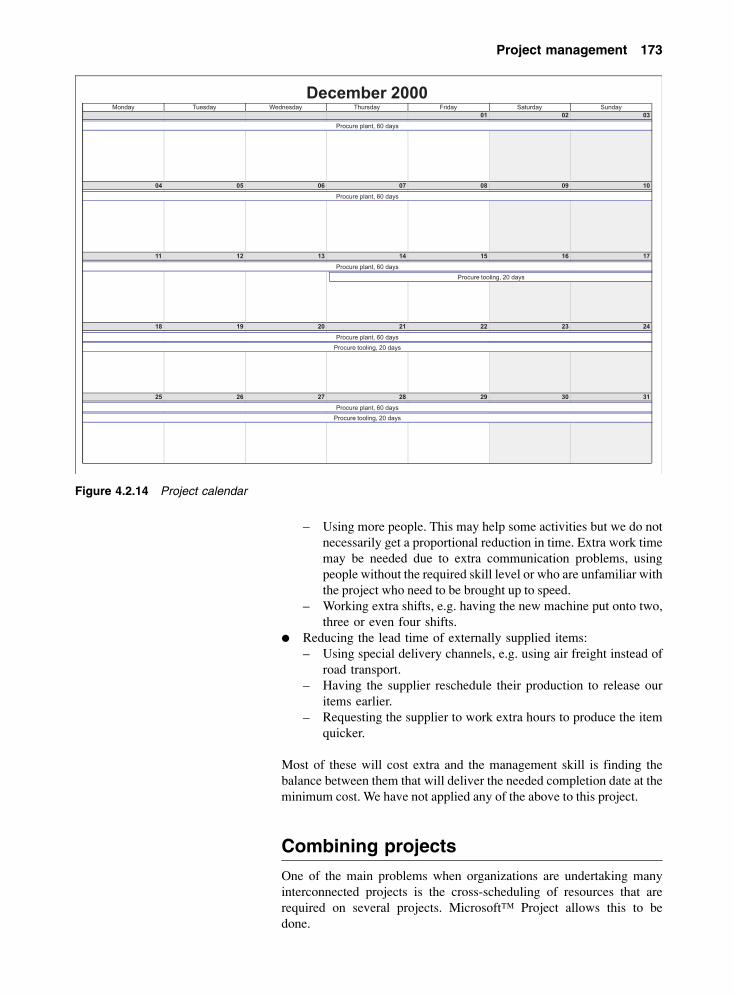
December 2000Monday Tuesday Wednesday Thursday Friday Saturday Sunday
01 02 03
04 05 06 07 08 09 10
11 12 13 14 15 16 17
18 19 20 21 22 23 24
25 26 27 28 29 30 31
Procure plant, 60 days
Procure plant, 60 days
Procure plant, 60 days
Procure tooling, 20 days
Procure plant, 60 days
Procure tooling, 20 days
Procure plant, 60 days
Procure tooling, 20 days
Project management 173
– Using more people. This may help some activities but we do notnecessarily get a proportional reduction in time. Extra work timemay be needed due to extra communication problems, usingpeople without the required skill level or who are unfamiliar withthe project who need to be brought up to speed.
– Working extra shifts, e.g. having the new machine put onto two,three or even four shifts.
� Reducing the lead time of externally supplied items:– Using special delivery channels, e.g. using air freight instead of
road transport.– Having the supplier reschedule their production to release our
items earlier.– Requesting the supplier to work extra hours to produce the item
quicker.
Most of these will cost extra and the management skill is finding thebalance between them that will deliver the needed completion date at theminimum cost. We have not applied any of the above to this project.
Combining projects
One of the main problems when organizations are undertaking manyinterconnected projects is the cross-scheduling of resources that arerequired on several projects. Microsoft™ Project allows this to bedone.
Figure 4.2.14 Project calendar

174 Project management
Figure 4.2.15 shows the Gantt chart for three projects combined, butwithout any links established between them. This shows that the newplant is scheduled to be producing before the site preparation activity forthe new factory will be started! If projects are connected we need the linksestablished to determine when the combined project will be complete.
Activity 4.2.5
Can you think of any key links between the projects?
There are a few possible links that could be made, some of which may bebased on using the same people resources at key times. If this happens wewould need to reschedule to level usage or increase resources.
The two links that we will use are:
� We cannot install the new plant (P.3) until the new building iscomplete (B.11).
� Procure tooling (P.2) relies on the final product design (D.7) beingdone.
By establishing these links on the Gantt we arrive at a revised Ganttchart as shown in Figure 4.2.16. This took out some excess float byusing the start delay function on the following activities within the newplant project to make use of the large amount of float they carried:
� Procure plant (P.1 and training (P.7) activities – start delay of 146days from start of combined project, i.e. 20.8 weeks (7 day week).
� Procure tooling (P.2) – start delay of 75 days from end of the expectedcompletion of final design activity (D.7), i.e. 10.7 weeks.
The design project has just been left in its original schedule which meansthere is a long float before the procure tooling needs to start. This gives acompletion time for the combined project as 37.5 weeks. If this date wasunsuitable, then we would need to adjust some of the activity durations onthe critical path. Unfortunately most software packages do not show aPERT view of a combined project – only of the milestones on it.
More on network diagrams
Network diagrams are made up using branches and nodes.There are different conventions for placing and identifyingactivities using these branches and nodes.
Activity on arrow (AOA)
This method puts the description of the activity along thebranch and the node represents an event as in Figure4.2.17(a). This convention requires the use of dummyactivities, e.g. activity D in Figure 4.2.17(a), as two activitiescannot use the same two nodes.

ID Task name Fixed Cost
1 Design £12,500.00
2 Site acquisition £75,000.00
3 Planning application £7,000.00
4 Site preparation £9,000.00
5 Order material £15,000.00
6 Install drainage £5,500.00
7 Erect structure £7,500.00
8 Clad structure £6,000.00
9 Install flooring £4,500.00
10 Install services £8,000.00
11 Finish interior £3,500.00
12 Site acquired £0.00
13 Planning permission received £0.00
14 Site ready £0.00
15 Building complete £0.00
16 Project1 £0.00
1 Market research £0.00
2 Concept design £0.00
3 Detailed design £0.00
4 Produce prototype £0.00
5 Engineering tests £0.00
6 Test market £0.00
7 Finalize design £0.00
8 MR report due £0.00
9 Initial design complete £0.00
10 Final design complete £0.00
17 IIEpreproduction £0.00
1 Procure plant £0.00
2 Procure tooling £0.00
3 Install plant £0.00
4 Trials £0.00
5 Training £0.00
6 Build up inventory £0.00
7 Plant delivered £0.00
8 Ready for production £0.00
9 Inventory built up £0.00
28/11
20/02
13/03
05/06
21/11
18/01
01/03
Plant operatives[300%]
Plant operatives[300%]
Plant operatives[300%]
10/01
01/02
12/02
16/10 30/10 13/11 27/11 11/12 25/12 08/01 22/01 05/02 19/02 05/03 19/03 02/04 16/04 30/04 14/05 28/05 11/06 25/06 09/07 23/07 06/08 20/08 03/09 17/09 01/10 15/10 29/10 12/11 26/11 10/12 24/12 07/01
November December January February March April May June July August September October November December January
Task
Split
Progress
Milestone
Summary
Rolled-up task
Rolled-up split
Rolled-up milestone
Rolled-up progress
External tasks
Project summary
Page 1
Project: IIEbuild
Date: Fri 22/10/00
Pro
ject man
agem
ent
175
Figure 4.2.15 Gantt chart for combined project – before linking

ID Task name LevelingDelay
1 Design 0 edays
2 Site acquisition 0 edays
3 Planningapplication 0 edays
4 Site preparation 0 edays
5 Order material 0 edays
6 Installdrainage 0 edays
7 Erect structure 0 edays
8 Clad structure 0 edays
9 Install flooring 0 edays
10 Install services 0 edays
11 Finish interior 0 edays
13 Site acquired 0 edays
14 Planningpermissionreceived 0 edays
15 Site ready 0 edays
16 Buildingcomplete 0 edays
17 IIEdesign 0 edays
1 Market research 0 edays
2 Concept design 0 edays
3 Detailed design 0 edays
4 Produce prototype 0 edays
5 Engineeringtests 0 edays
6 Test market 0 edays
7 Finalize design 0 edays
9 MR report due 0 edays
10 Initial design complete 0 edays
11 Final design complete 0 edays
18 IIEpreproduction 0 edays
1 Procureplant 146 edays
3 Procuretooling 75 edays
5 Installplant 0 edays
6 Trials 0 edays
7 Training 146 edays
8 Build up inventory 0 edays
9 Plantdelivered 0 edays
10 Ready for production 0 edays
11 Inventorybuilt up 0 edays
50 days
10 days
157.67days
97.67 days
82.67 days
22.67 days
91 days
9.17 days
71.67 days
30 days
0.33 days
22.67 days
6.67 days
16/10 30/10 13/11 27/11 11/12 25/12 08/01 22/01 05/02 19/02 05/03 19/03 02/04 16/04 30/04 14/05 28/05 11/06 25/06 09/07
November December January February March April May June July
Critical task
Critical split
Task
Split
Progress
Milestone
Slack
Slippage
Summary
Rolled-up critical task
Rolled-up critical split
Rolled-up task
Rolled-up split
Rolled-up milestone
Rolled-up progress
External tasks
Project summary
Page 1
Project: IIEbuild
Date: Fri 22/10/00
176P
roject m
anag
emen
t
Figure 4.2.16 Gantt chart for combined project – after linking

Project management 177
Activity on node (AON)
Here the activity information is placed at the node, and thebranches represent the logical connection between themodes (activities) as in Figure 4.2.17(b). Many people preferthe use of AON because:
� It does not require the use of dummy activities.� It is easier to follow the logic of dependencies.
AON has tended to become the norm in computer-basedpackages such as Microsoft™ Project, which uses a modified(i.e. reduced) AON format.
Some people find that the use of AON networks reducesthe need to complete the matrices we have been using as inTable 4.2.2.
Problems 4.2.1
(1) If activity B.6 started two weeks later than its ES time, howmuch extra time could it then use before it affected theoverall project time?
(2) What is the difference in completion time for the design projectbetween the optimistic times and the pessimistic times?
(3) Under what circumstances would you accept a project basedon the optimistic times?
(4) How difficult is it to estimate any time for a task you havedone only once before?
(5) Draw your own network diagram to show all the activities onthe critical path for the combined projects.
Figure 4.2.17 Two ways ofdrawing project networkdiagrams

178 Project management
4.3 Dealing withuncertainty
This section looks in detail at why so many projects are partial, orcomplete, failures. The main problem appears to be uncertainties andhow we cope with them. Eliyahu Goldratt’s Critical Chain methodologyis examined in detail as a possible solution.
As mentioned in Section 4.1, it is common for projects to end inpartial, or complete, failure, i.e. having one, or more, of the followingserious discrepancies:
� Taking longer than expected.� Costing more than budgeted for.� Failing to produce the full expected benefits.
This state of affairs has led participants to believe and even expect thatlarge projects cannot succeed fully, mainly because of the manyuncertainties involved in them. The American Production and InventoryControl Society has even postulated a set of ‘laws’ that reflect theseexpectations:
Laws of project management(1) No major project is ever installed on time, within budget and with
the same staff that started it.(2) Projects progress quickly until they are 90% complete, then they
remain at 90% complete forever.(3) One advantage of fuzzy project objectives is that they let you
avoid the embarrassment of estimating the corresponding costs.(4) When things are going well, something will go wrong:
� When things cannot get any worse, they will.� When things appear to be going better, you have overlooked
something.(5) If project content is allowed to change freely, the rate of change
will exceed the rate of progress.(6) No system is ever completely debugged. Attempts to debug a
system inevitably introduce new bugs that are even harder to find.(7) A carelessly planned project will take three times longer to
complete than expected, a carefully planned project will only taketwice as long.
(8) Project teams detest progress reporting because it vividly mani-fests their lack of progress.
It would appear that it is the uncertainties that lead to the disappointingoutcomes. However, as mentioned in Section 4.1, there are many factorsthat can contribute to the failure. If the following factors are present,then failure is almost certainly guaranteed:
� Unobtainable objectives, usually changing as the project movesalong.
� Lack of top management support.� Lack of resources or skills, especially in project management.� Poor selection of suppliers.� Political resistance and sabotage.
Yet even with projects that do not suffer from these – failures arecommon. Does that mean that where there are uncertainties, failure is anatural consequence, as shown in the abbreviated cause–effect diagramin Figure 4.3.1?

Project management 179
Eliyahu Goldratt, author of The Critical Chain, argues that althoughuncertainties can play a part – it is the way we manage theseuncertainties that is the major reason for the failures. Goldratt states weshould look at four points:
� How the estimate for the duration of an activity is derived.� How activities are linked at the scheduling stage.� How time is used before and during an activity.� How the project is actually managed.
Why times extend
Estimating an activity’s duration
You probably found it very difficult to answer a question on how longit would take you to build a house using your own labour, as there wasno laid down specification (Law 3 on page 178) and you probably havenever personally carried out all the tasks involved in such anundertaking. It is understandable that people find it difficult to estimatehow long it will take them to complete an operation when what isinvolved in it is unknown to some degree.
In Section 4.2 (page 163), we made reference to the three-time-estimate method, but even this is mainly speculative guesswork, whichmay be better than a single time – or it may not. How then is anestimated time really arrived at?
Even with tasks that are fairly repetitive, there are variations in thetime to complete them. This variation does not follow the normaldistribution, but instead follows a pattern as shown in Figure 4.3.2(a).This is because there are two patterns superimposed on each other:
� One pattern is the normal distribution where the variations arelimited and spread evenly around a mean, forming the bell-shapedcurve as seen in Figure 4.3.2(b).
� The other pattern is a negative exponential one as shown in Figure4.3.2(c). This distribution is made up of times which have a widevariance – often quite longer than the mean time under the normaldistribution. This is due to spasmodic events occurring – forexample, a crash will slow traffic flow which will then delay otherdrivers.
Figure 4.3.1 Cause–effectdiagram used to explain whyprojects often fail in meetingoriginal time span specificationand/or budget

180 Project management
When we are asked to consider the probability of catastrophic eventsoccurring, we tend to overestimate that probability because theseevents are easy to recall as having happened. Therefore we tend to notcommit ourselves to a simple normal mean time, but want to makeallowances for the possible happenings – even if it is highlyimprobable that they will.
In addition there is the natural tendency not to accept a target timewhen there is a 50% probability of it being exceeded. We would finda lower probability more acceptable – say only a 10% probability ofbeing exceeded as shown in Figure 4.3.2(a). We prefer to have a goodfactor of safety, especially if we are being judged on the result.
If this is so, then the overall project timescale should be made upfrom a series of activities most of which have a high degree of beingmet. This should then, in turn, give the overall completion time a highdegree of certainty in being met. Why then are so many projectslate?
Figure 4.3.2 Make up of timestaken to carry out an activity

Project management 181
Preparing the schedule
The project schedule is prepared as in Section 4.2. As everyone hasadded safety time to the individual activities, the project completiondate is extended – normally more than acceptable. It therefore must bereduced, but how?
Management knows about the tendency to add safety time toestimates of activity duration, therefore the first thing that happens isthat everyone is requested to accept a reduced time target. As theestimate is already padded, the request is accepted if not too severe.
The net result is that the completion date for the project is reducedwhich earns kudos for the project manager. However, the reductionprocess lays the ground for an excuse if an activity is late – after all therevised date was not the original estimate!
Note that if you are a manager who has put in a tight estimate, youwill find accepting a tighter target difficult. However, as other managersinvolved are likely to be accepting the new target, you will probablyhave to go along, or be seen as ‘not being a team player’. Havinglearned this lesson, you won’t make the same mistake again – especiallyif you fail to meet the revised target. The next time you will add a safetyallowance. The system punishes you otherwise.
Operating to the schedule
When an activity is being completed in your area, there are three contactpoints with the schedule:
� Incoming, i.e. when the previous activity is completed.� Operations, i.e. when the activity is being carried out.� Outgoing, i.e. when the work is passed onto the next department.
At each of these points, the way we manage things can increase theprobability of extending the time taken.
Incoming phase
There is uncertainty about when the previous activity will completeand the work will be passed on. This means that the department isprobably not ready to start on the activity when it arrives. The peopleconcerned will be working on other tasks and the incoming work willthen queue until they become available. If they did stop what theywere doing, they would lose time on that task and are thereforereluctant to do so.
A delay therefore enters the system, shortening the available time.
Operational phase
There will also be little urgency in starting the new activity as it isknown that less time is normally needed than allowed for. Note that theestimation of time at the planning stage tended to be pessimistic, nowthe opposite occurs and an optimistic view is taken – often over-optimistic by making little, or no, allowance for things to go wrong. Yet,if we go by ‘Law 3’ – things will go wrong.
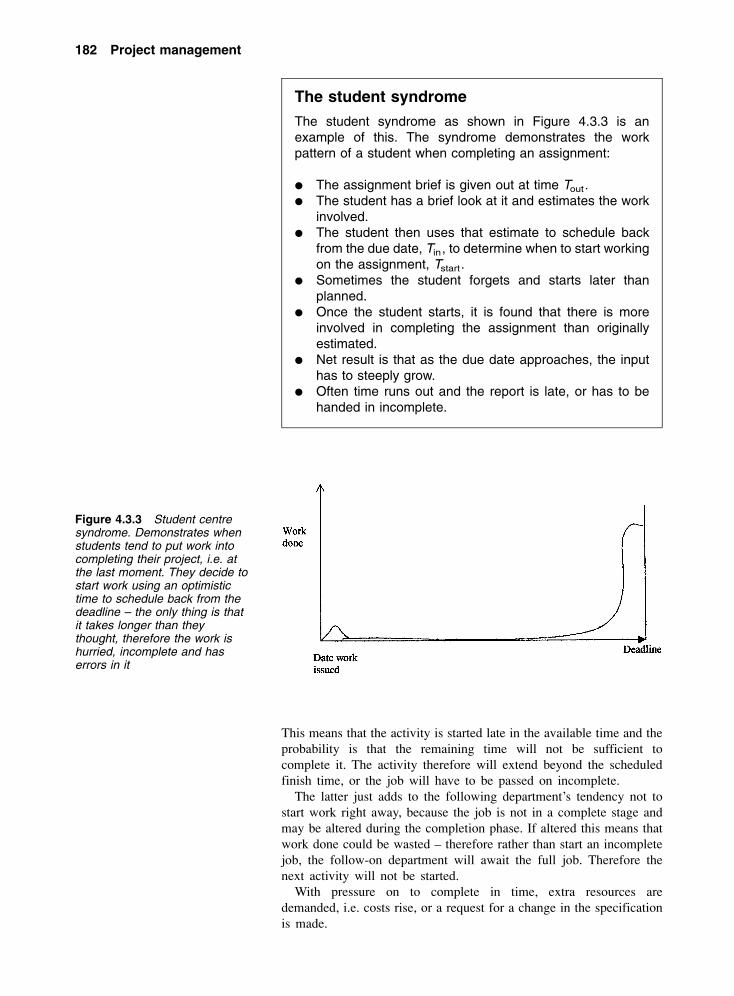
182 Project management
The student syndrome
The student syndrome as shown in Figure 4.3.3 is anexample of this. The syndrome demonstrates the workpattern of a student when completing an assignment:
� The assignment brief is given out at time Tout.� The student has a brief look at it and estimates the work
involved.� The student then uses that estimate to schedule back
from the due date, Tin, to determine when to start workingon the assignment, Tstart .
� Sometimes the student forgets and starts later thanplanned.
� Once the student starts, it is found that there is moreinvolved in completing the assignment than originallyestimated.
� Net result is that as the due date approaches, the inputhas to steeply grow.
� Often time runs out and the report is late, or has to behanded in incomplete.
This means that the activity is started late in the available time and theprobability is that the remaining time will not be sufficient tocomplete it. The activity therefore will extend beyond the scheduledfinish time, or the job will have to be passed on incomplete.
The latter just adds to the following department’s tendency not tostart work right away, because the job is not in a complete stage andmay be altered during the completion phase. If altered this means thatwork done could be wasted – therefore rather than start an incompletejob, the follow-on department will await the full job. Therefore thenext activity will not be started.
With pressure on to complete in time, extra resources aredemanded, i.e. costs rise, or a request for a change in the specificationis made.
Figure 4.3.3 Student centresyndrome. Demonstrates whenstudents tend to put work intocompleting their project, i.e. atthe last moment. They decide tostart work using an optimistictime to schedule back from thedeadline – the only thing is thatit takes longer than theythought, therefore the work ishurried, incomplete and haserrors in it

Project management 183
Outgoing phase
The above shows that there is a high probability that this happens late– but what happens if the work is completed before the due date? Is itpassed on? Two things conspire against an early pass-on:
� The next department is probably not ready to receive the work, andis reluctant to accept it early because this means a change in theirinternal schedule and probably a change to their scheduled finishdate.
� If the work is passed on early, you may think praise is due.However, the reward is usually a forced reduction in your nextestimate because ‘last time you over estimated’.
Therefore even when completed early, the job will not be passed on.Instead it will be retained and polished or embellished. Therefore anopportunity to save costs will be lost – in fact the extra input mayactually increase the costs which were budgeted for.
Activity 4.3.1
Try this little exercise to demonstrate the above effects.Prepare a list of random whole numbers between 1 and 10
to represent a series of activity durations along a critical path.What is the sum of these and the average value (rounded upto a whole number)? This gives the project scheduledcompletion time.
Now we will run the project using the following rule:
If a number in the list is less than the average reset it to theaverage value. Leave the other numbers as they are.
Now re-add up the list of numbers. How much of apercentage increase from the sum of the first list hasresulted? This is the degree of extensions common in projectcompletion times.
Net result
Any lateness in one, or more, activity is passed on throughout theproject and does not get offset by occasions when an activity iscompleted early as early happenings do not get passed on.
It is therefore no wonder that major projects often have problems inholding their completion date, budgets or specification – even when theestimates of activity durations are quite slack. These symptoms areespecially apparent in an organization with a blame culture where risksare normally avoided.
The problem has been analysed by applying Goldratt’s theory ofconstraints which resulted in the identification of the core problem asdepicted in Figure 4.3.4. Goldratt claims it is not the uncertainties inactivity times that cause projects to fail, but how that uncertainty ismanaged.

184 Project management
Goldratt’s core problem resolution
In Goldratt’s theory of constraints all the present system isexpressed in a linked cause–effect diagram (not shown). Thisis then analysed to identify the underlying core problems.
A core problem is defined as one where there are tworequirements towards a common objective but these rest ondifferent assumptions which appear to be in completeconflict. The result is expressed in a cloud diagram (as inFigure 4.3.5) and the intention is to inject a solution thatbreaks both assumptions and hence enables both require-ments and the common objective to be met.
The solution
Now that we have identified many of the reasons for projects failing –is there anything we can do as managers to overcome them?
Goldratt states that there is – how we handle the fact that there will bevariations in durations. This he recommends is looked at in two ways:
Figure 4.3.4 Goldratt’s coreproblem identification of whyprojects fail
Figure 4.3.5 Using Goldratt’s‘cloud diagram’ to express theassumptions behind the coreproblem where there appears tobe two mutually exclusiverequirements
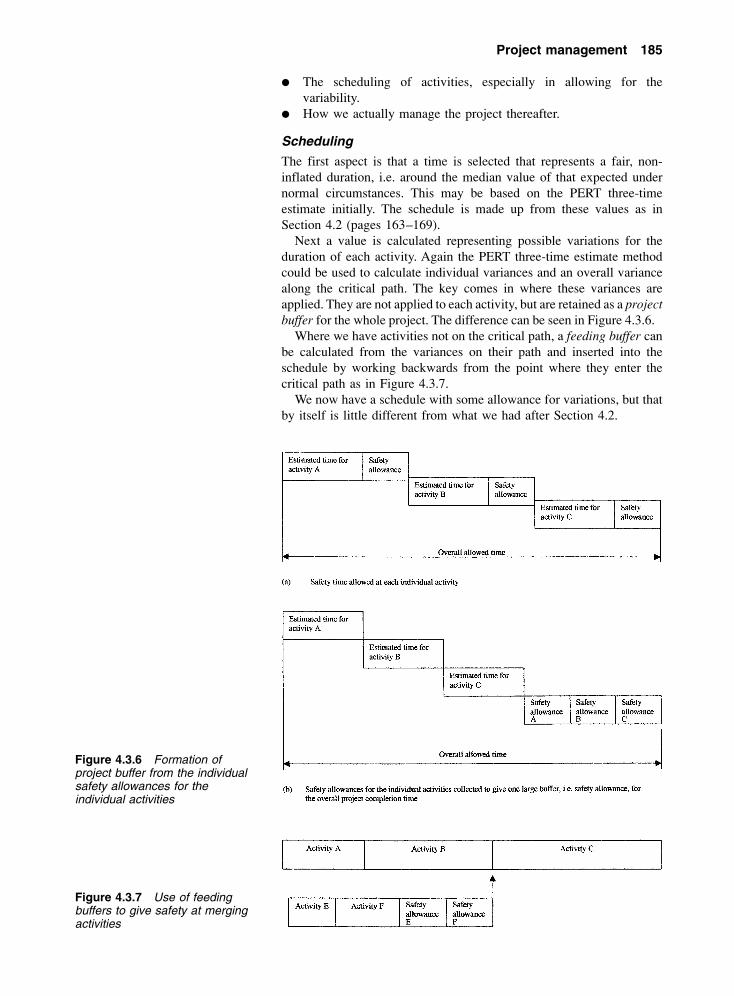
Project management 185
Figure 4.3.6 Formation ofproject buffer from the individualsafety allowances for theindividual activities
Figure 4.3.7 Use of feedingbuffers to give safety at mergingactivities
� The scheduling of activities, especially in allowing for thevariability.
� How we actually manage the project thereafter.
Scheduling
The first aspect is that a time is selected that represents a fair, non-inflated duration, i.e. around the median value of that expected undernormal circumstances. This may be based on the PERT three-timeestimate initially. The schedule is made up from these values as inSection 4.2 (pages 163–169).
Next a value is calculated representing possible variations for theduration of each activity. Again the PERT three-time estimate methodcould be used to calculate individual variances and an overall variancealong the critical path. The key comes in where these variances areapplied. They are not applied to each activity, but are retained as a projectbuffer for the whole project. The difference can be seen in Figure 4.3.6.
Where we have activities not on the critical path, a feeding buffer canbe calculated from the variances on their path and inserted into theschedule by working backwards from the point where they enter thecritical path as in Figure 4.3.7.
We now have a schedule with some allowance for variations, but thatby itself is little different from what we had after Section 4.2.
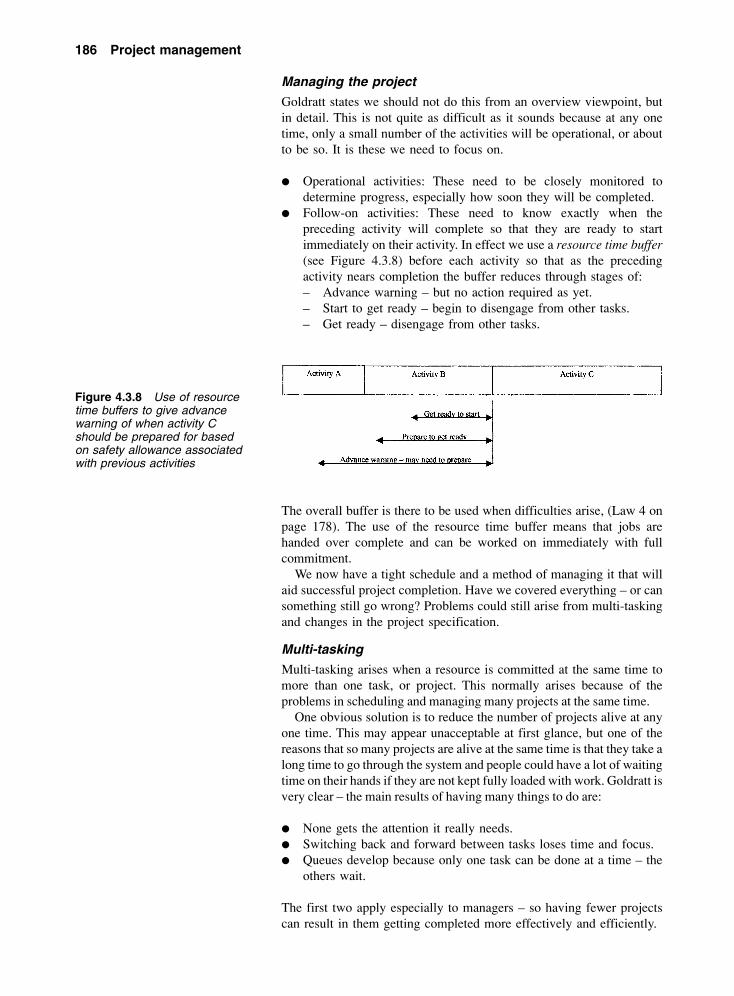
186 Project management
Managing the project
Goldratt states we should not do this from an overview viewpoint, butin detail. This is not quite as difficult as it sounds because at any onetime, only a small number of the activities will be operational, or aboutto be so. It is these we need to focus on.
� Operational activities: These need to be closely monitored todetermine progress, especially how soon they will be completed.
� Follow-on activities: These need to know exactly when thepreceding activity will complete so that they are ready to startimmediately on their activity. In effect we use a resource time buffer(see Figure 4.3.8) before each activity so that as the precedingactivity nears completion the buffer reduces through stages of:– Advance warning – but no action required as yet.– Start to get ready – begin to disengage from other tasks.– Get ready – disengage from other tasks.
The overall buffer is there to be used when difficulties arise, (Law 4 onpage 178). The use of the resource time buffer means that jobs arehanded over complete and can be worked on immediately with fullcommitment.
We now have a tight schedule and a method of managing it that willaid successful project completion. Have we covered everything – or cansomething still go wrong? Problems could still arise from multi-taskingand changes in the project specification.
Multi-tasking
Multi-tasking arises when a resource is committed at the same time tomore than one task, or project. This normally arises because of theproblems in scheduling and managing many projects at the same time.
One obvious solution is to reduce the number of projects alive at anyone time. This may appear unacceptable at first glance, but one of thereasons that so many projects are alive at the same time is that they take along time to go through the system and people could have a lot of waitingtime on their hands if they are not kept fully loaded with work. Goldratt isvery clear – the main results of having many things to do are:
� None gets the attention it really needs.� Switching back and forward between tasks loses time and focus.� Queues develop because only one task can be done at a time – the
others wait.
The first two apply especially to managers – so having fewer projectscan result in them getting completed more effectively and efficiently.
Figure 4.3.8 Use of resourcetime buffers to give advancewarning of when activity Cshould be prepared for basedon safety allowance associatedwith previous activities

ProChain Project Scheduling Options
3. Create Buffers 4. Insert Buffers Options
1. Level Load 2. ID Critical Chain
Search Depth
Simple Search
Maximum Search
ProChain Status
12/02/01
0
20
7
1
3
4
0
Overloaded
Resources
Tasks
CC Tasks
Project Buffers
Feeding Buffers
Resource Buffers
Strategic Buffers
OK CANCEL
Execute
Help
Current
date
Project management 187
The other solution is to automate scheduling when there are manyprojects. Software such as ProChain™, from Creative Technology Labs,has been developed that makes use of Goldratt’s methodology in usingbuffers (see screen in Figure 4.3.9) and this can identify clashes causedby different projects needing a resource at the same time. This softwareallows us to reschedule tasks to level demand on these resources andtheir interconnected activities across projects.
That leaves two problems – the alteration of the specification, andpersuading managers to transfer ownership of their safety time to theproject leader.
We know that the objective should be set before the project begins(see page 153), but even when the proper procedure is carried out therewill always be a few occasions when specifications must be changed.The main advantage in this aspect that Goldratt’s methodology gives isthat if projects are completed quickly – there will be less opportunity tochange the specification.
The problem of getting managers to let go of their safety factors ismore problematic and needs the development of trust over time. Thisdepends very much on the culture within the organization.
Goldratt’s methodology can ensure that projects are:
� Completed on time� Completed within budget� Completed to specification.
Figure 4.3.9 Screen shot of ProdChain(TM) screen
188 Project management
Problems 4.3.1
(1) How long would it take you to build a house using only yourown labour?
(2) Draw a rough histogram of the times taken for your journeysfrom your home to your place of work, or study. What patterndoes it show?
(3) Do you always start a task immediately it is given to you?(4) When do you start a task when there is a set date for
completion?(5) If you were a manager, would you be happy about accepting
an activity time without any safety factor built in?
4.4 Controllingprojects
Once the scheduling has been done, the project gets underway. Evenwhen the initial stages have been carefully carried out, the progressneeds to be monitored and reported on. Corrective action may need tobe taken if the uncertainties which were identified, along with those notforeseen, cause major disruptions beyond the contingency plans andbuffers built in. Finally a review needs to be carried out to determinefuture plans and ensure that lessons learnt are retained.
Having set up the project schedule, it then requires careful managementto turn the plan into reality, some of which we have dealt with in Section4.3. There are two main aspects involved in managing projects:
� Introducing changes to the project aims and schedules.� Managing the project to meet aims.
Managing change to project aims
If we have carried out well the initial stages of initiation and feasibilitystudy, we should have an achievable project with aims that fit into theoverall business plan for the organization. The detailed planning andscheduling that follows details the steps towards attaining the desiredaims within the laid down constraints.
However, although it is an ideal that we should not change the aimsof an ongoing project, on a few occasions this does become necessary.These exceptional occasions must be initiated and authorized by topmanagement to match changes in the business plan. These should bemainly due to changes in the marketplace or the organization’scircumstances, but may arise from the project itself as it progresses – orfails to.
There will always be occasions when the assumptions on which theproject was authorized are found to be wrong, perhaps because ofmisjudgement or a mistake made. The important thing here is not todiscover who to blame, but as quickly as possible reassess the situationand determine what needs to be done.
If a project is continually changing then perhaps the initial stageshave been rushed, or incorrectly carried out. In this case, we need to stopand reassess the true situation. This may be difficult to do politically.
Alternatively it may be that the organization is going through a periodof extreme turbulence. It may be better in the latter circumstance to
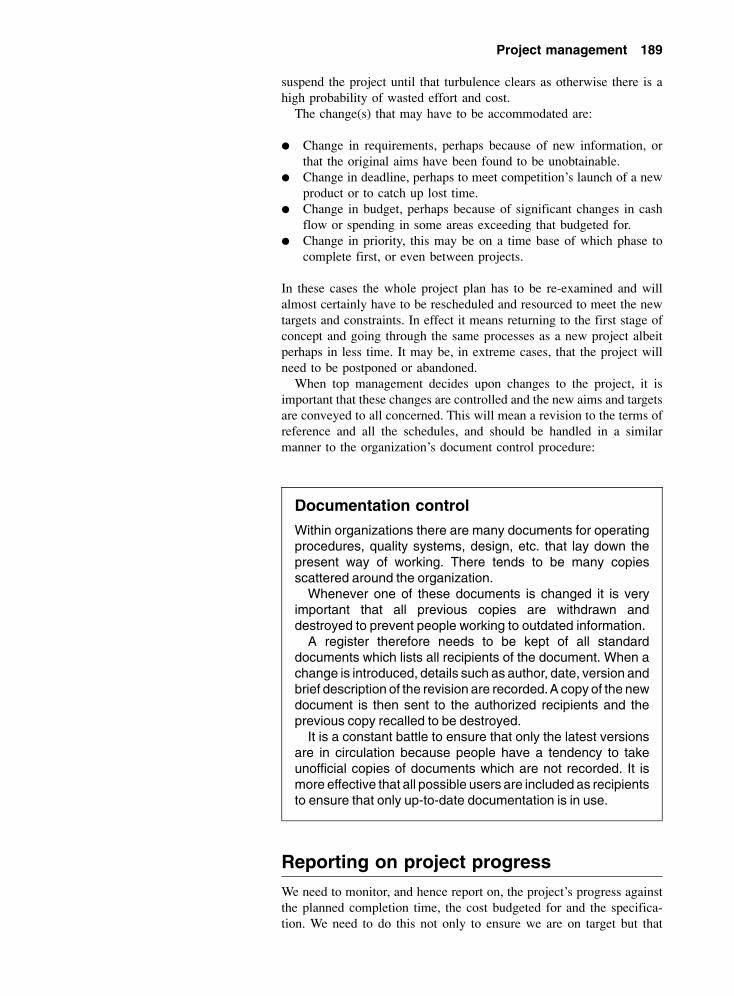
Project management 189
suspend the project until that turbulence clears as otherwise there is ahigh probability of wasted effort and cost.
The change(s) that may have to be accommodated are:
� Change in requirements, perhaps because of new information, orthat the original aims have been found to be unobtainable.
� Change in deadline, perhaps to meet competition’s launch of a newproduct or to catch up lost time.
� Change in budget, perhaps because of significant changes in cashflow or spending in some areas exceeding that budgeted for.
� Change in priority, this may be on a time base of which phase tocomplete first, or even between projects.
In these cases the whole project plan has to be re-examined and willalmost certainly have to be rescheduled and resourced to meet the newtargets and constraints. In effect it means returning to the first stage ofconcept and going through the same processes as a new project albeitperhaps in less time. It may be, in extreme cases, that the project willneed to be postponed or abandoned.
When top management decides upon changes to the project, it isimportant that these changes are controlled and the new aims and targetsare conveyed to all concerned. This will mean a revision to the terms ofreference and all the schedules, and should be handled in a similarmanner to the organization’s document control procedure:
Documentation control
Within organizations there are many documents for operatingprocedures, quality systems, design, etc. that lay down thepresent way of working. There tends to be many copiesscattered around the organization.
Whenever one of these documents is changed it is veryimportant that all previous copies are withdrawn anddestroyed to prevent people working to outdated information.
A register therefore needs to be kept of all standarddocuments which lists all recipients of the document. When achange is introduced, details such as author, date, version andbrief description of the revision are recorded. A copy of the newdocument is then sent to the authorized recipients and theprevious copy recalled to be destroyed.
It is a constant battle to ensure that only the latest versionsare in circulation because people have a tendency to takeunofficial copies of documents which are not recorded. It ismore effective that all possible users are included as recipientsto ensure that only up-to-date documentation is in use.
Reporting on project progress
We need to monitor, and hence report on, the project’s progress againstthe planned completion time, the cost budgeted for and the specifica-tion. We need to do this not only to ensure we are on target but that

190 Project management
resources are available to maintain the momentum as we move towardscompletion.
To do this, we need to continually update the following for eachongoing activity:
� Has the specification been, or does it need to be, changed?� What overall time has elapsed so far?� How much time is required to complete the activity and the
project?� What portion of each activity has been completed and what remains
to be completed?� Any future problems apparent?� What cost has been incurred so far?� How much cost is required to complete the activity and the project?� Has the overall cost of the project already changed or is it now
anticipated to change?
Most project management software incorporates reports and some allowcustomized reports to be designed. For example, Microsoft™ Project hasthe following in-built reports, only two of which are illustrated herein:
Overview reports� Project summary (see Figure 4.4.1): Shows overall start/finish
information and variances of the overall project such as dates,duration, work, cost and activity status.
� Top level tasks: Shows all main activities, i.e. no sub-activities, andplanned start/finish times and percentage complete.
� Critical tasks: As for top level task report plus preceding and follow-on activities.
� Milestones: Similar to top level task report, but for milestones only.� Working days: Shows normal weekly pattern of available hours.
Current activities reports� Unstarted tasks: Shows all activities which have not started.� Tasks starting soon: Shows activities due to start between user-set
dates.� Tasks in progress: Shows all activities which have started, but not
finished yet.� Completed tasks: Shows all activities which have finished.� Should have started tasks: Shows all activities which have not
started, but that should have.� Slipping tasks: Shows all activities which have not finished, but that
should have.
Cost� Cash flow: Shows total budget broken down into a weekly basis of
the activity budget costs.� Budget: Shows against each activity the budget cost, that spent and
the amount still to spend (of the budget).� Overbudget tasks: Shows how much should have been spent
according to percentage of each activity completed against whatwas actually spent.
� Overbudget resources: Similar to overbudget task report, but basedon actual cost of the resource as it is being used.

Project management 191
� Earned value: Compares activity costs for variance on thefollowing:– Budget cost by time of each activity.– Budget cost by percentage completed of each activity.– Actual cost of work done on each activity.– Estimated cost to complete each not finished activity.
Assignments reports� Who does what: Shows by resource the number of hours budgeted
against each activity.� Who does what when: Shows on a calendar of the project the
weekly resource budgeted for against each activity.� To do list (see Figure 4.4.2): Produces a week-by-week list of any
activities scheduled and the resource to be used.� Overallocated resources: Shows any resource where the time for
scheduled activities exceeds that available.
Workload� Task usage: Shows on a week-by-week basis the scheduled
activities planned and the resources required.� Resource usage: Shows on a week-by-week basis each resources’
scheduled activities planned.
Figure 4.4.1 Project summaryreport
IIEbuildUniversity of Brighton
as of Sun 22/10/00
Dates
Start: Wed 18/10/00 Finish: Fri 06/07/01Baseline start: Wed 18/10/00 Baseline finish Tue 05/06/01Actual start: NA Actual finish NAStart variance: 0 days Finish variance: 22.67 days
Duration
Scheduled: 187.67 days Remaining: 187.67 daysBaseline: 165 days Actual: 0 daysVariance: 22.67 days Percent complete: 0%
Work
Scheduled: 544 hrs Remaining: 544 hrsBaseline: 0 hrs Actual: 0 hrsVariance: 544 hrs Per cent complete: 0%
Costs
Scheduled: £158 940.00 Remaining: £158 940.00Baseline: £0.00 Actual: £0.00Variance: £158 940.00
Task status Resource status
Tasks not yet started: 17 Resources: 0Tasks in progress: 0 Overallocated resources: 0Tasks completed 0Total tasks: 17 Total resources: 0

Task
Split
Progress
Milestone
Summary
Rolled-up task
Rolled-up split
Rolled-up milestone
Rolled-up progress
External tasks
Project summary
ID ID Task name
1 1 Design
2 2 Site acquisition
3 3 Planning application
4 4 Site preparation
5 5 Order material
6 6 Install drainage
7 7 Erect structure
8 8 Clad structure
9 9 Install flooring
10 10 Install services
11 11 Finish interior
12 12 Site acquired
13 13 Planning permission received
14 14 Site ready
15 15 Building complete
28/11
20/02
13/03
05/06
Oct Nov Dec Jan Feb Mar Apr May Jun
October November December January February March April May June
Page 1
1 Project:IIEbuild
Date: Fri 09/12/00
192 Project management
Custom reports� These can be designed by the user, but this requires skill to know
where to pick up information from, etc.
In addition the Gantt chart can be used to visually demonstrate projectprogress on an activity level (see Figure 4.4.3). On the chart for the buildproject, the current date is the dotted vertical line at the start of December.
Figure 4.4.2 To do list forresources
Figure 4.4.3 Progress Ganttchart for design project
To Do List as of Thu 02/11/00IIEpreproduction
ID � Task name Duration Start Finish Predecessors Resource names
Week of 04 June7 � Training 5 days Wed 06/06/01 Tue 12/06/01 Plant operatives [300%]
Week of 11 June7 � Training 5 days Wed 06/06/01 Tue 12/06/01 Plant operatives [300%]6 � Trials 11 days Wed 13/06/01 Wed 27/06/01 5,3,7 Plant operatives [300%]
Week of 18 June6 � Trials 11 days Wed 13/06/01 Wed 27/06/01 5,3,7 Plant operatives [300%]
Week of 25 June6 � Trials 11 days Wed 13/06/01 Wed 27/06/01 5,3,7 Plant operatives [300%]8 � Build up inventory 6.67 days Thu 28/06/01 Fri 06/07/01 6 Plant operatives [300%]
Week of 02 July8 � Build up inventory 6.67 days Thu 28/06/01 Fri 06/07/01 6 Plant operatives [300%]

Project management 193
The planned activity duration is shown by a clear box and the actualcompletion by a horizontal line within the box. In this case, activities arebehind schedule – the design activity is only 50% complete and the siteacquisition activity is only 20% complete. The planning application andorder material activities cannot start as they are tied to the others.
This report enables the managers of the activities to adjust ongoinginput, including perhaps some rescheduling. For example:
� The site acquisition activity is critical for the follow-on planningpermission activity and this needs checking to see why the finishdate has slipped.
� If there is a chance of the finish date being delayed then the startdates of all other activities may have to be changed, or specialchanges will need to be made to some activities to catch up on theslippage to ensure that the overall completion date is held.
� As the design activity is behind schedule, it may be possible toswitch staff to help some other activity, perhaps on a differentproject, within that section.
Some software packages have built-in graphic assistance to visuallypresent progress information, but often the project manager designs hisown. These can be on an activity level or for the project as a whole.
One main variance analysis is the earned value analysis. A chart ofthis using the data in Table 4.4.1 is shown in Figure 4.4.4:
From the table, we can see four variances:
� Time variance: One week, i.e. the value for that portion of theproject completed by week ten, is that which should have beencompleted by week nine in the original cost estimate, i.e.£90 000.
� Schedule variance (SV) of £10 000 being the difference betweenwhat was budgeted to have been completed by week ten and whatwas actually completed, i.e. SV = BCWS – BCWC.
� Cost variance of £15 000 over what should have been spent by weekten, i.e. CV = BCWS – ACWC.
Table 4.4.1 Cost data for earned value chart
Weeknumber
Budget cost workscheduled (£)
Actual cost workcompleted (£)
Budgeted cost workcompleted (£)
BCWP ACWC BCWC1 0 0 02 5 000 2 500 4 0003 15 000 12 500 12 0004 25 000 25 000 20 0005 40 000 45 000 30 0006 55 000 60 000 45 0007 65 000 70 000 55 0008 75 000 80 000 60 0009 90 000 100 000 80 000
10 100 000 115 000 90 000

194 Project management
� Total variance of £25 000 over the budgeted cost of what hasactually been completed, i.e. TV = BCWC – ACWC.
These should all be analysed as to why they have occurred (see Chapter5) and action taken to redress the variance, if possible. If the variance isnot recoverable, the overall schedule and budget will need reforming toshow new attainable targets. These must be communicated to seniormanagement and other interested parties for agreement.
Progress meetings need to be held regularly with those involved inongoing activities and advise those who are next to work on the project.These need not all be formal meetings, in fact most information shouldcontinually be gathered whilst visiting sections.
Taking action
� Assess the situation:– Note the effect on cost and time of present activity.– Work out what, if any, correction can be made to remainder of
activity.– Find out the reason for the occurrence – not to pin the blame
onto people, but to prevent recurrence.� Impact analysis is required where the recovery cannot be achieved
within the ongoing activity. This requires wide consultation with allconcerned to reschedule if necessary the remainder of the project.
� Often the project manager will have to resolve issues betweensections. This needs creativity in contingency usage, makingavailable more resources, changing dates, or reducing scope.
� The main causes which normally need to be addressed areestimating skills, training, recruitment, and motivation, althoughoften the problems are based in the organization’s culture.
Figure 4.4.4 Earned valuechart

Project management 195
Completion
Almost as important as the initiation phases, the completion phases laythe ground for successful operation thereafter.
The final stage is the final commissioning of the new process, thenthe formal handover and acceptance of the same. This must be formallyrecorded to denote the full operational extent, and any problemsremaining, of the new process.
Once the project has been handed over, then a careful review andmeasure of the project success can be made. This is not just to decide ifall aims have been achieved but to:
� Determine further needs to bring the new process up to fulloperational requirements and to maintain it there.
� Identify lessons learnt from the project operation for future projects.
Although the project team will play a major part in the post-projectreview, it is best if this is conducted by a different person than theproject manager.
Problems 4.4.1
(1) Find out what you can about any major project that failed anddetermine the root causes.
(2) Why is it difficult to change a project that has already beenagreed?
(3) Can you think of several projects you have been involvedwith where the same mistake has been made?
(4) Why do you think many organizations fail to carry out aproper project audit?
(5) What problems could arise when the project review is carriedout by someone other than the project manager?

5 Money in theorganization
Summary
There is a song titled ‘Money makes the world go round’ and that is certainly true fororganizations. Money is what enables organizations to survive now and into the future. As anengineer you will need to know how your organization structures its internal finances and use thisin making decisions.
There is little real mystery surrounding financial aspects which you cannot grasp, if youunderstand the language used in the financial function. This chapter sets out to explain this keyaspect of business.
Objectives
By the end of this chapter, the reader should:
� be able to carry out investment appraisal using the techniques of payback, rate of return anddiscounted cash flow whilst considering non-financial aspects (Section 5.1);
� understand how costs arise and vary, and be able to cost out the material, labour andoverhead aspects of product costing including applying a depreciation allowance (Section5.2);
� be able to produce a cash flow statement, a profit and loss statement and the balance sheetand appreciate how book-keeping is carried out (Section 5.3);
� be able to prepare and interpret budgets and carry out variance analysis including applyingfinancial ratios (Section 5.4).
5.1 Investmentappraisal
Any investment made by a business has one aim – to earn more than itcosts in as short a time as possible. This is irrespective of the type ofinvestment. Designing a new product, purchasing a new machine,employing another person or launching an advertising campaign shouldall be subjected to the same criteria.

Money in the organization 197
We will cover investment appraisal as the first aspect of money inbusiness. The questions to be asked include:
� How much will it cost?� What are the benefits involved?� How soon will we recover our spending?� How much will we make in total?� How risky is it?
Investment appraisal sets out to answer these and other questions.
Costs and benefits
As in any decision making, investment appraisal should be based onfacts. Some of these will be hard facts, i.e. not in dispute, and some willbe less certain. They all need to be identified, with any degree ofuncertainty attached to them.
Costs are simply money spent and benefits are what is gained. Costsare normally tangible and usually can be measured in money. Benefitsare sometimes less tangible, but should whenever possible also beexpressed in money terms.
In a business, costs and benefits are classified as either capital orrevenue.
� Capital items are those which are used within a business over aperiod longer than one year, i.e. the assets. They can be costs – suchas purchasing and installation of new machinery, or developmentcosts of a new product. They can also be benefits – such as the saleof plant or buildings.
� Revenue items are the normal day-to-day money flowing in and outof the business.
A complete checklist of possible costs and benefits is worth compilingwhen making an appraisal. There are several particular aspects whichare worthwhile considering here and now.
Indirect costs
Many projects make use of functions such as design and developmentsections, production engineering and facility management. They arenormally treated by accountants as overhead departments. If any suchfunctions are used in a project, their actual costs should be included.
Overheads
The normal accountancy practice is to apportion onto direct costs anextra cost to cover overheads such as rent, rates, general lighting andheating, supervision, administration and sales which cannot be directlyattributed to any product or process. When carrying out investmentappraisal, only where a real change will occur in any of these itemsshould the value of that change be included.

198 Money in the organization
Financing costs
Almost all investment will involve an initial amount of money to bespent. As discussed in Chapter 1, this money may come from:
� Borrowing from a bank or investment house – costs involved aresetting up the loan and repaying the capital and interest.
� Money already in the business – costs involved are the return oninvestment that could be made elsewhere in the business. At theleast the money could be invested in an interest earning bankaccount.
� Extra issue of shares (borrowing from shareholders). Costs here arethose involved in the share issue, and the future dividend expectedby the investors. In addition there may be discounts or premiumsinvolved in the share price which may have to be taken intoaccount.
No matter which method is used, the cost of financing the project shouldbe used to compare the possible returns.
Grants and subsidies
There are many grants and subsidies available for projects. These can befrom EC, national or local sources. Some will be offset against capitalpurchases and others against revenue items such as recruitment andtraining.
Depreciation
This is covered in detail in Section 5.2 (page 223). It is sufficient nowto say that when using the payback and average rates of returnsmethods, depreciation is not used as full repayment of the initialinvestment is made. In the discounted cash flow methods, however,depreciation charges are considered as they are an identifiable revenuecost affecting tax payable.
Investment appraisal techniques
All appraisals start with the preparation of a cash flow statement whichlists all the incomings and outgoing money and when they occur. Figure5.1.1 shows a detailed cash flow for the replacement of a machineshowing the full range of actual spending incurred.
Figures 5.1.2 and 5.1.3 show simplified cash flows for thedevelopment of two new products – A and B. We shall use these simplerexamples to compare the various techniques for a company which canonly afford to invest £150 000 at this point in time.
Payback period
This is the simplest and most commonly used technique. It basicallycalculates how long it takes to recover the initial investment. Taking thevalues in Figure 5.1.1, they come down to:

Money in the organization 199
DEVELOPMENT COSTS £150 000
EXTRA REVENUES
Year 1 £25 000Year 2 £50 000Year 3 £100 000Year 4 £90 000Year 5 £30 000
OUTGOINGS
DESCRIPTION VALUE TIMING
MACHINE SELECTION (Week number)Visits to exhibitions £900 1–4Early consideration of possible machines £250 5Visits to suppliers £1200 6–8Desk evaluation of possible machines £250 9Tests on products £1500 10–12Evaluation of possible machines £500 13–14Contract awarded £350 18Machine purchase (total £85000)
with order £17000 18on delivery £59500 26
after one year £8500 78Transportation £3500 26First year’s spares £4250 26
Subtotal £97700
MACHINE INSTALLATIONSite clearance £1250 22Rerouting of power supplies £450 24Foundations £1500 24Installation £2500 26–28Proving trials £3500 29–32Removal of old machine £500 33Remaking good floor £500 34
Subtotal £10200
OTHER COSTSOperator training £600 28Maintenance training £350 28Extra insurance – first year £500 26
Subtotal £1450
TOTAL £109350
INCOMINGS AND SAVINGS
REDUCTION IN ANNUAL COSTSPower £2500Reduced scrap £12500Reduced direct labour £15000Maintenance £3500
Subtotal £33500 Ongoing from week 32
SALES OF ASSETSSale of old machine £3500 34
Figure 5.1.1 Cash flowstatement for replacement of amachine
Figure 5.1.2 Cash flow forproduct A
Figure 5.1.3 Cash flow forproduct B
DEVELOPMENT COSTS £150 000
EXTRA REVENUES
Year 1 £70 000Year 2 £80 000Year 3 £40 000Year 4 £20 000Year 5 nil

200 Money in the organization
InvestmentTotal outgoing = £109 350
Less sale of old machine = £3500
Net investment = £105 850
Savings = £33 500
Payback period =net investment
savings
=£105 850
£33 500
= 3.16 years
This means that the investment will be paid back in three years and twomonths after the money starts to come in.
Activity 5.1.1
What is the payback period for the new product develop-ments shown in Figures 5.1.2 and 5.1.3?
(Product A = 2.75 years, product B = 2 years)
This method is often used as a hurdle with organizations, withmanagement setting a minimum payback period – depending on theeconomic circumstances. In hard times, projects with more than a oneyear payback period could be rejected in many organizations.
Although this method is simple, it does suffer from severaldrawbacks:
� It ignores investment after the payback period.� It ignores the time value of money.
Annual rate of return
As can be seen in the payback examples, there can still be considerablebenefits continuing after the payback period has been reached. Toovercome the first of the drawbacks in the payback method, we havevarious methods. One way of comparing the total income over aproject’s life against the investment is to calculate an annual rate ofreturn. There are two ways to do this.
Average gross annual rate of return (AGARR)
The easiest way to demonstrate this is by working through the data forproduct A from Figure 5.1.2:
Initial investment = £150 000
Total income over the product’s life = £295 000
Life of product = 5 years

Money in the organization 201
Average annual income =£295 000
5 years
= £59 000
Therefore, AGARR =£59 000 × 100
£150 000
= 39.3%
Activity 5.1.2
Carry out an AGARR calculation on product B in Figure5.1.3.
(35% over the four years only)
As can be seen the two products have different AGARR figures. ProductA has a higher overall return, gives a higher AGARR, and is maintainedfor five years rather than the four years for product B.
It should be noted that product B has a higher initial recovery ratethan product A. As we can surmise, high early returns are probablybetter than later returns, as later income can be reduced by unforeseenevents, e.g. high inflation, new competition, drying up of supplies, etc.If we calculate a factor to take into account the time value of money,then the comparison between the investments may show up in differentpreferences. We will look at this after considering the other method ofcalculating annual rate of return:
Activity 5.1.3
What would be the difference in AGARR if we consideredproduct B over the same five years as product A. Should weuse the same time period?
(AGARR over five years is 28%)
As you can see the time period being considered makes a significantdifference. The AGARR for product B now shows an even lower figurethan that for product A as there is no income in the fifth year. Thedecision of what time to consider when comparing the two projectswould depend on what happens at the end of product B’s life.
Average net annual rate of return (ANARR)
This method is similar to the AGARR method but with several keydifferences in calculating income and considering the investment. Again

202 Money in the organization
we will use the data for product A (from Figure 5.1.2) to show theprocess involved:
Total income over the product’s life = £295 000 (as before)
Initial investment = £150 000 (as before)
Net proceeds = £295 000 – £150 000
= £145 000
Life of product = 5 years (as before)
Average annual net proceeds =net proceeds
product life
=£145 000
5 years
= £29 000
End value of investment = zero (no plant or equipment for resale)
Average Investment =(initial investment – end value)
2
=(£150 000–0)
2
= £75 000
Therefore ANARR =average annual net proceeds × 100
average investment
=£29 000 × 100
£75 000
= 38.7%
The reason for taking an average for the investment is that the initialinvestment is being recovered, or paid back, by equal amounts eachyear. Therefore at the end of the product life the initial investment isfully paid back using this procedure.
Note that the ANARR is only slightly different than the AGARRvalue of 39.3% we calculated above in this example.
Activity 5.1.4
Now calculate the ANARR for product B in Figure 5.1.3 forboth four and five years.
(20% over four years; 16% over five years)
For product B, these ANARRs are significantly different from itsAGARRs of 35% and 28% respectively. In this case, product A has a

Money in the organization 203
much better ANARR value of 38.7%. The ANARR method is a moresevere method, especially when the net proceeds are small in relation tothe initial investment.
However, both ANARR and AGARR ignore the time value ofmoney.
Discounted cash flow (DCF) methods
When considering the value now of money earned or spent in the future,we can apply commonsense to see it will not be the same as the facevalue. What would you rather have – £1000 today, or £1000 nextyear?
How much extra would you wish to be paid one year from now inplace of the £1000 today?
£1010, £1050, £1100, or more?
Obviously your answer would depend on a few factors such as howmuch you needed the £1000 today, how risky would it be to wait theyear before payment, etc.
Businesses have the same problem – how much are future earningsworth today? The method they use to calculate the value of futureearnings is called discounting. The discounting calculation is the inverseof the compounding calculation used for calculating the interest earned,or paid, on bank accounts, loans and mortgages.
Maths in action
Compound interest
If we deposited a sum of £1000 in a bank account that paid10% per annum interest each year and left it there for anumber of years, we would expect it to grow:
Deposit in year 0 = £1000 (year 0 is taken to mean timenow)
Balance at end of year 1 = £1000 + (10% of £1000) = £1100
Balance at end of year 2 = £1100 + (10% of £1100) = £1210
Balance at end of year 3 = £1210 + (10% of £1210) = £1331
Balance at end of year 4 = £1331 + (10% of £1331) = £1464.10
If we express compounding as:
Balance after one year = old balance ×(100 + % interest rate)
100
Then discounting is the inverse of compounding:
Value now =value one year from now × 100
(100 + % discount rate)

Table 5.1.1. Table of discount factors
Discount factor
Years 1% 2% 3% 4% 5% 6% 7% 8% 9% 10% 11% 12% 13% 14% 15% 16% 17% 18% 19% 20% 21% 22% 23% 24% 25%
0 1 1 1 1 1 1 1 1 1 1 1 1 1 1 1 1 1 1 1 1 1 1 1 1 1
1 0.9901 0.9804 0.9709 0.9615 0.9524 0.9434 0.9346 0.9259 0.9174 0.9091 0.9009 0.8929 0.8850 0.8772 0.8696 0.8621 0.8547 0.8475 0.8403 0.8333 0.8264 0.8197 0.8130 0.8065 0.8000
2 0.9803 0.9612 0.9426 0.9246 0.9070 0.8900 0.8734 0.8573 0.8417 0.8264 0.8116 0.7972 0.7831 0.7695 0.7561 0.7432 0.7305 0.7182 0.7062 0.6944 0.6830 0.6719 0.6610 0.6504 0.6400
3 0.9706 0.9423 0.9151 0.8890 0.8638 0.8396 0.8163 0.7938 0.7722 0.7513 0.7312 0.7118 0.6931 0.6750 0.6575 0.6407 0.6244 0.6086 0.5934 0.5787 0.5645 0.5507 0.5374 0.5245 0.5120
4 0.9610 0.9238 0.8885 0.8548 0.8227 0.7921 0.7629 0.7350 0.7084 0.6830 0.6587 0.6355 0.6133 0.5921 0.5718 0.5523 0.5337 0.5158 0.4987 0.4823 0.4665 0.4514 0.4369 0.4230 0.4096
5 0.9515 0.9057 0.8626 0.8219 0.7835 0.7473 0.7130 0.6806 0.6499 0.6209 0.5935 0.5674 0.5428 0.5194 0.4972 0.4761 0.4561 0.4371 0.4190 0.4019 0.3855 0.3700 0.3552 0.3411 0.3277
6 0.9420 0.8880 0.8375 0.7903 0.7462 0.7050 0.6663 0.6302 0.5963 0.5645 0.5346 0.5066 0.4803 0.4556 0.4323 0.4104 0.3898 0.3704 0.3521 0.3349 0.3186 0.3033 0.2888 0.2751 0.2621
7 0.9327 0.8706 0.8131 0.7599 0.7107 0.6651 0.6227 0.5835 0.5470 0.5132 0.4817 0.4523 0.4251 0.3996 0.3759 0.3538 0.3332 0.3139 0.2959 0.2791 0.2633 0.2486 0.2348 0.2218 0.2097
8 0.9235 0.8535 0.7894 0.7307 0.6768 0.6274 0.5820 0.5403 0.5019 0.4665 0.4339 0.4039 0.3762 0.3506 0.3269 0.3050 0.2848 0.2660 0.2487 0.2326 0.2176 0.2038 0.1909 0.1789 0.1678
9 0.9143 0.8368 0.7664 0.7026 0.6446 0.5919 0.5439 0.5002 0.4604 0.4241 0.3909 0.3606 0.3329 0.3075 0.2843 0.2630 0.2434 0.2255 0.2090 0.1938 0.1799 0.1670 0.1552 0.1443 0.1342
10 0.9053 0.8203 0.7441 0.6756 0.6139 0.5584 0.5083 0.4632 0.4224 0.3855 0.3522 0.3220 0.2946 0.2697 0.2472 0.2267 0.2080 0.1911 0.1756 0.1615 0.1486 0.1369 0.1262 0.1164 0.1074
11 0.8963 0.8043 0.7224 0.6496 0.5847 0.5268 0.4751 0.4289 0.3875 0.3505 0.3173 0.2875 0.2607 0.2366 0.2149 0.1954 0.1778 0.1619 0.1476 0.1346 0.1228 0.1122 0.1026 0.0938 0.0859
12 0.8874 0.7885 0.7014 0.6246 0.5568 0.4970 0.4440 0.3971 0.3555 0.3186 0.2858 0.2567 0.2307 0.2076 0.1869 0.1685 0.1520 0.1372 0.1240 0.1122 0.1015 0.0920 0.0834 0.0757 0.0687
13 0.8787 0.7730 0.6810 0.6006 0.5303 0.4688 0.4150 0.3677 0.3262 0.2897 0.2575 0.2292 0.2042 0.1821 0.1625 0.1452 0.1299 0.1163 0.1042 0.0935 0.0839 0.0754 0.0678 0.0610 0.0550
14 0.8700 0.7579 0.6611 0.5775 0.5051 0.4423 0.3878 0.3405 0.2992 0.2633 0.2320 0.2046 0.1807 0.1597 0.1413 0.1252 0.1110 0.0985 0.0876 0.0779 0.0693 0.0618 0.0551 0.0492 0.0440
15 0.8613 0.7430 0.6419 0.5553 0.4810 0.4173 0.3624 0.3152 0.2745 0.2394 0.2090 0.1827 0.1599 0.1401 0.1229 0.1079 0.0949 0.0835 0.0736 0.0649 0.0573 0.0507 0.0448 0.0397 0.0352
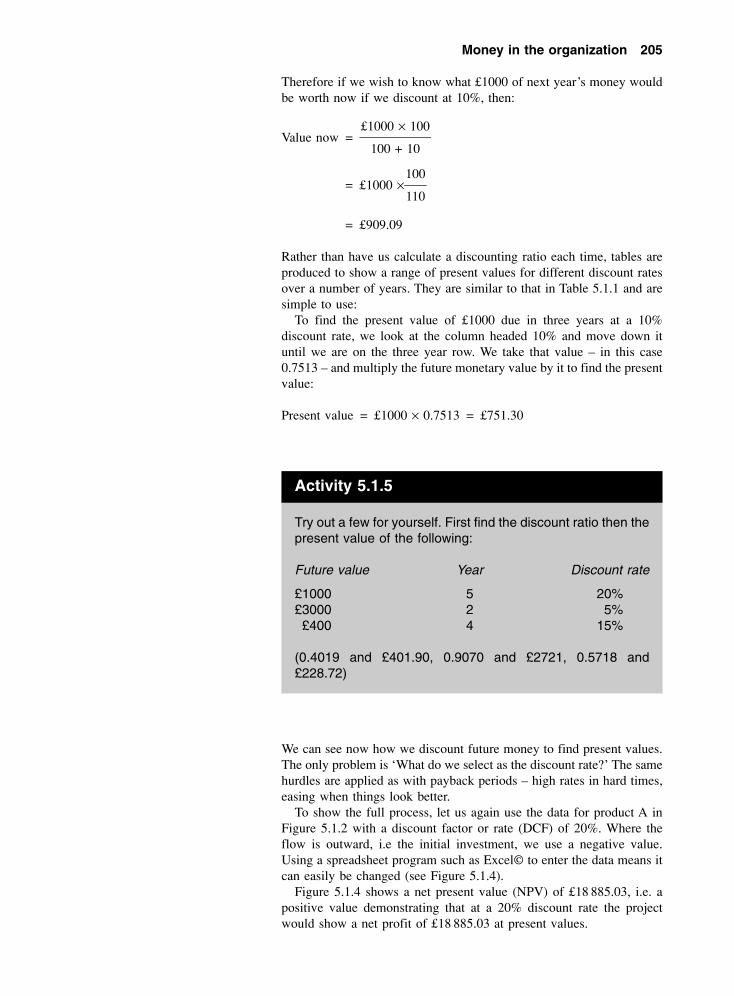
Money in the organization 205
Therefore if we wish to know what £1000 of next year’s money wouldbe worth now if we discount at 10%, then:
Value now =£1000 × 100
100 + 10
= £1000 ×100
110
= £909.09
Rather than have us calculate a discounting ratio each time, tables areproduced to show a range of present values for different discount ratesover a number of years. They are similar to that in Table 5.1.1 and aresimple to use:
To find the present value of £1000 due in three years at a 10%discount rate, we look at the column headed 10% and move down ituntil we are on the three year row. We take that value – in this case0.7513 – and multiply the future monetary value by it to find the presentvalue:
Present value = £1000 × 0.7513 = £751.30
Activity 5.1.5
Try out a few for yourself. First find the discount ratio then thepresent value of the following:
Future value Year Discount rate
£1000 5 20%£3000 2 5%£400 4 15%
(0.4019 and £401.90, 0.9070 and £2721, 0.5718 and£228.72)
We can see now how we discount future money to find present values.The only problem is ‘What do we select as the discount rate?’ The samehurdles are applied as with payback periods – high rates in hard times,easing when things look better.
To show the full process, let us again use the data for product A inFigure 5.1.2 with a discount factor or rate (DCF) of 20%. Where theflow is outward, i.e the initial investment, we use a negative value.Using a spreadsheet program such as Excel© to enter the data means itcan easily be changed (see Figure 5.1.4).
Figure 5.1.4 shows a net present value (NPV) of £18 885.03, i.e. apositive value demonstrating that at a 20% discount rate the projectwould show a net profit of £18 885.03 at present values.

206 Money in the organization
Activity 5.1.6
Now try the example in Figure 5.1.3 using the same discountfactor of 20%.
(– £3317.90)
The calculation for product B shows a negative value which means itfails to show a profit in present value terms at the 20% discount rate. Itwould not proceed if 20% was the desired rate to be used fordiscounting.
Internal rate of return (IRR)
Using set rates of discount means that some projects can be rejected forfailing to meet that criteria. It is probable that an organization could usedifferent discount factors to take into consideration any risks involved.These discounted hurdle rates are often set arbitrarily.
There is, however, another method using discounting which can beemployed. If we find the discount rate that would give exactly zeroprofit, we can compare different projects by using their equivalentdiscount rate. This rate where the discounted project returns zero iscalled the internal rate of return (IRR). The higher the IRR the better.
This rate can be found by a process of trial and error to find a rate thatreturns a net present value of zero.
A second way is to find an approximate value for the IRR by ratios.If we recalculate the net present value for product A (Figure 5.1.2) usinga new discounted factor of 30%, we would arrive at a net present valueof – £16 075.44. Therefore the IRR must lie between 20% and 30%.
To find the approximate IRR:
At 20% DCF, NPV = £18 885
At 30% DCF, NPV = –£16 075
Difference of +10% DCF gives a drop of £34 960 in NPV
YEAR CASHFLOW DISCOUNT RATIO PRESENT VALUE20%
0 –£150 000.00 1 –£150 000.00
1 £25 000.00 0.8333 £20 833.33
2 £50 000.00 0.6944 £34 722.22
3 £100 000.00 0.5787 £57 870.37
4 £90 000.00 0.4823 £43 402.78
5 £30 000.00 0.4019 £12 056.33
TOTAL NET PRESENT VALUE £18 885.03Figure 5.1.4 Net present valuecalculations for product A

Money in the organization 207
If the relationship followed a straight line, then a graph showing theNPV between 20% and 30% DCF would cross the zero value inproportion to the differences:
Where ZV = point at which NPV = zero
ZV
10%=
£18 885
£34 960
ZV = £18 885 × 10%
£34 960
= 5.41%
Therefore IRR = 20% + 5.41 = 25.41%
The true line joining the NPV values is actually a concave curve – so thestraight line taken is only approximate. By substituting the 25.41% intothe CDF spreadsheet, we find a value of –£1519.76 showing that thisapproximate value is high.
The correct value is 24.97% found using the goal-seeking function inExcel© to discover the IRR (see Chapter 7 for this use of Excel©).
Activity 5.1.7
Try the same approximation for the data for product B (Figure5.1.3). First, find the net present value using a 15% discountfactor and then the approximate IRR and compare it to theactual IRR by using the goal-seeking function in Excel©.
(£9096.77, 18.4%, 18.59%)
Both DCF and IRR are often a keystone in project appraisal.
Cash flow diagram
A good way to visualize the cash flow in a project is to draw a simplegraph. Taking product A this would give a graph as shown in Figure5.1.5.
Figure 5.1.5 Cash flowdiagram for product A (Figure5.1.2)

208 Money in the organization
Looking at the graph it can be seen that the cash flow line crosses thex-axis at 2.75 years. This is the payback period or the breakeven point.The slope of the line shows how quickly the cash is flowing. Note, ifyou use the automatic Excel© graph function, it draws the line fromthe centre of each division and is therefore more difficult to readcorrectly.
Activity 5.1.8
Draw a similar graph for product B (Figure 5.1.3) and checkthat the cash flow crosses the x-axis at the payback period.
Comparison between the appraisal techniques
As can be seen in Table 5.1.2, each technique gives a differentjudgement on the projects. Product B appears better in the paybackperiod method, but product A gives better values for the remainingtechniques, but not all to the same relative degree.
It is good practice to subject any appraisal figures to more than oneprocess.
Integrating non-economic considerations into theselection process
Each of the projects can be compared under as many aspects as deemeddesirable, perhaps by ranking them using the paired comparisontechnique (see Chapter 2 – page 93) to reduce them to the few maincontenders.
The remaining contenders then need to be put through theorganization’s economic appraisal system to determine their economicstanding. There may be projects which require combining to determinetheir cross-effect on benefit and shared costs.
Once these stages have been completed, any remaining projects mayneed further ranking in priority. This can be carried out by producing a
Table 5.1.2 Comparison between products using different appraisaltechniques
Product A Product B
Payback period 2.75 years 2 years
AGARR 39.3% 35% over four years28% over five years
ANARR 38.7% 20% over four years16% over five years
DCF @ 20% rate £18 885 –£3317
IRR 24.97% 18.59%
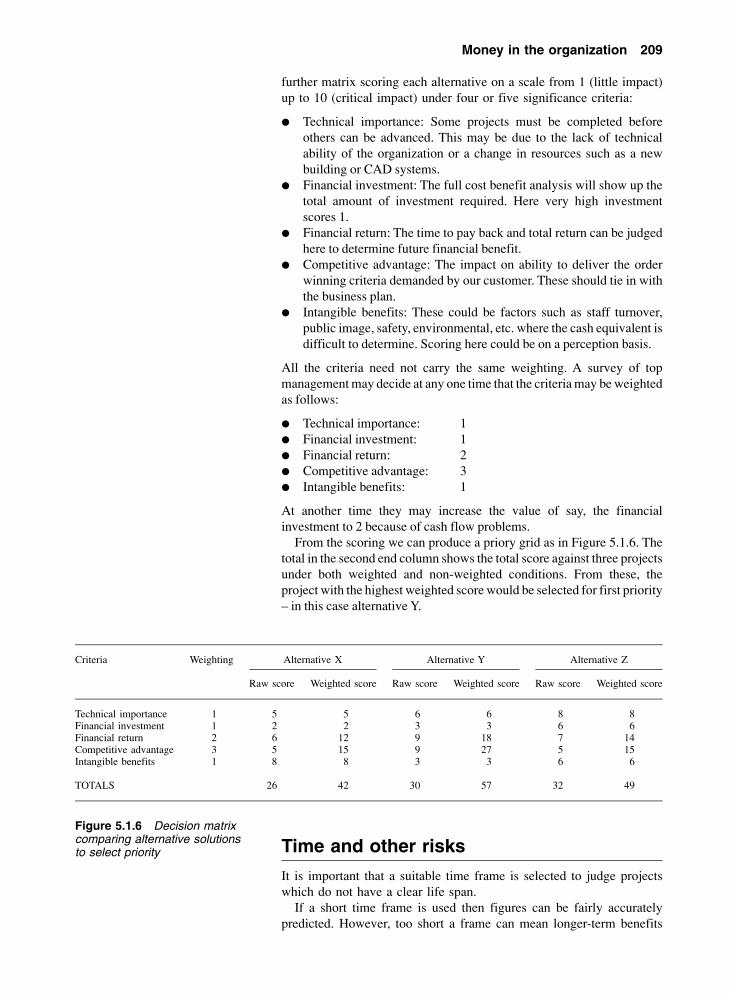
Money in the organization 209
further matrix scoring each alternative on a scale from 1 (little impact)up to 10 (critical impact) under four or five significance criteria:
� Technical importance: Some projects must be completed beforeothers can be advanced. This may be due to the lack of technicalability of the organization or a change in resources such as a newbuilding or CAD systems.
� Financial investment: The full cost benefit analysis will show up thetotal amount of investment required. Here very high investmentscores 1.
� Financial return: The time to pay back and total return can be judgedhere to determine future financial benefit.
� Competitive advantage: The impact on ability to deliver the orderwinning criteria demanded by our customer. These should tie in withthe business plan.
� Intangible benefits: These could be factors such as staff turnover,public image, safety, environmental, etc. where the cash equivalent isdifficult to determine. Scoring here could be on a perception basis.
All the criteria need not carry the same weighting. A survey of topmanagement may decide at any one time that the criteria may be weightedas follows:
� Technical importance: 1� Financial investment: 1� Financial return: 2� Competitive advantage: 3� Intangible benefits: 1
At another time they may increase the value of say, the financialinvestment to 2 because of cash flow problems.
From the scoring we can produce a priory grid as in Figure 5.1.6. Thetotal in the second end column shows the total score against three projectsunder both weighted and non-weighted conditions. From these, theproject with the highest weighted score would be selected for first priority– in this case alternative Y.
Time and other risks
It is important that a suitable time frame is selected to judge projectswhich do not have a clear life span.
If a short time frame is used then figures can be fairly accuratelypredicted. However, too short a frame can mean longer-term benefits
Criteria Weighting Alternative X
Raw score Weighted score
Alternative Y
Raw score Weighted score
Alternative Z
Raw score Weighted score
Technical importance 1 5 5 6 6 8 8Financial investment 1 2 2 3 3 6 6Financial return 2 6 12 9 18 7 14Competitive advantage 3 5 15 9 27 5 15Intangible benefits 1 8 8 3 3 6 6
TOTALS 26 42 30 57 32 49
Figure 5.1.6 Decision matrixcomparing alternative solutionsto select priority

210 Money in the organization
could be missed. If too long a frame is used this increases the inaccuracythrough uncertainty and risk due to unforeseen events, changing marketsor changes in technology. Long term would also see plant deterioration,higher maintenance and even renewal.
There are other risks involved in any attempt to forecast markets (seeChapter 6, Section 6.2). These vary from changes in economicconditions, market behaviour, poor designs, competitors’ actions, warand natural disasters which may affect customers or suppliers.
Some allowance can be made for possible risks by scenario analysis(see Chapter 6, Section 6.4). It is also worthwhile to carry out asensitivity analysis by varying some of the input information – such asplus or minus 10% on the sales figure, or the product life.
Non-financial factors
Although it is normally best to use monetary terms, these are sometimesdifficult to determine, and resist attempts to express them in pure moneyterms. The benefits still need to be compared to the costs involved evenif they cannot be quantified.
An example of this would be where new leading edge technology isbeing developed, but the actual improvements can be difficult toquantify initially. In Chapter 4, page 154, we examine one way ofexamining the overall effect of a project by considering the competitiveadvantage gained, the technical importance and other intangible benefitsin addition to the financial value.
Perhaps the best question to ask in these circumstances is a simpleone: ‘What happens if we do not make the investment?’
Problems 5.1.1
(1) Think about the last project you have been involved in. Whatwere the benefits gained? Can you express all these benefitsin money terms?
(2) Why do you think so many projects fail to make the returnsenvisaged in the case made for the investment?
(3) Why do you think that many companies request a paybackperiod of less than one year for small capital projects?
(4) Do you think that all extra revenue spending, e.g. newproduct development, should be subjected to the sameappraisal process as capital?
(5) Make out a case to justify spending your own money on atop-of-the-range personal computer for home use.
5.2 Costdetermination
Management accounting is the name given to the allocation and controlof internal costs within an organization. We need to understand howcosts arise and vary to determine how to set them against products andservices. For simplicity, we shall define services as being an intangibleproduct.
As we mentioned in the previous section on investment appraisal, abusiness has one main aim – to earn more than it pays out over as short

Money in the organization 211
a time as possible. This applies especially to normal day-to-day runningto accumulate profits which can then be used to fund investment andpayback borrowings. No organization can survive unless it does make aprofit. Even not-for-profit organizations such as charities cannot spendmore than they receive in income, whatever the source.
The incoming revenue is based on the price we receive for products,or services. Profit is what is left after deducting all money spent.
Therefore to ensure that we do receive more money than we spend wehave to ensure that prices more than cover all the costs involved. Pricesthemselves are difficult to control as they are often determined by whatpeople will pay – not what a product costs. This leaves costs which areto be controlled. Unfortunately all the costs are not easy to set againstparticular products, or services.
Classifying costs
Type of costs
Costs can be described in two main ways.
Direct costs. This is a cost for any material or activity that is useddirectly in making the product. These costs include:
� Raw materials which go into the product.� The labour operating machines, or assembling a product.� Power and other consumables used up when making the product.
The easiest way to decide if a cost is direct is to ask the question – ‘Ifwe make one more of this product, what actual money will need to bespent?’
There are other costs which are related to making a product such asmachinery deterioration, maintenance, setting up the machine andinspection which we could perhaps try to classify as direct. This is oftendifficult and we shall return to how to set these against products later –for now, we shall treat these as indirect costs.
Indirect costs. These are all the costs which do not directly go into themaking of the product. They include items such as supervision, generalheating and lighting, administration, sales, etc. Note although these donot go directly into the making of a product, they are only there becausethe products are being made.
Behaviour of costs
Fixed costs. These do not vary as the amount of product made varies –at least in the short term as in Figure 5.2.1. In the long term they actuallydo vary – e.g. business rates change from year to year. Examples ofthese are rent and business rates, supervision, administration, etc. Itshould be obvious comparing this with indirect costs that fixed costs arein fact mainly indirect.
Variable costs. These should vary directly in relation to the productsbeing made as in Figure 5.2.2. These can be seen as similar to directcosts.

212 Money in the organization
Semi-variable costs. These are costs which do not vary in relation toslight variations in activity, but do in relation to significant changes. Anexample of this would be supervisors:
One supervisor may suffice to oversee 10 operatives, but if thenumber of operatives rose to 20, then an extra supervisor may have tobe appointed. This behaviour is often stepped as in Figure 5.2.3.
What is slightly confusing is that many costs which are classified asvariable can behave at times like a fixed cost, or behave in a less thandirectly proportional way. All supposedly fixed costs also vary – at leastfrom year to year. We shall discuss this more later when looking atlabour costs.
Costing
We shall now have a look at the way we set costs against products andservices.
Labour
Labour costs are often thought of as easy. Just set the wages paid againstproduct costs. In reality, it is more complex than that.
For example, it is difficult to employ part of an employee. Wenormally have to employ people for a set time period and may not have
Figure 5.2.1 Behaviour offixed cost in relation to quantityproduced
Figure 5.2.2 Behaviour ofvariable cost in relation toquantity produced
Figure 5.2.3 Behaviour ofsemi-variable (stepped) cost inrelation to quantity produced

Money in the organization 213
sufficient orders to keep them working for all the time we pay for. Theirwage cost is then behaving as a fixed cost, or at least as a steppedcost.
Similarly an organization may have a human resource policy of nothiring and firing as trade fluctuates, making labour costs act very muchlike a fixed cost. Some organizations attempt to get round this byemploying flexible part-time workers, but these are not always easy tofind with the required skills.
Similarly the cost per hour of operatives can vary according topremiums for overtime, shift working and degree of skill. It is commonwithin some industries to pay people a premium for having thecapability of performing more than one skill e.g. being capable ofoperating more than one type of machine.
Labour cost elements
Labour costs must include more than just the basic pay that an employeereceives. The extra costs involved are:
� National Insurance� Contribution to pension funds� Holidays� Sick pay
In addition, every minute of an employee’s time is not spent directlyworking on a product. There will be:
� Tea breaks� Meetings� Training� Receiving instruction� Idle time due to:
– Machine breakdowns– Shortage of work or material– Awaiting decisions
Everything done may not result in good products – some defective itemswill be produced involving either scrapping of work done, or reworking– which may be done by the same employee or a different one.
Finally there are overheads which are determined by the number ofemployees such as supervision, wages calculations, welfare and perhapseven recruitment if there is turnover of staff. However, let us leavethese, to the discussion on overheads.
An example calculation is shown in Example 5.2.1.

214 Money in the organization
Example 5.2.1
The build-up of an employee’s cost rate per hour.
COSTSHourly paid rate £6.00Basic working week 37.5 hoursWeekly wage £225.00Annual wage £11 700.00Employer pension contribution @ 8% £936.00Employer National Insurance contribution
@ 6% average £702.00
Yearly cost £13 334.00
TIMEPaid time – 52 weeks @ 37.5 per week 1950 hoursLess
LeaveAnnual – 5 weeks 190 hoursPublic holidays – 10 days 75 hours
Sickness – 5 days per year 37.5 hoursMeetings – 2 hours per month 24 hoursTraining – 2 weeks per year 75 hours
Subtotal non-producing 401.50 hours
Available productive time 1548.50 hours
Therefore cost per hour =£13 334.00
1548.50 hours
= £8.61
As we can see from Example 5.2.1, the actual cost rates per hour foremployees are more than they are paid per hour. In this case, almost44% more.
Note that this rate further assumes that all available time is actuallyspent on producing work. When allowing for non-productive time, costper hour can readily approach double what an operative is paid for basicwork time. If the employee in Example 5.2.1 was only 80% producingthen the applied cost per hour would rise to £10.76–80% above his paidrate.
Controlling labour costs
From the above, it should be obvious that determining and controllinglabour costs necessitates looking at a combination of factors:
� Paid rate of employees.� Manning levels.� Productivity.� Mode of operation.� Lost time – by cause.� Premiums paid – for overtime, shifts, skills.� Turnover (hidden costs of recruitment and training).� Additional on-costs – pension, welfare, holidays, etc.
Money in the organization 215
Being able to correctly identify the true cost rate means that productcosts are accurate and decisions such as what product mix should bemade or make-or-buy are based on reality.
Material costs
Similar to labour, at first sight determining material costs should besimple. Again, however, there are complications when we get down todetails.
All material purchased does not leave the premises in the form ofproduct:
� All processes have waste associated with them and this has to beincluded in any cost set against the product.
� There are losses due to scrap or reworking.� Some materials are used in a process, but do not end up in the
product – examples include emery powder (used for polishing), gasconsumed in heat treatment and flux used in soldering.
In addition:
� Material which enters the premises causes other costs to arise suchas receiving, handling, storage, stock-keeping, stock checking,deterioration, obsolescence, theft, etc.
� Money tied up in stock has a cost associated with it, e.g. interest.� Even the purchase operation itself costs money to source the item,
prepare an order, perhaps then to chase the order and, of course,eventually to pay the supplier.
Where possible therefore, we should determine all the associated costsand include them in the material cost when they happen.
Where material is ordered specifically for a job, then the cost of thatmaterial should be put against the job. This should happen even if thereis material left over – that should only be excluded when it definitelywill be used for another job or sold. In the latter instance the sellingprice of the material left over can be excluded. If reuse is only probable,then it cannot be excluded. If the material is thought not to be of use butis later sold, or used then it is a bonus.
An example of material bought for a particular job could be a 2 m by1 m sheet of 15 mm thick mild steel chequered plate (i.e. 2 m2). Arectangular piece measuring 1.23 m by 1 m is used (1.125 m2) leaving apiece measuring 0.25 m by 1 m. If there is no definite use for the off-cutthen it must either be sold (and the price gained deducted from the initialmaterial cost) or, if it cannot readily be sold, then the full amount of thematerial must be charged to the job.
Valuation of stock material
In times when the prices of raw material fluctuate evendetermining the cost of standard stock material becomesmore complex. This is because there are several methods ofvaluing stock material as it is withdrawn.

216 Money in the organization
Even where materials are being used on a first-in-first-outbasis, they can be valued in different ways. To demonstratethe differences, we shall look at the following material stockmovements under four different valuation methods:
1 Jan Zero stock2 Jan Delivery: 1000 units @ £0.50 each9 Jan Delivery: 1000 units @ £0.55 each
11 Jan Issue 800 units14 Jan Issue 800 units16 Jan Delivery: 1000 units @ £0.60 each18 Jan Issue 800 units
FIFO (first-in-first-out)As the name implies, material usage is based on the earliestprices, until all material bought at that price is used up. It thenmoves onto the next price. The example is shown in Excel©format in Table 5.2.1.
As can be seen, the first received was 1000 units @ £0.50each. These were the first to be issued for the 800 on 11 Jan– leaving 200 of the first receipt still in stock. When the next800 were issued on 14 Jan only 200 units @ £0.50 eachremained to be issued, the remaining 600 units had to beissued from the second receipt, i.e. @ £0.55 each.
Another receipt was on 16 Jan of 1000 units @ £0.60 each.For the issue on 18 Jan only 400 remained of that valued at£0.55. This left 400 to be issued at a value of £0.60. Thestock remaining is all valued at £0.60 each.
LIFO (last-in-first-out)This time value for the latest receipt is used for issues. Theexample is worked out in table 5.2.2.
As can be seen, at the time of the first issue on 11 Jan, thelast received were 1000 units @ £0.55 each. These were thefirst to be issued for the 800 on 11 Jan – leaving 200 of thenext latest receipt still in stock. When the next 800 wereissued on 14 Jan only 200 units @ £0.55 each remained tobe issued, the remaining 600 units had to be issued from thefirst receipt, i.e. @ £0.50 each.
Another receipt was on 16 Jan of 1000 units @ £0.60 each.This value was used against the 800 issued on 18 Jan. Theremaining stock consisted of 200 @ £0.60 and 400 @£0.50.
Average costIn this method, the average price of the stock is recalculatedafter each receipt and this new average value is then used forany issues made before the next receipt (when averagevalues need again be calculated). The example is shown inTable 5.2.3.
The two receipts on 2 and 9 Jan average out at a cost of£0.525. Note the Excel© sheet shown in Figure 5.2.3 hasbeen set to show currency values to two places, but uses thetrue value to calculate values charged out.

Money in the organization 217
This average figure is then used for issues until the receiptof 1000 units @ £0.60 each on 16 Jan when a recalculationof the average stock price has to be made. This new averageprice is then used for the material issued on 18 Jan.
Standard costIn order to prevent recalculating an issue value each time anexpected average, or standard, cost is often set at thebeginning of a period for all issues. The example is shown inTable 5.2.4.
This time a standard issue cost of £0.55 was expected.Note that the actual cost of the material only agreed with thestandard cost on one occasion. On the other two occasions,the actual price showed a variation from the standard set.
Table 5.2.1 Material charged out and remaining stock value for FIFO method
Date Received Value/unit
Valuein
Issueout
Value/unit Valueout
Stockquantity
Stockvalue
01-Jan 0 002-Jan 1000 £0.50 £500.00 1000 £500.0009-Jan 1000 £0.55 £550.00 2000 £1050.0011-Jan 800 £0.50 £400.00 1200 £650.0014-Jan 200 £0.50 £100.00 1000 £550.00
600 £0.55 £330.00 400 £220.0016-Jan 1000 £0.60 £600.00 1400 £820.0018-Jan 400 £0.55 £220.00 1000 £600.00
400 £0.60 £240.00 600 £360.00
Totals 2000 £1650.00 2400 £1290.00
Table 5.2.2 Material charged out and remaining stock value for LIFO method
Date Received Value/unit
Valuein
Issueout
Value/unit Valueout
Stockquantity
Stockvalue
01-Jan 0 002-Jan 1000 £0.50 £500.00 1000 £500.0009-Jan 1000 £0.55 £550.00 2000 £1050.0011-Jan 800 £0.55 £440.00 1200 £610.0014-Jan 200 £0.55 £110.00 1000 £500.00
600 £0.50 £300.00 400 £200.0016-Jan 1000 £0.60 £600.00 1400 £800.0018-Jan 800 £0.60 £480.00 600 £320.00
Totals 3000 £1650.00 2400 £1330.00

218 Money in the organization
Comparison of methods
Table 5.2.5 shows the values of the issues out and of the remaining stockderived from the four methods. They are listed in order of issue value.No two have the same values. These differences will show up in theproduct cost calculation and the main profit and loss statement and thebalance sheet.
Any method can be decided on – as long as the organization alwayspresents its information in the same way from one year to the next. Itdepends on whether the organization decides to make more emphasis onthe items going as costs (value out) against profits or the valuation of its
Table 5.2.3 Material charged out and remaining stock value for average value method
Date Received Value/unit
Valuein
Issueout
Value/unit Valueout
Stockquantity
Stockvalue
01-Jan 0 002-Jan 1000 £0.50 £500.00 1000 £500.0009-Jan 1000 £0.55 £550.00 2000 £1050.0011-Jan 800 £0.53 £420.00 1200 £630.0014-Jan 200 £0.53 £105.00 1000 £525.00
600 £0.53 £315.00 400 £210.0016-Jan 1000 £0.60 £600.00 1400 £810.0018-Jan 400 £0.58 £231.43 1000 £578.57
400 £0.58 £231.43 600 £347.14
Totals 2000 £1650.00 2400 £1302.86
Table 5.2.4 Material charged out and remaining stock value for standard cost method
Date Received Value/unit
Valuein
Issueout
Value/unit Valueout
Stockquantity
Stockvalue
Standard cost of material per unit charged out set at £0.5501-Jan 0 002-Jan 1000 £0.50 £500.00 1000 £500.0009-Jan 1000 £0.55 £550.00 2000 £1050.0011-Jan 800 £0.55 £440.00 1200 £610.0014-Jan 200 £0.55 £110.00 1000 £500.00
600 £0.55 £330.00 400 £170.0016-Jan 1000 £0.60 £600.00 1400 £770.0018-Jan 800 £0.55 £440.00 600 £330.00
Totals 3000 £1650.00 2400 £1320.00
Table 5.2.5 Comparison of material valuation methods
Method Value out Stock value
FIFO £1299.00 £360.00Average value £1302.86 £347.14Standard cost £1320.00 £330.00LIFO £1330.00 £320.00

Money in the organization 219
assets (stock value). In the long run, it does not matter too much as longas the method is clearly stated and consistently applied.
Controlling material costs
� Ensure all material, including waste and scrap is charged to thejob.
� Determine true holding costs.� Identify slow moving or obsolete stock.� Determine true procurement costs.� Minimize stocks held to match production requirements.
The latter gives rise to systems such as material requirement planning(MRP) and just-in-time (JIT).
Process costs
We should build up a true picture of all the costs involved in operatingan item of plant in a similar manner to that used to build up the cost ofan operative-hour. First we have to determine what items of cost arecaused by our operating that particular plant item. We then have todetermine the monetary value to be set against the plant (see Example5.2.2) for the budgeted number of running hours.
Example 5.2.2
Build-up of a machine hour rate
OVERHEAD ITEM ANNUAL COSTDepreciation £2500.00Insurance £1200.00Maintenance
(labour and spares) £1400.00Power £1150.00Consumables £600.00Tools (non-product specific) £1500.00
Total annual running costs £8350.00
Annual hours running = 30 hours/week × 50 weeks
= 1500 hours
Overhead cost =£8350.00
1500 hours
= £5.67/hour
Operative cost/hour = £8.92
Setter’s cost(10% of hours cost) = £1.12
Total machine rate = £15.71/hour

220 Money in the organization
The overhead items of depreciation and insurance are independent ofthe running hours, but the remainder depend on the usage of themachine.
Note that the figure used for the operative rate was that calculated forthe worker being available 100% of the time. However, only an 80%utilization has been used to calculate the overhead rate per hour. Theremaining 20% could be set against a different cost area for controlpurposes. It should also be included in the machine hour rate, in whichcase this would rise to £18.93/hour.
Only 10% of a machine setter’s hourly cost rate has been set againstthe machine as that was calculated to be the amount of time the setterspent on the machine.
Where tooling is required specifically for a product then that costshould be set against the quantity to be produced by each tool.
Overheads
There are a multitude of activities which have to be carried out in abusiness which are difficult to directly attribute to a product, or process.These are the overheads in the business.
Allowing for ways to recover the cost of overheads is a majorproblem area in accounting. They must be covered for when deciding ifa product is profitable or not at the price received.
If they are wrongly allowed for it could lead to incorrect decisionsbeing made. Therefore it is always best to approach decision making onthe same basis as investment appraisal, i.e. only consider overheadswhich will actually change when making decisions such as make-or-buy.
There are several ways to consider treating overheads.
Absorption costing
Under this method, we attempt to allocate all overheads to specificproducts, or processes. These overheads are then, in theory, recoveredby producing products. This is sometimes referred to as full costing. Thestages are:
(1) Select identifiable cost centres to collect and allocate costs from.This could be a particular group of machines or an indirectfunction such as maintenance.
(2) Estimate all overheads.(3) Allocate these overheads to cost centres where possible to identify
their usage therein.(4) Apportion unallocated costs using estimation of usage. This is
often done arbitrarily.(5) Apportion service departments into direct departments.(6) Calculate absorption rates.(7) Charge overheads to products.
The absorption rates used vary considerably.If a company had an overhead cost of £25 000 associated with a
machine shop to be allocated it can choose from a variety of bases:

Money in the organization 221
� Per unit produced: Cost centre overheads divided by number ofunits produced:
Example £25 000 over 100 000 units = £0.25 per unit
� Per labour hour: Cost centre overheads divided by direct labourhours.
Example £25 000 over 12 500 direct hours = £2.00 per hour
� Per machine hour: Cost centre overheads divided by direct machinehours.
Example £25 000 over 1000 machine hours = £25.00 per machinehour
� Per material usage: Cost centre overheads divided by direct materialcosts.
Example £25 000 over £50 000 material = £0.50 per £ material
� Floor space: Cost centre overheads divided by total floor area.
Example £25 000 over 10 000 m2 = £2.50 per m2
Only usage over time will dictate if the method selected is reasonable.Problems that arise are:
� An inappropriate unit for recovery is selected.� An assumption that arbitrary allocation is accurate.� Changes in product mix leading to under- or over-recovery of
overheads.
Marginal costing
Because of the problems of inaccuracy in overhead allocation, marginalcosting is often used in decision making and determining theprofitability of a product. In this method the variable costs, includingaccurately allocated overheads, are compared to the selling price. Thedifference is called the contribution.
Contribution = selling price – variable costs
The contribution has both to cover the unallocated overheads and add tothe profit. This allows companies to gauge if there is a sufficient gapbetween selling price and variable costs.
Profit = contribution – overheads
As an example, if we sold 30 000 units of a product @ £3.50, which has£2.25 variable costs then:
Unit contribution = selling price – variable cost= £3.50 – £2.25= £1.25
Total contribution = sales × unit contribution= 30 000 × £1.25= £37 500

222 Money in the organization
If we have unallocated overheads of £25 000 then
Profit = total contribution – overheads= £37 500 – £25 000= £12 500
Marginal costing can be used to determine breakeven points. This isachieved by combining two costs (variable and overheads) into onegraph and comparing it to the income against quantity produced as inFigure 5.2.4. Quite often this graph is used with fixed costs being usedinstead of overheads and as such it is similar to the cash flow diagramshown in Section 5.1.
However, as in absorption costing, marginal costing also has inherentcomplications:
� Variable and overheads costs do not always follow simplepatterns.
� Where a variety of products are being made, effort may not be madeto allocate overheads towards products.
� Efficiency and usage levels may not be taken fully into account.
Control of overhead costs
Overhead functions’ costs are not directly variable with units produced.They must still be controlled as they determine the profit left from thetotal contributions.
There are a few methods which are used to set initial budgets.
� Zero budgeting: This method is very similar to investment appraisalas in Section 5.1. Each overhead section has to justify itscontribution towards profitability. In effect they have to prove thatprofits would be lower if they did not exist at certain levels.
� Activity based costing (ABC): It is recognized that different levelsof activity result in cost level variations. ABC attempts to derivethese causes, labelled cost drivers, so that the variations can beforeseen. An example of an activity would be salary and wageadministration. Activity varies according to the number of peoplebeing paid and the wage systems employed.
The main activity after setting budgets is budgetary control.
Figure 5.2.4 Breakevenanalysis

Money in the organization 223
Depreciation
When an organization purchases for use over several pieces of plant orequipment it does not put that cost in as a direct cost in the year ofpurchase. What it does is to assume that the plant’s value gets used up,or loses value, over a period of time. It therefore slowly feeds a part ofthat original cost into the direct cost over the plant life. This is termeddepreciation.
Depreciation is a method used by accountants to transfer the loss invalue of assets into an expense that is then transferred into the trading/profit and loss account. A similar approach can be taken to transferdevelopment costs into the operating costs.
It is not like the other overhead costs as no actual money flows out ofthe company – that took place when the asset was purchased, or thedevelopment work took place.
There are several different methods for calculating depreciationwithin an organization, but only the two most commonly used methodsare covered here – the straight line method and the reducing balancemethod.
The straight line method
This allows the same monetary value to be used each year.
Annual depreciation =original cost – residual value
estimated useful life
For example, take an organization purchasing a new car for £20 000 andit plans to sell it in four years. It anticipates it will receive £10 000 forthe car then:
Annual depreciation =£20 000 – 10 000
4=
£10 000
4= £2500
If the same organization buys a new PC for £2400 that it estimates itwill replace in 3 years with no resale potential then:
Annual depreciation =£2400
3= £800
These examples are shown graphically in Figures 5.2.5 and 5.2.6respectively.
The reducing balance method
This allows a different value, i.e. a reducing amount, to be used eachyear.
Annual depreciation = latest book value multiplied by a depreciationfactor
If the same organization used the reducing balance method then if theydecide that the car loses 20% per year, then they would havedepreciation values as in Table 5.2.6.
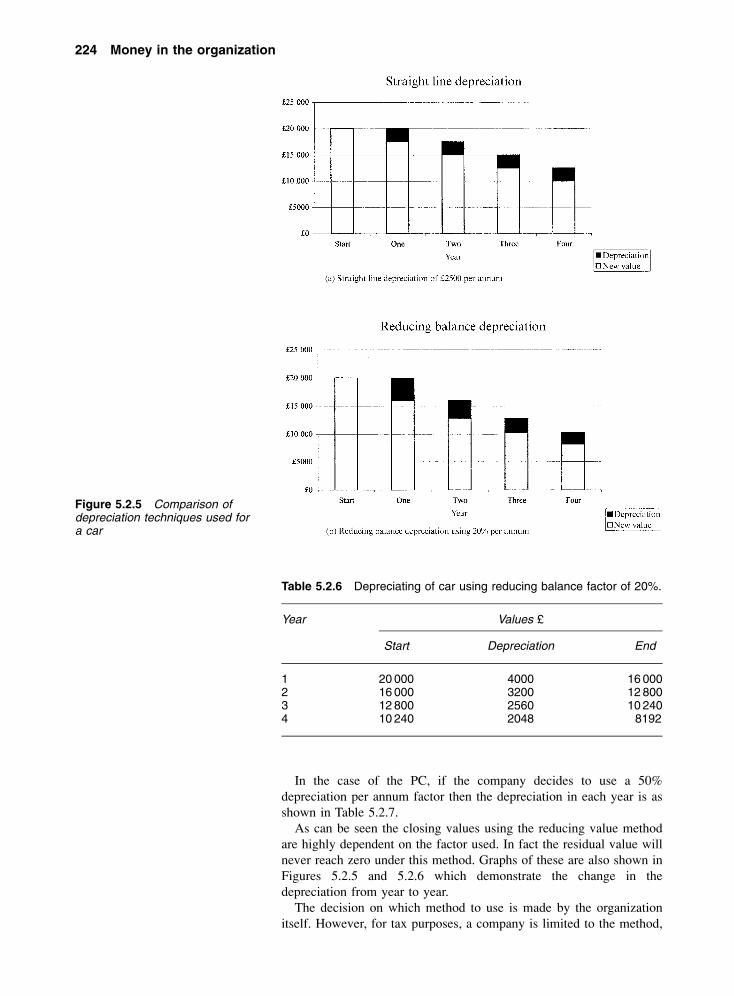
224 Money in the organization
In the case of the PC, if the company decides to use a 50%depreciation per annum factor then the depreciation in each year is asshown in Table 5.2.7.
As can be seen the closing values using the reducing value methodare highly dependent on the factor used. In fact the residual value willnever reach zero under this method. Graphs of these are also shown inFigures 5.2.5 and 5.2.6 which demonstrate the change in thedepreciation from year to year.
The decision on which method to use is made by the organizationitself. However, for tax purposes, a company is limited to the method,
Figure 5.2.5 Comparison ofdepreciation techniques used fora car
Table 5.2.6 Depreciating of car using reducing balance factor of 20%.
Year Values £
Start Depreciation End
1 20 000 4000 16 0002 16 000 3200 12 8003 12 800 2560 10 2404 10 240 2048 8192

Money in the organization 225
and values, laid down by government in what is termed capitalallowances.
Typical UK government capital allowances are:
� Industrial buildings – 4% per annum straight line� Plant and machinery – 25% per annum reducing balance� Fittings and fixtures – 25% per annum reducing balance
(if permanent part ofbuilding) – 4% per annum straight line
� Motor vehicles – 25% per annum reducing balance
Figure 5.2.6 Comparison ofdepreciation techniques used fora computer
Table 5.2.7 Depreciation of computer using reducing balance factorof 50%
Year Values £
Start Depreciation End
1 2400 1200 12002 1200 600 6003 600 300 300

226 Money in the organization
These are periodically subject to change and must be checked with thetax authorities each year. It is not uncommon for the values to betemporarily changed when a government wishes to encourage capitalinvestment – for example, the UK government for the period1999–2002 is allowing 100% capital allowances for IT investment,including developing E-commerce facilities.
Product costing
It is important when working out a product cost to agree beforehand theway overheads will be treated. This is very much down to companypolicy.
Probably it is best to use marginal costing with as many directlyallocated overheads as possible in the calculation. Non-allocatedoverheads can be shown as a distinctly separate item if required.
The next is to ensure all costs are identified and how they will beapplied to the costing. An important factor is the quantity to be producedas that will determine how items such as tooling, setting up and scrapallowance will be applied.
Detailed costings are required especially when considering differentmanufacturing processes.
If we take a one-off component as per Figure 5.2.7. There are manydifferent ways to produce this. For this example let us assume it will beproduced by machining from a 125 mm square bar.
The first stage is to produce a process plan showing:
� What operations are required.� What plant will be used to meet tolerance requirements.� What time is involved for producing each one and for any set-up
involved.� Any special tooling required.� Inspection required.� Starting size.� Protection and/or packaging required.� Delivery cost.
Figure 5.2.7 Component – material mild steel

Money in the organization 227
From these the costing can be done (see Table 5.2.8).To this should be added the following costs:
Raw material – bought cut to length @ £9.50Protection – zeroDelivery @ £3.50
As it is a one-off, then we should also consider extra costs such asraising the production order and the purchasing costs – say £30.
This means a direct cost of £23.62 + £9.50 + £3.50 + £30.00 = £66.62to which should be added a mark-up percentage to contribute to non-allocated overheads and profits. This would probably mean a sellingprice of about £100 to cover all costs and give a reasonable profit.
It is worthwhile comparing what this cost would calculate as if weonly used an average operator wage rate of £7.00 per hour. The totaltime involved is 1.03 hours. Multiplying by £7 gives £7.21. If we addmaterial @ £9.50 a total of only £16.71 is arrived at. This is much lessthan the total arrived at when a detailed costing is carried out hencestressing the importance of carrying out a full costing.
Now what sort of change is involved when considering a large orderquantity?
The first is that different processes would probably be selected andspecial tooling can be invested in.
This time we have a repeating order scheduled at 1000 off per monthof the same component as per Figure 5.2.7. Let us assume this time itwill be produced by machining from a special ordered 120 mm pre-finished square bar.
The first stage is again to produce a process plan from which the newcosting can be done (see Table 5.2.9).
To this should be added the following costs:
� Raw material – bought in bars at £47.50 per metre. Required250 mm finished length. Required length would be at least 250 mmplus an allowance for parting-off cutter and scrap at bar ends – sayallow 280 mm per item. This gives a cost per item of £13.30, whichis more than the one-off. This is because we have called for a specialstarting size, but it saves the operation of machining the 120 mmsquare.
� There is no allowance for inspection as this is considered to be anoverhead in this case because 100% inspection is not necessary.
� Because it has moved operations (to higher producing machineswhich cost more per hour) we have to invest in special tooling.
Table 5.2.8 One-off operation cost sheet
Operationnumber
Operation Plant Set-uptime
Processtime/item (hr)
Cost/hour(£)
Cost perrun (£)
1 Cut to length Saw 105 N/A 0.15 12.00 1.802 Mill 120 mm square Mill 311 N/A 0.33 18.00 6.003 Turn and face Lathe 503 N/A 0.45 17.00 7.654 Mark off, drill/ream J/B 721 N/A 0.33 20.00 6.675 Inspect CC 25 N/A 0.10 15.00 1.50
TOTAL 23.62

228 Money in the organization
Special chuck jaws for the numerical controlled lathe and a drill jigfor the multi-head drill machine. If these cost £2000 and £750respectively there is a total tooling cost of £2750. We then have todecide how many units each tool will be written off against – in thiscase we shall use a year’s requirements of 12 000 units. This givesa spread cost of £2750 divided by the 12 000, i.e. 0.23 per unit.
� Delivery @ £0.50 each – because we have higher load usage,meaning lower cost.
� As it is a repeat order, we could also consider extra costs such asraising production order and purchasing costs as recoverable fromthe contribution. This means a direct cost of £2.90 + £13.30 + £0.50+ £0.23 = £16.93 to which should be added a slightly larger mark-upthan in the case of the one-off mark-up percentage to contribute tothe greater non-allocated overheads and profits. This wouldprobably mean a selling price of around £30 to cover all costs andgive a reasonable profit.
Problems 5.2.1
(1) What are the cost items which would be classified as directcosts when considering a car service at a garage?
(2) What is the cost rate per hour of overtime for the employeein Example 5.2.1, if a payment of 25% is made for overtimeworking? Hint: Only pension and National Insurance isadded and there are no deductions for leave, etc. (£8.55)
(3) Compare the Automobile Association’s published figure ofhow much a small car costs per mile against a simplecalculation of the cost of petrol used.
(4) How would you allow for recovery (payback) of the costs ofdeveloping a new product in the overhead costs?
(5) If you buy a new car, how much value does it lose in the firstthree years?
Table 5.2.9 1000 off operation cost sheet
Operationnumber
Operation Plant Set-uptime
Processtime/item (hr)
Cost/hour(£)
Cost perbatch (£)
1 Turn and face and part-off NC lathe 503 0.50 0.06 35.00 2117.50
2 Drill M/D 333 1.00 0.03 25.00 775
TOTAL BATCH COST 2892.50
Cost per item 2.90
5.3 Producingthe accounts
Financial accounting is the name given to the determination of the flowof money into, out of, and tracking what happens to this money inside,the organization. It measures the health of the organization.
There are three important documents which describe the financialhealth of the organization:

Money in the organization 229
� The balance sheet – showing on one particular date where themoney is within the organization and also what it is owed from andowed to the outside world. This is known as a snapshot of thefinancial position.
� The profit and loss account – showing over a set period the salesincome, the cost to produce this, other operating expenses and thenet profit. This shows the financial performance of theorganization.
� Cash flow statement – showing the movement of money into andout of the organization.
Accounting standards
In order to ensure that potential suppliers and investors can examine allthe company’s financial health in the same way, published accountsmust conform to similar standards in presentation and content.
Legal requirements
The Companies Acts 1985 and 1989 prescribe that annually privatecompanies must:
(a) Publish their profit and loss account.(b) Publish a balance sheet.(c) Adopt historical accounting rules (or permitted alternative).(d) Give information on:
(i) trading of the company(ii) important events(iii) likely future developments.
(e) Publish Research and development activities.(f) Publish a Source of increase or decrease in fixed assets, including
revaluations.(g) Publish accounting policies.(h) Publish an Auditor’s report.
Note: small and medium private companies need publish only limitedinformation.
Accounts tend to follow recognized guidelines such as SSAP(Statement of Standard Accounting Practice) but this is not a legalrequirement.
Concepts involved in financial accounting
� Money measurement: Only include items which are measured inmonetary terms.
� Realization: When items are invoiced is normally the date used fordetermining when transactions have taken place. This means a cut-off date is selected to determine which account is credited/debited.
� Conservation or prudence – ‘Do not anticipate profits’ and ‘Providefor all possible losses’ are the guidelines. A good example is toallow for probable bad debts which will not be recovered.

230 Money in the organization
� Matching: Accounts should show all money spent but only onactivities carried out within the period.– Accruals cover activities carried out, but not yet paid for, e.g. in
arrears such as electricity.– Prepayments are money paid in advance of future activity, e.g.
rent.� Consistency: Accounts must be calculated in same way from period
to period.� Disclosure: Any changes which have a significant effect on the
accounts must be stated, e.g. a change in accounting practices.� Objectivity: Endeavour to limit personal bias.� Duality: The double entry principle. Every transaction is entered in
two accounts – once as a debit and once as a credit.� Verifiability: Accounts should be capable of being verified by
independent auditors.
Cash flow statement
A very important day-to-day financial control that an organizationcarries out is over cash flow. More companies go out of business byrunning out of cash to pay their employees and suppliers than for beingunprofitable.
Table 5.3.1 demonstrates a simple cash flow for a company in itssecond year of trading. Points to note are:
� All values are shown in £s, unless otherwise stated.� Sales – shown in units (in italics) and value. Charged out at £20
each but paid for one month later (in arrears). The latter figure isshown in the Revenue row. This is when the cash is actuallyreceived and is the figure used when working out the cash flow.
� Materials – shown in units (in italics) and value. Purchased inquantities to make 500 units. Paid for @ £4.80 per unit ondelivery.
� Premises are paid for six months in advance.� Carriage is @ £1.50 per unit, paid in advance.� The company borrowed £12 500 from the bank in the first year.
Interest only is paid on this @ 16% per annum with bank charges of£50. Bank payments are made quarterly in arrears.
� Direct wages are paid to a part-time operator and include NationalInsurance.
� Indirect wages are the owner’s withdrawings as a salary and alsoinclude National Insurance.
� The following amounts are part of this year’s cash flow althoughthey are items in the previous year’s profit and loss account andbalance sheet (realization/matching concepts):– Revenue of £4000 received in January for sales in December of
previous year.– Expense of £550 paid to bank in January to cover period Oct. –
Dec. of previous year.– Expense of £450 paid to accountant in March for preparing
previous year’s accounts.
For simplicity, we are ignoring Value Added Tax (VAT), NationalInsurance Contribution (NIC) and pay-as-you-earn (PAYE) payments to

Table 5.3.1 Cash flow for year two of company. All values are shown in £s, unless otherwise stated. (Note figures in shaded background are paid in this year,but were incurred in the previous year and show up in the previous year’s profit and loss statement and balance sheet)
Month: Previousyear
figures
1 2 3 4 5 6 7 8 9 10 11 12 Totalfor
year
Outstandingat
year end
Sales – units 200 170 180 150 200 150 150 200 170 250 200 150 2 170Sales – value 4 000 3 400 3 600 3 000 4 000 3 000 3 000 4 000 3 400 5 000 4 000 3 000 43 400
CASH FLOWRevenue 4 000 4 000 2 500 3 400 3 100 900 3 100 2 000 4 600 3 600 4 900 3 700 39 800 7 600
OutgoingsMaterial–units 200 500 500 500 500 500 2 700Cost 960 2 280 2 280 2 280 2 280 2 280 12 360Direct wages 500 500 500 500 500 640 640 680 740 950 760 640 7 550Indirect wages 500 500 500 500 500 1 000 1100 1 200 1 200 1 200 1 200 1 200 10 600Rent 2 500 2500 5 000Carriage 300 255 270 225 300 225 225 300 255 375 300 225 3 255Misc. 500 150 150 150 100 100 125 175 180 60 45 95 1 830Car 200 120 130 150 100 120 750 130 150 100 70 70 2 090Accountant 450 350 800 750Bank 550 550 550 550 2 200 550Tax paid 0
CASH FLOW CALCULATION (Note that payments against the first year accounts are shown in shaded boxes) CheckStart 8 673 6 663 6 858 7 808 6 403 8 003 6 818 4 248 913 2 988 1 073 3 598 8 673In 4 000 4 000 2 500 3 400 3 100 900 3 100 2 000 4 600 3 600 4 900 3 700 39 800Out 6 010 3 805 1 550 4 805 1 500 2 085 5 670 5 335 2 525 5 515 2 375 4 510 45 685End 8 673 6 663 6 858 7 808 6 403 8 003 6 818 4 248 913 2 988 1 073 3 598 2 788 2 788

232 Money in the organization
government agencies. These were covered in Chapter 1 when dealingwith external money transfers.
We can see from the cash flow figures that at all times a positivebalance was maintained in cash.
Should this have become negative, then action would have to havebeen made. This could be arranging an overdraft or delaying somepayment, but may be difficult to achieve in this example as most of theexpenses had to be paid in advance due to little history of pastsuccessful trading by this organization. Companies with more historycan normally arrange credit with their suppliers.
It is vital to make a budgeted cash flow for the future to determinewhen spending will occur and ensure that sufficient funds are availableto cover it. Otherwise you would have to arrange an overdraft ratherurgently.
The profit and loss account and thebalance sheet
Using the data in Table 5.3.1, we will prepare these two interconnectedaccounting documents. The format we will use is called the vertical asall figures are complete in the one set of columns.
We require some further information on present material and productstocks, depreciation, and some information from last year’s balancesheet.
Stock and material usage
Material usage = purchases + opening stock (closing material stock inprevious year) – closing stock
= £1104 + £12 360 – £1710
= £11 754
In this case we have no product stock. A similar calculation would haveto be made if there was.
Note that the closing stock figure is entered into the balance sheet asa current asset.
Depreciation
This is calculated as shown in Figure 5.3.1 as part of the balance sheetand then transferred to the profit and loss account. In this case, thecalculations have all been made on the basis of 25% of the old value.The new value of the asset is shown in the balance sheet.
Preparation of the profit and loss account
This proceeds using the above figures and the remaining information istransferred from the cash flow statement and shown in Figure 5.3.2.
This gives two important values:
� Gross profit after taking off the cost of manufacturing of £19 079,and
� Net profit after tax of –£5429, i.e. a loss of £5429.

Money in the organization 233
Note: no tax is due as no profit was made – the loss can be carriedforward to set against any future profits.
We shall examine how well the company is doing by evaluating somekey ratios in Section 5.4 later.
Completion of the balance sheet
This is completed by transferring data from the cash flow statement andthe profit and loss accounts and is shown in Figure 5.3.1.
Net working capital shows the difference between short-termliabilities and short-term assets. The short-term liabilities include what
Figure 5.3.1 Preparation of profit and loss account from cash flow statement. All values are shown in £s,unless otherwise stated
Figure 5.3.2 Preparation of balance sheet from cash flow statement. All values are shown in £s, unlessotherwise stated

234 Money in the organization
is owed, but not paid. Net working capital should be positive to showthat, in the short term, the business can repay its short-term liabilitiesthrough its short-term assets.
The reason for the balance sheet being so named is simple – it showsthat the organization has a monetary balance between what it owns (thenet short-term and long-term, or fixed, assets) and what it owes (thelong-term liabilities, i.e. the capital employed made up of the owner’sinvestment and long-term loans). There should be no difference, i.e.they are in balance.
Any profit produced belongs to the owner – so any loss must also beborne by the owner, up to the limit of his liability. The reserve headingshown under owner investment denotes profit which has been retainedin the business (i.e. not paid out as dividends, but still owed to theowners). It is produced by adding this year’s profit (or loss) retained tothe previous year’s reserves.
In this case both the previous year’s and the current values havenegative values. This means the net owner’s investment is decreasing –this is fairly common in a new company but requires careful monitoringso that a profitable stage is reached soon.
On the good side, there has been a positive cash flow over the lastfour months.
Some common items which have not occurred in this particular profitand loss account and balance sheet, but may in other companies,include:
� Allowance for bad debt. Some of the money owed may not berecovered because of customers going out of business, or fraud.This must come off the sales figure in the profit and loss account.
� Intangible assets:– Goodwill – an amount paid for another business over and above
the physical value of the assets gained – this is depreciated justas a fixed asset.
– Intellectual property such as patents – sometimes difficult tovalue, but may be a source of earnings, or may be sold off toanother business.
– Prepayment and accruals: If any made, or due to be paid thenthis should be entered. Prepayments would appear under currentassets and accruals under current liabilities. Tax due could comeunder these headings, as could rent paid in advance.
– Revaluations: Where carried out, it must be described inaccompanying notes with the basis of that revaluation.
Keeping the books
The process of book-keeping is one which often gives people problemsin understanding. The basic process itself is simple – anyone who has abank account should be able to understand entries. The difficulty comesin the multitude of different books and ledgers used, identifying whichmoney flows where and making the many entries. Thankfully, modernaccounting packages mean that the computer does most of the detailedentries.
Using the same data as in the cash flow shown in Table 5.3.1, theprocess is as follows.

Money in the organization 235
The books
There are a multitude of separate accounts called books and ledgers (asthat is what they once physically were). All transactions are recorded inthem:
� Cash books: A book of first entry. Records cash and banktransactions.
� Day books: Also a book of first entry. Records cash and credit salesand purchases.
� Ledgers: Used to store and accumulate accounting information:– General/nominal ledger – stores different accounts of the items
in profit and loss account and balance sheet.– Sales ledger – what customers owe (debtors).– Purchase ledger – what is owed to suppliers (creditors).
Meaningful classification of financial information is fundamental to itseventual usefulness. There are four basic types of accounts:
� Expenses and sales: These are normally used during the accountingperiod. They will be closed off and transferred to the trading, profitand loss account at the end of a trading period. They will restart inthe next period with no entries.
� Assets and liabilities: These remain open at the end of a period asthey normally have a residual value that will continue to be used bythe organization in the future. They will be balanced and then theirvalue will be copied to the balance sheet. This balance remains inthese accounts to start off the next period.
The double entry system
Every financial transaction is listed in these accounts and involves anexchange of equal value shown as two associated entries – in differentaccounts. This is the double entry system.
� Whatever comes into the business is debited to an appropriateaccount.
� Whatever is going out of the business is credited to an appropriateaccount.
� Transferred amounts between accounts are shown as a debit entryand a corresponding credit entry.
You may think that accountants do the books in a mirror image towhat you are used to seeing in your bank statements. This is because weare used to interpreting our bank balance from our viewpoint. Thestatement is correctly prepared looking at matters from the bank’sviewpoint. It is our definition of credit and debit that is different to thoseused in accounting. The problem is that our definition is becoming thenorm outside accountancy – which causes problems when we firstexamine book-keeping.
Your deposit coming in is a debit on the bank’s cash book and thismust have a corresponding credit entry in another account – yours. It isa liability on the bank to pay you. It sounds confusing; you may want toread these paragraphs again after we work through some examples.
Key point
Every transaction will appearas two entries – once as adebit entry and the second asan equal credit entry. Nor-mally in a different account.

236 Money in the organization
It is important that you think of the terms debit and credit in theopposite way to that when you read your bank statement. This is the keyto understanding book-keeping. Any money going in is a debit andmoney coming out is a credit.
Book and ledger accounts
If we take the data shown in the balance sheet (Figure 5.3.1), then wewould have the following accounts. We will identify them, give them acode and classify them under the four headings.
ACCOUNT CODE DESCRIPTION CLASSIFICATIONShares capital (CL.1) Money invested by owners LiabilityReserves (CL.2) Profits retained in business LiabilityLoan (CL.3)) Long-term loans LiabilityCash book (CB.1) For money in and out of the
businessAsset
Sales (SB.1) For sales made (all credit) SalesPurchases (PL.1) For raw material purchases ExpenseStock (SL.1) For movements in and out of
stockExpense and asset
Equipment (CA.2) Value of existing equipment AssetDirect wages (NL.1) Payment to direct staff ExpenseIndirect wages (NL.2) Payment to indirect staff ExpenseRent (NL.3) Payment for rent of building ExpenseCarriage (NL.4) Payment for carriage of
productExpense
Miscellaneous (NL.5) Payment for small items,e.g. stationery, postage, etc.
Expense
Travelling (NL.6) Payments such as fuel,insurance, road tax, etc. forcar
Expense
Accountant (NL.7) Payment to accountant ExpenseBank charges (NL.8) Interest and bank charges Expense
The codes are to ease identification and reduce writing within theaccounts when completing them. The terms used are historic and do notsignify any real difference today. The codes used are:
CL = capital ledger – where long-term liabilities are recorded.CA = capital asset – where long-term, i.e. fixed, assets are recorded.CB = cash book – money in the bank.SB = sales book – sales made.PL = purchase ledger – purchases made.SL = stock ledger – records of the value of stock (inventory).NL = nominal ledger – other expenses.
There will also be other accounts such as tax due and dividend paidwhich are not activated yet. Later in the company’s life there could alsobe further accounts, or some accounts such as equipment could be splitinto transport, office and process plant.
It will take some time to prepare full detailed accounts, so let’s startright at the beginning to show what happens with the initial money inthe bank, i.e. the cash book. We shall assume that money flows takeplace on the last working day of the month:

Money in the organization 237
CASH BOOK (CB.1)All figure are in £s
DEBIT CREDITDate Transaction Amount Date Transaction Amount
1.1 b/f (CB.1) 8 672 31.1 Purchases (PL.1) 96031.1 Sales (PL.1) 4 000 31.1 Wages (WL.1) 500
31.1 Wages (WL.2) 50031.1 Rent (NL.3) 2 50031.1 Carriage 30031.1 Misc. (NL.5) 50031.1 Car 20031.1 Bank 55031.1 c/f to Feb. (CB.1) 6 662
Sub-total 12 672 Sub-total 12 67231.1 b/f from Jan.
(CB.1)6 662
These entries should balance against each other at the end of January.The last entry on the credit side of £6662 is required to give this balance.Where there is a credit entry there must be an equal debit entry. That ismade to reopen the cash book at the beginning of February. The termsc/f and b/f are abbreviations for carry forward and brought forwardrespectively.
All the credit entries above would have a corresponding entry in thenoted account, for example:
PURCHASE LEDGER (PL.1)All figure are in £s
DEBIT CREDITDate Transaction Amount Date Transaction Amount
31.1 Purchase (CB.1) 960 31.1 To stock (SB.1) 960
The value of the purchases are immediately transferred over to the stockaccount, which is a special account supplying information for both thebalance sheet and the profit and loss account. It appears as a debitentry.
At the end of the accounting year, the b/f figure in the asset andliability accounts is copied into the balance sheet, but remains in theaccount as that b/f value:
CASH BOOK (CB.1)All figure are in £s
DEBIT CREDITDate Transaction Amount Date Transaction Amount
1.12 b/f (CB.1) 3598 29.12 Purchase (PL.1) 228029.12 Sales (PL.1) 3700 29.12 Wages (WL.1) 640
29.12 Wages (WL.2) 120029.12 Carriage 22529.12 Misc. (NL.5) 9529.12 Car 7029.12 c/f next year CB.1 2788
Sub-total 7298 Sub-total 729829.12 b/f (previous
year CB.1)7 298
This value opens the next year’s cash book account and is also copied(note – not transferred) to the balance sheet where it appears as a debit.

238 Money in the organization
The stock account is actually an asset account and is the source forthe stock figure copied to the balance sheet. However, it must contain atransaction to show the material usage.
If we look at this account, we find that up until the year end only thevalue of the opening stock and the purchases appear (in the debitcolumn) to give a sub-total of £13 464. This is not the value that we haveas physical stock as much of it has been used in manufacturingproducts.
At the year end, a physical stock check finds the actual closing stockto be £1710. The difference of £11 754 is attributed to the material usedup in the manufacturing process.
Therefore on the credit side we show the closing stock value and anentry which is transferred to the profit and loss account, where it appearsas a debit entry – remember double entry principle.
STOCK (SB.1)All figure are in £s
DEBIT CREDITDate Transaction Amount Date Transaction Amount
1.1 b/f (SL.1) 1 104 29.12 To P&L 11 75431.1 Purchases (PL.1) 960 29.12 c/f Closing stock 1 71029.2 Purchases (PL.1) 2 28028.4 Purchases (PL.1) 2 28031.7 Purchases (PL.1) 2 28031.10 Purchases (PL.1) 2 28029.12 Purchases (PL.1) 2 280
Sub-total 13 464 Sub-total 13 46429.12 b/f (opening
stock – SB.1)1 710
The opening/closing stock value is copied to the balance sheet.This time we will use the credit/debit format to display the results. All
asset accounts will appear on the debit side under long- or short-termheadings. Liabilities appear as credit entries:
BALANCE SHEETAll figure are in £s
DEBIT CREDITAccount Amount Transaction Amount
CURRENT ASSETS CURRENT LIABILITIES29.12 Bank (CB.1) 2 788 29.12 Accountant (NL.7) 75029.12 Stocks (SB.1) 1 710 29.12 Bank charges (NL.8) 55029.12 Debtors (SL.1) 7 600 29.12 Working capital 10 798
Sub-total 12 098 Sub-total 12 098
LONG-TERM ASSETS LONG-TERM LIABILITIES29.12 Working capital 10 798 29.12 Bank loan (CL.3) 12 50029.12 Equipment (CA.2) 11 250 29.12 Owner’s investment 17 500
29.12 Reserves (CL.2) –7 952Sub-total 22 048 Sub-total 22 048
Both sides are in balance.The working capital is the balancing value in the current assets and its
double entry appears on the debit side in the long-term capital andliability section.

Money in the organization 239
Similarly, we produce the profit and loss account by closing off allsales and expense accounts and transferring their balances to the profitand loss account, leaving them empty ready for the start of the newyear’s trading.
Taking the direct wages account, we have:
DIRECT WAGES (NL.1)All figure are in £s
DEBIT CREDITDate Transaction Amount Date Transaction Amount
31.1 Wages (CB.1) 500 29.12 Closing (P&L) 755029.2 Wages (CB.1) 50031.3 Wages (CB.1) 50028.4 Wages (CB.1) 50031.5 Wages (CB.1) 50030.6 Wages (CB.1) 64031.7 Wages (CB.1) 64031.8 Wages (CB.1) 68029.9 Wages (CB.1) 74031.10 Wages (CB.1) 95030.11 Wages (CB.1) 76029.12 Wages (CB.1) 640
Sub-total 7550 Sub-total 7550
Note: the sub-total for the debit entries has been transferred to the profitand loss account leaving a debit balance of zero to start off the nextyear.
The completed profit and loss account looks like:
PROFIT AND LOSS ACCOUNTAll figure are in £s
DEBIT CREDITAccount Amount Transaction Amount
TRADING ACCOUNT29.12 Materials (SB.1) 11 754 29.12 Sales (SL.1) 43 40029.12 Distribution (NL.4) 3 25529.12 Direct wages (NL.1) 7 55029.12 Plant deprec. (DL.1) 2 06029.12 Gross profit 18 779
29.12 Indirect salaries (NL.2) 10 600 29.12 Gross profit 18 77929.12 Rent (NL.3) 5 00029.12 Misc. (NL.5) 1 83029.12 Car (NL.6) (CL.2) 2 09029.12 Account (NL.7) 1 10029.12 Bank charges (NL.8) 2 20029.12 Office deprec. (DL.1) 75029.12 Car deprec. (DL.1) 93829.12 Loss (CL.2) –5 729
Again the totals balance.The flow of the written transactions is shown in Figure 5.3.3.In order to check during the financial year that all entries are being
made correctly, many organizations carry out a trial balance (sheet) atother times than the year end. This is just a check process, it does notgo into an end of year statement. Again with the increase in computer-based accounts this can be done speedily.

240 Money in the organization
Problems 5.3.1
(1) What do you think will be a bank manager’s attitude if yousuddenly had to seek an overdraft in the middle of yourtrading year?
(2) Can you think of other separate accounts that a companymay wish to keep to add to the list on page 236?
(3) Try to complete the equipment account yourself. (Hint: usevalues already shown in Figure 5.3.1 for start values anddepreciation.)
(4) Complete entries for another expense account – such as theindirect salary. (Hint: you can check your answer by lookingat the balance sheet in Figure 5.3.1.)
(5) Get a public company’s published account and see if you canfollow the cash flow over the year that produced the newbalance sheet.
Figure 5.3.3 Cash flow through the accounts
5.4 Budgetingand theinterpretation ofresults
Once operations have been completed, it is possible to analyse howeffective they have been in financial terms. This involves firstdeveloping a standard, or budget, breakdown of the expected costs andanalysing why differences have occurred.
Everyone has personal experience of having to spend within a setbudget. We have a finite income and many things we would like to buy,but we cannot buy all of them, as our money does not go far enough.
Every organization has the exact same problem as individuals do.Pressure to spend on items which will make life easier, more prestigious

Money in the organization 241
or more enjoyable, but a limited income. Every section has somethingthey would like to spend money on – such as more people or a newcomputer.
We discussed in Section 5.1 techniques for justifying expenditure.These are difficult and time consuming to apply to every small decisionthat is made. We need another method that will enable managers, andincreasingly other employees, to know how much they can spend andwhat they should be spending that money on. This is what budgeting isall about.
As when we produce a manpower plan (see Chapter 2, Section 2.1),we have to look at the future business plan for the organization. We thenhave to look at each department and section to see what resources areconsidered necessary to meet that plan. We cost these resources toproduce a budgeted cash flow of the outgoing expenses and capitalspending for each section (see Figure 5.4.1).
From these sections’ cash flows and the incoming money, wecalculate what the overall resultant profit and loss will be. This is a long,and fairly tedious but necessary, task, which requires the involvement ofall managers as this review sets what resources will be available duringthe budget period.
Only if the anticipated end result meets the business plan, can we saythat we are relatively happy with the budget. Should the anticipated cashflow not meet the business plan then the budgets need to be revised untilit does.
However, that is not the end of the story, we need to be continuallycomparing the actual cash flow with the budgeted cash flow to ensurethat the targeted performance is met.
Preparing the budget
The best way to demonstrate this is to build a complete budget. We willtake as our example the business that we showed the actual results forin Section 5.3. We will go back to the year before and build up a budgetfor the business.
Figure 5.4.1 Preparing thebudget

242 Money in the organization
Sales budget
The owner anticipated the annual sales would be 2400 @ £20 each.These he broke down into the following monthly figures:
150, 150, 160, 170, 180, 180, 200, 220, 220, 240, 250, 280
Associated with these were materials, carriage and labour:
� Material is £4.80 per product unit.� Carriage is £1.50 per product unit.
Labour was a little more problematic. The owner himself had beenproducing the units, but he was finding it difficult to find time to makethem, sell them and spend time on developing a new product. Heconsidered himself capable of making four units per hour. He planned totake on a part-time worker to train to manufacture the product. Thiswould release the owner for selling and development.
This part-time operative was planned to be taken on in the fourthmonth. An initial allowance of £500 per month was made to cover 50hours per month. This would start as a training budget and would reduceas the operative gradually came up to speed over a period of fourmonths.
It was decided to make the standard labour cost of producing the salesfigure £2.50 per unit. This was based on an expected cost of £10 perhour for the operative during which four units would be produced. Theowner’s salary initially would be split using this figure with theremainder going into indirect wage cost. As the operative came up tospeed, the portion set against the owner’s salary would reduce until bythe eighth month it reduced to zero.
The owner then prepared a cash flow budget as in Table 5.4.1. Thefigures for miscellaneous and car expenses were estimated and spreadover the year. The bank charges were considered to be the same as thefirst year and the accountant’s cost expected to be a little more.
PROFIT & LOSS STATEMENT
Sales 48 000 % of sales MarginOpen St 1 104Purchase 11 520Close St 1 104Materials used 11 520Distribution 3 675Labour 6 850Prime cost 22 045Plant depreciation 2 062Total manf. cost 24 107 50%Gross profit 23 893 50%Salaries 9 856Rent 5 000Misc. 1 200Car 1 850Acct. 700Bank 2 200Sub-total 20 806Office depreciation 750Car depreciation 938Total overheads 22 494 47%Net profit 1 399 3%
Figure 5.4.2 Budgeted profitand loss account

Table 5.4.1 Budgeted cash flow
Month: Previousyear
figures
1 2 3 4 5 6 7 8 9 10 11 12 Totalfor
year
Outstandingat
year end
Sales – units 150 150 160 170 180 180 200 220 220 240 250 280 2 400Sales – value 3 000 3 000 3 200 3 400 3 600 3 600 4 000 4 400 4 400 4 800 5 000 5 600 48 000
CASH FLOWRevenue 4 000 3 000 3 000 3 200 3 400 3 600 3 600 4 000 4 400 4 400 4 800 5 000 46 400 5 600
OutgoingsMaterial – units 150 150 160 170 180 180 200 220 220 240 250 280 2 400Material – cost 720 720 768 816 864 864 960 1 056 1 056 1152 1 200 1 344 11 520Training wages 500 250 50 50 850
Std labour 375 375 400 425 450 450 500 550 550 600 625 700 6 000Indirect wages 675 675 600 184 386 286 1 050 1 200 1 200 1 200 1 200 1 200 9 856Rent 2 500 2 500 5 000Carriage 300 225 240 255 270 270 300 330 330 360 375 420 3 675Misc. 100 100 100 100 100 100 100 100 100 100 100 100 1 200Car 100 100 100 100 100 100 750 100 100 100 100 100 1 850Accountant 450 200 650 500Bank 550 550 550 550 2 200 550Tax 0
CASH FLOW CALCULATION (Note that payments against the first year accounts are shown in shaded boxes) CheckStart 8 673 7 353 8 158 8 950 8 770 9 750 11 230 10 570 8 534 9 598 9 936 11136 8 673In 4 000 3 000 3 000 3 200 3 400 3 600 3 600 4 000 4 400 4 400 4 800 5 000 46 400Out 5 320 2 195 2 208 3 380 2 420 2 120 4 260 6 036 3 336 4 062 3 600 3 864 42 801End 8 673 7 353 8 158 8 950 8 770 9 750 11 230 10 570 8 534 9 598 9 936 11136 12 272 12 272

244 Money in the organization
This produced a budgeted profit of £1399 (see Figure 5.4.2) which,although low, was reasonable as it was the business’s second year andthe owner anticipated drawing £13 200 as a salary in addition.Although a profit was expected, no allowance was made for tax as thefirst year’s losses (£2223) could be offset against the anticipatedyear’s profits.
Analysing the results
Unfortunately, as we saw in Figure 5.3.2, the anticipated profits turnedout to be a loss of £5729 – a difference of £7128 less than thatbudgeted for.
Accountants use the terms favourable and adverse instead ofgood and bad.
� Favourable: Expenses less (negative) than anticipated orincome greater (positive) than anticipated.
� Adverse: Expenses more (positive) than anticipated orincome less (negative) than anticipated.
The anticipated figures are termed as the standard values. Thedifferences we call variances and it is important that we analyse thesevariances and take action to rectify them, or make allowance for themif they are not changeable. To do this we should break the variancedown into constituent causes:
Variance analysis
There are different control formulae which can be used toanalyse variances, i.e. the difference from that budgeted for:
Overall control ratios
These are the key ratios which we should keep our eye on toensure that we are working efficiently and making effectiveuse of our facilities on a time basis:
� Productivity performance: A measure of how effective ourpeople are actually working. See appendix to Chapter 3for further discussion on how to determine this. A suitablemeasure is:
Standard hours for items produced × 100%
Actual hours worked

Money in the organization 245
� Capacity usage: This looks at how much of our people’stime we actually used in relation to what we set out to doin the budget. A suitable measure is:
Actual hours worked × 100%
Budget hours
� Volume index: Although this looks like the same as theproductivity measure, it is using the hours that weoriginally set out to work as the base. It indicates howsuccessful we were at bringing in work for them to do. Asuitable measure is:
Standard hours for items produced × 100%
Budget hours
Note that these measures connect as follows:
Productivity performance =volume index
capacity usage
Sales
� Sales revenue variance = (actual price/unit × actual sold)– (standard price/unit × budgeted sales)
� Selling price variance = (actual price – standard price)/unit × actual sold
� Sales effectiveness = (actual sold – budgeted sales) ×standard price/unit
Note: Sales revenue variance = selling price variance + saleseffectiveness.
These indicate the reason for having a revenue different tothat anticipated. Was it the quantity sold, i.e. the saleseffectiveness, or the price that was charged, i.e. the sellingprice variance.
Materials
� Material cost variance = (actual price/unit × actual usage)– (standard price/unit × standard for number produced)
� Purchase price variance = (actual price paid – standardprice)/unit × actual usage
� Material usage variance = (actual usage – standardusage for number produced) × standard price/unit
Note: Material cost variance = purchase price variance +material usage variance.
These indicate the reason for having a material costdifferent to that anticipated. Was it the price paid for thematerial, i.e. the material price variance, or the amount ofmaterial used, i.e. the material usage variance?

246 Money in the organization
Labour
� Labour cost variance = (actual hourly rate × actual hours)– (standard hourly rate × standard hours for unitsmade)
� Labour rate variance = (actual hourly rate – standardhourly rate) × actual hours
� Labour efficiency = (actual hours – standard hours fornumber produced) × standard hourly rate
Note: Labour cost variance = labour rate variance + labourefficiency.
These indicate the reason for having a labour expensedifferent to that anticipated. Was it how well we used thelabour, i.e. the labour efficiency, or the hourly rate they werepaid, i.e. the labour rate variance.
These formulae allow us to look beyond the straight variance and findunderlying reasons. It enables us separate numerical and cost/pricecauses.
Let us go back to the example and compare the items in the actualprofit and loss account against those budgeted for (see Figure 5.4.3).
When we see so many figures it can easily become a little confusing.What are the reasons for all these variations? For example, this analysisshows a favourable variance for distribution – is this good? Initially theanswer may be yes, but as less was sold than budgeted for, we wouldexpect a drop in spending on distribution.
To adjust those items which should vary with output, we can producewhat is termed a flexed budget. This is simply adjusting the variablecosts in line with sales by multiplying by the ratio of actual unit sales to
Budget Actual Variance
Sales units 2 400 2 170 –230Sales value 48 000 43 400 –4 600
Materials used 11 520 11 754 234Distribution 3 675 3 255 –420Labour 6 850 7 550 700Prime cost 22 045 22 559 514Plant depreciation 2 062 2 062 0Total manf. cost 24 107 24 621 514Gross profit 23 893 18 779 –5 114
Salaries 9 856 10 600 744Rent 5 000 5 000 0Misc. 1 200 1 830 630Car 1 850 2 090 240Acct. 700 1 100 400Bank 2 200 2 200 0Sub-total 20 806 22 820 2 014Office depreciation 750 800 50Car depreciation 938 938 0Total overheads 22 494 24 508 2014Net profit 1 399 –5 729 –7 128Figure 5.4.3 Profit and loss
variance
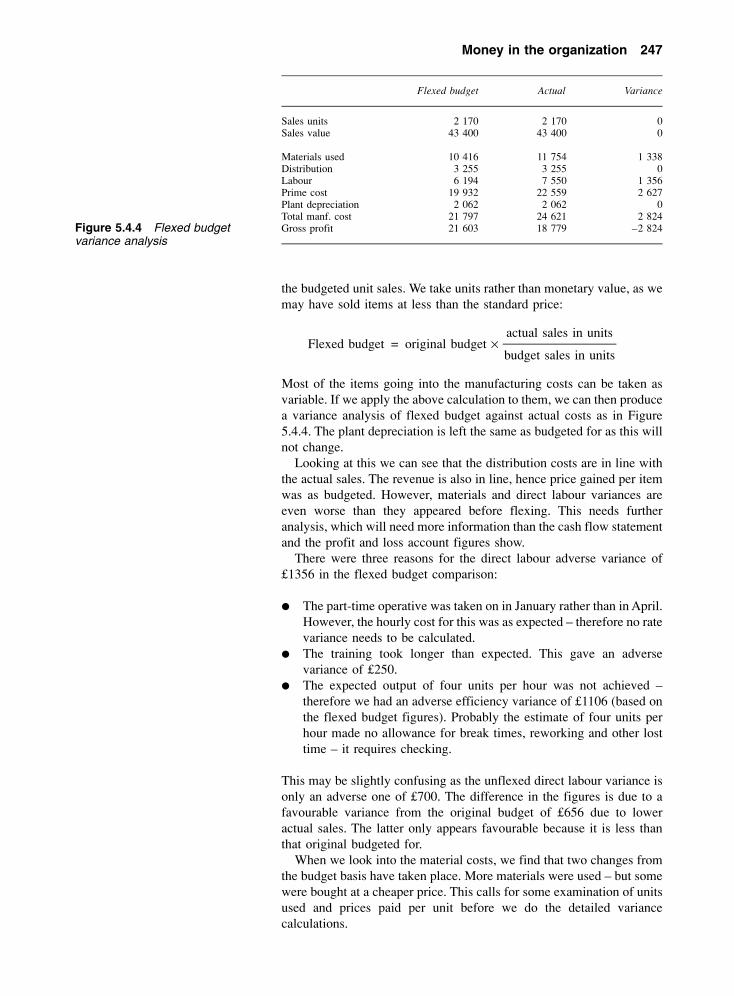
Money in the organization 247
the budgeted unit sales. We take units rather than monetary value, as wemay have sold items at less than the standard price:
Flexed budget = original budget ×actual sales in units
budget sales in units
Most of the items going into the manufacturing costs can be taken asvariable. If we apply the above calculation to them, we can then producea variance analysis of flexed budget against actual costs as in Figure5.4.4. The plant depreciation is left the same as budgeted for as this willnot change.
Looking at this we can see that the distribution costs are in line withthe actual sales. The revenue is also in line, hence price gained per itemwas as budgeted. However, materials and direct labour variances areeven worse than they appeared before flexing. This needs furtheranalysis, which will need more information than the cash flow statementand the profit and loss account figures show.
There were three reasons for the direct labour adverse variance of£1356 in the flexed budget comparison:
� The part-time operative was taken on in January rather than in April.However, the hourly cost for this was as expected – therefore no ratevariance needs to be calculated.
� The training took longer than expected. This gave an adversevariance of £250.
� The expected output of four units per hour was not achieved –therefore we had an adverse efficiency variance of £1106 (based onthe flexed budget figures). Probably the estimate of four units perhour made no allowance for break times, reworking and other losttime – it requires checking.
This may be slightly confusing as the unflexed direct labour variance isonly an adverse one of £700. The difference in the figures is due to afavourable variance from the original budget of £656 due to loweractual sales. The latter only appears favourable because it is less thanthat original budgeted for.
When we look into the material costs, we find that two changes fromthe budget basis have taken place. More materials were used – but somewere bought at a cheaper price. This calls for some examination of unitsused and prices paid per unit before we do the detailed variancecalculations.
Flexed budget Actual Variance
Sales units 2 170 2 170 0Sales value 43 400 43 400 0
Materials used 10 416 11 754 1 338Distribution 3 255 3 255 0Labour 6 194 7 550 1 356Prime cost 19 932 22 559 2 627Plant depreciation 2 062 2 062 0Total manf. cost 21 797 24 621 2 824Gross profit 21 603 18 779 –2 824Figure 5.4.4 Flexed budget
variance analysis

248 Money in the organization
� Products produced were 2170.� Budgeted material cost per unit was £4.80.� After January’s purchases of 200 units, the owner started buying in
bulk which gained him a discount of 5%, making the new cost of£4.56.
� Opening stock was £1104 valued at £4.80 each giving a unit stockof 230 (£1104 ÷ £4.80).
� Closing stock was £1710 valued at £4.56 each giving a unit stock of375 (£1710 ÷ £4.56).
� Total units purchased was 2700 (200 at £4.80 and 2500 at £4.56).� Usage was 2555 (230 + 2700–375).
Therefore we have a gain through buying cheaper (after the initial 200)but this has been offset by using more material. If we exclude the 200bought at the budgeted cost, we can now see the monetary effect ofthese changes, using the following basis:
� Number produced = 1970 (2170–200)� Material units used = 2355 (2555–200)� Standard cost per unit = £4.80� Actual cost per unit = £4.56
Cost variance = (actual price/unit × actual usage) – (standard price/unit × standard for number produced)
= (£4.56 × 2355) – (£4.80 × 1970)= (£10738.80) – (£9456)= £1282.80
Price variance = (actual price – standard price)/unit × actual usage= (£4.56 – £4.80) × 2355= –£565.20
Usage variance = (actual usage – standard usage for number produced)× standard price/unit
= (2355 – 1970) × £4.80= £1848.00
Check: does Price variance + usage variance = cost variance?–£565.20 + £1848.00 = £1282.80
We can see that there was a favourable variance of £565.20 due to alower purchasing price. This was not sufficient to offset the adversevariance of £1848.00 due to excess usage. Again this needs checking asit is about 20% extra usage which is a high figure. Perhaps some wasconsumed during early training which had not been allowed for.
Looking at the remaining expenses, the amount budgeted looks as ifit may have been optimistic – but again this needs to be examined andexplained.
Interpreting company accounts
In accountancy there are a number of ratios that are used to judge theeffectiveness of an organization’s operations. These are worked outfrom the figures contained in the profit and loss account and the balancesheet.

Money in the organisation 249
The ratios normally require two consecutive years’ figures to workout an average over a company’s financial year. However, we shalluse the one year’s result contained in Figures 5.3.2 and 5.3.2 forsimplicity.
Return on investment
In any investment, there is an associated risk. Normally the possibilityof a high return is linked to a high risk of getting considerably less –perhaps even losing the initial investment.
In the accounts the return is the net profit after all deductions foritems such as depreciation and tax but before any dividend is paid. Weneed to divide this by the capital employed – however, there are severalfigures we can use as the divisor. Remember always check what figuresare being used.
One way is to use the shareholder’s funds as the bottom line. Usingthe figures from our data, we have:
ROCE (Return oncapital employed)
=Net profit
shareholders’ funds (at year beginning)
=–5729 (a loss)
15 277 (initial investment + reserves)
= –37.5%
This means that the shareholders’ funds would be reduced to zero injust under three years if losses continued at this rate.
We could also use net assets, but we have to ensure that if a long-term loan is included in the funding then we add back onto the netprofit any interest charges incurred by that loan.
The bank, however, will not let matters approach a point wheretheir investment is too much at risk. They are liable to call in theirloan before a further year has passed unless returns substantiallyincreased.
Liquidity
If we examine the working capital of a company, we can see howquickly it can convert the current assets into cash to pay off the currentliabilities. If we have a minus figure as working capital it demonstratesthat we cannot meet our immediate needs and we are in trouble unlesswe can quickly find more cash.
Working capital ratios
The ratios used here indicate how quickly we should be ableto pay off our short-term creditors. The second is a more

250 Money in the organisation
severe test as it looks at a smaller base, i.e. as if the salessuddenly stopped. The ratios are:
Current ratio =current assets
current liabilities
Should always be > 1,preferably > 2
Quick ratio =debtors + cash
current liabilitiesShould normally be > 1
In our example, we can see
� Net current assets are £12 098.� Net current assets less stock are £10 388.� Net current liabilities are £1300.
Therefore,
Current ratio =12 0984
1300= 9.3, which is high
Quick ratio =10 388
819= 7.9, which is also high
Although both ratios are high, this is not necessarily a good indication.For example, if we could immediately convert our stocks and debtorsinto cash we could pay off 75% of our bank loan and save £1500 ininterest charges.
We need to know the reason behind the figures and see if they can bechanged to advantage:
� Being a new company, most of the purchasing is paid for in cash.We do not have credit with our supplier, as yet. If supplier creditcould be obtained this would immediately reduce the need for cash,which could help to reduce the bank loan. Better to use oursupplier’s money than our own.
� Customers should be paying for the goods after one month. Thefigure shown as owing indicates that they are taking longer and thisputs pressure on cash flow. If they could be persuaded to pay early,even on delivery, again this would reduce the need for borrowing.Excess pressure to pay may lose us business and is a negative aspectwe need to watch for.
� Raw material stocks represent almost two months’ supply –reducing these and only having enough to meet current needs wouldreduce this figure. It may be more costly buying more frequently,however.
Margins and mark-ups
In commercial terms margins can be expressed in two ways. It isimportant that we know exactly which figures are being used:

Money in the organisation 251
� Margins are based on the selling price – can look at gross and/or netfigures.
� Mark-ups are based on costs (buying price or manufacturing) –again can look at gross or net figures.
Both are usually expressed as percentages.Value added is another way of expressing mark-ups, and could be
expressed as a monetary value.
In our examples, we have the following figures.
� Sales = £43 400 i.e. 100% of sales revenuefigure.
� Manufacturing costs = £24 621 = 57% of sales revenue.� Gross profit = £18 779 = 43% of sales revenue
(i.e. margin on manufacturingcost).
� Overheads = £24 508 = 56% of sales revenue.� Total costs = £49 129 = 113% of sales revenue.� Net profit = –£5 729 = –13% of sales revenue
(i.e. margin on total cost).
We could alternatively express the third of these items as gross profit= 76% mark-up on manufacturing costs. Similarly we could expressthe fourth item, Overheads, as being 99.5% of manufacturing costs.
Therefore to find the sales breakeven point, we need to apply theconcept we used in Section 5.2 (page 222).
These figures are useful in letting us know by how much, if any, wecan adjust prices when under customer pressure to do so to increasesales.
Turnover ratios
Turnover simply means the number of times in a period that an averageitem is used up and replaced. There are three important ratios relating todebtors, creditors and stock:
Debtor ratios. Only includes sales made on credit. In our example, nosales were for cash.
Debtors’turnover
=sales on credit
end of year creditors=
43 400
7600= 5.71.
Debtor days =days in period
debtors’ ratio=
365
5.71= 64 calendar days.
Therefore the customers are taking over twice as long to pay as theterms allow. Extra effort is required to shorten this time, but this maymake our customers less eager to deal with us.
Key point
Profitmargin
=Profit
sales revenue
Mark-up =Profit
costs

252 Money in the organisation
Creditor ratios. In our data, suppliers were paid on delivery. If,however, we assume that one month’s credit was allowed then:
Creditorturnover
=purchases
last material purchased (creditors)=
12 360
2700= 4.58
Creditordays
=days in period
creditor turnover=
365
4.58= 80 days
This figure is a little misleading as the business does not purchase everymonth, but gives an idea of what levels can easily be attained tocounteract debtors taking a long time to pay. Organizations should usecreditors to balance the effect on cash flow of debtors.
Stock ratios. We can base this particular example on the cost of rawmaterial only as no product stock is held. Where work-in-progress orproduct stock is held, we need to include it at the cost of manufacture– note not anticipated selling price.
Stock turnover =cost of sales
closing stock=
12 360
1704= 7.25
Stock days =days in period
stock turnover=
365
7.25= 50 days
As we mentioned when looking at the current ratio, this is high andshould be reduced to release cash.
Gearing ratios
These indicate how the long-term funding of the company is supplied –loans or owners’ capital (shares and reserves). In the example at the endof year 2:
Gearing ratio (A) =long-term loans
net assets=
12 500
22 048= 57%
Gearing ratio (B) =long-term loans
owners’ capital=
12 500
9548= 131%
This indicates that currently the bank has a higher investment than theowner. This will make it difficult for the owner to ignore any suggestionmade by the bank.
If you are looking for a guide then a simple one could be:
� Where risks are heavy or rewards are low – risk other people’smoney rather than your own.
� However, if rewards are high then it may be less expensive toborrow and pay interest than share out the profits.

Money in the organisation 253
Share price ratios
The last set of ratios we are going to look at are related to share prices.Up until now we have not considered shares as our example has beenbased on a single owner.
In Chapter 1, we looked at the various patterns of ownership, andconcluded that most of the large companies are funded by the issue ofordinary shares. These shares, once issued, are bought and sold in stockmarkets by their individual owners.
The shareholders are the owners of the company and as such can, andoften do, have considerable influence on the management. Theshareholders’ primal concern is not so much the present net value of thecompany assets but more the value of their shares. These two values canbe considerably different.
Share prices can change considerably over a short period of time. Theprice is based on immediate factors and a mixture of other aspectsregarding their future potential. We will not attempt here to value abusiness, just to describe how various ratios connected with shares areworked out.
To do this, we will need a new set of data, for a different organization.Again this has been simplified for ease of understanding:
� Issued shares: 5 million @ £1, equal to £5 million.� Net profit after tax, but before payment of dividend: £1.2 million.� Declared dividend for year: £0.12 per £1 share, giving a payout of
£0.6 million.� Shares trading at a mid-market price of £2.25 each.
The various concerns are:
Share price growth and stability
Earningsper share
=net profit
number of shares=
£1 200 000
5 000 000= £0.24 per share
Yieldper share
=dividend
price of share=
£0.12
£2.25= 4.8%
Price/earnings(P/E)
=price of share
earnings per share=
£2.25
£0.24= 9.37
The P/E ratio of 9.37 represents the number of years to recoup the presentshare price based on present profits.
The actual share price will be affected by results from the organizationand this must be taken into account when setting a strategy.
Problems 5.4.1
(1) Set down what your weekly income is and what youroutgoings are. Are they the same? What can you do if yourspending is more than your income?

254 Money in the organisation
(2) Compare the individual items in the actual profit and lossagainst that budgeted for in Figure 5.4.3. Why are some ofthe items up and some down. Is every figure bad?
(3) Is the drop in distribution costs in Figure 5.4.3 in line with thedrop in sales from that budgeted for?
(4) Work out the percentage sales increase required to achievebreakeven, assuming no extra overhead spending is incur-red. (31%)
(5) Get the published account of two public companies and seeif you can explain the reason why the share prices aredifferent.

6 Meeting customerneeds
Summary
It is by satisfying customers in the marketplace that an organization grows and prospers. Tosatisfy the customer the organization needs to offer more than just physical products or bareservices, the customer is looking for a number of benefits.
This chapter will help you think about all that the customer needs and the best way to meetthem by aligning your internal operations to support the marketing effort. As an engineer you willneed to understand how the market works and what you can do to ensure that you gain and retaincustomers. This chapter introduces you to marketing techniques.
Objectives
By the end of this chapter, the reader should:
� understand the role of marketing and the structure of the marketplace in which a productexists and the factors affecting demand (Section 6.1);
� understand the need for and be able to apply forecasting techniques, allowing for theirdegrees of uncertainty (Section 6.2);
� appreciate the sources of information for and the techniques used in market researchexercises (Section 6.3);
� be able to analyse the factors demanded by customers and ensure that the organizationretains a competitive position (Section 6.4).
6.1 Themarketplace
This section takes a general look at the concept of marketing. It startswith explaining the role of marketing and aspects of supply anddemand. The importance of a product’s life cycle is introduced. Thesection completes with examining the distribution routes availableand aspects of promotion and selling.
Historically everyone lived in small communities where all demandwas catered for by local personnel, who were often multi-skilled. As

256 Meeting customer needs
communities grew in size, some specialization occurred formingspecific trades, such as cobblers and saddlers. Transport facilitiesseverely limited the area able to be serviced by a single tradesman,except in the larger towns. Some small businesses started upemploying a few people, but opportunities were limited as all workwas manual.
As transport developed, so did trade but initially only in luxurygoods which could not be easily supplied by local craftsmen. Thisluxury trade was mainly limited to the richer portion of society.
The industrial revolution made the mass production of certaingoods an economic proposition, as long as the new transport systemcould economically and swiftly move the product from the factory tothe customers. From this scenario, came the need for marketing toensure that the customer and the goods being produced matched.
It still tended to be a seller’s market, but the spread of theindustrial revolution soon introduced competition. Today that com-petition is truly worldwide with local products often competingagainst ones from half way round the world.
Marketing is no longer an optional choice – it has become anecessity for survival.
The role of marketing
The basic role of marketing is to match the resources of anorganization to the needs and wants of its environment. To do this itmust:
� Determine the internal factors which govern the total output ofthe organization, i.e. its ability to supply goods or services.
� Determine the external factors which influence the selection ofgoods, i.e. the demand.
Where there is a considerable mismatch between the internal resour-ces, then management must bridge that gap. They do this either bychanging the internal resources, or finding a market where theinternal resources are useful.
The functions covered by marketing are:
� Forecasting future trends in market demand.� Market research on their own present product and the
competitions’.� New product needs: To find needs which are not being met.� Pricing strategy: To determine what price their products should be
set at.� Promotional strategy: What advertising and other promotions are
required.� Distribution channels: To ensure the product reaches all potential
customers efficiently.� Customer support: Support required prior to and after sales.� Selling: The physical direct selling to the immediate customers.
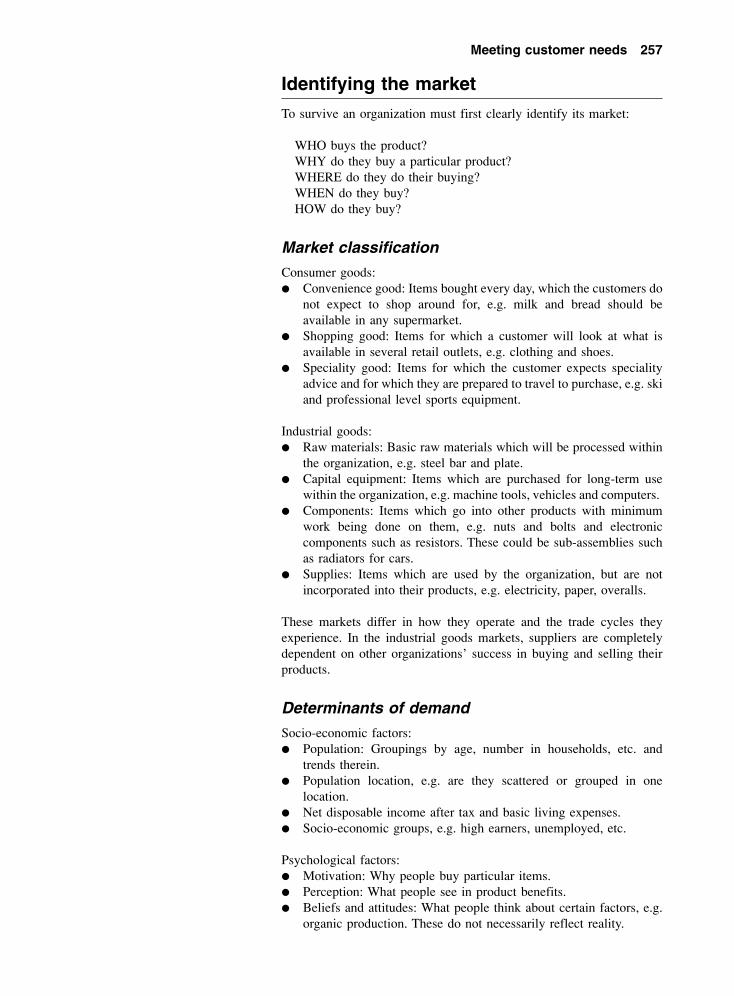
Meeting customer needs 257
Identifying the market
To survive an organization must first clearly identify its market:
WHO buys the product?WHY do they buy a particular product?WHERE do they do their buying?WHEN do they buy?HOW do they buy?
Market classification
Consumer goods:� Convenience good: Items bought every day, which the customers do
not expect to shop around for, e.g. milk and bread should beavailable in any supermarket.
� Shopping good: Items for which a customer will look at what isavailable in several retail outlets, e.g. clothing and shoes.
� Speciality good: Items for which the customer expects specialityadvice and for which they are prepared to travel to purchase, e.g. skiand professional level sports equipment.
Industrial goods:� Raw materials: Basic raw materials which will be processed within
the organization, e.g. steel bar and plate.� Capital equipment: Items which are purchased for long-term use
within the organization, e.g. machine tools, vehicles and computers.� Components: Items which go into other products with minimum
work being done on them, e.g. nuts and bolts and electroniccomponents such as resistors. These could be sub-assemblies suchas radiators for cars.
� Supplies: Items which are used by the organization, but are notincorporated into their products, e.g. electricity, paper, overalls.
These markets differ in how they operate and the trade cycles theyexperience. In the industrial goods markets, suppliers are completelydependent on other organizations’ success in buying and selling theirproducts.
Determinants of demand
Socio-economic factors:� Population: Groupings by age, number in households, etc. and
trends therein.� Population location, e.g. are they scattered or grouped in one
location.� Net disposable income after tax and basic living expenses.� Socio-economic groups, e.g. high earners, unemployed, etc.
Psychological factors:� Motivation: Why people buy particular items.� Perception: What people see in product benefits.� Beliefs and attitudes: What people think about certain factors, e.g.
organic production. These do not necessarily reflect reality.

258 Meeting customer needs
� Personality, e.g. attitude to credit, new technology, etc.� Reference groups: How certain groups are influenced by what a few
icons do, or wear.
Market segments can be forming and reforming continually.
Supply and demand
It is a common economic statement that price is a function of supply anddemand and it does to a greater or lesser extent.
� When prices are high, producers are encouraged to start producingas opportunities for profits appear.
� When prices are low, many producers find they cannot make a profitand withdraw from producing.
The converse also applies – when there is a shortage, prices rise until theextra profit to be gained entices others into supplying. This balances outthe demand and prices then fall again.
There are other factors which can affect supply and demand apartfrom price.
Factors changing supply relate to their impact on organizations’decisions relating to costs and profits:
� Weather, natural disasters and civil disruptions: This could besmall disruptions due to snow and localized strikes. It can also bedue to factors such as flooding and earthquakes.
� Technology: Here we are not only looking at what is available,but the take-up of the technology by both suppliers andcustomers.
� Taxation and subsidies: Here we mean the impact of these on thedecisions of organizations.
� Changes in costs of factors of production: Governmental decisionscan impact here, but there are also general movements in themarketplace.
Factors changing demand for particular products (include items such asthe net disposable income of individual consumers after paying taxesand covering their basic needs such as housing):
� Weather: Not only are there annual cycles, but many organizationsfind sales differ considerably depending on the weather. The foodindustry is particularly affected and this has led to majorsupermarket groups closing following the long range weatherforecasts.
� Prices of other products: This can cause changes in buying patterns– an example would be a steep rise in petrol prices. This wouldreduce money available to purchase other items such as meals out –it may also cause a switch to public transport (or so the governmenthopes).
� Fashion: As well as the normal fashion cycles there are other fadproducts which suddenly arise, and almost as quickly fade away. Anexample is merchandise attached to movies.

Meeting customer needs 259
� Credit availability: Loosening or tightening credit terms can impacton decisions on major purchases such as houses and cars.
� Advertising and promotion: Although they say that at least half ofthe money spent in advertising is wasted, it is recognized that asuccessful campaign can have significant effect on sales. Anexample is the Gold Blend series of adverts which is reputed to haveincreased the sales of this product by 30%.
� Population changes: Although these tend to be slow moving,nevertheless they can impact on profitability of certain niches. Anexample is the longer life attainment of the population leading to anincrease in grandparents spending on children’s items.
� Confidence about the future: Perhaps a key decision as this willdetermine if a person saves against the future, or spends as they earn– and perhaps beyond that by using credit.
Some products show different elasticity in their price:demand ratios.
Elasticity of the price:demand ratio
Some products are highly sensitive to a change in price,others less so. This sensitivity we term elasticity ofdemand.
� Elastic: When a 1% change in price results in a greaterthan 1% change in demand. Examples are usuallyshopping or luxury goods such as cars, etc.
� Inelastic: When a 1% change in price results in a lessthan 1% change in demand. Examples are usually basicitems such as electricity, food.
Note that often these descriptions relate to a relative priceand with changes in income, customers may switch betweencertain products. A good example of customers switchingproducts can be found by looking at the cars bought atdifferent stages in a person’s life as their income changes.
Product life cycle
Every product has a selling life cycle as shown in Figure 6.1.1. This isvery similar to the human life cycle:
� Conception: The basic idea for a product is conceived. This may beafter careful consideration of many factors, or can come as a flashof inspiration. Many ideas come to nothing at this stage.
� Pregnancy: After conception, the product idea must be developedwithin the organization to become fully fledged through a process ofdesign, research and development. Most product ideas die at thisstage.
� Birth: The launch of a new product. Many products fail to have asuccessful launch.

260 Meeting customer needs
� Infancy: Growth of sales. During this period there will be a lot ofchanges and uncertainties.
� Maturity: The product sales have reached a plateau. This may go onfor years, e.g. Mars bars – or may be for a short period only, e.g.computers and fashion clothing.
� Old age and decline: Sales start to slow down and decline.� Death: The product stops selling. Continued support for the product
in the form of spare parts may still have to continue. It is notunusual to have a demand for spare parts for over ten years after awhite goods item, e.g. a washing machine, has stopped beingmade.
The main problem with the product life cycle, is that it is difficult topredict what is going to happen in the future. Most product ideas dieduring the design phase, many fail to break out of the early growthperiod, whilst others appear to be in a state of maturity for decades.
It may be possible to extend the product life by redesigning itperiodically. This can give rise to a surge and extension in the productlife cycle as shown in Figure 6.1.2. The car market is a prime exampleof this with the updating of a named model range after two to threeyears. It may be fifteen years before bringing out a completely newname model.
It is important that an organization maintains a steady supply of newproducts at various stages of their life cycles to maintain an even cashflow into the organization as in Figure 6.1.3. Many companies relyheavily on sales from products which have been introduced orredesigned within the last five years.
Many products are experiencing shortening life cycles. At the sametime, products are becoming more complex and sophisticated. The
Figure 6.1.1 The product lifecycle
Figure 6.1.2 Product life cycleextended due to redesign ofproduct

Meeting customer needs 261
complexity tends to increase development time. Figure 6.1.4 shows thisconflicting requirement.
It was once possible to change products into a different part of themarket as their sales declined in one region. With worldwidecompetition this is no longer possible. It is therefore important thatseveral things happen:
� Design cycles are managed to produce new designs in a short timeperiod.
� Launch dates are firmly met.� Opportunity is taken to maximize sales when at maturity.� The manufacturing facilities are flexible in product and quantity.
The historic sequence of serial design could no longer be appliedbecause the increased complexity led to jumps in communicationchannels. The method of organizing the design process had to changefrom a series set of stages into one where all aspects were beingconsider concurrently (see Figure 6.1.5).
It is estimated that a late product launch has more affect onprofitability than cost overruns of the design stage, or even in extra costsin producing the product itself. An estimation of these effects is shownin Figure 6.1.6.
The reason for the lateness of a product having such an effect onprofits is that late products capture a smaller share of the availablemarket. If an organization comes late into a market it finds thecompetition have established their products and they will therefore gainfewer customers. The product sales will therefore have a smallerenclosed area.
The types of new products are:
� Replacement: For existing own, or competitors’, product.� Extension: To the existing range of products.
Figure 6.1.3 Product lifecycles for overlapping productlaunches
Figure 6.1.4 Comparisonbetween product life spans andproduct development time dueto complexity in products

Mar
ket
geo
gra
ph
y
Pre
sen
tN
ew
AA
BB
262 Meeting customer needs
Figure 6.1.5 The designprocess – serial and concurrentinvolvement of different sections
Figure 6.1.6 Effect on profitsof different failures in productdevelopment
Figure 6.1.7 Dimensions ofthe geographic growth vector.(From New Corporate Strategy,Igor Ansoff (1988) (John Wileyand Sons))

Meeting customer needs 263
� New: Products outside the present range in the present market, orfor sale in a new market.
Ansoff’s matrix, as in Figure 6.1.7, shows the different type ofcombinations of products and markets.
In order of increasing risk, i.e. departing from what you know and aregood at, the strategies are:
� Market penetration: This means to sell more to existing potentialbuyers. This can only be gained from competition. An example isFord attempting to increase sales of its product range of cars.
� Product development: Launching new products to sell within thesame market. An example could be Ford introducing the Ka car.The problem here is that the new product may appeal to someexisting customers and they buy the new product rather than anexisting one. It is hoped that the gain of new customers outweighsthe customers who simply switch to a different product from thesame supplier.
� Market development: This means to find a new market altogether.Perhaps an example would be Ford’s decision to start selling theircars in Russia after the collapse of the USSR. The problem here isthat you will be competing with organizations who will haveconsiderable experience in the market and you have to learn aboutthe new market’s particular characteristics. You will also have to setup a selling, and perhaps production, facility and cope with newlanguages, laws and customs.
� Diversification: There are different types of diversification:– Forward towards the customer. An example would be if Ford
decided to start up a chain of wholly owned car dealers. Theproblem then is that the organization takes on additional risksand costs which have to be matched to increased profits.
– Backwards along the supply chain. An example would be Forddeciding to go into the manufacture of windscreen glass. Theproblem here is that the internal supply has to be limited toselling only to its parent as competitors will be wary of dealingwith them.
– Complete diversification. An example would be Ford deciding itwas going to manufacture and sell cakes and similarconfectionery.
The organization should build on its strengths, bearing in mind thecustomer’s needs. Most departures from the present products andcustomers involve the organization having to take on new tasks, buynew equipment and learn new skills. This takes time and money – evenif bought in.
Current products New products
Current market Market penetration Product developmentNew market Market development Diversification

264 Meeting customer needs
Risks with new products
Although new products are important to an organization’s future, notevery product launch will lead to success. As an organization hasinvested considerable money, effort and emotion in bringing a newproduct to the market, it is worth listing some of the areas wherelaunches fail:
Sales may not be achieved due to:� Competitors’ actions – an earlier launch or a better product.� Lack of market response – not what the public wants.� Unattractive pricing.
Design shortcomings:� Lack of technology experience.� Unreliable configurations.� Patent infringement.� Design not manufacturing friendly.
Manufacturing shortcomings:� Unreliable components purchased.� Problems with new technology.� Processing quality problems.� Initial teething problems leading to late launch, or insufficient
output to meet demand.
Servicing shortcomings:� Insufficient service points.� Personnel untrained.� Insufficient spare parts.
Because of the importance of a new product, it is important to get thepackage right as early as possible in the design cycle as it becomes veryexpensive to modify the design at a later date as shown in Figure6.1.8.
Figure 6.1.8 Problems inchanging project details as timeprogresses
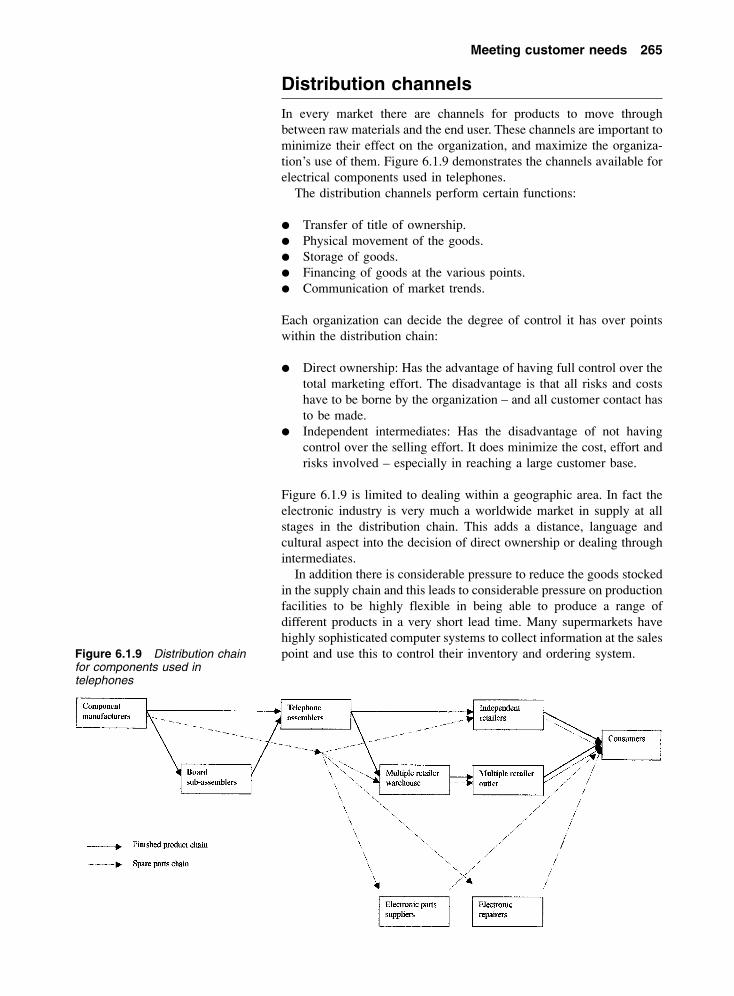
Meeting customer needs 265
Distribution channels
In every market there are channels for products to move throughbetween raw materials and the end user. These channels are important tominimize their effect on the organization, and maximize the organiza-tion’s use of them. Figure 6.1.9 demonstrates the channels available forelectrical components used in telephones.
The distribution channels perform certain functions:
� Transfer of title of ownership.� Physical movement of the goods.� Storage of goods.� Financing of goods at the various points.� Communication of market trends.
Each organization can decide the degree of control it has over pointswithin the distribution chain:
� Direct ownership: Has the advantage of having full control over thetotal marketing effort. The disadvantage is that all risks and costshave to be borne by the organization – and all customer contact hasto be made.
� Independent intermediates: Has the disadvantage of not havingcontrol over the selling effort. It does minimize the cost, effort andrisks involved – especially in reaching a large customer base.
Figure 6.1.9 is limited to dealing within a geographic area. In fact theelectronic industry is very much a worldwide market in supply at allstages in the distribution chain. This adds a distance, language andcultural aspect into the decision of direct ownership or dealing throughintermediates.
In addition there is considerable pressure to reduce the goods stockedin the supply chain and this leads to considerable pressure on productionfacilities to be highly flexible in being able to produce a range ofdifferent products in a very short lead time. Many supermarkets havehighly sophisticated computer systems to collect information at the salespoint and use this to control their inventory and ordering system.Figure 6.1.9 Distribution chain
for components used intelephones

266 Meeting customer needs
Promoting and selling
The different market segments require differing techniques of commu-nication and personal selling to get a customer to purchase a particularproduct. The stages that a customer goes through and the associatedpromotional method are:
� Awareness: The customer becomes aware of the products on sale.� Comprehension: The customer begins to differentiate between the
various competing products.� Conviction: The customer begins to move towards purchasing a
particular product.� Buying: The customer completes the purchase.
It is important that customers complete the route for your product –especially if they already are a customer and have already gone throughthe process. It is estimated that it costs ten times as much to gain a newcustomer as to retain an existing one.
Industrial and consumer goods do have differing proportions.Personal selling tends to be more important in industrial selling betweenorganizations.
Typical communication media are (some can be more directedtowards particular potential customers):
� Trade and other directories� Personal contact� Mail shots� Direct mail� Door to door� Exhibitions� Telephone� Sponsorship
In addition there is the mass media, which is more useful for a broadcastapproach.
� Television� Radio� Newspapers� Consumer magazines� Trade & business journals
Each of these has advantages in reaching particular customers, butremember they are individuals with home lives as well as theirorganizational roles. Reaching them in an out of the organizationcircumstance may make a greater impact than it would in theorganizational setting.
We are not covering the art of advertising in this text, but it isworthwhile examining the above range of media and communicationmethods to see what they carry in the way of advertisements.
Selling skills
As it is only when a sale is made that the company will obtain anincome, we shall therefore briefly look at this process in anorganization-to-organization context rather than retailing to broadnumbers of customers.

Meeting customer needs 267
This is particularly important because a small number of successeshere can sell a large number of products. The stages to go through are:
Preparation. It is important to ensure that you are prepared for themeeting. This means you have to carefully carry out the following phases:
Research:� Is this a new prospect or an existing (past) customer?� Who is the person to be seen – name, title and function?� How was the call arranged – i.e. cold from your organization, or by
invite from the potential customer?� The company and the industry.� All the purchase influencers in the organization.� The competitions’ offerings.� Possible immediate customer needs and future plans.� Sales potential, now and in the future.� Buying record.
Preparing for the meeting:� Dress to match customer expectations – not too formal, or informal.
One style does not cover all.� Have all resources available that you may need – paperwork, price
list, technical brochures, etc.� Ensure up-to-date product knowledge.� Sales aids which may be needed.� After-sales support offering that may encourage buying.� Your business card.
Opening the call. This is important as first impressions do count in anyinterview situation. A bad start is difficult to recover from:
Importance of the opening:� Remember from the customer point of view that they are important,
therefore consider their needs.� Orient the discussion to the customer.� Make a proper greeting, e.g. an interest creating comment; your
reason for calling; an opening question.
Agreeing the customer’s needs:Questioning techniques:� Background questions, not directly related, to establish connection.� Problem question, e.g. what problems are you experiencing with
present supply?� By implication, e.g. do you feel that you are achieving the best price?� Establish their needs.
Statement techniques:� Rephrasing of questions that have not been answered.� Agreeing needs once established.� Identifying a need.� Present dissatisfactions in the supply side.� Create dissatisfaction with competitors’ offerings.� Factors outside customer’s control.� Acceptable solutions.

268 Meeting customer needs
Establishing priorities. Normally customer has many, often conflictingpriorities. Try to establish what his priorities and working range are onfactors such as the following. This may give indications where a trade-off is possible, e.g. higher price for a guaranteed delivery schedule:
� Price.� Leadtime.� Delivery reliability.� Quality.
Presenting your case:Making ideas understandable:� Clear and unambiguous statements and offers.� Visual aids to highlight important aspects of your case.� Proper structure and sequence in the presentation.� Jargon free (or use customer’s).
Making ideas attractive:� Stress benefits to your customer, not just the product features.� Select benefits appropriate to each person’s role in making the
decision on who to buy from:– User– Designer– Buyer– Decider– Accountant.
Making ideas convincing by:� Simple statements.� Comparisons of different options and competitors’ product offering.� Demonstrating proof of any claims made.
Ensure you involve the buyer by obtaining and giving feedback.
Handling objections:Techniques for handling objections:� Anticipate possible objections and prepare the case against them
beforehand.� Listen to exactly what is being said and how it is said.� Pause and think before replying.� Acknowledge remarks made in your reply.� Establish reason/need behind an objection.� Provide rational answers to match need.
Different types of objections can be raised such as:� Price – establish value definition and boundary conditions.� Fear of unacceptable disadvantage.� Habit, i.e. present supplier.� Wrong information.� Conflict with existing systems.� Previous complaints against suppliers in general, or more seriously
your organization.� Competitors’ claims.� Other interested parties.

Meeting customer needs 269
Closing is the most important part of any sales meeting:Obtain customer commitment to at least one of the following:� A specific order, even if only for a trial.� Further meeting to hold open possibility of supplying.� Demonstration of product, either on their site, or yours.� A formal proposal/quotation to be sent.
It is important to stop selling once your customer decides to buy. Furthereffort will not only be superfluous, but may appear to be overselling tothe customer. Recognizing buying signals such as:
� Direct request to order.� A request for alternatives.� The best solution proposed.� Assumptions.� Concessions.
Reassure the customer at the end of the meeting by:� Thanking him for time and attention� Confirm that their need has been met� Leave once they appear happy.
Problems 6.1.1
(1) What factors will affect the demand for prints of paintings bya particular artist?
(2) Can you name five products which normally have a sellinglife cycle of less than one year?
(3) You make hand pottery items, what are the risks attached todeciding to start mass production of similar items?
(4) If you had a hobby of making model ships, identify thepossible distribution chain you would enter if you decided tomake a business out of it.
(5) If you developed a new process for attaching electroniccomponents to a board, who would you attempt to see in acompany making mobile phones.
6.2 Forecastingthe future
The ability to foretell what the future holds may be impossible but inbusiness it must be attempted to form the basis for rational decisionswhich need to be made now. Because of the lead times in design andmanufacture you cannot wait until something actually happens beforetaking action – this will often be too late. This section looks at thereason for forecasting and the techniques available.
Need for a forecast
Forecasting is the starting point for:
� Capacity requirements: Determining what factories you will operateand the mix of labour, machinery and equipment inside them.

270 Meeting customer needs
� Production planning: Deciding on how much of each product youwill make and the dates to produce it.
� Raw material: Deciding on what to purchase – the quantity andtiming of this.
� Personnel: Deciding how many people are needed, and their skillsand training requirements.
� Budgeting: Determining the cash budget requirements and whethersufficient profit will be made.
� Technology: Determining the changes in the process and theproducts which will be affected by changes in technology.
� Marketing campaigns: The best time to launch a new product so thatit naturally replaces an existing one.
If you make a pessimistic forecast, i.e. you set out to make less than youcan eventually sell, then you will have stockouts and irritate yourcustomers – perhaps even to the extent that they will go to yourcompetitor. You may have to react by the expensive use of overtime orsub-contracting to meet customer demand.
If you are overoptimistic, it can also be expensive. You can have highinventories and underused equipment. With high inventories you tie upmoney and carry the risk of obsolescence, or delaying new designs touse up these inventories.
The main problem with a forecast is that it will never be exactlyaccurate. There are too many factors which are outside the control of anorganization, or even a government. What industry requires is a fairlyaccurate forecast – which means a probable range rather than a singlefigure with an indication of the risk attached to it.
Time horizons in forecasting
Each type of industry has different time horizons due to their nature.The chemical and other basic industries, because of their high capitalrequirement and slowly changing products, tend to think in therelatively long term. Industries such as newspapers tend to think inrelatively short terms.
Short Range. One week to three months:
� Purchasing material: Placing, or confirming final details ofcomponents and quantities.
� Job scheduling: Determining the final production schedule of whatwill be made when.
� Working pattern: Short-term alterations to working hours such asovertime working.
� Job assignments: Allocating actual named people to particulartasks.
� Cash flow: Ensuring money is available as required.� Customer servicing: Arranging the schedule of service personnel’s
visits.
Medium range. Three months up to one year:
� Sales planning: Detail of visits to be made, and targets to beachieved.
Meeting customer needs 271
� Production plan: Semi-finished plan of what products will beproduced.
� Procurement: Many items have a delivery lead time that requiresorders to be placed several weeks before desired delivery.
� Shift pattern: Finalize working pattern of individuals andequipment.
� Personnel level: Finalizing recruitment and redundancy plans.� Training: Finalizing training schedules of courses and match of
personnel.� Product launch: Finalizing details of product launch.� Advertising: Finalizing advertising schedule.
Long range. One to five years:
� Strategic plan: To cover whole business.� Capital investment: Allocating capital spending in conjunction with
strategic plan.� Capacity plan: Make any forward arrangements to open up or close
plant including forward arrangement for personnel and equipmentplacement.
� New products: Determine the product development which will beconcentrated on.
� R&D expenditure: Determine the lines of enquiry to be followed todevelop new products and processes.
� Facility location: Decide on the opening up or closing down of retailoutlets, warehouses and offices.
� New markets: Determine what new product or geographic areas theorganization wishes to investigate.
The longer the time horizon involved the greater the risk of a forecastbeing significantly wrong. When factors such as competition andtechnology enter the picture this increases the risk involved.
Therefore when considering the medium- and long-term picture, anorganization has to take into account what governments may do (in, forexample, inflation or unemployment policies); demographic changes inpopulation concentration and age dispersion; general education levels;special grants; etc.
Basis of forecasts
Forecasts tend to be made up from a variety of sources both internal toan organization and external. Some of this will be hard data such asprevious sales, other soft data such as an opinion.
Management goals
The aspiration of the top management is often the initial starting pointas this decides the length of time being considered in paying backinvestment of time or money.
Sales force
The sales people should be in touch with the customers and see directlythe impact of the competition and contribute substantially to anyforecast.

272 Meeting customer needs
Where the sales cover a large area, or several countries each sales pointshould initially make forecasts of how the market is growing/shrinking,the changes expected in market share, the changes in technicalspecifications desired, competitors’ offerings and tactics, etc.
Area forecasts can be consolidated into a regional one, then an overallforecast. It is usual on an international scale to find distinct differencesbetween customer demand on products in different locations.
At the same time the organization may be a newcomer into somemarket areas and much of this information has to be especially gathered.Where they are established, the present sales force should be a goodsource.
Leading indicators
There are often indicators available locally or nationally which can givesome guidance to the overall direction of the economy within acountry:
� Changes in inventories levels. These can indicate when the marketis slowing down (increase in inventories) or quickening up(reduction in inventories).
� New manufacturing orders: An increase or reduction in these can beespecially important to organizations supplying capital equipmentsuch as machines.
� Changes in employment levels: An early indicator here can bechanges in the number of jobs advertised. This is of special interestto organizations supplying luxury or shopping goods as it canindicate a possible general trend towards particular products.
� New plant and equipment orders: These indicate how confidentindustries are in their future trading prospects.
� New buildings started: Of interest to organizations in the whitegoods or furnishing markets.
� Demand for money: The availability of credit is useful in shoppingand luxury goods markets, e.g. cars.
� New government contracts: Those organizations supplying capitalgoods and in civil engineering are interested in these.
� Elections or government changes: Each party has particular areasthey prefer to target, or to diminish, spending on. There may be arise in spending when an election is about to take place – andperhaps a cut-back afterwards.
Therefore it is possible to come to a reasonable forecast withoutanalysing past sales figures, but often the past does give an indicationabout the future, especially in seasonal changes in demand.
Forecasting techniques
There are many mathematical forecasting techniques in use withinindustry. The main problem is that no technique will produce aguaranteed accurate figure and all must be treated with an attitude ofpartial disbelief. There are too many factors outside the direct control ofan organization that can affect both the total market movement and theorganization’s share of that market. Therefore any technique used mustbe modified by a good knowledge of the market itself.

Meeting customer needs 273
Time series patterns
In addition to market fluctuations, there are normally five componentsof demand (see Figure 6.2.1). There can be several of these in action atthe same time.
� Random: Unfortunately in any set of data there are normalvariations. Some of these have undefined causes and these areimpossible to predict. Even those with identifiable causes aredifficult to predict as the causes themselves require predicting aswell as their effect.
� Trend: A straight or curved line showing an increase or decreaseover time. Normally only reliable for a limited period and mayvary.
� Curved, e.g. the product life cycle.� Short-term cycles: Often seasonal but can be over a day, e.g. traffic
density, a week or a year. Can be associated with a single annualevent, e.g. Christmas.
� Long-term cycles: Over the longer term there appears to be naturalbusiness cycles. The exact prediction of these is extremelydifficult.
Figure 6.2.1 Some salespatterns

274 Meeting customer needs
It is these components that make accurate forecasting unlikely –therefore a range of figures should always be given instead of a singlenumber. All quantitative methods rely on a historic database – butremember, history does not always repeat itself!
Quantitative methods
In order to test the quantitative methods, we try them out on past data,i.e. as if they were being used on that data. They are run as if the olddata was new, i.e. the future values cannot be seen.
Figure 6.2.2 shows a graph of the historic demand pattern. On firstlooking at the graph, there appears to be an upwards trend but there isalso considerable variation from period to period. The variation maybe random, or due to definable causes such as a new product slowinggaining acceptance, seasonal factors, supply problems or competitors’actions.
Where there are definable causes then they must be allowed for. Itmay be, for example, that period 7 was an annual holiday shutdown thatresulted in less product being available.
In this particular example, we will assume there are only randomvariations and make no other assumptions regarding any of the otherpossible causes, except to say there were no supply problems.
There are a number of error analysis techniques available which wecan use to judge the effectiveness of a forecasting technique. Only theBIAS and MAD (mean average deviation) figures are calculated andshown here.
� The BIAS gives an indication of whether the forecast is on averagetoo high (positive) or too low (negative). It can be used to adjust theforecasting process.
� The MAD value gives an indication of the overall accuracy of theforecasts – it is the average error. It can be used to give a probablerange to a forecast.
To calculate the BIAS, take the actual sales as the base. Find the errorbetween the forecast and the actual sale, i.e. include the plus and minussign. Now add up these values and find the average. If the answer is
Figure 6.2.2 Graph of demandover year
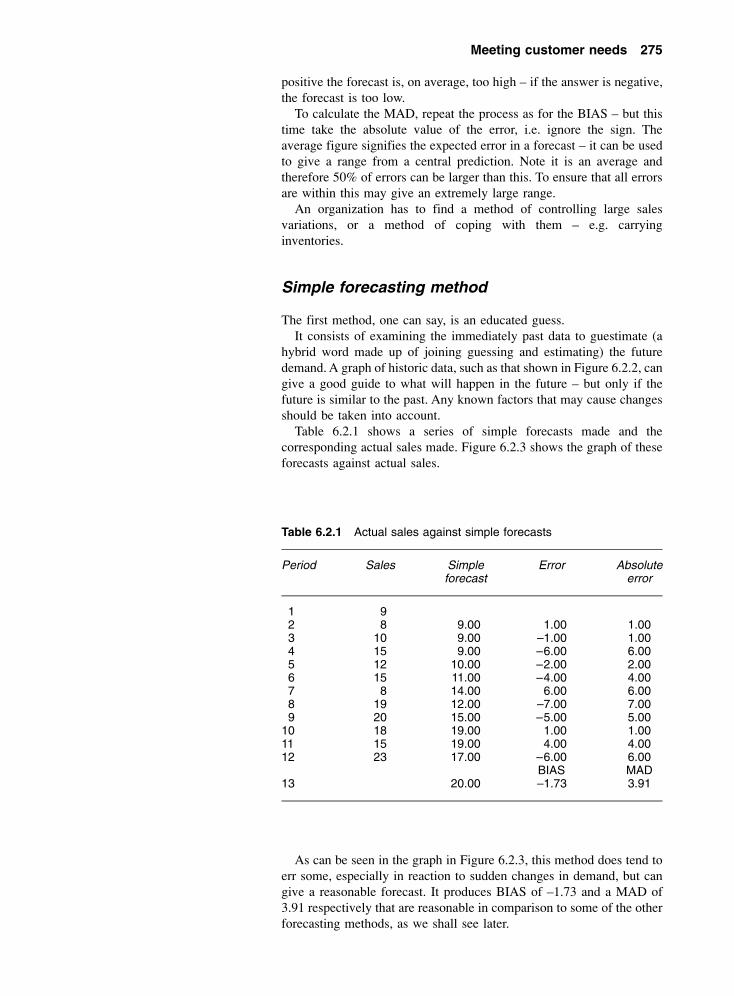
Meeting customer needs 275
positive the forecast is, on average, too high – if the answer is negative,the forecast is too low.
To calculate the MAD, repeat the process as for the BIAS – but thistime take the absolute value of the error, i.e. ignore the sign. Theaverage figure signifies the expected error in a forecast – it can be usedto give a range from a central prediction. Note it is an average andtherefore 50% of errors can be larger than this. To ensure that all errorsare within this may give an extremely large range.
An organization has to find a method of controlling large salesvariations, or a method of coping with them – e.g. carryinginventories.
Simple forecasting method
The first method, one can say, is an educated guess.It consists of examining the immediately past data to guestimate (a
hybrid word made up of joining guessing and estimating) the futuredemand. A graph of historic data, such as that shown in Figure 6.2.2, cangive a good guide to what will happen in the future – but only if thefuture is similar to the past. Any known factors that may cause changesshould be taken into account.
Table 6.2.1 shows a series of simple forecasts made and thecorresponding actual sales made. Figure 6.2.3 shows the graph of theseforecasts against actual sales.
As can be seen in the graph in Figure 6.2.3, this method does tend toerr some, especially in reaction to sudden changes in demand, but cangive a reasonable forecast. It produces BIAS of –1.73 and a MAD of3.91 respectively that are reasonable in comparison to some of the otherforecasting methods, as we shall see later.
Table 6.2.1 Actual sales against simple forecasts
Period Sales Simpleforecast
Error Absoluteerror
1 92 8 9.00 1.00 1.003 10 9.00 –1.00 1.004 15 9.00 –6.00 6.005 12 10.00 –2.00 2.006 15 11.00 –4.00 4.007 8 14.00 6.00 6.008 19 12.00 –7.00 7.009 20 15.00 –5.00 5.00
10 18 19.00 1.00 1.0011 15 19.00 4.00 4.0012 23 17.00 –6.00 6.00
BIAS MAD13 20.00 –1.73 3.91

276 Meeting customer needs
Linear trend
It is often worthwhile to develop the linear regression of the historicdemand, to give a guide to a trend. This can then be projected forwardto give the forecast demand. The basic regression formula is the formulafor a straight line:
Fx = a + b × X
where Fx = the trend forecast of demand Y for period number Xa = the estimated inception on the y-axisb = the estimated slope of the demand lineX = the period number
The equations used to determine a and b are:
b = (�(x × y) – (n × x × y))/(�x2 – (n × x2)
a = y – b × x
where �(x × y) = sum over all periods of X times Y for eachperiod
�x2 = sum of the X value squared for each periodx = the average of the X valuesy = the average of the Y valuesn = number of periods of data used
In this particular case, looking at Table 6.2.2 where we have calculatedout the values we have:
We have:
�(x × y) = 1274�x2 = 650x = 6.5y = 14.333n = 12
� b = (�(X × Y) – (n × x × y))/(�X2 – (n × x2)= (1274 – (12 × 6.5 × 14.333))/(650 – (12 × 6.52))= (1274 – 1118)/(650 – 507)= 156/143= 1.0909
Figure 6.2.3 Comparison ofsimple forecasts and demand

Meeting customer needs 277
and a = y – b × x= 14.333 – (1.0909 × 6.5)= 14.333 – 7.0909= 7.2424
� Fx = a + (b × X)= 7.2424 + (1.0909 × X)
If we substitute for any period number for X in this equation, we find theresultant forecast. For example, if we want the forecast for period 6, theanswer is:
Forecast = 7.2424 + (1.0909 × 6)= 13.79
Table 6.2.2 shows in a column the forecasts made using this projection.The table also shows the errors from the actual demand against eachforecast. On the error analysis, the BIAS shows up as zero as the trendis calculated from this actual data. The MAD analysis shows that theaverage individual error is 2.32 against the average volume shipped of14.333 equal to +/–16%, which appears quite large, but is not unusualwhere significant random variations in demand are present.
The graph in Figure 6.2.4 shows these forecasts against the actual. Itincludes a range based on the MAD projected from the single figureforecast to give an average error range. As can be seen, some of theactual sales values fall outside this projected error range. This is becausethe MAD represents an average error hence some must be larger than it– to include for all possible errors would mean the application of a muchwider range.
There are more complex mathematical methods such as multi-regression analysis which can be used, but these are not covered in thistextbook.
Table 6.2.2 Calculations and forecast for linear trend projection
Periodx
Salesy
x2 x × y Linearforecast
Error Absoluteerror
1 9 1 9 8.33 –0.67 0.672 8 4 16 9.42 1.42 1.423 10 9 30 10.52 0.52 0.524 15 16 60 11.61 –3.39 3.395 12 25 60 12.70 0.70 0.706 15 36 90 13.79 –1.21 1.217 8 49 56 14.88 6.88 6.888 19 64 152 15.97 –3.03 3.039 20 81 180 17.06 –2.94 2.94
10 18 100 180 18.15 0.15 0.1511 15 121 165 19.24 4.24 4.2412 23 144 276 20.33 –2.67 2.67� 78 172 650 1274 –Av: 6.5 14.33 0.00 2.32Period 13 21.42 BIAS MAD

278 Meeting customer needs
Moving average
One could use a simple average of all the past data to estimate the futuredemand. If the market changes over time, as all do, this method couldbe highly inaccurate.
If instead of taking all past data, the average of only the immediatepast was used to project the future then it should be more accurate.
We calculate this ‘moving’ average by:
Ft + 1 = (Dt + Dt – 1 + Dt – 2 . . . Dt – (n – 1))/n
where t = Period number for current periodD = Demand in periodn = Number of periods included in moving average
calculation
Table 6.2.3 shows the values calculated when producing a three-periodmoving average. For example, the forecast for period 5 is reached by:
F5 = (D4 + D3 + D2)/3= (15 + 10 + 8)/3= 33/3= 11.00
Figure 6.2.4 Comparisonbetween linear regressionforecast and demand
Table 6.2.3 A three-period moving average forecast compared toactual sales
Period Sales Movingaverageforecast
Error Absoluteerror
1 92 83 104 15 9.00 –6.00 6.005 12 11.00 –1.00 1.006 15 12.33 –2.67 2.677 8 14.00 6.00 6.008 19 11.67 –7.33 7.339 20 14.00 –6.00 6.00
10 18 15.67 –2.33 2.3311 15 19.00 4.00 4.0012 23 17.67 –5.33 5.33
Average –2.30 4.5213 18.67 BIAS MAD

Meeting customer needs 279
As can be seen in Table 6.2.3, using this method, the BIAS = –1.81 andthe MAD = 5.96. Figure 6.2.5 shows a graph comparing this forecastagainst the actual sales. This shows that, on average, the forecast is low(by 12%) with a large average error of +/–40%.
The use of past data averaging will have a BIAS where there is atrend (positive or negative). Using weighted moving averages canreduce the BIAS because later values have a higher relative value.
Exponential smoothing
We can produce a forecast based on past data giving preference towardseither the latest data, or even that from earlier periods by using weighedaverage methods. The problem remains that in any moving averagemethod any data before the period used in the calculation is ignored.
Another technique called exponential smoothing considers all pastdata, and modifies its forecast based on how close the forecast was tothe latest actual figures. We can decide what is more important – totalhistory or recent history by adjusting the value of a smoothing constant,�, in the formula:
Ft+1 = (� × Dt) + ((1 – �) × Ft)
The higher values of � give a forecast that reacts much in line with thelatest demand. Lower values of � give more preference to the previousforecasts, i.e. a longer historical period. The result of this is that thehigher values of � tend to be more effective in following trends but itdoes not produce a smooth forecast. For a smooth forecast you requirea low value of �.
Forecasts for period 5 in Table 6.2.4, for the differing values of �used, are:
For � = 0.1, F5 = (0.1 × 19) + ((1 – 0.9) × 11.44) = 12.20For � = 0.5, F5 = (0.5 × 19) + ((1 – 0.5) × 10.00) = 14.50For � = 0.9, F5 = (0.9 × 19) + ((1 – 0.1) × 9.84) = 18.08
If we examine the graph in Figure 6.2.6, we can see:
� � = 0.1 gives a very smooth forecast, but it is not following the trendof the demand well, i.e. it is lagging the trend.
Figure 6.2.5 Comparisonbetween three-period movingaverage and demand

280 Meeting customer needs
� � = 0.9, there is a good correlation to the trend but the forecast isalmost the same as the previous period’s actual demand and henceis fluctuating almost as much as the actual demand, but one periodbehind.
� � = 0.5 demonstrates in between results from the low and highvalues of �.
A low value of � is useful to smooth out fluctuations, but should onlybe used where there is little trend, as it quickly lags behind the trend.
Note from Table 6.2.4 that � = 0.1 gives a BIAS of –4.89 and a MADof 5.37 against a BIAS of –1.57 and MAD of 4.41 for � = 0.9. The lower� value gives a smoothing out of the high fluctuation of the actualdemand but produces the higher BIAS and MAD because the forecast islagging behind the actual trend. The best overall value for MAD comeswhen � = 0.5.
Comparison of forecasts for period 13
Table 6.2.5 brings together the end result of all the methods, includinga forecast for period 13 and the BIAS and MAD values. Note that
Table 6.2.4 Values of exponential forecasts using differing values of �
Period Sale � = 0·1
F’cast Error Absoluteerror
� = 0·5
F’cast Error Absoluteerror
� = 0·9
F’cast Error Absoluteerror
1 92 8 9.00 9.00 9.003 10 8.90 –1.10 1.10 8.50 –1.50 1.50 8.10 –1.90 1.904 15 9.01 –5.99 5.99 9.25 –5.75 5.75 9.81 –5.19 5.195 12 9.61 –2.39 2.39 12.13 0.13 0.13 14.48 2.48 2.486 15 9.85 –5.15 5.15 12.06 –2.94 2.94 12.25 –2.75 2.757 8 10.36 2.36 2.36 13.53 5.53 5.53 14.72 6.72 6.728 19 10.13 –8.87 8.87 10.77 –8.23 8.23 8.67 –10.33 10.339 20 11.01 –8.99 8.99 14.88 –5.12 5.12 17.97 –2.03 2.03
10 18 11.91 –6.09 6.09 17.44 –0.56 0.56 19.80 1.80 1.8011 15 12.52 –2.48 2.48 17.72 2.72 2.72 18.18 3.18 3.1812 23 12.77 –10.23 10.23 16.36 –6.64 6.64 15.32 –7.68 7.68
Aver. –4.89 5.37 –2.24 3.91 –1.57 4.4113 13.79 BIAS MAD 19.68 BIAS MAD 22.23 BIAS MAD
Figure 6.2.6 Comparisonusing various values of �against the demand

Meeting customer needs 281
although each technique is a valid one, they produce answers from a lowof 13.79 to a high of 22.23. They are graphed together in Figure6.2.7.
Which one gives the correct forecast?The answer is that they are all mathematically correct but probably all
inaccurate! For example, the figures for demand may represent a normalyear’s figures and the actual for period 13 may be similar to period 1.
Only time and trial application of each can tell how useful any of thetechniques would be.
Determining cyclic components and outsideinfluences
As referred to in page 273, there are often cycles within any demandpattern. These can be over:
� The day, e.g. traffic volume.� The week, e.g. food sales pattern.
Table 6.2.5 Comparison between different forecasting methods.
Method BIAS MAD Forecast forperiod 13
Simple –1.73 3.91 20.00Three period moving average –2.30 4.52 18.67Linear trend 0.00 2.32 21.42Smoothing constant, � = 0.1 –4.89 5.37 13.79Smoothing constant, � = 0.1 –2.24 3.91 19.68Smoothing constant, � = 0.1 –1.57 4.41 22.23
Figure 6.2.7 Graph showingall technique forecasts

282 Meeting customer needs
� The month, e.g. spending on luxury items reduces as the monthadvances.
� Year, e.g. sales of electric fans peak in the hot summer.� Particular events, e.g. Christmas, Guy Fawkes (fireworks), new car
registration letters.
Where they have existed for a number of cycles, they need to beidentified so that production schedules and inventory can be planned toservice them. Table 6.2.6 shows the daily sales of a particular food itemin a supermarket.
By adding up the sales on each of the days and calculating thepercentage they are of the total sales for the four weeks, we can arriveat an expected daily factor that we can apply to any projected week’ssales. These factors are shown graphically in Figure 6.2.8.
In addition to a daily pattern, we could find other patterns andcorrelations for this item:
� One Monday sales were much less than the other three Mondays –this was put down to a Bank holiday – and this reduction could bebuilt into any future forecast.
� There will probably be an annual pattern for the item as people’seating preferences change over the year.
� There could be a correlation to an outside influence, e.g. ambienttemperature, if a popular local football team is playing at home oraway, perhaps even if that team wins or loses.
� There could also be a correlation to special offers for this product,or perhaps a negative reaction to a special offer on a similarproduct.
Table 6.2.6 Daily sales for a food item over four weeks
Week Mon. Tues. Wed. Thurs. Fri. Sat. Sun. Total
1 112 140 105 210 530 180 160 14372 98 150 120 250 510 250 110 14883 55 195 115 240 490 210 145 14504 110 135 125 230 475 195 150 1420Total 375 620 465 930 2005 835 565 5795% age 6% 11% 8% 16% 35% 14% 10%
Figure 6.2.8 Daily salesfactors
Meeting customer needs 283
These all can be built into past data to provide a guide towards thefuture, but no matter how accurately the recording – all the influencesprobably have not been captured. The future will always be different, wejust hope not too much is unpredictable.
Foretelling the far future
If it is difficult to forecast the immediate future, then how do we go aboutforecasting even further ahead? Some organizations, such as utilities,have to make decisions now, as the lead time of developing new plant isyears.
This does not involve using crystal balls but assembling a group ofacknowledged experts and recording their views on what changes areliable to take place, especially in the technology aspects. This can be byfocus groups or using the Delphi Technique where each expert recordsseparately their predictions and these are then discussed and put in orderof probability.
Other ways are to carry out:
� A full PEST analysis (see page 1) to extend present trends in thepolitical, economic, sociocultural and technologies aspects into thefuture.
� A five-force analysis (see page 304) to determine foreseeable, orpossible, changes in the competitive forces operating.
These long-term forecasts often act as the input to scenario analysis (seepage 306).
Problems 6.2.1
(1) What happens if you use a value of � = 0 in an exponentialsmoothing forecast?
(2) What are the problems associated with a highly seasonalproduct such as fireworks in the UK?
(3) If in the example you have been following in this section theactual sales in period 13 were 10% higher than month 1,what would you use as forecasts for periods 14 to 24?
(4) How would you build the launch of a product revision into aforecast?
(5) If you are supplying the retail market with a range of similarproducts, what effect do you think a sales promotion on oneitem has on the remaining items in the range?
6.3 Marketingresearch
For an organization to make a decision relating to its market, it requiresas much information as possible about what people want and how muchthey are prepared to pay for it. The aim of marketing research is toprovide that information with as much accuracy as possible.
There are four main areas that marketing research is involved with:
� Product research: Concerned with the design and range of existingand possible products from the organization and its competitors.

284 Meeting customer needs
� Customer research: Concerned with the buying pattern of potentialcustomers and trends in their spending and changing criteria forselecting products. Can be consumer or industrial.
� Sales research: Investigations both into internal unit and competingunits in sales outlets and sales patterns.
� Promotion research: Investigations into the effect of advertising andother promotional efforts.
Some of that information will be gained from just operating in a marketfrom personnel such as salesmen. However, this is from a narrow baseof experience and can be highly personalized and biased. It cannotpossibly cover the whole potential range of customers, unless that isvery small.
The research programme
There are many ways of gaining useful information from themarketplace. Some of these are:
� Experiments� Questionnaires� Telephone surveys� Mail surveys� Personal interviewing� Direct observation� Group discussions� Research of governmental and other data sources.
Before deciding on which method to use, marketing research should gothrough a design sequence to ensure that the total research gives areasonably valid answer. The phases are similar to that seen in Chapter5 on project management.
Stage 1 – research brief
Initial discussions about the situation to be investigated need to be heldto discuss the extent and limits of the project, especially the populationinvolved, and the degree of accuracy required.
For example, initially it may be suggested to research into the reasonsfor selecting an intended higher education subject area amongst16–18-year-olds. But that raises a number of questions, amongst whichcould be:
� Why do we want to know the answer?� Is it nationwide (UK), limited to only certain geographical regions
or even should it cover the EC?� Should it cover all people in this age group, even though many of
them do not have qualifications to enter higher education?� Should it be limited to those qualified and intending to enter higher
education?� How broad should the subject categories be?� How many would be representative of this population?� How will the survey be conducted?

Meeting customer needs 285
Once there appears to be agreement about the subject matter, we moveonto:
Phase 2 – research proposal
The proposal will contain:
� Clear statements about what is being studied.� Limits of investigation.� Methods to be employed.� Expected accuracy.� Expected bias and method of coping with it.� Cost and timing.� Experience of research team.
Once this is accepted, we can move onto:
Phase 3 – data collection
The main part of the research. Careful records need to be kept of howdata was actually collected, the responses received and any significantvariations to plan.
Phase 4 – data processing
This is the editing, coding and tabulation of the data collected todetermine required response rates and formulation of the results.
Phase 5 – presentation of report
The end of this research project may give management enoughinformation on which to base its decisions, or it may still leave room forintuition, or indicate a further study is required.
Target of the research
Whatever research method is used there is a problem associated with it.How do we identify the group(s) which the survey has to cover.
Typical segmentation models used are:
UK National Readership Survey (NRS)
A Upper middle class 3% of populationB Middle class 10%C1 Lower middle class 24%C2 Skilled working class 30%D Working class 25%E Other 8%
ACORN Life Style Segmentation
Household composition: Single; couple; family; shared.Age structure: Child; young adult; mature; established; retired.Possessions: Car; telephone; etc.Pastime activities: Sports; music; reading; etc.

286 Meeting customer needs
Industry. In some ways easier than consumer as there tends to be aconcentration of buyers, unless the target is the small businesses. Firstplace to start is to quantify the actual group that we are interested in,e.g.:
� Electronic� Computing� Automobile� Ship-building� Construction� Forestry
Secondary data sources. These are non-obtrusive, i.e. do not requiresoliciting responses and are termed desk research.
� Internal data, e.g. sales records, complaints records.� Government publications: Good guides here are Guide to Official
Statistics (HMSO) and Regional Statistics (HMSO). Copies cannormally be found within public libraries – the local librarians willtell you what detailed reports they hold in stock, or will arrangeinter-library loans for many of them. UK government statisticsinclude social trends, regional trends and family spending.
� Trade press: Again consult your local library or one of the particularindustry bodies.
� Business Links and local chambers of commerce.� Commercial data: there are many subscription services such as
Mintel Market Intelligence Reports and Financial Times BusinessInformation Services.
� On-line services: Teletext (Ceefax and Oracle), Viewdata andmany of the internet providers. Many of these are subscriberservices.
� Libraries: In addition to official and commercial informationsources, they are often a contact point for local interest groups andclubs.
Using these sources, a picture can be built up of potential customers, orusers, who it may be of interest to carry out a survey on. These sourcesare initially identified at the research proposal stage, but a more detailedpicture is required before we finalize the design of the data gatheringphase.
In the industrial market, it is important that we follow the distributionchain to identify all possible uses and potential buyers. Following sucha chain will produce a list of contacts and their positions within all theorganizations.
Primary sources
� Internal: People directly involved in sales, design and procurementcan be a good source of what is happening in the market as theymeet and talk to customers.
� External: These are the people involved in the purchasing decision:– Designers and buyers within an organization.– Retailers and wholesalers.– Consumers – buyers and users.

Meeting customer needs 287
Sampling plan
Once we have the target group, we now have to decide how to collectthe data and how much we need. The main constraint on any researchis cost. The aim is to collect as much meaningful data as possible withinthat constraint.
Ideally we would like to solicit information from everyone who may beinvolved. The cost of doing so would be prohibitive, except in verynarrow markets. This forces us into sampling rather than full coverage.
The basics of sampling are that if a representative group (see Figure6.3.1) is taken and examined then any statistic of the sample group willbe reflected in the total population. The mathematics of sampling is notcovered here – just a few words about sampling itself:
� Who is to be surveyed: A clear picture is required of all the differentgroups that require to be surveyed.
� Sample size: Basically, the larger the better to improve theprobability that their response will echo the population we areinterested in. Unfortunately accuracy does not follow a straightlinear correlation, but depends on the square of the numberinvolved, i.e. to double accuracy, we require four times as muchcoverage. Note that the larger the survey, the more it will cost tocarry out and analyse.
� Sampling procedure – how to choose the respondent: Here one mustmake sure that a truly representative cross-section of potentialcustomers and decision makers is reachable and is actually coveredduring the survey. Otherwise we could have a misleading bias in theanswers.
� Contact method: Linked to the necessity to reach the respondents.Methods include:– Telephone: Does access most of the population, but not all, e.g.
ex-directory at one end and poorer households at the other. Timesof availability of different consumers can be problematic, i.e.many family members will be out during normal working hours.
– Postal: Will reach a good spread, but heavily reliant on recipientsresponding. In many surveys a 10% response is considered good.However, this self-selecting group may not be representative ofthe whole population.
Figure 6.3.1 Sample takenfrom the general population

288 Meeting customer needs
– Interviewing: Expensive method, but does allow more informa-tion to be collected. Has problems in reaching balanced audienceand in the questioner influencing the answers by body language.
In addition to surveys, we may wish a more detailed response, althoughthe actual sample used will be smaller to prevent excessive cost. This isachieved by:
� Observational research: This is non-obtrusive and involves record-ing reactions such as stopping to look at displays and resultantaction, e.g. enter shop – make a purchase. Can be expended intoanalysing facial responses.
� Focus groups: Here one selects a small group of intended target andconducts detailed enquiry, e.g. taste panels are used by most foodgroups as a test/intermittent activity during product development.
� Experimental research:– Can be similar to observational research, but using a selected
group.– Test marketing is another form.
� Test marketing: Here the product, or service is offered in a limitedgeographic area to test response to the product, or advertisingcampaign. This gives an opportunity to alter the offering before anationwide launch.
Each method has problems ensuring responses, and a post analysis isrequired to ensure spread of respondents matches the initial target.
The questioning technique
This is the key skill area in any marketing research and thereforepotentially the most error prone. Care has to be taken that questions arenot leading, especially in a sequence which may guide participantstowards particular answers.
We have to decide what information we want and the best way tostructure interviews to get it:
� Facts and knowledge, i.e. about particular products or services.� Opinions: Attitudes towards products and services – may also
require depth of feeling.� Motives: What makes people do things.� Past behaviour, e.g. buying patterns, brand loyalty, etc.� Future behaviour, e.g. intentions to purchase.
To collect the information, there is a variety of ways we can framequestions:
� Closed-end: Very quick to collect and analyse, but forces a directchoice, which may not reflect reality.– Two choice: These are typically of the yes/no type. May be
agree/disagree. Need to collect number of non-responders, i.e.‘don’t know’.
– Multi-answer choice: Here a choice is given of several probableanswers as in Figure 6.3.2. Can be single or multiple choice.Need to leave room for ‘others’ and don’t knows.

Meeting customer needs 289
– Scales: Here responder has to quantify answer as in Figure 6.3.3:� Bipolar, e.g. indicate between two opposites which is nearer.� Importance straight judgement required.
� Open-end: Here the actual words used by responder to a question orstimulus are recorded. Ways of framing question/answer can be:– Unstructured answer: Normal invite is by use of the word
‘why?’ as in Figure 6.3.4.– Word association: Immediate answer to a word – normally a
trade name or similar.– Sentence, story and picture completion can be used to give
stimulus to open up inner feelings.
Note open-ended type questions can be severely influenced by thequestioner leading. They also need much more careful analysis.
Several problems in collecting data are:
� Refusal to respond.� Bias in question, e.g. ‘You don’t think . . . do you?’� Questions too long, e.g. asked to select several from a list of twenty
items.� Wording of question may be unclear, or can be interpreted in
different ways.� Response is based on what responder thinks is the ‘correct’ one.� Responders may, on reflection, not carry out stated intentions.� Researcher misinterprets answer.
Tick which of the following newspapersyou read regularly
The Times �The Telegraph �The Guardian �The Mail �The Express �The Mirror �The Sun �Other (please name)
Figure 6.3.2 Multi-choiceanswer
Figure 6.3.3 Scalar question
Figure 6.3.4 Open-endedquestion
Why did/are you attending this course?

290 Meeting customer needs
Using the results
The answers from a market research project can be used to:
� Determine the potential market for a new product at different sellingprices.
� Form a competitive picture of a product against its maincompetitors.
� Identify and rank customer needs/wants for a new design specifica-tion, i.e. first stage of QFD (quality function deployment).
� Crystallize an advertising campaign.
There have been notable occasions where a market research hasapparently been correctly carried out and acted on – with disastrousconsequences. The most recent famous failure was that of the ‘newcoke’ recipe by the Coca-Cola Company.
Indications were that its launch would be successful which persuadedthe company to make a complete changeover from its previous recipe.Instead it cost Coca-Cola substantial market share which was onlyaddressed by bringing back the traditional recipe.
Product image
By making a profile of the customers’ responses against selectedattributes or images associated with a product, we can see a productprofile as in Figure 6.3.5. This enables a company to see the overallimage of its product and gives areas for possible improvement or tostress in advertising as we can build on existing images.
Figure 6.3.5 Product profilesfollowing market researchexercise

Meeting customer needs 291
Product attribute correlation
These matrices can be used to form a series of cross-correlation betweenattributes of a product, and its competition, against stated customerdesires. For a sports car, the competing desires could be:
� Speed:comfort� Price:finish
It is not unusual to find that different market segments will not only putdifferent desired values to these attributes, but they will also scoremodels differently. Being able to differentiate what the differentsegments value and how they score can guide targeted advertisingcampaigns in what is portrayed and where different messages should bepublished.
In the next section (6.4), we shall examine an overall company profilewhere comparison on a range of supporting attributes is made.Marketing research is the basis for this.
The customer matrix
It is possible to amalgamate all the attributes when measured into aparticular segments customer’s perceived use value and then comparethis with the customers’ perception of the product’s price to determinean overall competitiveness.
� Identify all the attributes that the customers value.� Assess the importance of each attribute to the customers – i.e. score
them to give a value weighting.� Rate each competitor and own products by customer.� Amalgamate the attribute scores into a perceived use value for that
product’s attribute, i.e. multiply the attribute rating for a product bythat attribute’s customer value weighting.
� Average out the different attribute values into an overall customerperceived value (PV) for each product.
� Determine the customer perceived price (PP). This may not reflectactual price differences as the customer may have only an initialprice in mind but an amalgamation of life costs.
� Graph each product onto the matrix as in Figure 6.3.6.� Analyse the matrix as Table 6.3.1.
Figure 6.3.6 Productplacement on the price:valuematrix

292 Meeting customer needs
We should find a reasonable correlation between the perceived valueand the perceived price across the range of products.
Where a product appears to be highly competitive these perceptionsmust be maintained. Conversely if a product is seen not to becompetitive, then action for improvement must be made, or perhaps awithdrawal from the market.
If the matrix indicates that the product is in line with the market thenby concentrating on improving the attributes that the customer values,we should be able to drive up the customers’ perceived value. This willincrease the sales, or allow us to set higher prices without affectingsales.
It is more difficult to alter the customers’ perception of the price,except by changing it. The basic question is how much of a change inprice is required to change an impression of being highly priced. Willthat change be judged as being achieved by cheapening the offering?Perhaps a price revision needs to await a new opportunity arising froma new product.
Problems 6.3.1
(1) How many people do you know? Out of these, how manyown a Ford car less than three years old? From youranswers, estimate how many Ford cars a year will be sold inthe UK in the next calendar year? How accurate do you thinkthis answer is?
(2) Using the NRS and ACORN models, describe yourself anddetermine the best method to gain a good response ratefrom your group.
(3) If you wished to open a shop specializing in fishing tackle inyour home town, what basic information do you think you willneed to form an estimation of potential customers? Wherewill you find it?
(4) Can you think of several questions where your answer may beswayed by a desire to be seen as being politically correct?
(5) Using the matrix in Table 6.3.1, categorize a number ofrestaurants.
6.4 Marketstrategy
For an organization to be competitive it must have products that themarket wants, at the right price and in the right place backed up byeffective promotion.
Table 6.3.1 Matrix of sectors within perceived price and perceivedvalue
Perceived value
Low High
Perceived price Low In line with market Highly competitiveHigh Uncompetitive In line with market

Meeting customer needs 293
It must satisfy all its customer’s needs to win orders by criticallyexamining its competitive strength. It must then determine whichmarket it can best serve, if need be by forming partnerships with others.These are examined in this section.
The marketing mix
In marketing terms, there are said to be four ‘P’s which lead to acustomer purchasing a particular product:
Product Place Price Promotion
As these are what makes someone actually buy the product, it isworthwhile examining them in detail – especially in relation to whatyour competitors are offering.
The products
As anyone who has watched advertisements should realize, a product ismore than just a physical mixture of features. Each product has manyconnotations and images attached to it, which are worthwhile examiningseparately.
Benefits
Designers of products, especially in engineering, tend to concentrate onthe features of a product as that is the physical matter that they arecreating. When you buy a product you are actually buying benefitsrather than features. Benefits are everything that a customer gets fromowning the product, over and above the physical product itself. Theseare the needs that a product should be designed to meet. They are whatour salesmen should be stressing to potential customers.
Intangible benefits. These are the deeper underlying reasons why peoplebuy particular types of products. There can be more than one intangibleassociated with a product. Examples are:
� Perfume and cosmetics – to achieve increased appeal to others.� Sports car – to achieve increased appeal plus excitement.� Washing powder – to show that you are a proper parent.� Fashion clothing – a sense of belonging and being up to date.
Tangible benefits. These are less deep than intangible, but could be saidto be the more apparent need that the product is meeting. Again therecan be several tangible, and intangible, needs that a product couldsatisfy:
� Cars – transport, speed, safety.� Vacuum cleaner – cleanliness.� CD player – sound (music).� Mobile phone – communications.� Soft drink – satisfy thirst.� Table lamp – giving light.

294 Meeting customer needs
Feature attributes
These relate to the physical product itself and can be easily perceived bythe customer, sometimes even before purchasing. They are normallyeasy to compare to the features of our competitors’ products externally.They are therefore important in being pleasing and what the customerexpects in a product.
� Size: Could relate to any measurement such as overall length orinternal width of a car, or the screen size of a television.
� Shape: Customers associate a certain shape to a product – that iswhy it can be difficult to sell a technically superior product when itcomes in a shape that the customer does not associate with theproduct.
� Quantity: Could relate to the content of a package, or the seatingcapacity of a car.
� Service: Could relate to the time to be served in a restaurant, thenumber of trains each hour between two towns.
� Taste: Could be related to sweetness or bitterness of a soft drink.� Odour: Could relate to the smell of a perfume on someone’s skin –
or even how long that smell lasts.� Colour: Could relate to the range of colours that a car comes in.� Power: Could relate to a car engine or the wattage of a CD sound
system.� Efficiency: Could relate to the kilometre per mile performance of a
car or the amount of water used by a washing machine.
Signal attributes
These are more aesthetic and aimed to appeal to the senses, althoughthey are also closely linked to the intangible benefits above. Sometimesthey are used in the selling environment, rather than in the productitself.
� Odour: Smell of baking in a supermarket.� Material: Not only of the product itself, but often of the packaging
of items such as jewellery and cosmetics.� Style and design are very important here.� Sound: Background music in a clothing retailer.
Product range
As not all customers want exactly the same product, we have to producedifferentiated products so that we can attract a variety of customers.This differentiation causes problems within manufacturing – so ourdesigns have to be careful to use as many common parts as possible,whilst being able to show real differences. There are two measureshere:
� Range: The number of different product lines available. Examplesinclude the different named models from a car manufacturer or thedifferent toothpastes produced by the same company.
� Depth: Depth within each product line. This could be the variousmodels (can be over twenty) from a car manufacturer under thesame name. Could also refer to the different size of packagingcontaining the same product as in soft drinks or breakfast cereals.

Meeting customer needs 295
Packaging
Packaging has the prime function of ensuring that the product isprotected in transportation and storage so that it reaches the customer ingood condition. However, it can often contribute to any of the aboveattributes:
� Intangible by display of a brand, or containing images.� Tangible by ease of use.� Features such as reuse, or easy to recycle.� Signal by design and colouring.� Product depth by single use packs, combination packs.
Place (distribution)This relates to ensuring that the product is in a place where potentialcustomers can see and access it, so that they will make the purchase.This must be done efficiently and effectively.
� Distribution cover – how many potential customers are reached andthe channel used.
� Physical distribution:– Transport used, e.g. road, rail, postal service, specialist carriers.
Speed of delivery may be important as in the newspaperindustry.
– Service – covers matters such as number of deliveries per day/week and reaction time to a variation in order pattern.
– Inventory – how much and where is it stored.� Nature of outlets – the product should match expectations of the
customer in where to find it.� Direct sales via websites and newspapers/magazines.
PromotionThis is how the organization communicates with its customers along thedistribution channel. There can be a variety of reasons for communicat-ing, e.g. special offers or a new advertising campaign can be directed atretailers. There are a number of avenues used:
� Advertising: The common recognized means of drawing people’sattention to a product offering (see page 266 for range of aims andmeans).– Focus: Can be directed to particular channel members or
individual groups of end customers.– General: Direct to all members of channel or general public.– Publicity: Although more a general broadcast, this can be tying
a specific product to an event, such as Formula One racing, orgetting sport celebrities to wear, or use, particular products.
� Sales promotion: This relates more to direct inducement:– Special offers to retailers, or customers, e.g. two-for-one.– Tokens collected to ‘purchase’ items.
� Sales: This relates to the direct selling:– Sales system. How the actual transaction takes place.– Personal selling. How many staff deal with customers. In
supermarkets no direct selling takes place.

296 Meeting customer needs
� Public relations: More general publicity around an organization toimprove particular aspects of its image, e.g. by support of a specialcharity event or a local organization.
� Packaging: Although primary function is protection and appeal, italso offers an opportunity to send messages to customers.
Price
Although price can be very important, we have to remember that itdetermines the profit after deducting all the costs. Less than cost pricecan be used as a marketing tool, but only where long-term profit results,e.g. to penetrate a market, or as a loss leader to entice customers to buyother profitable products. It can also be used to target particularcustomers who may be useful either through the bulk purchases theybring or through future sales. We have to be careful about our pricingstructure in relation to our other customers and our competitors.
Allowances and discounts. These are used to pass on some of thesavings that result through large commitments. Usually varied inrelation to quantity or order value, but can also be used to entice earlypayment of invoices, e.g. 2% reduction if paid within seven days.
Pricing gap. This is between all the costs and the price. Can be used toset allowances and discounts (see Chapter 5 for margins).
Customer valuation of benefits. This is where real profits can be made.If there are criteria such as quality or on-time delivery that the customervalues highly, they may be willing to accept a higher price.
Service extensions
In addition to the four Ps, there are other criteria that customers use indeciding where to trade, and who to trade with. These could be said tobe another three Ps.
People
There is a variety of your people that your customers come into contactwith when trading with you. It is important that staff are trained as beingrepresentatives of your organization and show the expected attitudetowards your customers. This includes their appearance andbehaviour.
Customer contacts of special importance are:
� Telephone operators: Almost certainly the first contact point. Howthey greet your customer and handle their calls make a lastingimpression.
� Delivery personnel: These people represent your organization at thecustomer’s premises. Their manner and attitude will be noted.
Order process
The most important transactions with the customer are the placing of theorder and the associated payment. The procedures should be friendly,efficient and error resistant, even when chasing late payments.

Meeting customer needs 297
Automation may appear to save money, but can be a turn-off for yourcustomer. They like to deal with friendly and efficient people, notmachines. Information technology can assist your people to be fast andefficient – when the systems are correctly designed. Credit controlprocedures are especially important here.
It is possible to increase customer involvement as in self-service insupermarkets and on the Internet, but remember to have staff availableas a back-up to answer customer queries and problems.
Physical surroundings
The customer expects certain environments when they are doingbusiness. You therefore have to examine all areas that the customer mayvisit and ensure that they meet the customer’s expectations. Key areasare the approach to your plant/offices (i.e. look at them as if you wereapproaching them for the first time) and the impression of the receptionarea and meeting rooms. Do not forget the factory and despatch areas –your customer may visit these.
Market qualifying and order-winningcriteria
For every product, the customers not only examine the product offering,but have a further set of criteria in their minds when examining which of anumber of competing products to purchase. Terry Hill of the LondonBusiness School laid down the following in his book ManufacturingStrategy:
� Market qualifying criteria are attributes that the customer expectsfrom all competing suppliers. Some are more critical and are termedorder-losing sensitive qualifiers.
� Order-losing criteria are those considered to be critical to thecustomer and a failure to demonstrate them will exclude the supplierfrom consideration.
� Order-winning criteria are those attributes that enable a company’sofferings to gain an advantage over their competitors in the eyes ofthe customers. These eventually win the actual order.
Over time, order winners will tend to change to market-qualifying ororder-losing criteria and new order winners take their place. We musttherefore continually identify what these criteria are and ensure that ourinternal processes can deliver them to the customer and ensure they aresatisfied.
Criteria can be either related directly to the product itself, or they canbe more service oriented. A company, by focusing on those criteria inwhich it does well, will often gain a competitive advantage. Criterialooked for include:
� Speed of design process: Being able to quickly give a customer anidea of how you can meet his stated need. Increasingly important inconjunction with customer’s redesign process. Component and sub-assembly suppliers are increasingly working hand in hand with theircustomers on new designs. Being able to communicate electron-ically can be key here.

298 Meeting customer needs
� Speed of quoting: As many customers are looking for quick deliveriesof the product itself, the speed of replying to their requests for priceand delivery can be crucial in gaining the order.
� Quality: This covers several aspects:– Conforming to the customer specification for use.– Number of defects in a batch. Especially important as more
customers are moving towards having no incoming inspectionand putting incoming components straight onto the manufactur-ing line. This can apply to information as well as tangibleproducts.
– Reliability, i.e. the maintenance of good functional operationover time. Important to all customers, but more so to some, e.g.aeronautical and defence. May include aspects of ease ofmaintenance.
� Delivery on time: Being able to give a reliable time frame for adelivery is becoming more important as customers move towardsminimal inventory of raw materials and are geared up to JIT (just-in-time) operations. Being able to meet an advertised productlaunch date is especially important in maintaining an organization’scustomer image.
� Quick delivery: In many situations being able to give the customerimmediately what he wants when he asks for it is critical. In thiscase, we either need extremely efficient manufacturing or need tocarry a stock of items that may be wanted. The latter involvesstorage facilities, opens up the risk of obsolescence and ties up ourmoney. Many items, however, are expected to be available ex-stock,especially in convenience goods. However, we do need to be able togive all customers their delivery within the time they need it. TheP:D ratio can be critical in winning orders (see Figure 6.4.1).
� Flexibility in volume: Being able to react in tune with the quantityneeded by the customer in volatile markets can be attractive.
� Flexibility in design: Being able to quickly customize standarddesigns to meet the customer’s particular needs. Modular design isadvantageous here.
� Technical information: As many customers will not carry thetechnical expertise which should be within your organization, youmay need to be able to quickly and accurately answer technicalqueries. This can be pre-sales or after-sales.
� After-sales service: Often the product’s relationship does not finishwith the sale – there can be a large degree of follow-up service
Figure 6.4.1 P:D ratioshowing where a competitiveedge can be gained
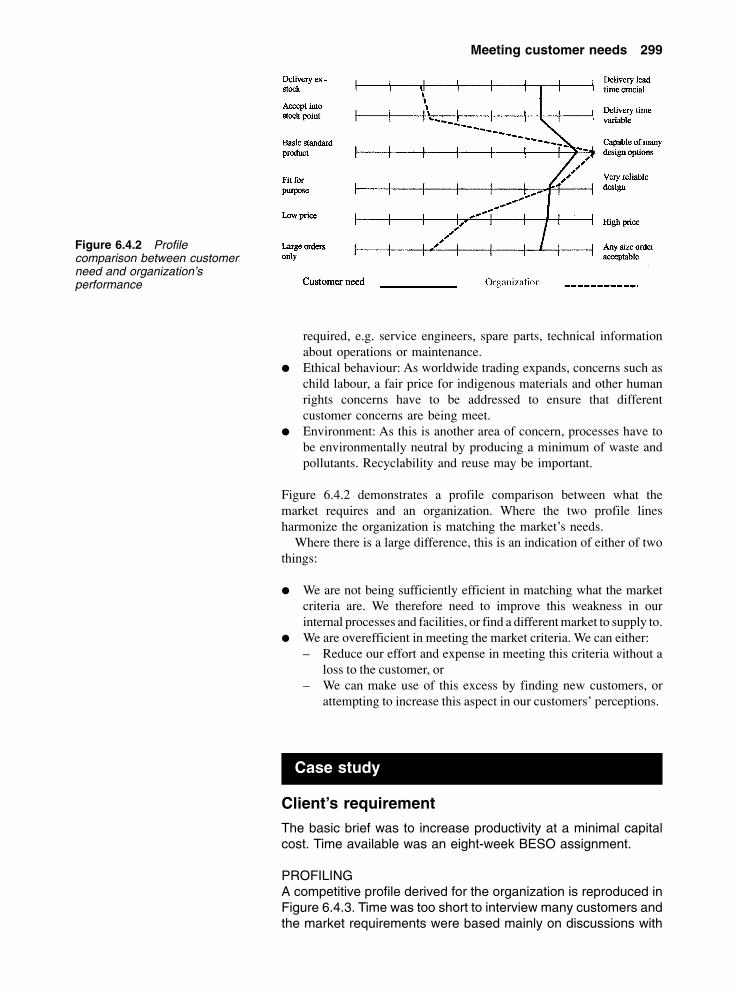
Meeting customer needs 299
required, e.g. service engineers, spare parts, technical informationabout operations or maintenance.
� Ethical behaviour: As worldwide trading expands, concerns such aschild labour, a fair price for indigenous materials and other humanrights concerns have to be addressed to ensure that differentcustomer concerns are being meet.
� Environment: As this is another area of concern, processes have tobe environmentally neutral by producing a minimum of waste andpollutants. Recyclability and reuse may be important.
Figure 6.4.2 demonstrates a profile comparison between what themarket requires and an organization. Where the two profile linesharmonize the organization is matching the market’s needs.
Where there is a large difference, this is an indication of either of twothings:
� We are not being sufficiently efficient in matching what the marketcriteria are. We therefore need to improve this weakness in ourinternal processes and facilities, or find a different market to supply to.
� We are overefficient in meeting the market criteria. We can either:– Reduce our effort and expense in meeting this criteria without a
loss to the customer, or– We can make use of this excess by finding new customers, or
attempting to increase this aspect in our customers’ perceptions.
Figure 6.4.2 Profilecomparison between customerneed and organization’sperformance
Case study
Client’s requirement
The basic brief was to increase productivity at a minimal capitalcost. Time available was an eight-week BESO assignment.
PROFILINGA competitive profile derived for the organization is reproduced inFigure 6.4.3. Time was too short to interview many customers andthe market requirements were based mainly on discussions with

300 Meeting customer needs
the organization’s marketing personnel. The company’s achievedperformance was arrived at by observation and discussion.
This clearly showed that the organization’s competitive advan-tage lay in its design skills. However, it also showed severalweaknesses, namely:
Lead time, due date adherence, price, quality.
Initially the identification of quality as one of the company’s majorweaknesses was not believed as they had a reputation ofproducing high-grade products for their customers.
Effect of quality problems
The starting point in persuading personnel that internal qualityproblems were the most important and were behind the othersymptoms started with demonstrating the consequence of qualityfaults as per Figure 6.4.4. The important items that were identifiedwere the following internal failure costs.
Figure 6.4.3 Company profileanalysis showing differencebetween consultant’s view andorganization’s view
Figure 6.4.4 Relationship ofpoor quality and reduction inprofit

Meeting customer needs 301
� Scrapped products – extra costs and delays in producingreplacements.
� Reworked products – extra costs and delays.� Inspection – highly skilled labour used in non-productive work.
The personnel within the organization, by not identifying rootcauses, were too often demonstrating their skill in rectifyingdefects rather than in preventing them reoccurring. By eliminatingmuch of the quality problems they could produce items quickerand with less costs.
The competitive profile
You need to closely assess your own position within the marketplace,not only against your customers’ criteria, but also in how yourcompetitors are matching these.
A polar chart (see Figure 6.4.5) or a profile comparison can illustratethe difference between you and your competitors in meeting thecustomers’ criteria. This demonstrates their and your relative strengthsand weaknesses under a variety of attributes.
Weaknesses have to be corrected, or protected. Strengths have to bebuilt on – especially if they are superior to the competition. In Figure6.4.5, we have a weakness in new equipment, but a strength in cashreserves. The strong cash reserve could be used to purchase up-to-dateequipment that may convert the present weakness into a strength. Itcould be used to support price reductions, mount a large advertisingcampaign or even to buy over a competitor.
Figure 6.4.5 Polar chartcomparison of organization andmajor competitor. The profilesare similar except that theorganization is performing betterin quoted delivery but worse inreliable delivery

302 Meeting customer needs
We also need to examine our entire supply chain for existing, orpotential, risks and problems. We are especially concerned with ourreliance on either particular suppliers or customers.
Suppliers
Here we are looking at our vulnerability to problems in supply fromhappenings such as strikes, takeovers, fires, etc. Question howdependent on each supplier you are, and how important you are to themin turn. Indicators are:
� What proportion of the requirement for any item does anyindividual company, or small group, supply?
� What proportion of their output do you take?� What other sources of supply are available?
Where we are heavily dependent on one, or a few suppliers we musttake strategic measures to ensure maintenance of supply. This mayinvolve seeking other possible suppliers.
The problem here is that relationships with suppliers can be crucial ifthey have expertise, or are willing to be flexible in their dealings withyou. Spreading purchasing can damage long-term relationships thathave been built up.
Looking at the supply position matrix (Figure 6.4.6) shows the fourextremes:
� Exposure low – low cost item: Buy tactically – play off suppliersagainst each other to give us special terms on delivery, etc.
� Exposure low – high cost item: Buy when prices are low, or demandis low.
� Exposure high – low cost item: Arrange a guarantee of supply,perhaps using a few key suppliers.
� Exposure high – high cost items: Serious if vulnerable – securelong-term supply agreement.
Customers
Here we are looking at our strength in relation to our customers. Whathappens if a major customer stops buying from us? In other words, howimportant we are to each customer and how dependent they are on us.Questions to be asked are:
Figure 6.4.6 Supplypositioning

Meeting customer needs 303
� What proportion of your output goes to your main customer, or eventhe top three customers?
� What proportion of your customers’ needs is met by you?� What alternative sources of supply are available?
When we are heavily dependent on a few customers we are vulnerablenot only to the possible loss of the trade, but to pressure being put on usby the customer, e.g. to reduce prices, accept late payments, reduce leadtime, etc.
Again we have a matrix to guide strategy – the supplier preference(Figure 6.4.7) where we examine our competitive advantage against theattractiveness of the customer.
� Low profit – no competitive advantage: This is a nuisance, and weshould examine it to determine marginal profits involved indropping it.
� Low profit – high competitive advantage: This should be exploitedto maximize revenue, bearing long-term relationship in mind.
� High profit – no competitive advantage: We need to develop long-term supply arrangements, being careful what we are willing to givein return.
� High profit – high competitive advantage: This is our core businessand we need to ensure that we do not lose it.
Threats of new entrants to market
Even when we a do have a strong position in a particular market, we arenot necessarily secure there in the future. If it is a profitable area, thiswill attract new producers to move into the industry. We need to ensurethat this is difficult by considering:
� Economy of scale: There are breakeven points for manufacturingdifferent quantities. We have to ensure that we maintain these forour own facilities which will make it difficult for new entrants to getenough orders to cover their costs. We also have to guard againstunnecessary centralization as that adds complexity and makes iteasy to get out of touch with customers.
� Capital requirements: Often costs are contained by using expensiveprocesses. We have to ensure that we maximize this throughinvestment and keeping capacity filled.
Figure 6.4.7 Supplierpreference

304 Meeting customer needs
� Customer loyalty: The cheapest customer to get to buy from us isone with whom we have already built up a relationship. We shouldensure we keep our customer happy.
� Learning curves: As an organization builds up experience in designand manufacturing, it discovers ways to improve output at reducedcost. We have to ensure we maintain our own learning andimprovement and keep ahead.
� Sophistication of technology: We must ensure that we keep up todate in both product and process technology.
� Distribution Channels: The complete channels give access to arange of customers. We have to maintain good relationships allalong the supply chain – both into us and from us to the enduser.
Where entry barriers are weak, we need to strengthen them by buildingcost and relationship advantages.
Threats of substitute products
All products have a natural life. The ideal situation is that the end of thatlife is within your hands and you can replace products readily. Tomaintain that position we need to be continually researching the marketto determine what substitute products already exist, and researching tosee how easily they could be developed.
These researches should also feed back into your own developmentprogramme for new products. Better that you bring them to market, thanyour competitors.
Existing competition
We have to continually be aware of our competitors and what they aredoing. We also need to be aware of factors that may lead to intensecompetition developing:
� Numerous, or equal sized companies: Difficult to maintain adominant position.
� Slow market growth: As capability improves, we normally need toexpand sales to maintain our return on investment. Slow marketgrowth means that all the suppliers intensify their activity to gainwhatever growth there is.
� Lack of product differential: Where all suppliers offer the samebasic product, then other non-feature aspects are used to try to gaincustomers. These include advertising campaigns, price cuts, specialoffers, etc.
� Capacity utilization: Where spare capacity exists either in theindustry as a whole, or in a particular competitor, then specialefforts will be made to fill that capacity. Often the only way to dothis is to capture customers from others.
Looking at the influence of each of these four factors together leads towhat is termed a five-force analysis – the fifth factor being the resultantrivalry.

Meeting customer needs 305
Market strategy and planning
It is important that an organization carefully plans out its future strategyin product development.
The Ansoff matrix (see page 263) explored potential areas of growth.The General Electric matrix (Figure 6.4.8) attempts to denote anorganization’s market competitiveness. The circle size indicates the sizeof the market and the segment the market share. The length anddirection of the arrow indicate direction and speed of the expectedchange.
Competitiveness position is determined by a mixture of market share,strength of product line, relative cost/price structure, distributionfacilities, brand profile, technical skills, production facilities, rawmaterial sources, strength of sales staff, etc.
Market size, market share, profit margins, capital investment needed,competition, technical synergy, customers, risk, growth, etc. determinethe market attractiveness.
From an analysis of where we are and where we can/wish to go, wecan draft detailed marketing plans:
� Determine relevant markets and their segmentation.� Identify characteristics of the potential segments.� Evaluate segment attractiveness and the organization’s competitive
position serving each segment.� Select target market segments.� Set objectives and strategies for each selected segment.� Develop full marketing mix for each selected segment.� Implement marketing plan with feedback and control.� Decide degree of diversification.
An organization’s ability to turn these plans into reality is determined bytheir capability. It is important therefore to be able to clearly establishwhat the organization has in resources, i.e. its staff and their skills;techniques; processes, etc. They can then ensure that the market planutilizes their strengths, or that action is taken to rectify any weaknesses.A full SWOT (Strengths, Weaknesses, Opportunities, Threats) analysisneeds to be carried out looking both internally and externally.
Co-operation with other organizations
At sometime, most organizations have to co-operate with otherorganizations. The idea behind co-operation is to make use of the
Figure 6.4.8 GE matrixshowing relative market sizeand direction of market trend

306 Meeting customer needs
separate skills, experience and contacts in a way that each of theseparate organizations are unable to do by themselves. The co-operationmay be due to:
External forces:� Globalization: In order to gain access to markets it is necessary
to have a very wide presence. This can be expensive anddifficult.
� Share technology: Because of the cost of researching and devel-oping new products and processes and then attended risk, manyorganizations share the cost and benefits.
� Economy of scale and scope.� Trading in other sectors can counterbalance turbulence in the
organization’s normal sectors.
Internal forces:� Competence weakness in skills, technology.� Capital involved may be difficult for one organization to fund.� Risk limitation or sharing.� Speed of development – joint forces increasing effort.� Defence against predators.
Type of co-operation:� Alliance: A temporary informal joining together, normally to
tackle a particular problem.� Consortium: Coming together to make up a wider skill base –
such as bidding for the building and equipping of a powerstation.
� Joint venture: Forming a separate legal entity to exploit aparticular market or product development. Often the only legalway to work in some countries is a joint venture with a localcompany or individual.
� Merger: A full joining into one organization.� Acquisition: Buying over another organization – may be hostile
(unsupported by the board of the bought company) or friendly(recommended by the board).
In all cases there will probably be problems arising through severaldifferent cultures and management styles competing in the neworganization or relationship. It is noticeable that over 50% of mergersend up with a smaller benefit than envisaged.
Making contingency plans
The difficulty with the marketplace is that it is always changing and acompany must be ready to react to these changes. One way is to followup a forecast of the possible future changes in the market or theenvironment by devising plans to cope with these possible changes.
The way that this is achieved is by scenario analysis. This is based onthe organization’s competitive analysis and then applying the principalimpact factors from three scenarios, derive the likeliest possible severeimpact on the organization. By looking at this impact and its probabilitythe need to develop a contingency plan to deal with the impacts will beprioritized.

Meeting customer needs 307
As an example take a university offering engineering degree courses.The scenarios are:
(1) No change from present trends.(2) The government increases funding to home students.(3) The government reduces funding.
The principal areas of concern are:
(A) The level of costs.(B) Nature of competition.(C) The strength of demand.(D) Difficulty in attracting staff.
The evaluated events are then placed on a scenario matrix as in Figure6.4.9. Using the letter and number, e.g. A.1, is the cost factor changeunder scenario 1. The axes are ‘probability of occurrence’ and ‘strategicimportance’. Quadrant one, i.e. top right hand, is where the likelystrategically important factors will congregate. In this case, strategiccontingency plans must be made for events A.2, C.2 and D.1.
Further outline plans may be considered for those just outside thisquadrant, i.e. events within the dotted lines, e.g. A.1, B.2, C.1 and A.3.
Table 6.4.1 Scenarios
Impact factors Scenario
1 2 3
(A) Costs Slow rise Fast rise Pressure to fall(B) Competition Steady Slow rise Fast rise(C) Demand Slow rise Fast rise Fast fall(D) Staff attracted Slow fall Fast rise Fast fall
Figure 6.4.9 Scenario matrix

308 Meeting customer needs
Case study
Situation
A small company supplied specialist jams to a few major retailinggroups. Six months previously a new competitor appeared whowas making inroads into the company’s market. This extract isfrom a consultant’s initial report.
1. IntroductionThe following are the steps to be taken to analysing the companysituation and develop proposals for action in the short and longterm.
2. Measurement of key resultThe following standard financial measures should already beavailable, or could be calculated quickly. They need to show at twopoints – prior to entry of new competitor and changes since.
� Profit and loss.� Sales in units and money.� Production costs and gross margin.� Administrative expenses and net margin.� Cash flow.� Inventory levels.� Dispersion of profit – tax, dividend and retained.� Borrowing and resultant leverage.� Return on capital employed and net assets.
These will give an indication of the seriousness of the presentsituation.
In addition the following need to be evaluated for the same timepoints:
� Customer base – number of, sales per unit, location, etc.� Production, capability and capacity utilization.� Quality indicators such as rejects and returns.� New products introduced and in development cycle.
The final items are to establish the market in my mind – especiallythe strength, or weakness of the company and its competitors thatwill guide any recommended action.
� History of the company.� Major changes in key personnel in last two years.� Age and condition of equipment.� Product life cycle and seasonal effects.� Supplier base and production cycle time.� Recent advertising and other promotional campaigns.� Competition analysis – especially the new entry.
From all the above, the trends involved can be established to showtime available for action and the direction the company may movein both the short term and longer term to (re)establish good results.

Meeting customer needs 309
3. Possible improvementsOnce the initial evaluation has been carried out, there may beseveral ways in which the company should proceed. Whichparticular one, or combination of several, will be determined by theanalysis. The following are not listed in any preference order.
3.1 Reduce outgoingsAlthough this is a common approach, it easily results in futureproblems if not approached correctly. However, there should beno problems in ensuring that the company maximizes its presentuse of resources:
Supplier base. Ensure that they are well served by suppliers –high quality; delivery as and when required, value for money,quick reaction, etc. Should be minimum number if possible,consistent with security of supply.
Production base. Ensure processes operating to maximumefficiency through well-maintained machinery, well-trained andmotivated operators, good planning, low reject rates and minimumwaste, including effluent.
Design. Ensure design cycle matches customer needs withminimum failures. Ensure process of changeover from develop-ment to production is well organized beforehand. Severe cut-backs in this area will damage future viability.
Buildings. Ensure that premises match requirements in space andminimal energy losses.
Overheads. Ensure these contribute towards the survival andeffectiveness of the organization.
Systems. Ensure these are geared towards customer require-ments in most efficient manner, e.g. quick and accurate ordertaking. IT must be fully supportive.
Management. Do they have skills and experience required?
A main problem arises if analysis shows that there are too manystaff to support envisaged operations and a reduction is indica-tion. If handled poorly this can result in low staff morale and senda message of weakness to our competitors and suppliers.
Targets and controls should be set up in each area.
3.2 Increase sales incomeThere are several ways of increasing sales – dependent on thepresent customer base, and loyalty, and the strengths of theexisting, or potential, competitors.
ANSOFF’SMATRIX
Currentproducts
Newproducts
CurrentMarkets
Marketpenetration
Productdevelopment
NewMarkets
Marketdevelopment
Diversification

310 Meeting customer needs
3.2.1 Market penetration: This is basically attempting toincrease the company’s share of the existing market.There are several ways in which this can be done:(i) Advertising and other promotions: This can be
successful, but does not give a guaranteed result. Itcan be expensive and can be reacted to quickly bycompetitors. If competition has greater access toreserves or other funding the advertising battles canbe exhaustive.
(ii) Meeting customers’ order-winning criteria: In themedium term this will pay off. Main problem isestablishing these criteria and ensuring they are metor exceeded. Criteria include – low delivery time,reliable delivery, high specification, low price, highquality, quick reaction to change in customers’demand be it volume, or new products.
(iii) Increased selling effort – reaching customer andpersuading them to place orders: Can initially beexpensive and have to be careful not to make salespitch too hard.
3.2.2 Market development: This is attempting to find newmarkets for the company’s products. These could be:(i) Greater cover to reach all potential customers within
the present sales area (if any missed out).(ii) Going beyond present geographic area into other
areas of same country, or into export market (if notalready there) – or intensifying effort if already doingso. UK food goods still have a good name in foreignparts, especially within the commonwealth – and fulladvantage of this has not been made. As distancewidens, however, so does the complexity of control –decisions such as opening own sales offices ordealing through agents need to be made.
(iii) Finding new customers different from present ones.For example, it may be supplying restaurants, orhigh-class department stores or sales at venues suchas airport duty free shops.
3.2.3 Product development: A way to find different products thatcan be sold to the existing customer to meet their otherneeds. Again there are several ways to do this:(i) Customizing existing products to meet particular
customer wants.(ii) Developing, or buying in, complementary products
that can use present contact points.(iii) Widening product mix – not just in variety of jams but
also in variety of packaging, e.g. present typepackages.
3.2.4 Diversification: A way of finding different products to sell toan entirely different customer base – in effect a combina-tion of 3.2.2 and 3.2.3.
The competitiveness position is determined by a mixture ofmarket share, strength of product line, relative cost/price

Meeting customer needs 311
structure, distribution facilities, brand profile, technical skills,production facilities, raw material sources, strength of sales staff,etc.
From an analysis of where they are and where they can/wish togo, we can draft detailed marketing plans:
� Determine relevant markets and segmentation.� Identify characteristics of potential segments.� Evaluate segment attractiveness and organization’s com-
petitive position.� Select target market segments.� Set objectives and strategies for each selected segment.� Develop full marketing mix for each selected segment.� Implement marketing plan with feedback and control.� Decide degree of diversification.
These will prove necessary to the long-term survival of thecompany but need to be developed now. They all require areservoir of resources, experience and skills that may not beavailable within the company.
4. Capability and resourcesThe company’s ability to turn plans into reality is determined bystaff’s capability. We must establish what the organization has inresources – people and skills, techniques, processes, etc. Theycan then ensure that the plan utilizes their strengths, or that actionis taken to rectify any weaknesses.
Weakness can be met by retraining, importing new skills or co-operating with other organizations to gain from that organization’sstrengths.
The type of co-operation can be alliances, consortium, or jointventures. Each of these has advantages but possible problems inlessening control.
Problems 6.4.1
(1) What are the product features and attributes associated witha wrist-watch?
(2) Why do order-winning-criteria tend to change to market-qualifying criteria over time?
(3) If you were in the home delivery service, what factors wouldyou consider worthy of considering in a scenario analysis?
(4) If you were a university, what factors should you consider ina competitiveness analysis?
(5) What partners could a university consider in the UK andfurther afield and what would be the best relationships to beformed?

7 Informationtechnology andelectroniccommerce
Summary
Information technology is increasingly important in everything we do. This chapter should indicateto you what skills you will need to have, and what you will use them for, in order to use ITeffectively.
It begins with a survey of the changes that IT is producing at the beginning of the twenty-firstcentury, and the social and legal results of these changes. There follow sections on the use of themost common operating system functions followed by the major applications used for text,number and general data processing, and applications more specifically used by engineers. Thechapter concludes with a section on the technology and use of the Internet and the growth ofe-commerce.
Objectives
By the end of this chapter, the reader should be able to:
� recognize and respond to the effects of IT in changing the organization;� use a computer, particularly a PC, efficiently;� use common ‘office suite’ applications effectively;� get the most from engineering applications;� exploit the power of the Internet, particularly e-mail and the Web;� understand the potential for the use of e-commerce.
7.1 IT andchange inorganizations
IT (which is sometimes called ICT, information and communicationstechnology in the academic world) has produced and is producing vastchanges in the way companies and organizations function. This sectiondescribes the main IT influences and their impact.
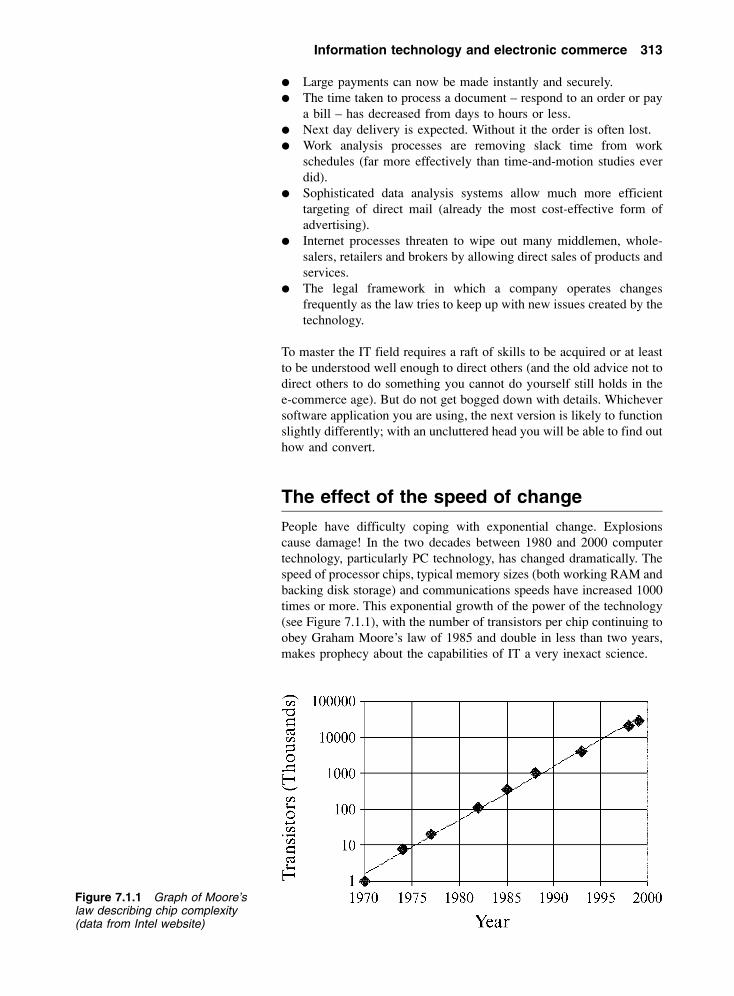
Information technology and electronic commerce 313
� Large payments can now be made instantly and securely.� The time taken to process a document – respond to an order or pay
a bill – has decreased from days to hours or less.� Next day delivery is expected. Without it the order is often lost.� Work analysis processes are removing slack time from work
schedules (far more effectively than time-and-motion studies everdid).
� Sophisticated data analysis systems allow much more efficienttargeting of direct mail (already the most cost-effective form ofadvertising).
� Internet processes threaten to wipe out many middlemen, whole-salers, retailers and brokers by allowing direct sales of products andservices.
� The legal framework in which a company operates changesfrequently as the law tries to keep up with new issues created by thetechnology.
To master the IT field requires a raft of skills to be acquired or at leastto be understood well enough to direct others (and the old advice not todirect others to do something you cannot do yourself still holds in thee-commerce age). But do not get bogged down with details. Whicheversoftware application you are using, the next version is likely to functionslightly differently; with an uncluttered head you will be able to find outhow and convert.
The effect of the speed of change
People have difficulty coping with exponential change. Explosionscause damage! In the two decades between 1980 and 2000 computertechnology, particularly PC technology, has changed dramatically. Thespeed of processor chips, typical memory sizes (both working RAM andbacking disk storage) and communications speeds have increased 1000times or more. This exponential growth of the power of the technology(see Figure 7.1.1), with the number of transistors per chip continuing toobey Graham Moore’s law of 1985 and double in less than two years,makes prophecy about the capabilities of IT a very inexact science.
Figure 7.1.1 Graph of Moore’slaw describing chip complexity(data from Intel website)

314 Information technology and electronic commerce
Whole industries need to rethink their structure. When data could becommunicated at 300 bit/s, the digital data on a CD would have takennearly a year to send from Hollywood to London. Prevention ofcopyright was a matter of keeping tight control of originals, and ofseizing poor copies of copies ‘in the interests of preventing the customersuffering from an inferior product’. With cable modem internetconnections at 1 Mbit/s, a single bootleg copy of a music album, orvideo of a new film can be broadcast round the world in about an hour,seriously disrupting the neatly phased marketing strategies and incomegeneration of the entertainment industry.
Activity 7.1.1
Imagine you have a piece of paper that you fold in half,stacking one sheet on the second. Imagine that you repeatthis twenty times. Without calculating, estimate how thick thepiece of paper would be? Did you imagine a sheet of paperabout 0.2 mm square and 100 m high? The brain has difficultyin dealing with exponential processes of this sort, seeming toimagine twenty folds and not 1 million, and getting the heighttotally wrong.
Working smarter not harder?
The implication of much IT advertising is that if you buy morecomputing power people will be able to compete more effectively whilstworking no harder. In practice the effort saved is illusory, and theexpectation is that this time is available for equally productive work.Some concern has already been raised about this. In Japan thephenomenon, called ‘karoshi’, has been known for some years, and in2000 the first Japanese family was compensated for their son dyingthrough overwork (Financial Times, London, 24/06/00). The problem isnot restricted to Japan.
The solution is not easy to find since karoshi affects all walks of life.With IT systems in place, work time may be measured far more exactlythan could ever previously be done, and everyone is encouraged tocompete with the best, until they ‘burn out’. Continuous changedevalues experience and the opportunities for the older slower brain torest awhile and let the young and thrusting forge ahead until they meetan obstacle that only the experienced have met are diminishing.
Data mining
Large organizations have decades of archive data, once simply kept forthe historical record, for ‘just in case’. With hindsight it is possible tosee uses for this data that were not perceived at the time, or simply notpossible at the time due to lack of number-crunching power. Datamining reuses all this old data to answer useful questions.
One very serious question was the discovery, on old tapes ofmeteorological records of the Antarctic bases, of baseline data from

Information technology and electronic commerce 315
which the rate of development of the hole in the ozone layer could beestablished and its link to the growth in CFCs established. Oneinteresting feature of this was the difficulty the scientists had in readingthe tapes. These had been archived properly, in secure, dry conditions,but the tape readers had become obsolete and only a frantic searchrevealed the existence of a working model.
Engineering museums might be necessary as reservoirs of techno-logical artefacts in the future.
Direct sales
Commercial organizations also have large repositories of information,and use it to target their customers with direct mail, from which theyclaim to get a good response despite the amount of such paper that isthrown away daily. (To put this in perspective, 3% is regarded as anexcellent reply rate for direct mail.)
Big supermarket chains remain quite open about the value of theirstore cards as marketing tools. They could go much further and link thestore card data with their sales data, building up a detailed profile thatwould permit personalized letters reminding about particular productsthat, for example, had not been bought for at least two weeks.
Consumer groups have declared this intrusive and some supermarketshave publicly denied considering doing it, or that their computersystems have such capacity at present. The Data Protection Act will alsolimit the ability to use such personal data.
Activity 7.1.2
Take some junk mail that you have received. Try to work outhow they found your name and address. Did they use theelectoral roll, or have you responded to some previousadvertisement? Try adding a (false?) middle initial whencompleting unimportant forms, and then notice when itappears unexpectedly.
The legal framework
The law affects computing in several ways. It protects the buyer fromshoddy goods; it protects the producer from being undercut by a copyfrom whose sales the development costs do not have to be reclaimed. Itprotects everyone from the misuse of personal data. It discourages thosewho would maliciously damage software systems.
The sale and supply of Goods Act 1994 and theSale of Goods Act 1979
These laws state that items sold must be fit for their purpose asdescribed or recommended by the seller, provided the customer is usingit according to instructions. So it is possible to take that computerprogram back, even with its broken seal, and demand your money back

316 Information technology and electronic commerce
if you were led to believe that it would do more than it did. It is difficult,however, since imperfect performance seems to be tolerated much morein the IT industry than in other industries, and proving that you did nottake an illicit copy is impossible.
Intellectual property: overview
Legal protection of intellectual property, the right to exploit ideas thatsomeone thought of first, has a long history. Charles Dickenscampaigned for the first Copyright Act to protect his income as a writer.Patents originated in the 1623 English ‘Statute of Monopolies’ that gaveinventors a monopoly on their ideas if they agreed to publish them. Inthe UK the Copyright, Patents and Registered Designs Act 1988 and theTrade Marks Act 1994 are most recent. In the US there is a DigitalMillennium Copyright Act 1998 among others.
Copyright
Copyright originally applied to written materials only. The definitionhas been extended to cover recorded music and video, broadcast mediaand computer software. Essentially it is illegal to copy any of theseunless the author’s permission is given, but there are many exceptionsand the length of time for their protection varies from 15 to 70 years.
Patent
Patents were originally designed to allow inventors to make moneyfrom their ideas by preventing illicit copying, with the additional benefitto society of having their details published and thus promotinginnovation. They largely apply to innovatory things and processes thatare useful in the real world. Some overlap with copyrights may occur ina product design, where a new software idea might be patented, and itsdocumentation and ‘look and feel’ copyrighted.
Trade mark
Trade marks apply to the names, logos and other devices – such as color,sound and smell – that are used to identify the source of goods orservices and distinguish them from their competition.
Application of IP laws
Application of these laws to IT and computing continues to requiremodifications to original definitions, and has become much morecomplex with the speed with which ideas can be spread across theworld. In software the value of the merchandise is entirely in thethoughts of its creators and in what it can do, and many person-years ofwork can be copied in a few seconds. For this reason a lot of effort hasbeen expended by FAST, the industry-sponsored Federation againstSoftware Theft (website: http://www.fast.org.uk) to investigate and actagainst software piracy.
The laws also vary from country to country. US law often predominatesbecause the US has the largest market, and currently dominates theInternet, and so IT users have to comply with US regulations.

Information technology and electronic commerce 317
Commercial pressure from major multinationals is slowly forcingcountries to enact similar laws in order that, eventually, no one will beable to buy a $500 software package legally for $20 as has beenpossible.
Details of US law can be obtained from the US State Department’swebsite, or one of many legal advice sites, e.g. http://www.nolo.com.
Possible abuses of intellectual propertyprotection
Some trade marks are potentially problematical, e.g. MicrosoftTM havetrade marked WindowsTM. Fortunately commonsense prevents thisbecoming a problem for double-glazing firms.
More seriously, there is an increasing number of patents (applied forand even granted) which if enforceable could have far-reaching effects.In the computer-based learning domain, for example world patentWO9822864 has been granted:
COMPUTER EDUCATION AND EXECUTION INTER-FACE OPERABLE OVER A NETWORK
A computerized, multimedia education and execution inter-face system and method for educating and entertaining astudent user according to a teacher user’s options. The systemincorporates the education techniques of video segments, on-line student and/or teacher activity, written instructions,student’s activity monitoring, student rewarding and educa-tion and entertainment program content filtering. The environ-ment uses various input devices including a mouse and akeyboard. Compact disk drive with main memory and diskdrive store the various programs and education data. An audiointerface and video controller and screen with a centralprocessing unit communication over a bus complete thesystem.
Such a broadly defined patent, if enforceable, would cover a huge sliceof computer-based learning and make some corporations extremelywealthy. Its enforcement would enrich many lawyers!
Shareware and freeware
Authors who do not wish to market their software conventionally, eitherbecause their product is too similar to another, which is already wellmarketed, or because their target audience is too small/specialist tomake marketing practicable, can use the shareware option. In this theyretain copyright, but allow free copying of their software with theproviso that after a trial period a token sum is sent to the author, oftenin exchange for an up-to-date version or manuals. Though many peopledo not pay up, a sizeable income can be obtained from marketing a goodproduct in this way.
Authors with altruistic tendencies can distribute their work asfreeware, whereby they retain copyright but allow free use of thesoftware. There is a whole sector of the computer industry involved inproduction of products for LINUX (the freeware version of UNIX

318 Information technology and electronic commerce
originally developed by Linus Torvalds), and sharing ideas aboutdevelopment and bug elimination.
Shareware and freeware authors must be careful not to infringe thepatents of others. Unisys, who currently own the patent for the type ofdata compression used in the popular GIF graphics files, now ask for a feebefore allowing authors to use this type of file. The sum required isenough to deter anyone unsure of any profit, and has added impetus to thedevelopment of a freeware PNG portable network graphic standard.
It is quite possible to make money from freeware! Red-Hat andCaldera, among others, have built businesses by packaging up LINUXand its tools and applications, freely available from the Internet butdistributed in many places, and selling them on as (relatively cheaperthan on-line charges) CD-ROMs.
Activity 7.1.3
If you have a PC at home, assess how careful you are to useonly software that you are entitled to use.
Data protection
The Data Protection Acts 1984 and 1998 protect people from theelectronic equivalent of gossip, malicious and otherwise. Before 1984 itwas possible to be told you were a ‘bad risk’ for a loan, and to be unableto do anything about it. Now those who have personal data on theirsystems have to reveal its existence by registering with the DataProtection Registrar, only to retain it for the purpose for which it wasgathered, and protect it from illicit access. We have rights to find outwhether data is held about us, what data is held, and to have it correctedwhere there are errors. Everyone should be aware of the eight basicprinciples (from the Data Protection Registrar’s website, http://www.dpr.gov.uk), either as a data user or as a data subject:
Anyone processing personal data must comply with the eightenforceable principles of good practice. They say that datamust be:
1. fairly and lawfully processed;
2. processed for limited purposes;
3. adequate, relevant and not excessive;
4. accurate;
5. not kept longer than necessary;
6. processed in accordance with the data subject’s rights;
7. secure;
8. not transferred to countries without adequate protection.

Information technology and electronic commerce 319
Personal data covers both facts and opinions about theindividual. It also includes information regarding the inten-tions of the data controller towards the individual, although insome limited circumstances exemptions will apply. Withprocessing, the definition is far wider than before. Forexample, it incorporates the concepts of ‘obtaining’, ‘holding’and ‘disclosing’.
The Computer Misuse Act 1990
The Computer Misuse Act was designed to discourage tampering withcomputer systems by hacking, either software or data, or by the writingof malicious programs, e.g. viruses. There are three types of offence:
(1) Unauthorized access to computer material (i.e. hacking andattempted hacking into a system).
(2) Unauthorized access with intent to commit or facilitate commis-sion of further offences (the further offences are unspecified, butthe penalty is higher than in 1).
(3) Unauthorized modification of computer material (this is inter-preted to include both hacking in and changing something and thewriting of viruses).
There have not been many prosecutions under the Act, since evidence isvery hard to acquire and action is hard to take. It would be a brave bankthat helped prosecution of a hacker for successfully breaching theirsecurity, since such revelations would seriously damage its owncredibility. And though viruses regularly appear it is difficult to pursuesomeone living across the other side of the world.
Activity 7.1.4
Use an internet browser to access the Data ProtectionRegistrar’s site and find out more about the rights andresponsibilities of data users and of data subjects under theData Protection Act.
Health and safety
Organizations have a major responsibility when it comes to health andsafety. Fortunately most computer systems are relatively safe (againstelectrocution, for example), but it is still possible to break the law withtrailing power leads or jury-rigged network cables.
VDU radiation
Concern is still shown by some as to the effect of low-level radiationfrom computer monitors. No real proof has come to light. Unbornchildren were thought to be particularly at risk and pregnant women

320 Information technology and electronic commerce
advised to work elsewhere. However, both mother and child arecurrently thought to be more at risk from restricted movement due topoor sitting arrangements.
Posture and general ambience
Working long hours sitting slumped over a computer terminal with poorlighting is the most likely cause of workplace related illness for users ofIT. Regular eye tests are prescribed for employees working at a terminalfor several hours per day. There are fairly stiff guidelines for positioningof monitor, keyboard and chair, and for window blinds and types oflighting, to try to eliminate the major effects of eyestrain, back problemsand repetitive strain injury (RSI). RSI is a serious problem for those whomust input large amounts of text or data. These guidelines should befollowed, together with the advice to take regular breaks, if you have totake on such a task, even for a limited period. See the Health and SafetyExecutive’s website at http://www.hse.gov.uk for more information.
Activity 7.1.5
Use the internet URL given to find out the rights andresponsibilities under the Data Protection Act and the Healthand Safety (Display Screen Equipment) Regulations 1992.
Problems 7.1.1
(1) What does Moore’s law say about the growth in power of themicrochip? Why does this make the effects of change in ITdifficult to predict?
(2) Estimate the number of bytes required to store the text of anencyclopaedia (any large book will do – count the charactersper line including spaces then multiply by the number of linesand the number of pages). How many such books would fiton a CD-ROM of 600 MB? How long would it take to transmitsuch a book across a network at 100 Mbit/s (roughly10 Mbyte/s)?
(3) You have received a shareware program from a friend.Which laws protecting intellectual property affect your use ofit?
(4) What is RSI? How can you protect yourself against itseffects?
7.2 Usingcomputerapplicationsefficiently
Applications are the programs for which computers are bought, in orderthat letters can be written and edited, CAD drawings modified,databases accessed, etc. Every application has its own set of methodsand processes, but there are many common ones that apply. You need aportfolio of skills in the use of these applications. You will find it mostprofitable to notice the features common to all (most?) of the

Information technology and electronic commerce 321
applications (these, like cut and paste, only need learning once). Thenget a grasp of the main processes in particular types of application(these, like mail merge in a word processor, differ in detail only withmanufacturer and version, and a little investigation of a new packagecan usually make it work).
Application skills: to be able to:
� produce documents using a word processor or desk-toppublisher;
� analyse data and model processes using aspreadsheet;
� organize and extract data efficiently using a databasepackage;
� handle e-mail effectively;� search the Internet and other databases effectively;� obtain new skills using a computer-based learning
package;� present information to clients and the outside world.
This chapter is too short to teach you all these skills, and certainly notin detail, especially since the precise detail varies between packages,and also between versions. The aim is to outline what you should try outon the software that is available to you most abundantly whilst studyingso that you can be confident when starting work. Above all you needunderstanding and an overall grasp. The detail of the software changes,from source to source, and from version to version. What you can dowith it is much more constant.
Operating systems processes
The operating system is the software that runs the basic processes of thecomputer. It permits storage of computer data in named files, and allowsthose files to be stored systematically in folders (also known asdirectories) and sub-folders. It further allows such files to be loaded andsaved, created and copied, moved and destroyed, printed andexecuted.
File naming conventions
Filename rules vary. Some early PC operating systems, e.g. MS-DOS,were limited to 8 letters, plus a 3-letter extension (the 8.3 convention,e.g. MYLETTER.DOC), but most allow much longer names, withlonger extensions. It is even possible to have a space in a name, e.g. MYLETTER.DOC, though this is best avoided since it minimizescompatibility across platforms. Some computer users join words with anunderscore as in My_letter.doc, or use the increasingly popularCapitaliseEachWord convention, producing MyLetter.doc. The exten-sion, e.g. .doc, is often used by the operating system to link the file withthe application that produced it, allowing it to be opened more easily.
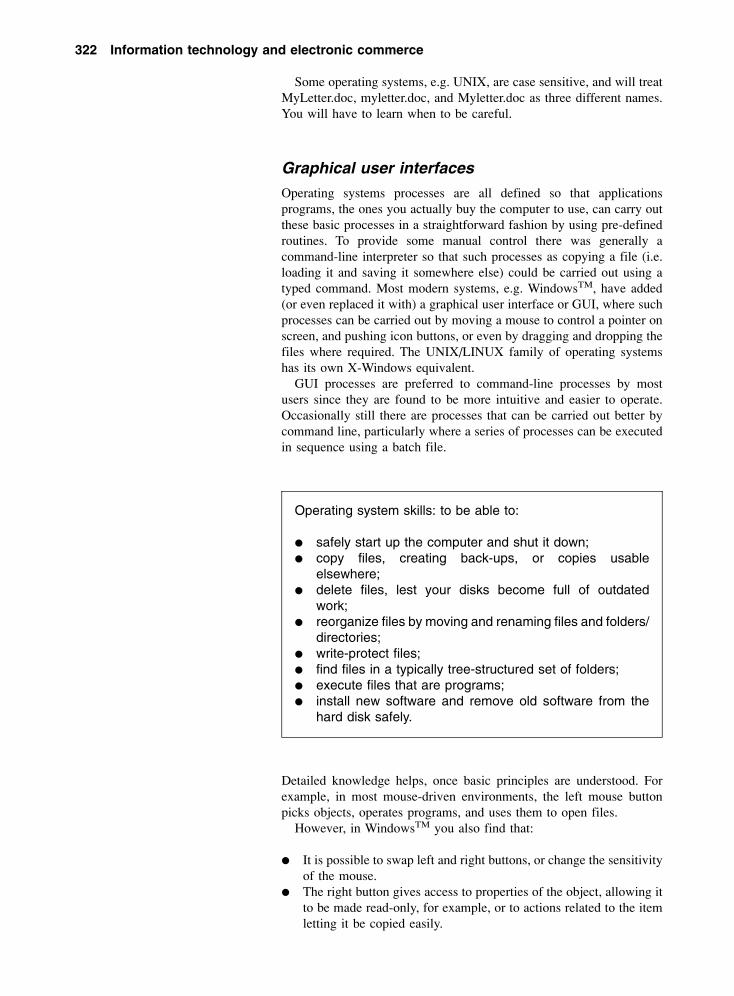
322 Information technology and electronic commerce
Some operating systems, e.g. UNIX, are case sensitive, and will treatMyLetter.doc, myletter.doc, and Myletter.doc as three different names.You will have to learn when to be careful.
Graphical user interfaces
Operating systems processes are all defined so that applicationsprograms, the ones you actually buy the computer to use, can carry outthese basic processes in a straightforward fashion by using pre-definedroutines. To provide some manual control there was generally acommand-line interpreter so that such processes as copying a file (i.e.loading it and saving it somewhere else) could be carried out using atyped command. Most modern systems, e.g. WindowsTM, have added(or even replaced it with) a graphical user interface or GUI, where suchprocesses can be carried out by moving a mouse to control a pointer onscreen, and pushing icon buttons, or even by dragging and dropping thefiles where required. The UNIX/LINUX family of operating systemshas its own X-Windows equivalent.
GUI processes are preferred to command-line processes by mostusers since they are found to be more intuitive and easier to operate.Occasionally still there are processes that can be carried out better bycommand line, particularly where a series of processes can be executedin sequence using a batch file.
Operating system skills: to be able to:
� safely start up the computer and shut it down;� copy files, creating back-ups, or copies usable
elsewhere;� delete files, lest your disks become full of outdated
work;� reorganize files by moving and renaming files and folders/
directories;� write-protect files;� find files in a typically tree-structured set of folders;� execute files that are programs;� install new software and remove old software from the
hard disk safely.
Detailed knowledge helps, once basic principles are understood. Forexample, in most mouse-driven environments, the left mouse buttonpicks objects, operates programs, and uses them to open files.
However, in WindowsTM you also find that:
� It is possible to swap left and right buttons, or change the sensitivityof the mouse.
� The right button gives access to properties of the object, allowing itto be made read-only, for example, or to actions related to the itemletting it be copied easily.

Information technology and electronic commerce 323
� <SHIFT> with the right button may allow better control of thoseactions, e.g. opening a WordTM document with a different packagefrom the desktop.
� The <F1> key gives access to context-sensitive help.
Exploring the use of such options and processes can greatly increaseyour productivity (and hence salary).
Help!
Modern software generally comes with an on-line help facility that canbe actioned simply with a keystroke or two. Help files are a preferredmeans of documenting features of the program, especially where itwould take up an inordinate amount of paper.
Learning to find out what help is available, as documentation or asexamples, is a skill that will enable software to be learned more quickly.Many computer users read the manual as a last resort. Use the helpfacility more frequently.
If you prefer books there are a plethora of new ones produced everytime a popular package is launched or updated. You may find that evenThe Complete Moron’s Guide to X has useful information for beginners.If you have to buy an expensive book, check out the ‘sale’ shelves forguides to a previous version; the basic software may not have changedmuch.
Networks
Most computer installations are networked, even if only by modem tothe Internet, in order that outside resources, e.g. websites or softwarearchives, can be accessed. Their use requires you to be able to connectto and disconnect from the resources you require, to understand andoperate the password and other security requirements of the system, andto have some grasp of the complex data structures that a large networkhouses.
Network skills: to be able to:
� log on to the network;� change the password where possibly compromised;� understand how to get to and use your home
workspace;� understand how to get to and use any shared
workspace;� give others limited access to your files and directories;� find and execute appropriate system and application
software;� log off the network.

324 Information technology and electronic commerce
Auxiliary hardware: peripherals,connections and storage
A peripheral is an extra piece of equipment attached to the computer andcontrolled by it, such as a printer or scanner. Network connections anddisk storage systems used to be peripherals, but are now generallyhoused in the main processor box and considered as part of the maincomputer system (except for handheld computers, and this may yetchange).
You need to know how to service these items, preparing them for useby replacing disks, paper, ink or leads, and cleaning them whenrequired. When working with a complex system it is useful to know howto troubleshoot (and to know when to call in the experts!).
The mouse is a simple example, particularly when heavily used in agreasy or dusty environment, when the pointer action it producesbecomes erratic. Cleaning the accumulated grime from its rollers byopening it up and swabbing them with a small amount of methylatedspirit is not difficult. Nor is replacing it with another mouse costing afew pounds; the latter may be more cost-effective.
Hardware skills: to be able to:
� insert and extract removable data storage of whateverkind your system has, e.g. floppy disk, Zip drive, DVD;
� prepare floppy disks (and other magnetic media) for datastorage by formatting;
� write-protect magnetic disks and tapes, and keep themaway from damage, both mechanical (mainly dust andfinger grease) and magnetic (usually electromagneticfields such as those controlling a VDU);
� look after CD-ROM and DVD media, distinguishing thevarious types;
� replace paper (and disposable parts such as ink heads) inprinters;
� check network, modem and sound cables (where appro-priate) when they could be causing a malfunction.
When things go wrong
Fault-finding
Each part of the ‘Standard’ PC, the processor, the circuitry, theoperating system, each peripheral, and each application program, hasprobably been worked on by thousands of people. It is a miracle that itworks at all, and hardly surprising when things go wrong. When it doesyou have two choices – to send for the repairers or to fix it yourself.Either way you will save a lot of time by being able to describe what iswrong clearly, using correct terminology. The computer, just like, say,the motor car, gives off audible and visual signals as it works, andchanges to these (particularly smells!) can be significant.

Information technology and electronic commerce 325
Fault finding skills: to be able to:
� name the major parts of your system;� find a list of the manufacturer and model number of
relevant parts;� describe what happens to the computer as it ‘boots up’;� find a record of occasionally used passwords in a safe
place;� describe what happens when applications are executed;� recognize any changes in the usual sequence of opera-
tions, especially when these occur soon after changes tothe system;
� use correctly the reset button and important combinationsof keys like CTRL-ALT-DEL on a WindowsTM system;
� react appropriately if the PC starts up in a default ‘safe’mode.
Disaster recovery
Even though these may amount to several thousand pounds the mostvaluable part of many computer systems is neither the hardware nor thesoftware but the data that it contains.
Consider the simple data input costs and how they mount up. A goodtypist might manage 50 words per minute, for 8 hours per day, for 250days in a year. At an average of 6 letters per word this is 600 000characters/bytes or 0.6 Mbytes. Now estimate salary and on-costs of£20 000 per annum (this is £10 per hour). Each £1 of salary buys 30 bytesof data.
So a 3.5-in floppy full of text data could hold about £40 000 of data, anda 600 Mbyte CD-ROM of documentation could cost £20 million just totype in! (For real data this would be an exaggeration, since so much is ingraphical form, and a scanned photo or other graphic could easily take up0.6 Mbytes, and take less than 5 minutes to produce. At £10 per hour thismight cost less than £1 to produce, plus copyright costs of course.)
Of course the value of data stored, and of its organization intosearchable and usable form, may be many times the cost of its production.When this is taken into account, the need to keep the data secure is clear.At least one large (computer!) company, and doubtless many small ones,has been brought to bankruptcy by the loss of its data in a fire.
Fire is reckoned to be the major cause of serious loss of data. Fireproofsafes are available, designed to keep magnetic media protected for 30minutes, giving time for data to be rescued.
Secure operation skills:
� retrieve originals of software in case of disaster;� find relevant back-ups of data;� restore software and data back-ups where practical.

326 Information technology and electronic commerce
Activity 7.1.6
Take out the mouse ball (of your home PC) and clean therollers. Gently vacuum your keyboard to remove dust. Cleanyour VDU with a damp cloth.
Find the originals of all your software and store themcarefully in a safe place. Make a back-up of all the importantdata files you have created, or at least, calculate how muchstorage space you would need to back them up and make adecision that you cannot afford it!
Problems 7.2.1
(1) What problems were there for users of the old 8.3 filenameconvention? Why does the use of spaces in long filenamessometimes produce problems? What alternatives are thereto make long filenames easier to understand?
(2) List some of the advantages and disadvantages of using anetworked computer. When is it essential to change yournetwork password? What potential problems are there inkeeping the same password for a long time?
(3) List some of the problems that dust can cause in a computersystem. What practical steps can be taken to reduce thepotential damage to the computer?
(4) What is involved in a disaster recovery plan? List thesoftware and the data that you would need to install if yourcomputer had to be replaced after a fire.
7.3 Using themajor officeapplications
There is a wide range of applications available for computer users,ranging from the general word processor to specific industry packages,e.g. lighting design.
Initially, each application, being written by a different team with theirown perspectives, had its own set of keystrokes and mouse actions todrive it, often linked to the computer operating system on which it wasfirst produced. With the increasing predominance of a small number ofoperating systems, most notably the WindowsTM GUI, a standard set ofprocesses has been enforced, both across different vendors of the sametype of package, and across different types of package. The preponder-ance of Microsoft Office in the PC world is due to its having a headstartin this, since they also owned the operating system.
General application skills
There are some processes, often related to the GUI, that are common tomost applications. Practise them in each! This will enable you to learna new package more quickly, and, generally, to integrate your usage ofthe packages. For example, in WindowsTM text can be moved inside adocument by:

Information technology and electronic commerce 327
� highlighting it (pointing to the start with the mouse, holding the leftbutton down and wiping over the chosen area);
� cutting it (holding �CTRL� key down whilst tapping the ‘X’ key;� moving the mouse to the required destination; and� pasting (holding down �CTRL� and tapping the ‘V’ key).
(Note: there are alternative ways of carrying out each operation inWindowsTM, and similar techniques in every other operating system.)
Once you have learned to copy and paste inside WordTM, say, you cancopy inside WordPerfectTM, or from WordTM to WordPerfectTM, or fromNotepad to Aldus PageMaker, or from Paradox to Lotus 123, etc. Theresult is sometimes different from what you might expect, but there aregenerally alternative options if you do not agree with what theprogrammer thought was the ‘obvious’ outcome.
Graphical user interface skills: to be able to:
� resize, minimize, maximize and close a window;� move using Cut and Paste;� copy using Copy and Paste;� move or copy using Drag and Drop with �CRTL� and
�SHIFT� to force Copy and move;� highlight using �SHIFT� and cursor keys, home and
end;� swap between Insert and Overtype mode using the
�Insert� key;� use Save As to make a second copy of work done for
back-up;� use keyboard shortcuts rather than mouse processes
when these are more efficient.
Document production technology
In the beginning was the text processor, devised by programmers toenable them to code their programs, and as a spin-off to write and(above all) to edit text documents. Then someone invented wordwrapping and the word processor was born. Some time later the desk-top publisher appeared, as a means of taking the relatively crude textfrom a WP and merging it with pictures, to produce, for example, anewsletter or brochure, and making a lot of skilled typesetters redundantat the same time.
Currently standard word processors can do anything a desk-toppublisher package could five years ago, and have largely usurped theirold market in small business advertising. Desk-top publisher packageshave become specialist publishing software handling colour separation(for printing with yellow, blue, magenta and black ink), image editing,chapters, indexes and any other publishing features that would slowdown a standard word processor if it were included. The text of thisbook was produced using word processors. The vast majority of thelayout was decided by the publisher, who was supplied the content asplain text.

328 Information technology and electronic commerce
Word processing
However, until you begin to publish commercially, your documents willnormally be produced using a word processor. Since you may be usingit (or its derivative – the e-mail editor) rather a lot, it is worth getting toknow its main features, because you will want to use bold type, differentfonts, and many of the other features available. If you do not, yourdocuments will be outshone by more eye-catching competition. You willcertainly have to comply with (company) document standards (headingposition, fonts, etc.). You will also want to ensure that you do not losework and that you can keep track of changes.
Elementary WP skills: data input and editing
There are some skills you probably already have or can pick up easilyonce you can activate your chosen word processor. These allow you toproduce a basic document or message, and are similar to those requiredfor e-mail messaging.
Basic WP skills: to be able to:
� begin a new file with a pre-defined template, and to usethe template efficiently;
� save and then reopen the file in order to continueediting;
� type as well as possible. There are many typing tutorsavailable to enable you to practise. Speech recognitionsystems that do not require any typing skills are yet to bedeveloped;
� copy, move and delete blocks of text;� embolden, underline and italicize text;� activate the spell-checking system;� to print the document.
Intermediate WP skills: formatting your document
There are many examples of inferior products winning the battle formarket share by better marketing. Some would argue that the PC is acase in point. Similarly ideas which are more smartly expressed oftenwin out too; as a sixties guru, McLuhan, said ‘It is the medium thatmatters, not the message.’ An attractively laid out document is morelikely to be read. Only the really dedicated, such as those marking examscripts, feel the need to read scrappy documents.
What makes a document ‘attractive’
Over the years some basic principles have emerged. There is no reasonwhy you should not break these rules; indeed slavish adherence to anysystem leaves the way open for the iconoclast to attract attention bybeing perverse. But at least be aware of why they are there, so that youbreak them for a purpose.

Information technology and electronic commerce 329
� Keep the number of fonts (the word most programs use for typefaces)on a page to a minimum to avoid the ‘busy’ or ‘muddled’ look. Thesame typeface may be of different sizes, underlined, italicized, etc.Serif fonts (with tails, like Times Roman) allow for easy reading andare useful for body text. Sans-serif fonts (without tails, like Arial orHelvetica) are believed to slow the reader. These are best for headings(unless you want your reader to read more slowly of course).
� Typescript is more difficult to read than text printed with proportionalfonts. Reserve fixed-width fonts like Courier only for data that hasbeen structured by spaces, e.g. directory listings. Computer programsare conventionally laid out in fixed-width fonts.
� Use the Styles feature of your WP to control the appearance of yourtext. Then if you wish you can modify the appearance of eachparagraph or of each type of heading in one hit. When you have hitupon a suitable set of styles, create your own template so you can useit in further documents.
� Use plenty of white space. It may be environmentally more friendlyto pack the words on the page, but it can overface the reader. Breakyour paragraphs up with subheadings summarizing their contents toimprove readability. Headings should be separated from theirparagraphs by half a line, and blocked paragraphs (i.e. with no indenton the first line – normal in reports) separated by a full line. Headingsof most formal documents need numbering in some systematicfashion.
� Size matters! 10 point text (a point is 1/72 of an inch – an old printingmeasure) is as small as you should use in multi-page documents forreadability. 12 pt is easier for most people to read.
� Colour is excellent for emphasis, decoration and graphics, providedyou can print it. But colour photocopying is not cheap, and if yourdocument is copied in black and white your careful emphasis will bereplaced by greying out!
� Columns may be useful in newsletters. Newspaper columns aredesigned so the reader can read a line with minimal eye movementand hence can scan quickly down the page.
� For structured data either:– use the tab key and left, right, centre and decimal tabs set in the
ruler to line up the text at absolute positions, or– use the very flexible table feature of your word processor (turn off
the borders if necessary). In tables, individual cells, columns androws can be formatted separately to give the desired effect.
Intermediate WP skills: to be able to:
� change font and font size, the paragraph alignment andline spacing, etc.;
� set up styles for headings, paragraphs and other items tosimplify formatting;
� number headings and paragraphs;� use columns to make long narrative sections of text
readable;� format structured data in tables;� create specific document templates.

330 Information technology and electronic commerce
More intermediate WP skills: including graphics
Many documents include graphics, either as decoration or to displayinformation in an easily accessible form. It is useful to know how toinsert the graphic, perhaps by cutting and pasting it from elsewhere. Itmay need to be cropped, to remove extraneous detail, and then must bepositioned at an appropriate point in the narrative, with text perhapsflowing round it. It will need to be labelled so that it may be referredto.
Activity 7.3.1
Add a graphic to a block of text. Add a caption. Change thewrapping options so that the text flows round the graphic.Move the graphic right and left and decide its best position.Try the graphic boxed and unboxed.
Advanced WP skills: document automation andmanagement
The beauty of preparing documents on a computer is not speed – mostcould be produced faster by hand – but in their editing and reuse. Adocument may have a table of contents and index added automatically.It may then be reformatted with a different number of columns, differentsize of paper and font, and yet have all the page references changedcorrectly.
It may be rehashed into a handbook, developed into a presentation orpublished as a web page. It may even be automatically translated (notperfectly but intelligibly) into a foreign language.
A document may have to be saved in a different format, ready for adifferent processor, even in text-only format. If available in text-onlyformat some judicious use of Search and Replace facilities may beneeded before paragraphs wrap correctly.
Mail merging is another example of automation, linking onedocument to another. A letter is linked to an external data file, andinstead of actual names and addresses, a reference to different parts ofthe name and address is placed appropriately. Then when the mergeprocess is executed, a series of letters is printed, one to each recipient.A merged document need never actually exist.
This produces an interesting problem for those who keep records ofeverything. How is the creation of such a letter recorded? If the sourceletter and/or database are subsequently modified for another letter, theonly possible record is a merged file, which is subsequently archived.
Modifications to files at least may be recorded. Where a source file isedited, perhaps by more than one person, a modern word processor maybe set up to highlight the additions and deletions in different colours, atleast until the latest version is agreed and the highlights then removed.The problem of keeping records of files in various stages ofdevelopment has to be solved by archiving them to some permanentstorage periodically. This may be done as an addition to the back-upprocess, as described later.

Information technology and electronic commerce 331
Advanced WP skills: to be able to:
� import a text file and reformat with unnecessary para-graph marker’s removed and headings correct;
� create a table of contents using suitably defined headingstyles;
� create an index from labelled words in the text;� set up a mail merge letter and data file and execute the
merge;� use suitable file developmental stage labelling as a
document evolves.
Activity 7.3.2
Set up a personal contacts database (see ‘Databases’, page337) and then create a mail merge letter, link to the databaseand merge to a file (you do not have to print!).
Financial and numerical technologies
Some say that it was the spreadsheet, first VisiCalc on the Apple II andthen Lotus 1–2–3 on the first IBM personal computers, that really soldthe PC to business. Prior to that keyboards were nasty things that typistsused, and managers didn’t want to handle. Suddenly it was possible toset up whole business scenarios like ‘What would happen to our currentsituation if we reduced our spending on computers?’ in a couple ofhours, rather than go begging the data processing department for the useof one of their programmers. (Doubtless the possibility of doing itwithout anyone else having to know also appealed.)
Spreadsheets are the all-purpose tool for setting up numerical modelsto answer such questions (and many other non-financial queries aswell). There is also a range of specialist software available, particularlyfor accounts. Each of these has their place in the modern business.
Spreadsheet introduction
A spreadsheet is a rectangular array of boxes or cells into which numbersand letters can be placed. It is initially two dimensional, rather like thelayout of a book-keeping page. These may be linked to make a workbook.
The columns are labelled with letters, from A to Z, AA to AZ, BA to BZas far as IV. Rows are labelled with a number, from 1 to 800 or more. Eachcell has its own name or cell reference, made from the column letter orletters, and the row number, for example, A1, B23, BZ235.
From one set of data it is possible to produce a second that depends on itby known factors. Hence it is possible to use this year’s figures, with anestimate of possible inflation factors, to predict likely future performance.
As well as giving the possibility of setting up arrays of figures andproviding rapid totalling of the rows and columns, spreadsheets havefacilities for simple production of graphics from the data.

332 Information technology and electronic commerce
Column → A B C E F GRow No.
1
2 Year 2000 Jan Feb Mar
3 Gas 37.32 29.24 19.23
4 Water 56.23 29.88 32.73
5 Electric 17.23 18.34 22.42
6 Rent 75.00 75.00 75.00
Using the SUM() function, automatic totalling can be added· In the row below, C7 contains =SUM(C3:C6), and F6 contains=SUM(C7:F3)
1
2 Year 2000 Jan Feb Mar Total
3 Gas 37.32 29.24 19.23 85.79
4 Water 56.23 29.88 32.73 118.84
5 Electric 17.23 18.34 22.42 57.99
6 Rent 75.00 75.00 75.00 225.00
7 Total 185.78 152.46 149.38 487.62
Inflation may be allowed for in the coming year by making a copy of the table in rows 12 onwards, modifying the labels, andadding a cell with the relevant inflation value·
Replacing the 37·32 in C14 by =C3*(1 + C12) puts the estimated new value in C14·
Copying this formula to each data cell (not SUM cells!) gives a block of estimates· These may be replaced by actual valueswhen the time comes·
12 Inflation Value 10%
13 Year 2001 Jan Feb Mar Total
14 Gas 41.05 32.16 21.15 94.37
15 Water 61.85 32.87 36.00 130.72
16 Electric 18.95 20.17 24.66 63.79
17 Rent 82.50 82.50 82.50 247.50
18 Total 204.36 167.71 164.32 536.38
19
Figure 7.3.1 A simple spreadsheet example

Information technology and electronic commerce 333
Cell entries
From Figure 7.3.1 we can see that a cell in a worksheet can store one ofthe following:
� Text, useful for labelling cells.� A number or value stored typically to 18 decimal place accuracy.� A cell reference so that B2 might contain =C2 so when C2 changes
so will B2.� A function, often referring to a cell reference, e.g. SUM(B2:B5),
adding up all the values in cells B2, B3, B4, and B5.
Spreadsheet general principles
Distinguish between the data and its appearance. For example, thenumber 36 526.6 may appear as £36,526.60, the date 01-Jan-2000(using just the whole number), the time 14:24:00 (using only thefraction 0.6 of a day), as a percentage 3 652 660.00% or even as animproper fraction 36 526 3/5. These are interchangeable by reformattingthe underlying number.
Do not leave unnecessary gaps between rows or columns of data. Addany extra rows and columns, to separate data and make the printoutclearer, last of all. Extra rows often get in the way of efficient formulacopying, among other irritations. Extra columns, added simply toseparate data, are unnecessary; widen the columns instead. It isrelatively simple to change fonts, add borders, and to shadow areas ofthe sheet for extra clarity.
Activity 7.3.3
Work through the example given in the Table in Figure 7.3.1.Add a table of inflation values, one for each expenditure item,so they can be changed independently. Add a third year andfurther predictions.
Spreadsheet graphics
Apart from simple number handling, producing row and column totalswith more reliability than most humans, spreadsheets are often used forproduction of simple graphs, particularly for display purposes. The daysof hand-drawn graphs on displays are long gone.
The range of options is enormous, so it is important to have someclear principles in mind. You can break them, just as in word processing,but have a good reason.
(1) Colour aids clarity wonderfully on screen. Ensure that it will printand copy well when that is necessary.
(2) Graphs should be clear and uncluttered. 2D graphs are generallymore easily interpreted than 3D graphs, particularly if forward-placed data series obscure others. Resist the temptation to addunnecessary detail such as picture backgrounds unless you aredeliberately trying to mislead your audience.
(3) Pie charts are simple statements of different contributions to awhole, usually 100%. Too many slices confuse, so some may have

334 Information technology and electronic commerce
to be aggregated into ‘the rest’. 3D pie charts may make it difficultfor those without good perspective awareness to compare areas.
(4) Line charts and bar/column charts are used to show change in avariable when a category changes, e.g. salary against employee,pollution level against town. When a line chart is used for X–Y
Figure 7.3.2 3D and 2D piecharts: compare therepresentation of the same data
Figure 7.3.3 Line and XYcharts of unsorted data. Noticethat the relationship is lost onthe line chart, and X values areirregular and not on gridlines

Information technology and electronic commerce 335
data the X values, however irregular and in whatever order, aredrawn equally spaced; the Y axis does not pass through X = 0.
(5) Bar/column charts tend to be used for items that mount up,especially for discrete data that counts up, e.g. number of days ofsunshine, salary, rainfall. Line charts are more useful for data thatis continuously variable, like temperature.
(6) Where continuous data is grouped (it may be discrete datameasured in tiny steps) and plotted, e.g. number of houses indifferent price ranges, the gaps in the resultant bar chart may bereduced to zero producing a histogram.
(7) XY chart data may need to be sorted in ascending order of X.Alternatively, if available, plot the points and get the package toplot its best-fit line (and give the equation if Excel 97 or similar).X–Y chart axes have lots of options, including reverse plottingand logarithmic scales. Use them appropriately. Beware of heavygridlines. At graph-paper densities you will see nothing else.
(8) There are many specialist graph options, such as radar charts.Make sure you know when it is appropriate to use them.
Activity 7.3.4
Use a spreadsheet to create suitable types of graphs neededfor your course. Explore the options available for titles, labelsand the axis scale. Remove any backgrounds and cut andpaste to a word-processed document.
Back calculation: using goal seek to find theanswer
One of the most useful features of a spreadsheet is its ability to backcalculate. Given that y = x2 + 3.5x –7 it is not difficult to work out avalue for y, given values of x. Much more problematical is finding bothx values given a y value. Plotting the graph, we find:
Figure 7.3.4 The quadraticequation: values and graph

336 Information technology and electronic commerce
To find the solutions of the equation, where y = 0 the Tools>GoalSeek function is used on the contents of cells B8 and A8. (Other valuescould be used but close values are safest – there are two crossingpoints):
and the value is given as:
x y
–4.922 15 9.32E–06
Let us assume that 0.000 009 32 is close enough to zero!Similarly we can find the other crossing point by goal seeking on A14
and B14, say:
x y
1.422 038 –0.000 67
This time y is negative and a little bigger in size but probably goodenough
An even more powerful tool exists. Remember ploughing through allthat calculus, simply to find a minimum value. Tools>Solver will findthat too:
Figure 7.3.5 Finding the firstcrossing point
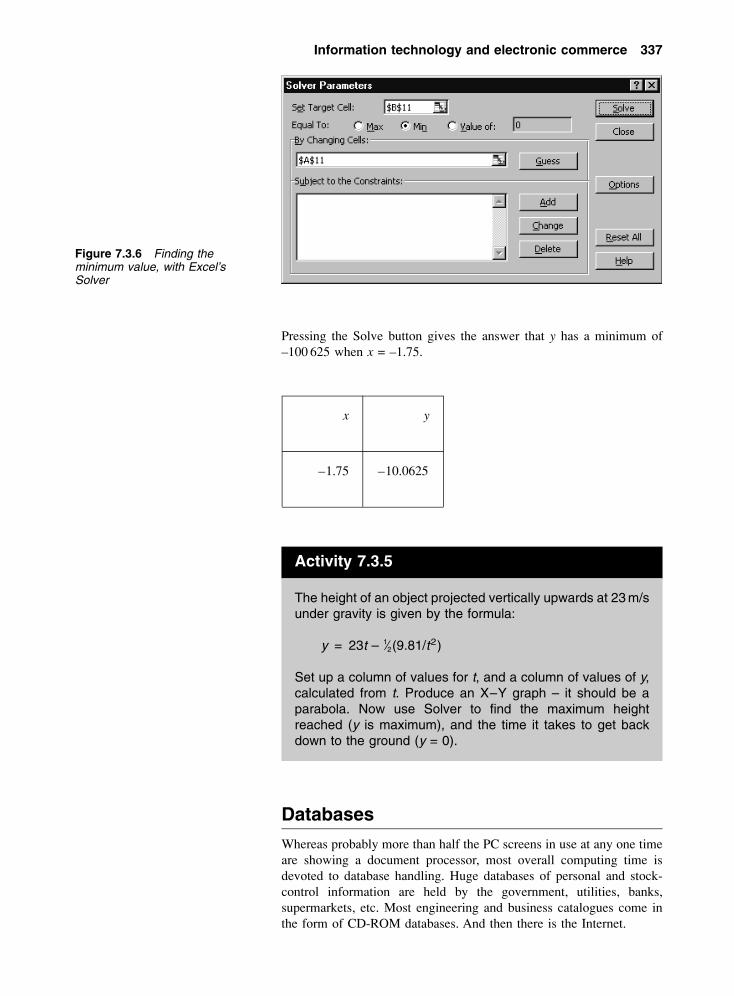
Information technology and electronic commerce 337
Pressing the Solve button gives the answer that y has a minimum of–100 625 when x = –1.75.
x y
–1.75 –10.0625
Activity 7.3.5
The height of an object projected vertically upwards at 23 m/sunder gravity is given by the formula:
y = 23t – 1⁄2(9.81/t2)
Set up a column of values for t, and a column of values of y,calculated from t. Produce an X–Y graph – it should be aparabola. Now use Solver to find the maximum heightreached (y is maximum), and the time it takes to get backdown to the ground (y = 0).
Databases
Whereas probably more than half the PC screens in use at any one timeare showing a document processor, most overall computing time isdevoted to database handling. Huge databases of personal and stock-control information are held by the government, utilities, banks,supermarkets, etc. Most engineering and business catalogues come inthe form of CD-ROM databases. And then there is the Internet.
Figure 7.3.6 Finding theminimum value, with Excel’sSolver

338 Information technology and electronic commerce
An engineer should have some database searching skills for use in,for example, libraries or CD-ROM catalogues. Since most recordssystems are becoming electronic it is helpful to know some of the basicsof setting up a database so that the importance of keeping data in astructured fashion is appreciated.
Database basics
Data is stored as bytes, 8 bits = 1 byte. Modern computers handle datain 1-, 2-, 4- or 8-byte chunks, 8-bit, 16-bit, 32-bit or 64-bit data.
Creating an example database
Databases are built from tables, each of which should describe someindividual type of entity, e.g. a person, an invoice, an item of stock,etc. The exercise below takes you through some of the decisions thathave to be made in order to create one table in that database.
Suppose a small company wants to set up a stock database. Eachitem of stock is an example of the stock entity.
The stock entity has attributes that describe it. Notice that it is abad habit to have spaces in attribute names since, as with filenames,some software treats the space as an end-marker. Notice also thebeginnings of an extended database. The supplier is just given areference to supplier table; this will eliminate address space and, moreimportant, the need to update many records should details like phonenumbers change.
No of bits No of bit patterns May represent
8 28 = 256 Integers 0 to 255, characters from an enhanced ASCII set, numbers as text, especiallywhen communicating data.
16 216 = 65 536 Integers 0 to 65 535, or –32 768 to +32 767, Unicode characters.
32 232= 4 294 967 296 Integers from 0 to 4000 million or –2000 million to + 2000 million.
64 2ˆ64 = 18 million,million, million
Integers or Floating point numbers between
1010000and 10–10 000, with an accuracy of 1 part in 200 million, million. (Floating pointnumbers may represent dates and times.)
Note: ASCII, the American Standard Code for Information Interchange, is the default PC mapping of patterns of 7 bits toAmerican English characters. Enhanced ASCII adds a bit and maps a further 128.
Unicode can cope with all the alphabetical characters plus Chinese/Japanese/Korean ideograms.
Pictures, video and sound are constructed from large groups of bytes, many millions in the case of video, called binary largeobjects, or BLOBS! Database tools to handle these fully, e.g. find a picture within a picture, are still being developed.
Figure 7.3.7 Data storage options

Information technology and electronic commerce 339
Designing the table
The next stage is to specify the table contents in the package you areusing. This is very package specific. Opening an MS Access databaseand designing a new table produces screens like Figures 7.3.9 and7.3.10.
In Figure 7.3.9 the field names have been inserted, and the stock_idattribute put in the first field. The key button makes it the primary key
Attribute Content Length Problem/opportunity
stock_id letters and numbers,e.g. 324MPR-9
8 bytes, text a unique value for each item. It may contain a fixedpattern of 3 numbers, 3 letters, dash, 1 number, in whichcase an ‘input mask’ will reduce errors
warehouse_position e.g. R04C07L02- 9 bytes, text -row 4, column 7, level 2. This ‘coded data’ minimizesthe space used
name a name of fixed length e.g. 20 bytes if such a length is fixed, short names will waste space.Fixed lengths do make searching quicker
description very variable, mayinclude data table
need to use a database that can handle variable lengthfields, such as an MS Access ‘memo’ field, or restrictthe contents
supplier name and address 8 bytes, text a full name and address would be repeated for each itemsupplied. Instead use a supplier_code and separate linkedtable for a supplier entity
number in stock integer 4 bytes not negative. A short integer of 2 bytes might be usedbut searching may actually be slower
reorder_level integer (whole number) 4 bytes not negative
last_date_used date 4 bytes could be entered automatically when any change to thedatabase takes place
Figure 7.3.8 Stock dataoutline description
Figure 7.3.9 MS Access tabledesign, defining the Primary Key

340 Information technology and electronic commerce
Data input forms
Having defined the fields the data is inserted. The simplest way is tocreate an input form for the table (Figure 7.3.11).
Most database software has tools to help speed frequent processes.This form was generated automatically from the stock table. It can beedited, and the order of the data input changed.
field that defines the order in which the data will be stored. The fieldsize is set to 8, and the mask set to be 000LLL\-0, which means 3numbers, 3 letters, a dash and 1 number, all compulsory.
In Figure 7.3.10 the number_in_stock field is being defined. The fieldsize is Long Integer (4 bytes for Access) and the validation rule preventsthe error of the value entered being negative.
Figure 7.3.10 MS Accessdefining a number field withvalidation rule
Figure 7.3.11 MS Access:automatically generated inputform, blank

Information technology and electronic commerce 341
The form adheres to rules already defined in the table. In Figure7.3.12 an attempt was made to input a negative number_in_stock, anda pop-up warning was produced.
Querying a database
The simplest way to query a database is to use QBE, query byexample. An MS Access query shown in Figure 7.3.13 will give thedata in Figure 7.3.14.
Figure 7.3.12 MS Access:data input is checked byvalidation rule
Figure 7.3.13 MS Accessquery: find a spanner
Figure 7.3.14 MS Accessquery: the spanner is found

342 Information technology and electronic commerce
Reports from the data
The object in inputting data is to be able to retrieve it in a moreorganized form, usually called ‘reports’. Access will produce a reportfrom a table, or from a query on the table (see Figure 7.3.15).
Database conclusions
Databases can become very complex, with hundreds of tables spreadacross many computers and many countries. A small-scale PC databasecan, however, handle the stock requirements for a small business, and itsuse improves skills that may then be used in the extraction of data fromlarger systems.
Crucial concepts are:
� GIGO: garbage in, garbage out. If inaccurate data is input anexcellently presented report is useless.
� Input validation: Trying to prevent inaccurate input by automaticchecking of values by rules.
� Refining queries: Trying to be precise about what is wanted (seeFinding information on the Internet, page 351).
Figure 7.3.15 MS Accessreport

Information technology and electronic commerce 343
Activity 7.3.6
Use a database application to create a list of personalcontacts, addresses, phone numbers, date-of-birth, etc. Useit in the mail merge activity (see page 331).
Personal information managers (PIMs)
PIMs are specialist databases used to keep track of diaries, contacts,etc. When networked they enable diaries to be shared, times ofcommon meetings to be inserted, and other information to be sharedaround colleagues in a business. Such information may be kept onportable systems as small as a palm top or Psion and synchronizedwith a large central database at regular intervals.
Synchronization of data between databases
Where multiple database systems carry the same information there ispotential for confusion. In database design a major principle is thatany given data item should only be kept in one place. This is part ofthe process of normalization of a relational database.
However, duplication is inevitable where a company representativecarries information away on a portable system, whether it be ascontact or sales information or just a personal diary. If as a result ofvisits the portable data is changed, there will obviously be a differencein the data held. On return to the company and plugging in to thecentral system, synchronization software must add new information ineither direction, and where discrepancies occur (e.g. representativeand boss schedule a new appointment at the same date and time),resolve them.
Presentations
The cartoon Dilbert has many jokes about ‘Death by Powerpoint’.Despite their overuse, and particularly the overuse of some of thefacilities, they are very valid tools for engineers, both in providingrolling displays for exhibitions, and in providing focus for lectures/seminars, etc. Presentations are easy to put together and provided youcan guarantee a suitable projector or screen, easy to carry on a floppydisk.
The basis of a presentation is a series of slides that can besequenced by timing, use of buttons or both. Each slide has:
� a background which needs to be chosen to suit the subject;� text;� images which may or may not have their own background;� sound/video attached;� printable summaries or slide contents.

344 Information technology and electronic commerce
The main pitfalls are:
� ‘pretty’ backgrounds that obscure the text/images. Backgrounds arerarely the point of the presentation;
� excessive amounts of text. These are bullet points. Your talk is muchfuller;
� images that are overcomplex. They need to illustrate a singlemessage;
� sound that is intrusive. That wake-up call may be effective firsttime. After that it becomes annoying;
� video may be better projected separately, rather than in a reduced-size window;
� animation, particularly of text bullet points. Though text can fly infrom all directions with a screaming sound does not mean that itshould;
� slide printouts. These are great if given out first, since the audiencecan use them as a basis for notes (assuming that they are legiblewith a contrast between back- and foreground). If given out as asummary they are probably inadequate, and a two-page summarysheet would be far better.
Activity 7.3.7
Produce a presentation next time you have to share yourresults orally with the rest of your group. Quite apart fromcontent, get feedback about your use of the featuresavailable. Were there any that they found detracted from,rather than enhanced, their understanding?
Problems 7.3.1
(1) What features of a word processor allow you to take plaintext and improve it to produce a readable document? Listsome of the pitfalls of overusing some of these features.
(2) A company can either invest £1000 capital and make objectsat £5 each, or invest £5000 and make them at £3 each. Bysetting up a table of differences between total costs fordifferent numbers of items using the two processes, work outusing Goal Seek at what number of items it becomescheaper to make the greater capital investment.
(3) Estimate the number of bytes required to record theinformation given when applying for a driving licence. Bymultiplying by the number of drivers on the country’s roads(estimate it if necessary) work out how much storage wouldbe required for the drivers’ data file.
(4) List some of the problems likely to be encountered when asales representative returns to head office and attempts tosynchronize the data on his or her laptop with that on themain office machine.

Information technology and electronic commerce 345
7.4 Industryspecificapplications
CAD
Every sector of engineering involves the design of new products and hasits own computer aided design applications, capable of providingdifferent sorts of drawing models. Some generic packages, e.g.AutoCAD, provide a general drawing environment which may beenhanced with add-ins, for example their own architectural engineeringand construction extension that will draw images of 3D walls, insertwindows, doors and winding staircases, and give perspective views ofwhat has been produced. Companies like HevaComp have convertedtheir own package so that it works in conjunction with AutoCAD, sincethey can then set up the required lighting and other services.
There are electronic add-ins to these generic packages, but the pressureto produce a circuit that can be tested electronically (for example, be seento oscillate or amplify) as well as be converted into a printed circuit boardlayout, results in a wider range of specific products.
The trends in the CAD world are to:
� draw in 3D if perspective/isometric views are required. This meansthat there is only one model of the item, rather than plan, frontelevation, side elevation and third angle projection to be changedwhen modifications are made;
� work with libraries of pre-produced, editable and reusable compo-nents to save costs. A manufacturer may provide a library of theiraccessories ready for insertion into a product drawing (therebylocking them in as supplier, of course);
� design not just draw. It is increasingly possible to ask the questions‘Will that type of cooker fit here?’, ‘How would its temperaturechange if it was painted black?’, and ‘Would the circuit performancechange if I used a smaller battery here?’
� to be able to interchange data with others electronically, either bystandardization on particular packages, or by using some of thedrawing conversion processes that are available.
Project management
Good project management is vital if a project is to succeed, and mostdevelopments these days are in project form, where a team of people withdifferent backgrounds and skills is put together to satisfy a need. All theproject management tools, such as arrow diagrams, PERT diagrams,Gannt charts, etc. are available to display the plan for the project, and tomonitor its progress. The computer can track efficiently the usage of eachresource (person, tool, and raw material) and measure the effectiveness ofthe various processes. Resource levelling may be provided in whichchecks are made (for example, that the plan needs three mechanicalengineers at this time and only two are employed; therefore either the jobmust be rephased or a temporary person appointed). Project managementis dealt with more fully in Chapter 4.
Simulation software
As already stated under CAD, computer models can now be used to testcircuits before they are built. This process of simulation depends upon

346 Information technology and electronic commerce
accurate knowledge of the behaviour of components and accuratecalculations, together with a great deal of testing of computer modelsagainst known reality. Once the system has been created and testedadequately, however, it permits expensive systems to be tested todestruction, even nuclear weapons to be designed without explosions.Similarly aircraft pilots can be trained to fly a plane before it is off theground, and to land many times in hazardous conditions before it isnecessary to do so.
Computer-based learning (CBL)
The provision of learning opportunities is expensive. Setting up largestudy groups in which each student gets the same delivery can minimizeits costs. Particularly in specialist subjects this conventionally impliesgathering from a large region at a particular time which is not alwayspracticable.
The ‘solution’ is to put the delivery on a computer – CD-ROM,Internet, etc. – and deliver it to the student in their own time, with someaccess to tutors but most interaction using computerized systems, e.g.automatic testing and e-mail. There are many people working onproviding such CBL, and there is evidence of its working effectively insome areas, particularly where companies want their staff (who will geta pay rise if they succeed) trained in the use of a specific product. Butmost of the ‘Let’s teach this by computer’ initiatives founder on the lackof motivation of the students. All the enthusiasm the CBL people seeand wish to harness in a crowd of disaffected adolescents playing‘Quake’ evaporates when they have the option of ‘Basic Maths’ or‘Solving Kirchhoff’s Equations’ tuition.
Students of engineering are assumed to be motivated. They also comein relatively small, expensive classes. They may well find their timeincreasingly being devoted to CBL packages. Their use to replace orsupplement lectures is sometimes understandable, particularly wherestudents have difficulties with time and place. Their use to replace hands-on use of equipment is a particular problem if it removes the chance tocarry out real operations. An analogy is driving tuition; you may learn thebasic ideas practising on a simulator (and it is certainly a safer way oflearning to change gear whilst moving), but you are not safe, and wouldnot pass a driving test without significant road experience.
Problems 7.4.1
(1) What are the major differences between drawing somethingon a CAD system and drawing the same item on a drawingboard? (Consider scales, accuracy, speed, editing, flexibility,sharing of information.)
(2) In what circumstances can a simulation be as good or betterthan the ‘real thing’? (Consider detail required, hazardavoidance, levels of supervision required.)
(3) Under what circumstances would you accept computer-based learning in place of tutor-guided learning? Are therecircumstances in which you would prefer it, and why?

Information technology and electronic commerce 347
7.5 Electroniccommerce
The power of modern communications, particularly networked com-puters, is changing the face of commerce. Its effect on engineering is toreduce the time-to-market for products by:
� increasing the speed at which new products ideas spread, thuscreating a demand. When a new games console is produced inJapan, publicity about it spreads fast. If sufficient demand is built upby this the distributors may be forced to export more quickly toavoid too many internet purchases distorting their carefully phasedmarketing plans;
� allowing more rapid dissemination of ideas to a vaster audience. Asthese ideas spread there is a greater possibility of two being puttogether to produce an unanticipated development.
The greatest influence on this process is the Internet, the huge sprawlingnetwork of connected computers that is the basis of most B2B, businessto business, and B2C, business to customer, communications.
The Internet
The Internet began as the US Defense Department’s computer networkin the early 1970s. At the time there was a small number of isolatedmainframe computer networks which could not interconnect becausethey used incompatible proprietary systems, whose suppliers feared lossof their market if they allowed connection to others. The US DefenseDepartment’s Advanced Research Projects Agency (ARPA) set out tocreate a decentralized network of computers that would still commu-nicate if some of them were hit by nuclear bombs. The ARPA deviseda set of rules, called a protocol, designed to be robust. This hasdeveloped into the TCP/IP (transmission control protocol/internetprotocol) standard that the Internet uses today
In the following decade universities and research institutes began tobe linked to this network and it began to develop into the Internet. In1989 Tim Berners-Lee, working at the CERN Research Institute forParticle Research in Switzerland, proposed a modification of thehypertext systems then being used for document storage as an easiermeans of access to data. With this hypertext transfer protocol, the WorldWide Web was born. As the Internet became easier to use, so morepeople outside defence/academic research began to use it through anincreasing number of ISPs (internet service providers). As more peoplebegan to use it, commercial opportunities began to be seen foradvertising and sales, and the letter e began to be tagged on to manywords, increasingly without the hyphen, and generally lower-case,hence email, ebusiness, esales, even etailing.
TCP/IP and decentralization
The Internet is nowadays a complex web of intelligent communicatingdevices called routers, with computers attached as sources of messages.It is decentralized. No one controls it or can switch it off. A computerin the UK uses TCP/IP links to communicate with a computer in Hawaiiby chopping its message into packets, putting a header on each whichgives the (currently) 4-byte address of the Hawaiian computer, and

348 Information technology and electronic commerce
passing it on to a router in the general direction of the Pacific. Thepackets are passed from router to router until they reach Hawaii, perhapsin short hops, perhaps by satellite link. At the other end the messagereaches its destination computer and is put back together, interpretedand a response or acknowledgement sent.
Each packet may take a different route. If a router breaks down, or ifa particular channel becomes overloaded, the messages are routed roundit (see Figure 7.5.1). Redundancy, and therefore reliability, is built in.
Internet terminology
The Internet has spawned a host of acronyms: Internet itself, TCP/IP,ISP, B2B, etc. Any that are relevant you rapidly learn. Most books havea glossary of terms used. Some of the most important ones are:
URL: uniform resource locator. This is a text alias such aswww.freeserve.co.uk for what would otherwise be some-thing like: 195.92.249.48. In an address like http://www.bton.ac.uk/main/index.htm the www.bton.ac.uk isthe server address; there could be several servers, in whichcase the address might be http://library.bton.ac.uk/. Afterthe single ‘/’ follows the directory and/or file address, e.g.‘/main/index.htm’ which the browser will fetch. If no fileaddress is given a default home page is supplied.
hypertext: text with active links, which when picked with a mouse orotherwise activated, takes the user to a different documentor part of a document.
http: hypertext transfer protocol. This is the set of rules obeyedby browsers and servers in interpreting the hypertext pagesused on the Web. It also makes such activities asdownloading of files easier.
server: a computer that provides information in response torequests from another computer.
e-mailaddress:
a text string such as [email protected] (my e-mailaddress). The server is the part after the @ symbol; indeedhttp://www.bton.ac.uk accesses the University of Brighton
Figure 7.5.1 Message passingusing TCP/IP

Information technology and electronic commerce 349
website. The remainder is unique to me. Anyone else calledJ. K. Wilkinson would have to be given an alternativeaddress.
com: this is an example of a top-level domain. Others exist like.gov, .edu (and licensing of new ones will happen in 2001).These were originally all US URLs, with other countriesadding .uk, .de, .fr, etc., but .com became the symbol of theinternet-savvy company, forcing its release to the rest of theworld.
Internet access costs
Most people access the Internet using a phone line. This normally costsmoney, unless their ISP has provided a freephone number. Freephoneconnections are not free since someone has to pay the phone chargesomewhere, the cost is generally recouped on monthly charges oradvertising. ISPs who do not charge a monthly access charge reckon toget revenue from advertising.
In principle, dial-up costs can be minimized by accessing at as higha rate as possible, but since on a normal dial-up line the technical limitis 56 000 bits per minute and has been reached by modems available inevery new PC, no more improvement can be expected.
Increasing the speed of access
The other advantage of speedy access is that it enables high bandwidthmultimedia applications, such as full screen video, to be accessed.56 kbit/s lines are inadequate for this. The alternatives are:
ISDN: Integrated Services Digital Network, which allows perma-nent access in both directions at 64 000 bits per second fora significant cost. Extra capacity in units of 64 kbit/s isobtained by using extra parallel phone lines. ISDN is mostlylimited to business use because of expense.
ADSL: Asynchronous Digital Subscriber Link, which relies upon asingle phone line being able to carry data for short distances(up to 2.5 km) at much greater rates than for longerdistances. It assumes that most of the traffic will be to theconsumer, and is ideal for services like video where theconsumer is less active.
Cablemodems:
these rely on the much higher bandwidth (carrying capacity)of cable networks than simple phone lines. The capacitydoes depend on how many users share a cable link to theexchange, however, and will fall as more people use anyparticular segment of the cable network.
Satellite: satellites have huge capacity, Gbit/s (billions of bits/s) perchannel. If used to broadcast data they could providemillions of web pages per second or hundreds of videofeeds. This would be adequate for many purposes, pro-vided that the reverse channel via a normal phone line wasavailable to enable the pages broadcast to be selected bythe consumer.

350 Information technology and electronic commerce
Activity 7.5.1
Start to compile a list of useful research websites for yourcourse. Create a web page for the purpose, so all you haveto do is call it up, and activate the hyperlink. Link it to yourwebsite when you have created one.
Electronic mail
E-mail is the electronic equivalent of ‘pigeonholes’ into whichincoming mail is placed in organizations that do not deliver to desks. Itis easier to mass communicate with pigeonholes, since posting memosinto adjacent holes is much quicker than giving them to colleagues.However, you cannot guarantee that the mail message is ever received,certainly not that it is read quickly.
E-mail accounts are electronic pigeonholes held on the internetservice provider’s computer. The account owner has to access theiraccount to read the mail message. If they are on holiday, no one else willsee a piece of paper on their desk and act on it instead. And many e-mailusers simply read the message and do not acknowledge it, so you cannotbe certain that it has been read.
So e-mail is not a panacea for poor communications. However, it isgood for rapid communications between people who read it, particularlywhere the telephone is problematic. Attaching files (reports, pictures,etc.) allows documents to be shared quickly and easily, and edited andreturned where necessary. Co-operative working between peopleseparated by continents is quite possible. And distribution of text tohundreds of e-mail accounts is possible where the access softwareallows groups to be set up.
Some words of warning
Blanketing large numbers of people with unwanted mail is calledspamming, and is definitely against the code known as ‘nettiquette’. Itcauses great irritation and the spammer may well be ‘flamed’ with largenumbers of angry e-mails.
E-mail is more or less permanent. Once the Send button is pressed, acopy of the e-mail is stored on the local computer, one with the localISP, one with the destination ISP, then with the destination. Because allof these are backed up and archived a record of the message is retainedindefinitely, and may be read by anyone with the right to investigate.E-mail is not the medium for private discussions about company policy,enquiry about jobs with deadly rivals, or gossip. Do not send an e-mailthat you wouldn’t sign.
Some companies have the policy of attaching a disclaimer on the endof every e-mail, e.g. from REPP:
************************************************************************The information in this internet email is confidential and is intended solely for theaddressee(s). Access, copying, dissemination or re-use of information in it by anyoneelse is unauthorized. Any views or opinions presented are solely those of the authorand do not necessarily represent those of Reed Educational & Professional Publishingor any of its affiliates. If you are not the intended recipient please contact ReedEducational & Professional Publishing, Oxford, +44 1865 311366.
************************************************************************
The legal status of such disclaimers has not yet been tested.

Information technology and electronic commerce 351
Activity 7.5.2
Familiarize yourself with the e-mail processes of your system.Try setting up groups of users. Set up a system of folders forincoming mail that you wish to keep. Clear out unwanted mail.
The World Wide Web
As explained before, the World Wide Web is a huge network ofcomputers around the world that uses TCP/IP and responds to HTTPrequests. This sprawling, rather anarchic network contains a hugeamount of information, some for sale, mostly free, with varyingusefulness and reliability. If someone wants to set up a website devotedto their own obsessions there is little to stop them, provided that no lawsare broken in the country of their ISP. (There is currently some legalargument about the liability of the ISP if the law is broken. Some arguethat the ISP cannot be held responsible for pages under the control ofindividuals; most ISPs play safe and, given a complaint threatening legalaction simply disconnect the pages.)
Activity 7.5.3
Familiarize yourself with the use of a web browser. Loadpages by picking links and by typing their URL. Save pagesand their graphical content on your local or network drive. Usethe browser to access local pages.
Finding information on the World Wide Web
With hundreds of millions of pages of information available, how is theuseful sorted from the useless? There are various strategies:
� Use a table of useful links set up by your institution, often thelibrary. This is a web page devoted to links. If you find other usefulpages, the information is generally gratefully received and posted aswell. Or try a professional body (see Figure 7.5.2).
� Know the URL and type it directly. This obviously works. What is notso clear is that you can often guess the URL by topping and tailing thecompany name with http:///www. and .com (e.g. Microsoft is at http://www.microsoft.com). Some browsers will top and tail automatically.For UK companies try.co.uk instead of .com (e.g. the BBC at http://www.bbc.co.uk). Sometimes you must be a bit devious; there is aphone enquiry company at http://www.192.com!
� Use a search engine. Which one you use depends on what you want tofind. Some, like http://www.yahoo.com, have developed a hugedirectory of categorized services to which pages have been submitted;this makes them best if your enquiry fits their categories.
� Others, like http://www.google.com (see Figure 7.5.4), have pro-grams continually scanning the web and keeping their indexes up todate. There are also programs downloadable from the web, such as

352 Information technology and electronic commerce
Web Ferret (from http://www.ferretsoft.com) that know aboutsearching many search engines and can send requests to many and atthe same time remove duplicates. This increases the chances offinding a particular page.
If you want specific information from a specific country you can try thenational equivalent, e.g. http://www.yahoo.co.fr, but be aware that theinformation is likely to be in French.
Figure 7.5.2 A page of linksset up by the IEE in the UK
Figure 7.5.3 Yahoo

Information technology and electronic commerce 353
Figure 7.5.4 Google searchengine
Figure 7.5.5 Lycos: morecomplex but focused searchoptions

354 Information technology and electronic commerce
Intelligent searching
Internet searching is like searching any other form of large database.Suppose that you are searching Lycos for articles about CAD. Withmany millions of pages available, a search for computer aided designwill give ‘hits’ on between 10 and 20 pages from millions containing thewords computer, aided and/or design. They are often just the last 10indexed. So you need to be more specific. Try ‘computer-aided design’in quotes, to search for the exact phrase.
Intelligent searching requires the use of the Boolean connectives –AND, OR and NOT, with and without brackets. So you might search for(‘computer’ OR ‘electronic’) AND ‘design’ AND NOT ‘manufacture’ torefine a search. Remember that:
AND means both must items connected must be presentOR means that either one or the other or both must be presentNOT means what follows must not be present
The order of processing matters. Use brackets to change the normal‘order of precedence’. Without them NOT is processed first, then AND,and finally OR. In the example above leaving out the brackets wouldmean that any article mentioning ‘computer’ would be returned.
Lycos (see http:/www.lycos.com, and Figure 7.5.5) also allows theoperators ADJ, NEAR, FAR and BEFORE, giving hits from ‘computerdesign’ and ‘design computer’, ‘computer’ and ‘design’ within the sameparagraph, or within 25 words, ‘computer’ and ‘design’ more than 25words apart, and ‘computer’ before ‘design’.
Activity 7.5.4
Try searching for some job information on the Web. Trylooking for (‘job’ OR ‘employment’) AND ‘engineering’ AND‘electrical’, for example. Try refining your search with suchextras as NOT ‘America’ or NOT ‘UK’.
Some Internet problem areas
Journalists love scare stories about how bloody crimes were incited ormade easier by internet sites. Information is more readily available froma networked computer than from a public library, and without the dangerof observation. Nevertheless the ‘Molotov cocktail’ petrol bomb and itseffects, as so many other items, have been far more graphicallyillustrated on TV than on the Internet.
Pornography
There is a lot of pornographic material available on the Internet. A searchfor ‘porn’ will go directly to a range of salacious material. Occasionallya search for something innocuous like ‘banana’, if someone has recentlyindexed their site under ‘banana’, will produce an unpleasant surprise.

Information technology and electronic commerce 355
Despite the wishes of some, most pornography is not illegal. Betterquality images than are available on the Internet can be found at the localvideo store, the local newsagent, or even the local art gallery.
Child pornography
Child pornography, however, is illegal, and it is not always possible todetermine the age of the subject. As a consequence of the ‘Gary Glitter’case where an ageing pop star sent his computer for mending and endedup in gaol for 4 months, the holding of such images, even the viewingof them, may be held to be illegal. You are recommended to find out howto clear your workstation of any such material, especially if it is sharedwith others. The innocence of a user of a machine with such filesviewable may be difficult to prove. Temporary copies of links andimages are stored in the C:\Windows\Temp and C:\Windows\TemporaryInternet Files directories of a Windows machine.
Company disciplinary measures
Most companies regard the display of pornographic images as beingoffensive and observation of such material in working hours is adisciplinary offence. Sending such images across the company intranetis generally forbidden too.
Policies generally exist about the use of the Internet for non-companywork, either because of the time wasted, or because of the potential forinternal competition. Sensible usage, especially outside working hours,is generally allowed; it is often in the company’s interest to have net-aware employees.
E-mail is also the subject of many company policies, both offensiveand harassing messages that contravene equal opportunities policies,and excessive use for non-company business.
Evidence on record
The company’s network server will keep a record of every pageaccessed and every e-mail sent or received in the archive files. Whetheror not these are trawled regularly, it would seem foolish to leaveevidence of anti-social behaviour available, ready for the next shakeoutof underperforming staff.
Web page production
In principle, web pages are quite simple to produce from a wordprocessor. If you type a few sentences of information into Word 97,and then save it as an HTML document, you get a text file resemblingFigure 7.5.6.
It appears on screen in a browser as the first paragraph of thissection.
The whole document is bracketed by �HTML� and �/HTML�. Theseangle bracketed labels are called tags. They usually come in pairs, thesecond label preceded by a ‘/’ which means cancel.
The header is sandwiched between �HEAD� and �/HEAD�. It is notdisplayed and contains useful information about the document, used by

356 Information technology and electronic commerce
indexing programs. It may also contain Javascript (a programminglanguage used to make pages active, produce rollovers, check detailsentered on forms, etc.).
The body, sandwiched between �BODY� and �/BODY�, is whatappears on screen. It contains some bold text �B�, some with a definedfont and size �FONT FACE=‘Arial’ SIZE=4� and a paragraph �P�.
Using an HTML editor
It is worth playing with website creation, just to see how it works. Thereare many introductory texts available to help you. You will also find iteasier to create the page using an HTML editor. These vary in pricefrom the free Composer that comes with Netscape Navigator Browser,to packages like Dreamweaver costing a few hundred pounds. You donot often have to go back to the basic HTML to find out why the pagewill not behave; it is generally easier to redesign the page from scratchusing the editor.
�HTML��HEAD��META HTTP–EQUIV=‘Content-Type’ CONTENT=‘text/html;charset=windows–1252’��META NAME=‘Generator’ CONTENT=‘Microsoft Word 97’��TITLE�8�/TITLE��/HEAD�
�BODY��B��FONT FACE=‘Arial’ SIZE=4��P�7.5.5 Web-page production�/P��/B��/FONT��P�In principle, web pages are quite simple to produce. If youtype a few sentences of information into a Word Processor,and then save it as an HTML document, you get a text fileresembling Fig 7.5.6 �P��/BODY�
Figure 7.5.6
Figure 7.5.7 In a browser itlooks like this

Information technology and electronic commerce 357
Activity 7.5.5
Create your own website, either on a college system or onone of the many ‘free’ systems. Create a home page (therewill be rules as to the name of this), and link it to a CV page,and other pages about your personal interests. Link to thepage of personal useful links if you have created one.
Commercial transactions via the WorldWide Web
Many people saw the Internet as a ‘new frontier’, a completely new wayof doing business; many others who have used telephone sales and mail-order recognize great similarities. In practice many of the earlyexpectations have not borne fruit, except in very specialist areas. Thereasons are not difficult to find. The essence of making money from abusiness is to
(1) Have a product to sell: The Internet has provided its own range of‘products’ for sale, e.g. website design. Other than these theInternet merely provides another way of selling a product availableelsewhere. Where this is more user-friendly, particularly in beingless pressurized than, for example, telesales, the Internet scores.Banking services are very open to this; paying a bill is merely themodification of two electronic data values, that of the payer andthat of the payee.
(2) Find a customer: Internet businesses have a niche when associatedwith information sources, e.g. last minute holiday availability.There are also Internet e-marketplaces that allow you to tender tosupply goods, often by ‘Dutch auction’.
(3) Do a deal: Electronic systems do not provide good mechanisms formaking deals. Until ‘digital signatures’ are easy to work with andlegally accepted, it will be very difficult to prove that a deal wasmade. Legal jurisdiction, for example for a French purchaseraccessing a site in Taiwan owned by a US-registered company, isalso potentially problematical.
(4) Supply the product: Where this is physical, the Internet cannothelp. Where it is a piece of software (music or video would beequally possible) and can be immediately downloaded a bigmarket exists. Other ‘information’ may equally be supplied, e.g.trade reports, or just simply that (having paid), ‘The tickets arewaiting at the airport. Give Code: BA173HJK’.
(5) Get paid: Exchange of credit card information is potentiallyvulnerable to interception. Such information is made more secureby the use of secure encoded information, using the ‘securesockets layer’ available in TCP/IP. Secure sites direct you to pageswith URL starting https:// (the s indicates secure).
The most serious problem that many internet businesses have met isthat, in the rush to carve up the available web URLs into lucrativechunks, large sums of money have been invested against projected

358 Information technology and electronic commerce
returns. Where projections were ambitious and income was notgenerated quickly enough, businesses have foundered. This is hardly anew concept, however; nineteenth century railways were built the sameway and investors lost huge sums of money.
Building a commercial system
First you need a product. If it is not transmissible to the customer overthe net, e.g. software, designs, information, digital music, do not forgetthe distribution system (which has to be at least as good as that of yourcompetitors).
Next you need a web server (computer) to deal with http requestsarriving from the Internet. It will also have to store data about yourproducts (for advertising) and your customers (their orders andpayments). You can outsource this to one of the many internet serviceproviders, who will of course charge. Alternatively you can pay for thetechnical know-how to do it in-house. Your server will have to be linkedto the Internet by, for example, an ISDN link. Negotiate one that can beallowed to grow if the demand is there.
Next you need a designer to produce suitable web pages, attractivelylaid out but avoiding the overcomplex that are slow to download. Thesewill have to be linked to the database so that you do not have to updateyour pages every time there is a change of product.
When your web pages are created you will need to let the world knowabout them. So you will register them with the search engines. This canbe done one at a time, on-line, or using a service that will register themwith many engines, for a charge.
You’ll need to get registered with a banking service like Visa, so thatyou can process credit card payments over the net. You may join aninternet e-marketplace to get on-line orders and supplies from othertraders in your business area.
All this requires investment in equipment and salaries. All you needto ensure is that you have enough capital to cover your outgoings untilthe money starts rolling in!
Problems 7.5.1
(1) Why was the TCP/IP-based network structure without centralcontrol originally set up? Why do you think that academicinstitutions were ready to join such a system? What effect hasthis had on the use some have made of the Internet, and theway the Internet is sometimes portrayed in the press.
(2) Some organizations have responded to the Internet bymonitoring all usage of both the Web and e-mail. To whatextent are they justified in doing so, and what effect wouldsuch measures have on your usage of an internet terminalon your desk at work?
(3) Describe the types of company that would find e-commerceparticularly beneficial? What would be the major problemsthat they would have in exploiting their web status?

Index
Absenteeism 90Absorption costing 220–21Acceptance/agreement, contract
131–2Accounting standards 229Accruals 234ACORN Life Style Segmentation
model 285Acquisition co-operation 306Act of Parliament, procedure 105Action learning 82Activities:
duration distribution patterns165–8
duration estimation 179–80standard deviations 167varying durations 163–7
Activity on arrow (AOA)convention 175
Activity on node (AON) convention175–6
Activity-based costing (ABC) 222Advertising 295Affymatrix (case study) 125Agreements 125
see also ContractsAlliance co-operation 306Allowances, price 296Annual rate of return technique
200–203Ansoff, matrix of change 263Applications (computer) 320–21,
326–7skills requirements 321
Appraisal related pay 87–8Articles of association 7Assets and liabilities accounts 235Assistance sources, business start-up
9–10Asynchronous Digital Subscriber
Link (ADSL) 349AutoCAD 345Average cost, stock material
valuation 216Average gross annual rate of return
(AGARR) 200–201, 208
Average net annual rate of return(ANARR) 201–203, 208
Back calculations, usingspreadsheets 335–7
Bad debts allowance 234Balance sheet 229, 233–4Balanced Scorecard (BSC) method
38–9customer perspective 39–40financial perspective 39learning and growth perspective
41–2linking with strategy 42–3process perspective 40–41
Banks, business start-up guides 7Bar chart see Gantt chartBar/column charts 334Benchmarking 28Benefits 88–91, 197–8
customer expectations 296BIAS error analysis technique 274Biased distribution 179Book and ledger accounts 235,
236–9Book-keeping 234BQC Business Improvement Matrix
34, 36Breakeven points, costing 222British Quality Award (BQA) 27British Quality Foundation (BQF) 27BS 7750 (environment registration)
53, 54, 57BT, patent claim 110–11Budget:
flexed 246–7preparation 241–8
Budgetted cash flow 241, 243Building project, scheduling 158Business, setting-up requirements 6,
7–10Business Excellence awards 27–37Business plan 7–10Business Process Re-engineering
(BPR) 77Buyer’s rights 140
Capacity usage, control ratio 245Capital allowances 225Capital items 197Case law system 105Cash books 235Cash flow:
budgetted 241for build project 177diagram 207–208project schedule 162–3statement 229, 230–32through accounts 240
Centralized structure, organization19
Chain Tensioning Device (casestudy) 132–4
Change management 188Civil law 106
action procedures 106–107Client’s requirement (case study)
299–301Closed-end questions 288Cloud diagram, Goldratt’s 183, 184Co-operation, with other
organizations 305–306Coaching process 81–2Codes of conduct 45–6
Institute of Management 47Common Market Law Reports 105Communication distribution
channels 266Community Trade Mark (CTM) 123Companies Act 1980, registration
procedure 6–7Companies Act 1985 229
E-mail identification 126Companies Act 1989 229Company, registered see Registered
companyCompany accounts see Financial
accountsCompany profile analysis 300Compensating rest allowance (CRA)
102–103Competition Act 2000 137, 142–3Competition, awareness 304

360 Index
Competitive edge criteria 297–9Competitive profile 301
polar chart 301Completion date, changing 171–3Compound interest calculations 203Computer aided design (CAD) 345Computer-based learning (CBL) 346Computer Misuse Act 1990 319Computers:
applications (programs) 320–21auxiliary hardware 324disaster recovery 325fault-finding 324–5health and safety factors 319–20
Confidential information 111–12Conservation, financial guideline
229Consideration 127
grant of rights 137Consistency, financial guideline 230Consortium co-operation 306Constraints theory 183Consumer Contracts Regulations
1999 130Consumer Credit Act 1974 13Consumer goods 257Consumer Protection Act (CPA)
1987 141Contingency plans 306–307Contract of employment:
contents 67natural endings 70–72terminating 69–72
Contract law 48Contracts:
acceptance/agreement 131–2conditions 135consideration 127frustration 135intention 126–7performance 135requirements 125terms 127–30use of standard forms 129–30
Contribution (in marginal costing)221
Control ratios 244–6Copyright 109, 117, 316
application 118digital 119–21infringement 118international rules 118–19related rights 119symbol 118
Copyright (Computer Programs)Regulations 1992 121
Copyright, Design and Patents Act(CDPA) 1988 110, 116, 119,120, 121
Copyright Licence Agency (CLA)137
Copyright, Patents and RegisteredDesigns Act 1988 316
Core problem resolution 183Cost determination:
depreciation 223labour 212–15materials 215–19overheads 220–22process costs 219–20product costing 226–8variance 248
Costs 197–8behaviour 211–12classification 211project financing 198
Council of Ministers, EC 105Counterfeiting 109County courts 106Court of Auditors 105Creditor ratios 252Criminal law 107
action procedures 107–108appeal procedures 108
Critical path 161Crown courts 107Current ratio, working capital 250Customers:
buying pattern research 284competitive profile 302–303complaints 141importance of contacts 296perception of benefits 291–2, 296satisfaction 31–2
Daily sales factors 282Data:
archive records/mining 314–15collection records 289market surveys 286primary sources 286protection 318–19secondary sources 286security precautions 325
Data Protection Acts 1984 & 1998315, 318–19, 320
Databases:basics 337–8copyright protection 120creating 338–42synchronization of information
343Day books 235Debtor ratios 251–2Decentralized structure, organization
19Delphi Technique 283
Demand pattern:cyclic components 281–2determinants 257–9outside influences 282
Deming Prize 27Depreciation 198, 223–6
capital allowances 225in financial accounting 232
Deregulation Act 1994 105Design Act 1949 116Design rights 109, 116–17Desk-top publisher packages 327Digital copyright 119–21Digital Millennium Copyright Act
1998, US 316Digital Millennium Copyright Act
(World Trade Organization)120
Direct costs 211Direct selling 295Directories 321Disability Discrimination Act 1995
67–8Disaster recovery, computer 325Discharge by frustration 135Disciplinary measures, misuse of
Internet 355Disclosure, financial guideline 230Discount factors table 204Discounted cash flow (DCF)
methods 203–206, 208depreciation charges 198
Discounts, price 296Discrimination, selection process
67–9Dismissal procedures 71Distribution chain 286Distribution channels 265Distribution, of products 295Diversification strategy 263Division of labour 15–19, 73Documents:
archiving 330control register 189formatting 328–9production technology 327–30updating records 189
Domain (Internet) 349names 124
Domestic tribunal 106Double entry book-keeping system
235Duality, financial guideline 230
Early Finish (EF) date 159Early Start (ES) date 159Earned value analysis 193Earnings per share 253

Index 361
Economic factors 2–3Elasticity of demand 259Electronic commerce 347Electronic information, copyright
protection 119–20Electronic mail (E-mail) 350
address 348–9copyright 121
EMAS see European CommunityEco-Management and AuditScheme
Employees see WorkforceEmployer’s Liability Insurance 144Employment Protection
(Consolidated) Act (EPCA)1978 67, 71
Employment terms see Contract ofemployment
Entrepreneurial structure,organizational 17
Environmental management:benefits 53customer expectations 297legal requirements 52policy statement 57protection principles 53and quality standards 54review team 53–6
Environmental Management System57
Equal Opportunity Commission(EOC) 46
Equal Opportunity Policy 68Equal opportunity review 62Equal Pay Act 1970 67Error analysis techniques 274–5Ethical issues 45–6, 48European Commission:
community legislation 105community patent proposal 116
European Communities Act 105European Community (EC):
Copyright Directives 119Directive 98/71/EC (design rights)
116, 117Eco-Management and Audit
Scheme (EMAS) 53, 57employee rights 69legislation 105Social Chapter 69
European Court of Justice 69, 105, 108European Foundation for Quality
Management (EFQM)Excellence model 27–8
assessment process 33, 36, 38enabler criteria 28–31results criteria 31–3
European New Approach Directives,consumer protection 142
European Parliament, role 105European Patent Organization (EPO)
116European Quality Award 27European Union Treaty, anti-
competitive practices 142Excel Solver 337Expenses and sales accounts 235Experimental research 288Exponential distribution 179, 180
smoothing technique 279–80Express terms 128
Factor assessment method 94–6Factories Act 1961 144Failure mode effects and analysis
(FMEA) 56Fair Trading Act 1973 142Fault tree analysis (FTA) 56Fault-finding, computer 324–5Feasability study 149, 153–5Feature attributes, product 294Federation Against Software Theft
(FAST) 316FIFO (first-in-first out), stock
material valuation 216File naming conventions 321–2Financial accounts 228–9
business plan requirements 9concepts 229–30depreciation 232interpreting 248–53preparation 236–9standards 229
Financial spreadsheets seeSpreadsheets
Financing costs 198Fire Precautions Act 1971 144Fixed costs 211Fixed period contracts, completion
procedures 70–71Float/slack, project scheduling 160Focus groups 283, 288Folders 321Follow-on activities, monitoring 185Ford, Henry 73Forecasting 269–70
indicators 272information sources 271–2long range 277, 283medium range 270–71quantitative methods 274short range 270simple method 275techniques available 272, 281
Forrester effect, supply chain 23–5Freeware 317–18Frustration, contract 135
Full costing see Absorption costingFunctional structure, organization
17, 18
Gantt chart 161, 162combined project 174, 175design progress reporting 192design project 165production project 170
Gearing ratios 252General Product Safety Regulations
(GPSR) 1994 142Goldratt, Eliyahu 178
cloud diagram 183, 184core problem resolution 183management of uncertainties 178theory of constraints 183
Goodwill, as asset 234Grant of rights 136–7Grants available 198Graphical user interfaces 322–3
skills requirements 327Green Paper 105
Hardware skills requirements 324Hawthorne Experiment 76HAZOP (hazard and operability)
studies 51Health and safety:
computer working conditions 320legal duties 50–52, 143–4VDU radiation 319
Health and Safety at Work Act(HSWA) 1974 50–51, 144
Health and Safety Commission 144code of practice 51–2
Health and Safety (Display ScreenEquipment) Regulations 1992320
Health and Safety Executive (HSE)144
Health and Safety (First Aid)Regulations 1981 144
Help facility, software 323Herzberg, Fredrick 75High Courts 106HTML document 355–6
editor 356Human needs layers 74Human relations movement 76Hygiene (dissatisfier) factors 75Hyperlinking 123Hypertext transfer protocol 347, 348
Implied terms 128Incentive theory, motivation 74

362 Index
Income Tax 11Incoterms 129Indirect costs 197, 211Industrial goods 257Industrial Training Boards 77Information and Communications
Technology (ICT) seeInformation Technology (IT)
Information sources 9–10Information Technology (IT)
312–13speed of change 313–14
Infringement:copyright 121–2patent 115
Integrated Services Digital Network(ISDN) 349
Intellectual property (IP) 109, 316application of current laws
316–17as asset 234protection against abuses 317rights 109
Intellectual Property RightsInitiative 121
Internal rate of return (IRR) method206–207, 208
International Labour Organization,job factors 94
International patents 115–16International Registration (IR), trade
mark 123–4Internet 347
access costs 349company policies 355decentralization 347–8domain names 124problem areas 354–5speed of access 349TCP/IP links 347–8terminology 348–9
Internet service provider (ISP) 347,349
liability 120InterNIC (US domain allocation)
124Intrinsic theories, motivation 75Inventions 112Investment appraisal 196–7
cash flows 199techniques 198–209
Investor in People (IIP) initiative46, 77, 78
Invitation to treat 127ISO 9000 Quality System 19, 20
ISO 9004:2000 (QualityManagement Principles) 44
ISO 14001 (environmentregistration) 53, 54, 57
JIT (Just-In-Time) system 19, 20Job evaluation schemes 91–2
comparative methods 93–6executive positions 96factor descriptions 94, 95
Jobs:classification method 93, 94description decument 63–4design 76–7enrichment schemes 76offers procedure 67ranking method 93reduction in number of rates
91–2Joint venture co-operation 306Judicial review 106Julia Roberts, domain name 124
Kant, approach to ethical issues 46Karoshi phenomenon 314Key performance results 33Kolb’s Model of Learning 81
Labour costs 212–13controlling 214elements 213–14
Labour law 49Latest Finish (LF) date 160Latest Start (LS) date 160Law Reform (Frustrated Contracts)
Act 1943 135LE PEST C analysis see PEST
analysisLeadership, performance criteria
28–9Learning processes 80–82Ledger accounts see Book and
ledger accountsLegal issues 45–6
business plan requirements 9environmental management 52health and safety 50–52intellectual property protection
315–19whistle-blowing 49–50
Legal system:contract law 48EC legislation 105evolution 104–105labour law 49new laws procedure 105
Liability, limitations 5–6Licensing procedure 136
consideration 137copyright material 137grant of rights 136–7software 137specific obligations 137–8
Life cycle, product see Product lifecycle
LIFO (last-in-first-out), stockmaterial valuation 216
Limited company 5Line charts 334Line and staff relationships 16Linear regression formula 276–7LINUX software 317–18Liquidity 249
McGregor, Theory Y 75Madrid Protocol 123Magistrates courts 107Mail merging 330Mail Order Transactions
(Information) Order 1976 126Malcolm Baldrige National Quality
Award 27Management:
accounting requirements 210–11business plan requirements 5–6setting goals 271
Management of Health and Safetyand Welfare at Work Act 1992143, 144
Management-by-target paymentschemes 86
Manpower planning 58–62see also Recruitment
Marginal costing 221–2Margins 250Mark-ups 251Market:
classification 257description 8identification 257–9qualifying criteria 297–9
Market strategies 39, 40, 292, 305case study 308–311development approach 263penetration approach 263
Marketing, role 255–6Marketing mix 293
product components 293–6service extensions 296–7
Marketing research 283–4data sources 286preparing brief 284programme 284–5proposal 285questioning technique 288–9target selection 285–8use of results 290–92
Maslow, Abraham 74Mass balance calculation, waste
process 53, 55Mass media distribution channels 266

Index 363
Matching, financial guideline 230Material costs 215
controlling 219stock valuation 215–18
Matrix of change 263Matrix structure, organization 18, 19Mayo, Elton 76Mean average deviation (MAD) error
analysis technique 274, 275Measured day work 86Memorandum of association 6–7Mentoring process 81Merchant Shipping Act 1988 105Merger co-operation 306Merit rating 87Message passing, electronic 347–8Metatags 123Method study 99, 100–101Microsoft 171, 173, 176
infringement case study 121–2Microsoft Office (software package)
326Microsoft Project (software
package) 157, 158, 164, 169,189
Misrepresentation 130Model of Learning, Kolb’s 81Modems, cable 349Money measurement concept,
financial guideline 229Money transactions 10–13
see also Financial accountsMoore’s Law, chip complexity 313Moral rights 119Motivation theories 73
human relations 76incentive approach 74intrinsic appproach 75satisfaction approach 75
Motivator factors 75Moving average formula 278–9MP3/Mpeg3, infringement case
study 122MS Access (software) 339–42Multi-tasking 186
National Insurance Contributions(NIC) 11, 12
National Vocational Qualification(NVQ) 77, 81
Negligence 140claims 106
Nestle, Aero IP protection 109Net present value (NPV) 205, 206Network diagram 175–6
for design project 165for production project 170for project activities 159
Networks:computer 323skills requirements 323
New building project 158New entrants, barriers 303–304New plant installation project 169New product design project 163New product risks 264Newspaper Licensing Agreements
(NLA) 137No Electronic Theft (NET) Act, US
121Nolan Committee on Standards in
Public Life 49–50NOMINET (UK domain allocation)
124Non-productive time 214Normal distribution 168, 179, 180Numerical spreadsheets see
Spreadsheets
Objectivity, financial guideline 230Obscene Publications Act 1959 120Observational research 288Offers 126–7Office of Fair Trading (OFT),
competition exemptions 143Offices, Shops and Railway
Premises Act 1963 144One-person business see Sole trader
businessOnline Copyright Infringement
Liability Limitation Act, US120
Open-end questions 289Operating systems 321–3
skills requirements 322Operational activities
business plan requirements 8monitoring 184
Order processing, customerexpectations 296–7
Order-losing/winning criteria 297–9Organization 4
business sub-unit structure 19centralized structure 19decentralized structure 19entrepreneurial structure 17functional structure 17, 18internal structures 15–19line and staff relationships 16matrix structure 18, 19performance improvement 26–7policy establishment 29product structure 18, 19regional structure 17, 18strategy establishment 29surrounding environment 16
Overhead costs 197control 222recovery 222
Own company, setting-up 7–10Owners’ objectives, business plan
requirements 9Ownership types 4–7
Packaging, product 295, 296Paired comparison method 93Paris Convention 1886 115Parliamentary Copyright 137Partnerships 5, 6
performance criteria 30Patent Cooperation Treaty (PCT)
116Patents 109, 110, 316
application and procedure 112–14European 116examination 115granting 115infringement 115international 115–16ownership 112requirements 111search procedure 112–13
Patents Office 117Payback period technique 198–200,
208Payment by results (PBR) 84–6Payment schemes 83–8
objectives 83Pension schemes 88–9People:
developing abilities 80–82performance criteria 29–30satisfaction 32see also Workforce
Perceived price (PP) 291Perceived value (PV) 291Performance improvement 26–7
indicators 32, 33Performing rights 119Personal information managers
(PIMs) 343Personal pension schemes 89Personnel specification 64
Five-fold Grading System 64–5Seven-point Plan 64
PERT three-time estimate 184Sec4.2
PEST analysis 1economic factors 2–3political factors 2socio-cultural factors 3technological factors 4
Physical distribution 295Pie charts 334

364 Index
Piracy 109computer software 121
Place, as part of marketing mix295
Plant installation project,scheduling 169
Plant/company payment schemes86–7
Policy, performance criteria 29Political factors 2Pornography, Internet 354–5Prepayments 234Presentations:
content 343pitfalls 344
Price:demand (P:D) ratio:delivery criteria 298elasticity 259
Price:as part of marketing mix 296structure 296variance 248
Price/earnings (P/E) ratio 253Price:value matrix 291–2Pricing gap 296Primary data sources, market
surveys 286Private limited company 5Privity, sale of goods 140Probability 168Process costs 219–20Processes, performance criteria 31ProChain software 186, 187Product:
benefits 293correlation of attributes 291costing 226–8design project scheduling 163development strategy 263image/profile 290as part of marketing mix 293–5range and depth 294research 283
Product life cycle 259–63Product/service definition, business
plan requirements 8Productivity measurement 98–103
control ratio 244Profit and loss account 229, 232–3Profit margin 251Progress reporting 189–94Project buffer 184, 185Project calendar 171, 172Project management 148–51, 152
control activities 187–8Goldratt’s theory and solution
183–7initial planning 155–7new building (case study) 158–63
new plant installation (case study)169–73
new product design (case study)163–9
summary report 190uncertainty laws 177–8use of computers 345use of resource time buffer
184–5see also Projects
Project schedule 157–8, 180operation 180–82preparation 180
Project specification 149Project team 19, 149, 152–3Projects:
activities breakdown 156, 157cash flow schedule 162–3change of aims 188combining 173–5completion date changes 171–3completion stage 194initiation 151–3network diagram 159non-economic considerations
208–209progress reporting 189–94risk assessment 209–10selection process 154–5, 208–210sequence dependency 156–7, 159stages 149terms of reference 153time and cost estimation 156, 209uncertainties and failure causes
176–8use of Gantt chart 161, 162varying activity durations 163–7
Promotion:methods 295–6as part of marketing mix 295–6research 284techniques and skills 266–9
Proprietor see Sole trader businessProvision and Use of Weights Act
143Prudence, financial guideline 229Four ‘P’s (marketing mix) 293Public Interest Disclosure Act 1998
49Public limited company 6Public relations/publicity 296
Quality control 44and environmental management
54identification of internal problems
300–301ISO 9004:2000 44
of suppliers’ products 19–20,21–2
Quality function deployment (QFD)290
Questioning techniques, marketsurveys 288–9
Quick ratio, working capital 250
Race Relations Act 1976 67RADAR card score 35, 36, 37Rating, work content 102Realization concept, financial
guideline 229Record system, business plan
requirements 8Records and Notification of Injuries,
Disease and DangerousOccurrences Regns. 1985 144
Recruitment 63attracting suitable candidates 65contract of employment 67discrimination 67–9interviews 65–6job offer 67job requirement 63–4selecting best applicant 65–6
Reducing balance method,depreciation 223–4
Redundancy procedures 71, 72Regional structure, organization 17,
18Registered company 5Registered design 116–17Regression formula 276–7Repetitive strain injury (RSI) 320Representations 130Resale Prices Act 1980 142Research, marketing see Marketing
researchResignation procedures 69–70Resource time buffer 185Resources:
information report 171performance criteria 30usage calendar 171, 172
Restrictive Trades Act 1976 142Retirement procedures 70Return on capital employed (ROCE)
249Return on investment (ROI) 249Revaluations 234Revenue items 197Rights of Third Parties Bill 136Risks, new product 264Rotary movement, approach to
ethical issues 46, 48Routers, Internet 347Royalty stream 137

Index 365
Sale of Goods Act 1979 140–41,315–16
Sale of Goods Acts 1893 140–41Sale and Supply of Goods Act 1994
315–16Sales:
budget 242patterns 273promotions 295research 284techniques and skills 266–9
Sales force:commission payment schemes 86forecasting input 271–2
Sampling techniques, marketsurveys 287–8
Satellites, data broadcasting 349Satisfaction theories, motivation 75Science Reference Information
Service (SRIS) 113Scientific management 73Search engines, World Wide Web
352–3Secondary data sources, market
surveys 286Secure operation skills 325Segmentation models, market
surveys 285Selection process, recruits 65–6Self-directed teams 76Seller’s rights 140Semi-variable costs 212SERPS (State Earning Related
Pension Scheme) 12, 88Server, computer 348Service extensions 296–7Sex Discrimination Act 1975 67Shadowing process 81Share price ratios 253Shareholders 6, 253Shareware 317–18Sick pay 89–90
monitoring 90Signal attributes, product 294Simulation software 345–6Smith, Adam 73Society, and business 32–3, 45Socio-cultural factors 3Software:
copyright 121distribution 317–18licences 137simulation 345–6see also under specific names
Sole trader business 4–5, 6Spamming, E-mail 350Spreadsheets 331–3
back calculations 335–7graphics 333–5
Staff, satisfaction perceptions 32Stakeholders, and ethical issues 48Standard cost, stock material
valuation 217Standard deviation (SD) 167
project 169State pension scheme 88Statement of Standard Accounting
Practice (SSAP) guidelines 229Statutory maternity pay (SMP)
89–90Statutory sick pay (SSP) 90STEEP analysis see PEST analysisSTEP analysis see PEST analysisStock material:
financial accounting 232valuation 215–18
Stock ratios 252Straight line method, depreciation
223Strict liability 106Student syndrome (assignment work
pattern) 181Subsidies 198Substitute products, threat 304Supplier relationships 19–20
competitive profile 302monitoring quality 21–2supply chain 22–6vendor assessment 20
Supply chains 22–6Forrester effect 23–5information flow 25
Supply and demand function 258–9Supply position matrix 302Suppplier preference matrix 303SWOT analysis 305
Taylor, Frederick W 73Teachers pension scheme 89Technological factors 4Tendering process 127Terms, contract 127–30Terms of reference, project 153Test marketing 288The Gadget Shop v The Bug Chain
(case study) 108–109Theory Y 75Time rate payment scheme 83–4Time study 101Times series patterns, demand
fluctuations 273To do list 191Tort 106Trade marks 109, 316
application 123description 122–3domain names 124
Trade Marks Act 1994 122, 123,316
Trade Union Reform andEmployment Rights (TURER)Act 1993 67
Trades Descriptions Act 141Trading Standards Office 142Training and Enterprise Councils
(TECs) 77Training needs 79
programmes 80–82Transmission control protocol/
internet protocol (TCP/IP) 347Treaty of Accession 1972 105Treaty of Rome, monopoly
situations 137Turnover ratios 251–2
UK National Readership Survey(NRS) model 285
Uncertainties:cause-effect diagram 178management 178project 176–8
Uncompetitive practices 142Uniform resource locator (URL) 348University courses (case study) 307Unlimited company 5Usage variance 248
Variable costs 211Variance analysis 193–4, 244–8
labour 246materials 245sales 245
VAT (Value Added Tax) 12Vendor see Supplier relationshipsVerifiability, financial guideline 230Vicarious tort 106Viruses (computer programs) 319Volume index, control ratio 245
Warranty 135Waste process flow diagram 53, 55Watt, patent application 114Web:
copyright protection 120page production 355–6see also World Wide Web
Whistle-blowing 49–50White Paper 105Windows GUI 326–7Word processors 327
advanced skills 330data input and editing 328document automation 330

366 Index
Word processors (cont.)document formatting 328–30elementary skills 328intermediate skills 328–30use of graphics 330
Work content, operation 98–9Work measurement 99, 101–103Work study 74, 76, 77, 99–101Workforce:
age analysis 59benefit rewards 82–91conditions of employment
changes 61equal opportunities 62evaluation 59
external changes 61–2fixed period contracts 70–71internal changes 61payment rewards 82–8resignation procedures 69–70stability/turnover 60training and development 77–82
Working capital ratios 249–50Workplace Health, Safety and
Welfare Act 143, 144World Intellectual Property
Organization (WIPO) 116global copyrights 119
World Wide Identical ScreeningSearch (WISS) 123
World Wide Web 347, 351for commercial transactions
357–8finding information 351–3intelligent searching 354web page production 355–6
World Wrestling FederationEntertainment (WWF), domainname 124
Yield per share 253
Zero budgeting 222