Business Review Q4 FY 17 - Amazon Web...
26
1 Q4 FY 17 BUSINESS REVIEW Contact: [email protected] Contact: [email protected] Contact: [email protected] Contact: [email protected]
Transcript of Business Review Q4 FY 17 - Amazon Web...

1
Q4 FY 17
BUSINESS REVIEW
Contact: [email protected]: [email protected]: [email protected]: [email protected] Mr. Vijay B Somaiya Mr. Vijay B Somaiya Mr. Vijay B Somaiya Mr. Vijay B Somaiya Mr. Prakash PandeyMr. Prakash PandeyMr. Prakash PandeyMr. Prakash Pandey VP & Head (Treasury & IR) Divisional Manager (Treasury & IR) Phone: 91-22-6665 7258 Phone: 91-22-6665 7908 Mr. Bikash Dugar Ms. SharMr. Bikash Dugar Ms. SharMr. Bikash Dugar Ms. SharMr. Bikash Dugar Ms. Sharvari Gokhalevari Gokhalevari Gokhalevari Gokhale Manager (Treasury & IR) Manager (Treasury & IR) Phone: 91-22-6665 7241 Phone: 91-22-6665-7812

2
Index
I] Snapshot of Financials 3
II] Indian Economic Scenario 4
III] TML Consolidated Financials
A] Financials (Rs. Crores) 11
B] Financials (USD Million) 12
C] TML Group Operating Profit Performance Q4 FY 17 Snapshot 13
D] TML Corporate Credit Rating 13
IV] TML Standalone including Joint Ventures
A] Financials (Rs. Crores) 14
B] Financials (USD Million) 15
C] Commercial Vehicles Business 16
D] Passenger Vehicles Business 16
E] Exports 16
F] Highlights 17
G] Key Launches & Events in Q4 FY 17 17
H] Way Forward 19
V] Jaguar Land Rover PLC
A] JLR volumes 20
B] Financials (i) Under IFRS 20
(ii) Under IndAS 21
C] IFRS to INDAS Profit Reconciliation 21
D] JLR Highlights 22
E] Other Developments 22
F] Way Forward 23
G] JLR Corporate Credit Rating 23
VI] Highlights of Key Subsidiaries
A] Tata Motors Finance 24
B] Tata Technologies 24
C] Tata Daewoo 25
D]TML Drivelines Ltd 25
VII] Shareholding Pattern & Market Capitalisation 26

3
I] SNAPSHOT OF FINANCIALS
Particulars NET REVENUE * PAT ^
Q4 FY17 Q4 FY16 Y-o-Y
change Q4 FY17 Q4 FY16
Y-o-Y change
TML Consolidated (Rs Crores) 77,272 79,549 (2.9%) 4,336 5,211 (16.8%)
TML Standalone (incl Joint Operations) (Rs Crores)#
13,621 12,840 6.1% (829) 398 NM
Jaguar Land Rover PLC (IFRS) (GBP Million)
7,268 6,672 8.9% 557 440 26.6%
Particulars NET REVENUE * PAT ^
FY17 FY16 Y-o-Y
change FY17 FY16
Y-o-Y change
TML Consolidated (Rs Crores) 269,850 273,111 (1.2%) 7,557 11,678 (35.3%)
TML Standalone (incl Joint Operations) (Rs Crores)#
44,477 42,894 3.7% (2,480) (62) NM
Jaguar Land Rover PLC (IFRS)(GBP Million)
24,339 22,286 9.2% 1,272 1,312 (3.0%)
USD Million@
Particulars NET REVENUE * PAT ^
Q4 FY17 Q4 FY16 Y-o-Y
change Q4 FY17 Q4 FY16
Y-o-Y change
TML Consolidated 11,915 12,267 (2.9%) 669 804 (16.8%)
TML Standalone (incl Joint Operations)# 2,100 1,980 6.1% (128) 62 NM
Jaguar Land Rover PLC 9,121 8,373 8.9% 699 592 18.0%
USD Million@
Particulars NET REVENUE * PAT ^
FY17 FY16 Y-o-Y
change FY17 FY16
Y-o-Y change
TML Consolidated 41,611 42,114 (1.2%) 1,165 1,801 (35.3%)
TML Standalone (incl Joint Operations)# 6,858 6,614 3.7% (382) (10) NM
Jaguar Land Rover PLC 30,545 27,968 9.2% 1,596 1,647 (3.0%)
#Joint Operations included in Standalone financials are Tata Cummins Private Ltd and Fiat India Automobile Private Limited *Net Revenue is excluding excise duty and other income; ^ PAT is after share of Profit/ (loss) in respect of Joint Ventures & associate companies; @ At conversion rate of 1 USD = 64.8500 INR; 1 GBP = 1.2550 USD
*During Q4 FY17, the Company reviewed the presentation of foreign exchange in the income statement due to continued increase in
hedging activity and volatility in FX rates. Accordingly, it was considered appropriate to present realized foreign exchange relating
to the hedging of revenue & cost exposures as an adjustment to revenue and material cost of sales for Q4 FY 17 and FY 17.The prior
period comparatives have also been represented on this basis. There is no impact upon the reported operating profit, profit before
tax and profit after tax or reported equity in either of the financial years or quarters due to change in presentation of foreign
exchange impact.

4
II] INDIAN ECONOMIC SCENARIO: KEY HIGHLIGHTS OF Q4FY17 Source: Tata Department of Economics and Statistics (Tata DES) 1. GDP Growth
GDP by expenditure (% change y/y) in real terms
GDP by expenditure (% change y/y) in real terms
GDP Private final consumption expenditure
Government final consumption expenditure
Gross capital formation
Exports, Goods & Services
Imports, Goods & Services
Q1 FY16 7.8 4.9 0.5 8.0 (5.7) (5.2) Q2 FY16 8.4 6.7 3.9 12.2 (4.3) (3.6) Q3 FY16 6.9 6.8 3.7 4.0 (9.0) (10.2) Q4 FY16 8.6 10.6 3.6 (0.8) (2.5) (4.4) Q1 FY17 7.2 7.2 15.5 (1.9) 2.1 (2.7) Q2 FY17 7.4 5.1 15.2 (5.3) (0.9) (7.4) Q3 FY17 7.0 10.1 19.9 2.5 3.4 4.5
As per the second advance estimates of the Central Statistical Organisation (released on Feb 28,2017),
Indian economy is estimated to grow by 7.1% during the fiscal 2016-17 as compared to the growth
rate of 7.9% in 2015-16. In Q3 2016-17 (the demonetisation quarter), the economy reported a growth of
7.0% (as compared to 6.9% growth in Q3 2015-16 and 7.4% in Q2 2016-17). The growth reported in Q3
2016-17 is much higher than what was expected primarily implying that the economy remained
unaffected by demonetisation. Since a large part of the early estimates of quarterly GDP rely heavily on
extrapolation and not on actual data, the Q3 GDP growth may not be fully capturing the impact of
demonetisation. The growth in 2016-17 is estimated to be around 6-6.5% instead of 7.1% as indicated by
CSO’s advance estimates.
* The figures are not yet published by the CSO for Q4FY17.

5
2. Industrial Growth IIP and its categories
Base: 2011-12* Categories FY 2016-17(%) FY 2015-16 (%)
IIP General 5.0 3.4
Sectoral
Mining 5.3 4.3 Manufacturing 4.9 3.0 Electricity 5.8 5.7
Use-based
Primary 4.9 5.0 Capital 1.9 2.1 Intermediate 2.9 1.6 Infrastructure/construction 3.9 2.8 Consumer 7.7 3.4
- Consumer Durables 6.1 4.3 - Consumer Non-Durables 9.0 2.7
Source: MoSPI,
* MoSPI has revised the base of IIP from 2004-05 to 2011-12. The use-based classification has been re-framed by
replacing “Basic Goods” with “Primary Goods” and introducing a new “Infrastructure/ Construction Goods”
category.

6
As per new series, the IIP index recorded 5.0% y/y growth during FY2016-17 (3.0% in FY2015-16). This
higher growth is on the back of significant growth in manufacturing sector with a sharp increase in
Intermediate, Infrastructure/construction and Consumer durable goods production, reflecting favourable
demand scenario. In Mar. 2017, IIP reported 2.7% y/y growth due to 10.0% y/y increase in Mining &
quarrying; primary goods increased by 5.7%. In manufacturing sector, 9 out of the 23 industry groups
reported positive growth in IIP during Mar.2017. The IIP of manufacture of motor vehicles, trailers and
semi-trailers reported significant growth of 8.5% y/y in Mar. 2017 (compared to -2.1% in Mar.2016 & 1.9%
in Feb. 2017).
12 Monthly Moving Average

7
3. Infrastructure Index
Performance of Core industries
Sector Weight (%) Apr-Mar 2016-17
Apr-Mar 2015-16
Overall Index 37.903 4.5 4.0
Coal 4.379 3.6 4.5
Crude Oil 5.216 (2.5) (1.4)
Natural Gas 1.708 (1.1) (4.2)
Refinery Products 5.939 5.4 4.3
Fertilizers 1.254 1.8 12.5
Steel 6.684 9.3 (0.1)
Cement 2.406 (1.3) 5.0
Electricity 10.316 5.1 8.3
(Source: GOI- MINISTRY OF COMMERCE & INDUSTRY)
Core Industries index which is an indicator of infrastructure industries performance reported higher
growth in Apr-Mar of FY17 led by improvement in refinery products and steel.
4. Inflation Year on Year growth rate of WPI and CPI
Source: Office of Economic Adviser

8
The ministry of commerce and industry has revised the base year of WPI from 2004-05 to 2011-12.
According to new series, WPI inflation averaged 1.8% in FY 2016-17 as compared to -3.6% in FY 2015-16.
In Apr’17, it was 3.9% much higher than -1.1% in Apr'16. Retail inflation recorded 4.5% for the fiscal year
2016-17 lower than 4.9% in the fiscal year 2015-16.
While food inflation both at retail and wholesale continues to remain at moderate level, the fuel
inflation continues to remain high, particularly at the wholesale level that has got translated into higher
retail prices. This is in alignment with higher international fuel prices.
5. Interest rates
Movement in Key Policy Rates (%)
Reverse Repo Rate Repo Rate Cash Reserve Ratio
01-04-2014 7.00 (0.00) 8.00 (0.00) 4.00 03-06-2014 7.00 (0.00) 8.00 (0.00) 4.00 05-08-2014 7.00 (0.00) 8.00 (0.00) 4.00 30-09-2014 7.00 (0.00) 8.00 (0.00) 4.00 02-12-2014 7.00 (0.00) 8.00 (0.00) 4.00 15-01-2015 6.75 (-0.25) 7.75 (-0.25) 4.00 04-03-2015 6.50 (-0.25) 7.50 (-0.25) 4.00 07-04-2015 6.50 (0.00) 7.50 (0.00) 4.00 02-06-2015 6.25 (-0.25) 7.25 (-0.25) 4.00 29-09-2015 5.75 (-0.50) 6.75 (-0.50) 4.00 01-12-2015 5.75 (0.00) 6.75 (0.00) 4.00 02-02-2016 5.75 (0.00) 6.75 (0.00) 4.00 05-04-2016 6.00 (+0.25) 6.50 (-0.25) 4.00 07-06-2016 6.00 (0.00) 6.50 (0.00) 4.00 09-08-2016 6.00 (0.00) 6.50 (0.00) 4.00 04-10-2016 5.75 (-0.25) 6.25 (-0.25) 4.00 07-12-2016 5.75 (0.00) 6.25 (0.00) 4.00 08-02-2017 5.75 (0.00) 6.25 (0.00) 4.00 06-04-2017 6.00 (+0.25) 6.25 (0.00) 4.00
Note: 1. Reverse Repo indicates absorption of liquidity and repo indicates injection of liquidity. 2. Figures in parentheses indicate change in policy rates in percent.
RBI has taken few steps in the past few days to step up liquidity and foster transmission of lower interest
rates into the economy. In the first bimonthly review of FY 2017-18, RBI kept the repo rate (rate at which
RBI lends to bank) unchanged at 6.25% while increasing the reverse repo rate (rate at which borrows from
banks) to 6% from 5.75%. This will lead to bank having more money. RBI continued to keep its stance on
monetary policy ‘neutral’ with the objective of achieving the medium-term target for consumer price
index(CPI) inflation of 4% within a band of +/-2%, while supporting growth. Transmission of policy into
bank lending rates is gradually happening which bodes well for the EMI-dependent sectors like housing,
automobiles.

9
6. Freight Rate
Road freight rates show some signs of recovery. Average road freight rate index for Q4 (Jan-Mar) FY17
posted a growth of 1.0% even though the 4 quarterly moving average remains lower reflecting lower
freight availability. Meanwhile, diesel prices increased by an average 2 Rs. per litre between Q3 and Q4
of fiscal 2016-17. Higher diesel prices in absence of adequate freight availability restricts ability of truck
operators to pass on the increase in costs thus putting pressure on profitability of truck operators.
7. National Highway Development Project (NHDP)
There has been progress on road projects; work has started on NHDP phase 6 after a gap of 6-7 years. There is also progress on port connectivity projects.
Status of NHDP
Status of NHDP & other NHAI Projects (28th Feb. 2017)
Total length (kms)
Completed Under Implementation
Balance to be awarded
GQ 5846 100 0 0
NHDP
NS – EW Ph I & II 7142 90.0 6.4 3.6
NHDP Phase III 11809 57.9 27.3 14.8
NHDP Phase IV 13203 15.6 35.2 49.2
NHDP Phase V 6500 36.3 11.7 52.0
NHDP Phase VI 1000 0 16.5 83.5
NHDP Phase VII 700 3.1 2.7 94.1
Port Connectivity 435 87.1 12.9 0
NHDP Total 46635 51.3 20.0 28.7
Others (Ph I, II & Misc.) 1844 87.5 12.5 0
SARDP-NE 110 95.5 4.5 0
Total by NHAI 48589 52.8 19.7 27.5
Source – National Highway Authority of India

10
Outlook by Tata DES (Tata Department of Economics and Statistics), 2017-18
• During 2016-17, GDP growth may come down to 6-6.5% because of demonetisation. DES’
projections suggest that in 2017-18, GDP growth will be between 7-7.5%.
• Transmission of lower policy rates into effective lending rates is gradually happening.
With the inflation projected to remain under control, interest rates should become more
affordable during FY 2017-18.
• RBI continued to keep its stance on monetary policy ‘neutral’ with the objective of
achieving the medium-term target for consumer price index(CPI) inflation of 4% within a
band of +/-2% in FY 2017-18, while supporting growth.
• Broad Money supply, M3 (which includes currency with public, demand deposits of public
in banks and time deposits of public in banks) growth was at 6.2% for the week ending
28th Apr 2017. Growth of M1, a component of M3 (which includes currency with public
and demand deposits of public in banks) reported negative y/y growth of -2.5% for the
week ending 28th Apr 2017. Money supply is expected to remain subdued until normalcy
is restored.
• INR/USD for Q1 (Apr-Jun) 2017-18 is projected at 65.0 /USD.

11
III] A] TATA MOTORS GROUP CONSOLIDATED FINANCIALS IN RS. CRORES
Rs. Crores Q4 FY17 Q4 FY16 Y-o-Y change
FY17 FY16 Y-o-Y change
Global Sales(Units) 328,946 311,947 5.4% 1,155,253 1,066,254 8.3%
Revenue+ 78,747 80,868 (2.6%) 274,492 277,661 (1.1%)
Revenue (Net off Excise duty)+ 77,272 79,549 (2.9%) 269,850 273,111 (1.2%)
EBITDA# 11,788 13,192 (10.6%) 36,912 41,776 (11.6%)
EBITDA Margin 15.3% 16.6% (130 bps) 13.7% 15.3% (160 bps)
Other Income 234 212 10.5% 755 885 (14.7%)
Profit before exceptional items and tax
5,246 5,329 (1.5%) 8,200 15,976 (48.7%)
Exceptional Items gain/(loss) (81) 560 NM 1,115 (1,850) NM
Profit before Tax 5,166 5,888 (12.3%) 9,315 14,126 (34.1%)
Net Profit (PAT) ^ 4,336 5,211 (16.8%) 7,557 11,678 (35.3%)
Basic EPS – Ordinary Shares 12.64 15.23
21.94 34.25
Basic EPS - ‘A’ Ordinary shares 12.74 15.33
22.04 34.35
Gross Debt 78,582 69,303
78,582 69,303
Net Automotive Debt 8,817 557
8,817 557
Net Automotive Debt / Equity 0.15 0.01
0.15 0.01
Inventory Days 40 36
47 43
Receivable Days 16 15
19 18
The Company has adopted Ind AS for its Standalone and Consolidated financials with effect from April 1, 2016, with
comparatives being restated. Accordingly, the impact of transition has been provided in the Opening Reserves as at
April 1, 2015 and all the periods presented have been restated accordingly.
# EBITDA is calculated on Net Revenue (i.e. net of Excise duty)
+ Excludes Other Income;
^ PAT is after Non-controlling interest and share of Profit/ (Loss) in respect of Joint Ventures & Associate companies
EPS reported in the tables above for the quarter is not annualized;
Consolidated Financials (Rs. Crores) Q4 FY17 Q3 FY17 Q2 FY17 Q1 FY17
Net Revenue* 77,272 63,886 63,577 65,115
EBITDA 11,788 7,054 8,172 9,899
EBITDA Margin 15.3% 11.0% 12.9% 15.2%
EBIT 6,776 2,558 3,429 5,079
EBIT Margin 8.8% 4.0% 5.4% 7.8%
*During Q4 FY17, the Company reviewed the presentation of foreign exchange in the income statement due to continued increase in
hedging activity and volatility in FX rates. Accordingly, it was considered appropriate to present realized foreign exchange relating
to the hedging of revenue & cost exposures as an adjustment to revenue and material cost of sales for Q4 FY 17 and FY 17.The prior
period comparatives have also been represented on this basis. There is no impact upon the reported operating profit, profit before
tax and profit after tax or reported equity in either of the financial years or quarters due to change in presentation of foreign
exchange impact.

12
B] TATA MOTORS GROUP CONSOLIDATED FINANCIALS IN USD MILLIONS
USD Million@ Q4 FY17 Q4 FY16 Y-o-Y
change FY17 FY16
Y-o-Y change
Global Sales(Units) 328,946 311,947 5.4% 1,155,253 1,066,254 8.3%
Revenue + 12,143 12,470 (2.6%) 42,327 42,816 (1.1%)
Revenue (Net off Excise duty) + 11,915 12,267 (2.9%) 41,611 42,114 (1.2%)
EBITDA # 1,818 2,034 (10.6%) 5,692 6,442 (11.6%)
EBITDA Margin 15.3% 16.6% (130 bps) 13.7% 15.3% (160 bps)
Other Income 36 33 10.5% 116 137 (14.7%)
Profit before exceptional items and tax
809 822 (1.5%) 1,264 2,464 (48.7%)
Exceptional Items gain/(loss) (12) 86 NM 172 (285) NM
Profit before Tax 797 908 (12.3%) 1,436 2,178 (34.1%)
Net Profit (PAT) ^ 669 804 (16.8%) 1,165 1,801 (35.3%)
Basic EPS – Ordinary Shares 0.19 0.23
0.34 0.53
Basic EPS - ‘A’ Ordinary shares 0.20 0.24
0.34 0.53
Gross Debt 12,117 10,687
12,117 10,687
Net Automotive Debt 1,360 86
1,360 86
Net Automotive Debt / Equity 0.15 0.01
0.15 0.01
Inventory Days 40 36
47 43
Receivable Days 16 15
19 18
The Company has adopted Ind AS for its Standalone and Consolidated financials with effect from April 1,
2016, with comparatives being restated. Accordingly, the impact of transition has been provided in the
Opening Reserves as at April 1, 2015 and all the periods presented have been restated accordingly.
# EBITDA is calculated on Net Revenue (i.e. net of Excise duty)
+ Excludes Other Income;
^ PAT is after Non-controlling interest and share of Profit/ (Loss) in respect of Joint Ventures & Associate
companies
EPS reported in the tables above for the quarter is not annualized;
@ At conversion rate of USD 1 = 64.8500 INR for reference only

13
C] TATA MOTORS GROUP OPERATING PROFIT PERFORMANCE Q4 FY 17 SNAPHOT
Consolidated financial performance impacted by:
� Continued volatility in the Standalone businesses leading to lower volumes of the Commercial
vehicles:
A. Both M&HCV and LCV witnessed pressure in Q4 on account of weak replacement demand,
subdued freight demand from industrial segment, which took further hit post
demonetization, and lower than expected pre-buying ahead of the implementation of BS IV.
B. Fall in M&HCV truck by 7.7%(Y-o- Y) and slower growth in LCV segment which is partially
offset by growth in Passenger Vehicle segment of 23% (Y-o-Y)
� Higher marketing expenses in Standalone as well as Jaguar Land Rover business.
� Jaguar Land Rover’s operating performance is impacted by higher marketing & other expenses,
partially offset by higher wholesale volumes :
A. FY 17-Positive free cash flow of £295m after total investment spending of £3.4b.
B. Cash and deposits of £5.5b and an undrawn revolving credit facility of £1.9b as on 31st March
2017.
C. Share of China JV profit for FY 17 - £151 m
D] TML CORPORATE CREDIT RATING
Credit Rating Agency Long Term Rating as on 31st March 2017
Moody’s Ba1 / Stable
S&P BB+/ Stable
CRISIL AA / Positive
ICRA AA / Positive
CARE AA+ / Stable

14
IV] TATA MOTORS GROUP STANDALONE BUSINESS (including Joint Operations) AS PER INDAS
A] FINANCIALS IN RUPEES CRORES
Rs. Crores Q4 FY17 Q4 FY16 Y-o-Y
change FY17 FY16
Y-o-Y change
Total Volumes: A+B+C(Units) 151,606 144,507 4.9% 545,416 511,931 6.5%
CV (Units)-A 94,468 98,620 (4.2%) 324,175 326,755 (0.8%)
PC (Units)-B 41,485 28,752 44.3% 157,020 127,118 23.5%
Exports (Units)-C 15,653 17,135 (8.6%) 64,221 58,058 10.6%
Revenue * 15,092 14,148 6.7% 49,100 47,384 3.6%
Revenue(net of excise duty) * 13,621 12,840 6.1% 44,477 42,894 3.7%
EBITDA # 556 1,335 (58.3%) 1,701 3,365 (49.5%)
EBITDA Margin 4.1% 10.4% (630 bps) 3.8% 7.8% (400 bps)
Other Income 114 111 3.2% 979 1,402 (30.2%)
Profit before exceptional items and tax
(530) 337 NM (2,082) 205 NM
Exceptional Item (288) (0) NM (339) (272) NM Profit before Tax (818) 337 NM (2,421) (67) NM Net Profit (PAT) (829) 398 NM (2,480) (62) NM Basic EPS – Ordinary Shares (2.44) 1.16 (7.30) (0.18)
Basic EPS- ‘A’ Ordinary shares (2.44) 1.26 (7.30) (0.18)
Gross Debt 19,574 16,461 19,574 16,461
Net Debt 16,887 13,927 16,887 13,927
Net Debt / Equity 0.81 0.60 0.81 0.60
Inventory Days 33 33 41 39
Receivable Days 13 13 16 16
# EBITDA is calculated on Revenue net of Excise duty
* Excludes Other Income;
EPS reported in the table above for the quarter is not annualized;
Joint Operations included in Standalone financials are Tata Cummins Private Ltd and Fiat India Automobile Private
Limited.
Standalone (including JO)(Rs. Crores) Q4 FY17 Q3 FY17 Q2 FY17 Q1 FY17
Net Revenue* 13,621 10,152 10,311 10,393
EBITDA 556 139 336 670
EBITDA Margin 4.1% 1.4% 3.3% 6.4%
EBIT (331) (573) (307) 466
EBIT Margin (2.4%) (5.6%) (3.0%) 4.5%
*During Q4 FY17, the Company reviewed the presentation of foreign exchange in the income statement due to continued increase in
hedging activity and volatility in FX rates. Accordingly, it was considered appropriate to present realized foreign exchange relating
to the hedging of revenue & cost exposures as an adjustment to revenue and material cost of sales for Q4 FY 17 and FY 17.The prior
period comparatives have also been represented on this basis. There is no impact upon the reported operating profit, profit before
tax and profit after tax or reported equity in either of the financial years or quarters due to change in presentation of foreign
exchange impact.

15
B] TATA MOTORS GROUP STANDALONE BUSINESS (including Joint Operations) AS PER INDAS
FINANCIALS IN USD MILLIONS
USD Million@ Q4 FY17 Q4 FY16 Y-o-Y
change FY17 FY16
Y-o-Y change
Total Volumes: A+B+C(Units) 151,606 144,507 4.9% 545,416 511,931 6.5%
CV (Units)- A 94,468 98,620 (4.2%) 324,175 326,755 (0.8%)
PC (Units)- B 41,485 28,752 44.3% 157,020 127,118 23.5%
Exports (Units)-C 15,653 17,135 (8.6%) 64,221 58,058 10.6%
Revenue * 2,327 2,182 6.7% 7,571 7,307 3.6%
Revenue(net of excise duty) * 2,100 1,980 6.1% 6,858 6,614 3.7%
EBITDA# 86 206 (69.4%) 262 519 (53.9%)
EBITDA Margin 4.1% 10.4% (630 bps) 3.8% 7.8% (400 bps)
Other Income 18 17 3.2% 151 216 (30.2%)
Profit before exceptional items and tax
(82) 52 NM (321) 32 NM
Exceptional Item (44) (0) NM (52) (42) NM
Profit before Tax (126) 52 NM (373) (10) NM
Net Profit (PAT) (128) 61 NM (382) (10) NM
Basic EPS – Ordinary Shares (0.38) 0.18
(1.13) (0.03)
Basic EPS-‘A’ Ordinary shares (0.38) 0.19
(1.13) (0.03)
Gross Debt 3,018 2,538
3,018 2,538
Net Debt 2,604 2,148
2,604 2,148
Net Debt / Equity 0.81 0.60
0.81 0.60
Inventory Days 33 33
41 39
Receivable Days 13 13
16 16
# EBITDA is calculated on Revenue net of Excise duty
* Excludes Other Income;
EPS reported in the tables above for the quarter is not annualized;
Joint Operations included in Standalone financials are Tata Cummins Private Ltd. and Fiat India Automobile Private
Limited
@ At conversion rate of USD 1 = 64.8500 INR for reference only

16
C] COMMERCIAL VEHICLES BUSINESS
VOLUMES
Period/ Segments Q4 FY17 Volumes
Q4 FY16 Volumes
Y-o-Y change
FY 17 Volumes
FY 16 Volumes
Y-o-Y change
M/HCV 46,447 47,500 (2.2%) 148,774 157,120 (5.3%)
LCV 48,021 51,120 (6.0%) 175,401 169,635 (3.4%)
Total CV 94,468 98,620 (4.2%) 324,175 326,755 (0.8%)
Note: For the analysis- LCV Includes Ace, Magic and Winger
D] PASSENGER VEHICLES BUSINESS
VOLUMES
Period/ Segments Q4 FY17 Volumes
Q4 FY16 Volumes
Y-o-Y change
FY 17 Volumes
FY 16 Volumes
Y-o-Y change
Micro 877 3,754 (76.6%) 7,591 21,007 (63.9%)
Compact 32,818 19,611 67.3% 128,888 84,472 52.6%
Midsize 0 1 N.A. 0 187 N.A.
Premium/ Luxury 295 444 (33.6%) 696 1161 (40.1%)
Utility Vehicles 7,481 4,765 57.0% 19,600 19,702 (0.5%)
Vans 14 177 (92.1%) 245 589 (58.4%)
Total PC 41,485 28,752 44.3% 157,020 127,118 23.5%
Source: SIAM Industry Data and Company analysis
Note: Volume does not include Fiat Sales, For the analysis - ‘Micro’ comprises of Nano; ‘Compact’ comprises of Indica, Vista, Bolt, Indigo CS, Zest, Tiago &Tigor; ‘Midsize’ comprises of Indigo XL and Manza; ‘Premium/Luxury’ includes Jaguar vehicles sold in India; ‘Utility Vehicles’ comprises of Safari, Sumo, Xenon, Aria, Hexa and Land Rover Vehicles sold in India; ‘Vans’ comprises of Tata Venture
E] EXPORTS
VOLUMES
Period / Segments Q4 FY17 Volumes
Q4 FY16 Volumes
Y-o-Y change
FY 17 Volumes
FY 16 Volumes
Y-o-Y change
Commercial Vehicles 14909 15902 (6.2%) 60184 54052 11.3%
Passenger Vehicles 744 1233 (39.7%) 4037 4006 0.8%
Total Exports 15,653 17,135 (8.6%) 64221 58058 10.6%

17
F] HIGHLIGHTS
COMMERCIAL VEHICLES
• Total CV volumes (including exports), up 1.0 % YOY in FY17
• Exports witnessed growth of 11.3 % YOY in FY17 and crossed the 60k mark in FY17 for the first time.
• In FY 17, the domestic CV industry grew by 3.2%, mainly led by growth in LCV 8%, M&HCV Bus 5.8%.
However, M&HCV truck de-grew by 1%.
• The CV segment of TML de-grew by 0.8% led by de-growth in M&HCV Truck (7.7%) which is offset by
growth in LCV of 7.1% & M&HCV Bus 16.5%.
• M&HCV (Truck) witnessed de-growth due to-
– Weak replacement led demand
– Subdued freight demand from industrial segments, which took a further hit post demonetisation
and
– Lower than expected pre-buying (ahead of the implementation of BS –IV emission norms)
PASSENGER VEHICLES
• Total PV volumes (including exports), up 22.8% YOY in FY17
• Passenger vehicle industry witnessed a growth of 9.6% y-o-y in FY 17, mainly led by growth in Car
segment 4.0% and UV & Van segment by 24.8%.
• Domestic volume of TML in passenger vehicles segment grew by 23.5% in the same period,
outperforming the industry in Car segment with a growth of 28.4%, however UV & Van segment de-
grew by 2.2% .
• Tiago continues to receive strong responses and accolades with around 18 awards in its first year.
G] KEY LAUNCHES & EVENTS IN Q4 FY 17:
• In January 2017, Tata Motors launched the new Tata Xenon Yodha in pick-up segment, in the
presence of its newly appointed brand ambassador, Akshay Kumar. The Xenon Yodha is
characterized by everyday practicality, high levels of performance and lowest operating cost.
• In January 2017, Tata Motors launched its much awaited ‘lifestyle vehicle’ HEXA – a power
packed, feature loaded and adrenaline pumped vehicle, designed for those with an active and
dynamic lifestyle.
• In January 2017, Tata Motors launched Hybrid & Electric buses bagging an order of 25 Hybrid
buses from MMRDA, the delivery to fulfill in Q1FY18.

18
• In February 2017, Tata Motors introduced its future mobility solutions, TAMO. As a core element
of its transformation journey ‘FutuReady’, Tata Motors presented its new Passenger Vehicle
strategy and introduced its new sub-brand – TAMO. It will act as an incubating center of
innovation towards new technologies, business models and partnerships in order to define future
mobility solutions.
• In February 2017, Tata Motors launched its World Smart Truck- Tata Prima, in the Kingdom of
Saudi Arabia
• In February 2017, Tata Motors collaborated with Microsoft to redefine connected experience for
automobile users.
• In March 2017, Tata Motors signed Memorandum of Understanding (MoU) with Volkswagen Group
and Skoda for exploring Joint Development projects.
• In March 2017, Tata Motors successfully organized Season 4 of “T1 Prima Truck Racing
Championship 2017” which included the addition of European ETRC drivers to the current BTRA
drivers and unveiled a 1000 bhp racing truck.
• In March 2017, Tata Motors announced the commercial launch of its new ‘StyleBack’, Tata
TIGOR, meant for the young and fast-paced generation. With its stunning, break-free and
revolutionary design, the Tata TIGOR is set to build on Tata Motors’ existing passenger vehicle
portfolio and address needs of the ever evolving customer.
• In March 2017, Tata Motors announced Joint Venture with Jayem Automotive for special
performance vehicles.

19
H] WAY FORWARD
COMMERCIAL VEHCLES
PASSENGER VEHICLES
20
V] [A] TATA MOTORS GROUP -JAGUAR LAND ROVER AUTOMOTIVE PLC
JLR VOLUMES
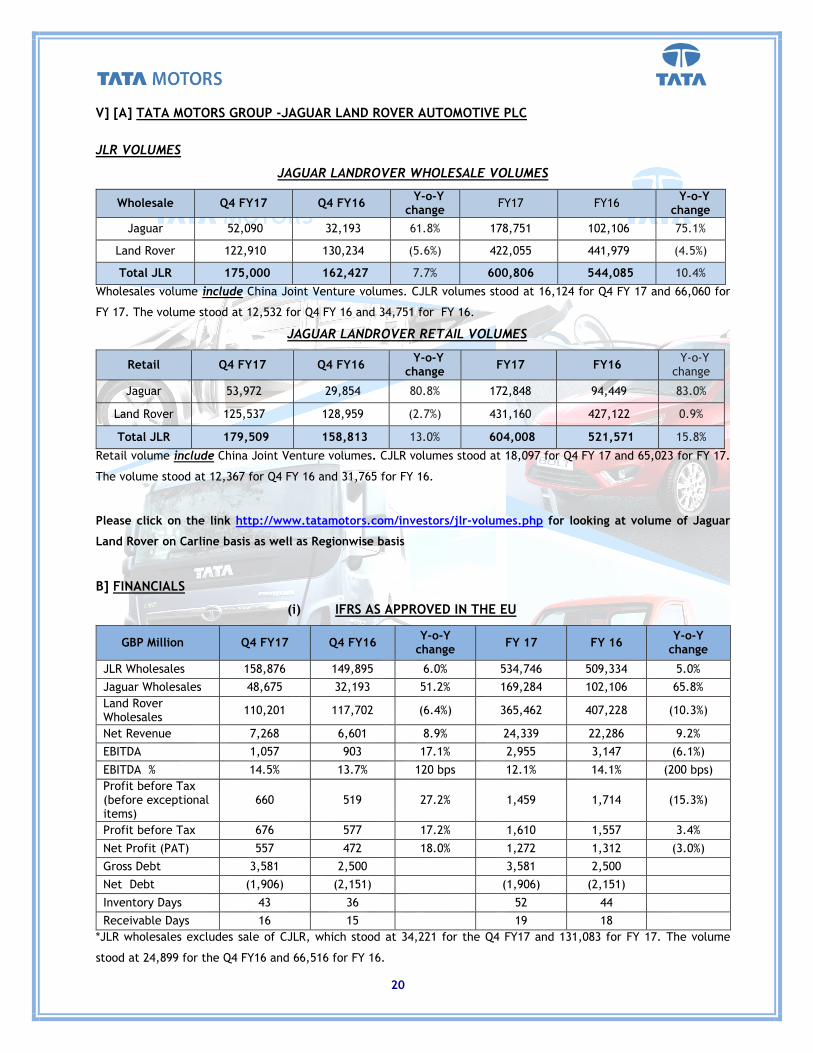
JAGUAR LANDROVER WHOLESALE VOLUMES
Wholesale Q4 FY17 Q4 FY16 Y-o-Y change
FY17 FY16 Y-o-Y change
Jaguar 52,090 32,193 61.8% 178,751 102,106 75.1%
Land Rover 122,910 130,234 (5.6%) 422,055 441,979 (4.5%)
Total JLR 175,000 162,427 7.7% 600,806 544,085 10.4%
Wholesales volume include China Joint Venture volumes. CJLR volumes stood at 16,124 for Q4 FY 17 and 66,060 for
FY 17. The volume stood at 12,532 for Q4 FY 16 and 34,751 for FY 16.
JAGUAR LANDROVER RETAIL VOLUMES
Retail Q4 FY17 Q4 FY16 Y-o-Y change
FY17 FY16 Y-o-Y change
Jaguar 53,972 29,854 80.8% 172,848 94,449 83.0%
Land Rover 125,537 128,959 (2.7%) 431,160 427,122 0.9%
Total JLR 179,509 158,813 13.0% 604,008 521,571 15.8%
Retail volume include China Joint Venture volumes. CJLR volumes stood at 18,097 for Q4 FY 17 and 65,023 for FY 17.
The volume stood at 12,367 for Q4 FY 16 and 31,765 for FY 16.
Please click on the link http://www.tatamotors.com/investors/jlr-volumes.php for looking at volume of Jaguar
Land Rover on Carline basis as well as Regionwise basis
B] FINANCIALS
(i) IFRS AS APPROVED IN THE EU
GBP Million Q4 FY17 Q4 FY16 Y-o-Y
change FY 17 FY 16
Y-o-Y change
JLR Wholesales 158,876 149,895 6.0% 534,746 509,334 5.0%
Jaguar Wholesales 48,675 32,193 51.2% 169,284 102,106 65.8%
Land Rover Wholesales
110,201 117,702 (6.4%) 365,462 407,228 (10.3%)
Net Revenue 7,268 6,601 8.9% 24,339 22,286 9.2%
EBITDA 1,057 903 17.1% 2,955 3,147 (6.1%)
EBITDA % 14.5% 13.7% 120 bps 12.1% 14.1% (200 bps)
Profit before Tax (before exceptional items)
660 519 27.2% 1,459 1,714 (15.3%)
Profit before Tax 676 577 17.2% 1,610 1,557 3.4%
Net Profit (PAT) 557 472 18.0% 1,272 1,312 (3.0%)
Gross Debt 3,581 2,500
3,581 2,500
Net Debt (1,906) (2,151)
(1,906) (2,151)
Inventory Days 43 36
52 44
Receivable Days 16 15
19 18
*JLR wholesales excludes sale of CJLR, which stood at 34,221 for the Q4 FY17 and 131,083 for FY 17. The volume
stood at 24,899 for the Q4 FY16 and 66,516 for FY 16.
21
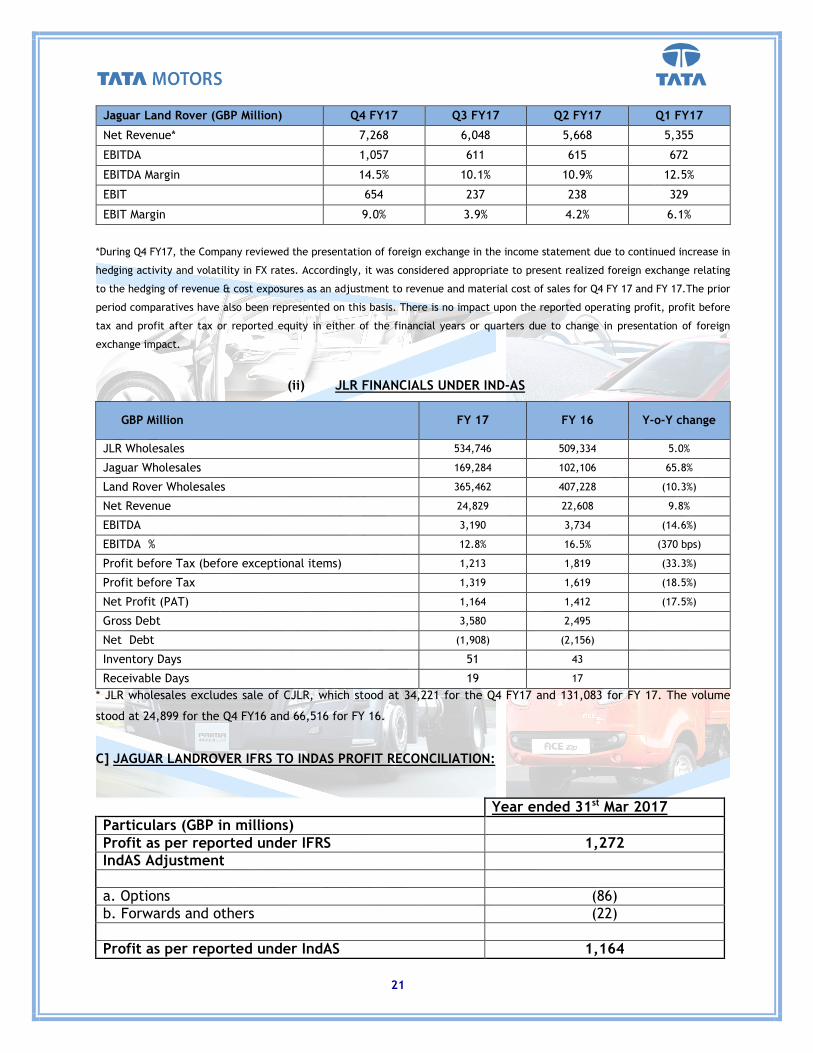
Jaguar Land Rover (GBP Million) Q4 FY17 Q3 FY17 Q2 FY17 Q1 FY17
Net Revenue* 7,268 6,048 5,668 5,355
EBITDA 1,057 611 615 672
EBITDA Margin 14.5% 10.1% 10.9% 12.5%
EBIT 654 237 238 329
EBIT Margin 9.0% 3.9% 4.2% 6.1%
*During Q4 FY17, the Company reviewed the presentation of foreign exchange in the income statement due to continued increase in
hedging activity and volatility in FX rates. Accordingly, it was considered appropriate to present realized foreign exchange relating
to the hedging of revenue & cost exposures as an adjustment to revenue and material cost of sales for Q4 FY 17 and FY 17.The prior
period comparatives have also been represented on this basis. There is no impact upon the reported operating profit, profit before
tax and profit after tax or reported equity in either of the financial years or quarters due to change in presentation of foreign
exchange impact.
(ii) JLR FINANCIALS UNDER IND-AS
GBP Million FY 17 FY 16 Y-o-Y change
JLR Wholesales 534,746 509,334 5.0%
Jaguar Wholesales 169,284 102,106 65.8%
Land Rover Wholesales 365,462 407,228 (10.3%)
Net Revenue 24,829 22,608 9.8%
EBITDA 3,190 3,734 (14.6%)
EBITDA % 12.8% 16.5% (370 bps)
Profit before Tax (before exceptional items) 1,213 1,819 (33.3%)
Profit before Tax 1,319 1,619 (18.5%)
Net Profit (PAT) 1,164 1,412 (17.5%)
Gross Debt 3,580 2,495
Net Debt (1,908) (2,156)
Inventory Days 51 43
Receivable Days 19 17
* JLR wholesales excludes sale of CJLR, which stood at 34,221 for the Q4 FY17 and 131,083 for FY 17. The volume
stood at 24,899 for the Q4 FY16 and 66,516 for FY 16.
C] JAGUAR LANDROVER IFRS TO INDAS PROFIT RECONCILIATION:
Year ended 31st Mar 2017
Particulars (GBP in millions) Profit as per reported under IFRS 1,272
IndAS Adjustment a. Options (86)
b. Forwards and others (22)
Profit as per reported under IndAS 1,164

22
D] JLR HIGHLIGHTS
• Wholesale and Retail volumes (excluding CJLR) for FY 17 stood at 534,746 units and 538,985 units,
respectively. CJLR wholesale and retail volumes stood at 66,060 and 65,023 unit.
• Q4 FY 17-Strongest quarter to end the year-EBITDA, EBIT, PBT & PAT significantly up as compared
to Q1, Q2 & Q3 FY 17
• New Discovery sales started in Q4 FY 17
• Net Cash as on 31st March 2017 was £ 1,906 mn.
E] TATA MOTORS GROUP- JAGUAR LANDROVER –OTHER DEVELOPEMENTS
23
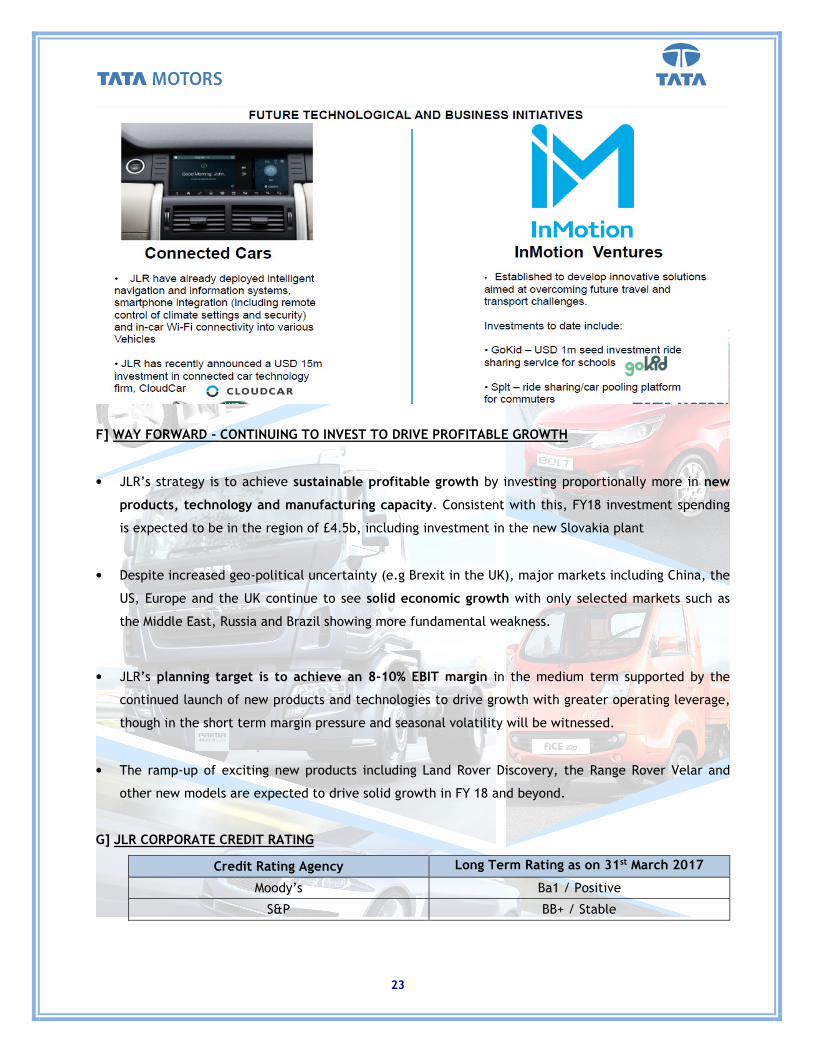
F] WAY FORWARD - CONTINUING TO INVEST TO DRIVE PROFITABLE GROWTH
• JLR’s strategy is to achieve sustainable profitable growth by investing proportionally more in new
products, technology and manufacturing capacity. Consistent with this, FY18 investment spending
is expected to be in the region of £4.5b, including investment in the new Slovakia plant
• Despite increased geo-political uncertainty (e.g Brexit in the UK), major markets including China, the
US, Europe and the UK continue to see solid economic growth with only selected markets such as
the Middle East, Russia and Brazil showing more fundamental weakness.
• JLR’s planning target is to achieve an 8-10% EBIT margin in the medium term supported by the
continued launch of new products and technologies to drive growth with greater operating leverage,
though in the short term margin pressure and seasonal volatility will be witnessed.
• The ramp-up of exciting new products including Land Rover Discovery, the Range Rover Velar and
other new models are expected to drive solid growth in FY 18 and beyond.
G] JLR CORPORATE CREDIT RATING
Credit Rating Agency Long Term Rating as on 31st March 2017
Moody’s Ba1 / Positive
S&P BB+ / Stable

24
VI] HIGHLIGHTS OF OTHER KEY SUBSIDIARIES
A] TATA MOTORS FINANCE (On a Consolidated basis)
Rs. Crores
Particulars Q4 FY17 Q4 FY16 Y-o-Y
change FY17 FY16
Y-o-Y change
Net Revenue * 617.3 833.5 (25.9%) 2,721.4 3,228.5 (15.7%)
PAT (1,191.5) 53.5 NM (1,182.3) 267.0 NM
*Include Other Income
HIGHLIGHTS
� Finance disbursed during Q4 FY17 and FY17 stood at Rs. 2,720 Cr. and Rs. 9,298 Cr., respectively
� The book size as on March 31, 2017 for TMFL stood at Rs 21,984 Cr.
� In Q4 FY17 market share stood at 20.4% (on a non- consolidated basis)
� NIM of vehicle financing business for Q4 FY 17 was 4.6% and for FY17 was 5.08%
B] TATA TECHNOLOGIES
Rs. Crores
Particulars Q4 FY17 Q4 FY16 Y-o-Y
change FY17 FY16 Y-o-Y change
Net Revenue * 747.0 714.0 4.6% 2,802.0 2,683.4 4.4%
EBITDA * 158.0 136.3 15.9% 491.7 499.7 (1.6%)
% of Revenue 21.1% 19.1% 200 bps 17.5% 18.6% (110 bps)
PAT 122.4 109.1 12.2% 353.6 383.6 (7.8%)
*Excludes ‘Other Income’
Revenue Break – For FY17:
Highlights: The revenue for the quarter grew by 4.6% and the revenue for FY17 grew by 4.4%

25
C] TATA DAEWOO (As per Korean GAAP)
KRW Billion
Particulars Q4 FY17 Q4 FY16 Y-o-Y change
FY17 FY16 Y-o-Y change
Sales (Units) 2,525 2,202 14.7% 10,317 9,116 13.2%
Net Revenue * 258.4 237.6 8.8% 1,031.8 879.7 17.3%
EBITDA * 43.5 31.7 36.9% 86.9 79.1 9.9%
% of Revenue 16.8% 13.4% 340 bps 8.4% 9.0% (60 bps)
PAT 32.7 7.9 312.6% 50.3 45.6 10.3%
* Excludes ‘Other Income’
HIGHLIGHTS
� Y-o-y improved owing to strong domestic performance, which can be seen in revenue, EBITDA
and PAT.
D] TML DRIVELINES LTD (as per Indian AS)
Rs. Crores
Particulars Q4 FY17 Q4 FY16 Y-o-Y
change FY17 FY16
Y-o-Y change
Net Revenue * 145.2 148.4 (2.2%) 524.0 545.8 (4.0%)
EBITDA * 32.4 42.6 (23.8%) 103.6 130.6 (20.7%)
% of Revenue 22.3% 28.7% (640 bps) 19.8% 23.9% (410 bps)
PAT 23.9 27.9 (14.5%) 50.4 68.6 (26.4%)
* Excludes ‘Other Income’
HIGHLIGHTS
� De-growth in the MHCV business lead to drop in revenue and profitability.

26
VII] SHAREHOLDING PATTERN
Shareholding Pattern as on March 31, 2017
Ordinary Shares %
Tata Companies 34.73
Indian Financial Institutions / MFs / Banks 15.27
ADR/GDR Holders / Foreign holders–DR status 18.37
Foreign Institutional Investors 23.24
Others 8.39
Total 100%
‘A’ Ordinary Shares %
Tata Companies 0.10
Indian Financial Institutions / MFs / Banks 29.34
Foreign Institutional Investors 55.30
Others 15.26
Total 100%
Market Capitalization as on 31st March 2017 stood at Rs. 1,488.81 bn ($22.96 bn)
Disclaimers & statements
Statements in this presentation describing the objectives, projections, estimates and expectations of the Company i.e. Tata Motors Ltd and its direct and indirect subsidiaries and its associates may be “forward looking statements” within the meaning of applicable securities laws and regulations. Actual results could differ materially from those expressed or implied. Important factors that could make a difference to the Company’s operations include, among others, economic conditions affecting demand / supply and price conditions in the domestic and overseas markets in which the Company operates, changes in Government regulations, tax laws and other statutes and incidental factors. Q4 FY17 represents the period from 1st January 2017 to 31st March 2017. Q4 FY16 represents the period from 1st January 2016 to 31st March 2016. FY17 represents the period from 1st April 2016 to 31st March 2017. FY16 represents the period from 1st April 2015 to 31st March 2016. JLR Financials contained in the review are as per IFRS as approved in the EU as well as in IndAS, Unaudited. All other subsidiaries’ financials are in IndAS except TDCV (which is in Korean GAAP) and TMF (which is in IGAAP).


![Q2 FY 16 BUSINESS REVIEW - Amazon Web Servicescorp-content.tatamotors.com.s3-ap-southeast-1.amazonaws.com/w… · 4 II] INDIAN ECONOMIC SCENARIO: KEY HIGHLIGHTS OF Q2 FY16 Source:](https://static.fdocuments.in/doc/165x107/6041bd45d9bad90873554b1c/q2-fy-16-business-review-amazon-web-servicescorp-4-ii-indian-economic-scenario.jpg)