Business Results for Full Fiscal Year Ended …...Motorcycle Business: India Actively expanding...
25
Business Results for Full Fiscal Year Ended December 31, 2016 Business Information Session YAMAHA MOTOR CO., Ltd. February 9, 2017 (Ticker symbol: 7272) TMAX
Transcript of Business Results for Full Fiscal Year Ended …...Motorcycle Business: India Actively expanding...

Business Results for Full Fiscal Year Ended December 31, 2016
Business Information Session
YAMAHA MOTOR CO., Ltd.February 9, 2017
(Ticker symbol: 7272)
TMAX
● Regarding the Forecast Consolidated ResultsForecast consolidated results stated herein are based on the management's assumptions and beliefs in light of information currently available, and involve risks and uncertainties. Please be advised that actual results may differ significantly from those discussed in the forecast consolidated results. Potential risks and uncertainties include, but are not limited to, general economic conditions in Yamaha Motor’s major markets, changing consumer preferences and currency exchange rate fluctuations.
FY2016 Business Results
President, CEO and Representative Director
Hiroyuki Yanagi
Agenda

Key Points Regarding 2016 and 2017
■ Product CompetitivenessDeveloping and launching new products which show off the uniqueness of our brand identity for markets where customers are diversifying and demanding higher-quality models.2016: 80 models, 2017: 110 models, 2018: 90 models (cumulative total: 280 models)
- Net sales (vs. previous year):- Operating income (vs. previous year):- Net Income (vs. previous year):
2016 201792% (102%) 106%83% (117%) 111%105% 119%
■ Business ResultsProfitability improvements advanced, with stable income level maintained.
■ ROE and CF ResultsROE moves towards 15%, and working capital efficiency improves further.
-ROE:-CF (¥ Bil.)
2015 2016 201712.6% 12.3% 13.5%-39.3 +72.2 +24.0
* vs. previous year excluding foreign exchange effects
*
3

Business Results: 2016
Net Sales: 92% (102%) vs. previous yearOperating Income: 83% (117%) vs. previous year. Stable level was secured.Net Income: 105% vs. previous year
(¥ Bil.) 2015 2016 Vs. Previous Year
Net Sales 1,631.2 1,502.8 92%Operating Income 130.3 108.6 83%Operating Income
Ratio 8.0% 7.2% -0.8pts.
Ordinary Income 125.2 102.1 82%
Net Income 60.0 63.2 105%
($•€) 121 / 134 109 / 120 –
($/IDR・BR$) 13,400 / 3.3 13,300 / 3.5 –
*1 Vs. previous year excluding foreign exchange effects, *2 Previous year’s results: After sales finance conversion, *3 Net income attributable to parent company shareholders
*3
*2
*1
4

Business Results: 2017 Forecast
(¥ Bil.) 2016 2017 Vs. Previous Year
Net Sales 1,502.8 1,600.0 106%
Operating Income 108.6 120.0 111%
Operating Income Ratio 7.2% 7.5% +0.3 pts.
Ordinary Income 102.1 120.0 118%
Net Income 63.2 75.0 119%
($•€) 109 / 120 110 / 115 –
($/IDR・BR$) 13,300 / 3.5 13,200 / 3.2 –
- Net Sales: 106% vs. previous year- Operating Income: 111% vs. previous year. Stable level maintained.- Net Income: 119% vs. previous year
5

130.336.5 -43.8
-14.4
△1,086
108.6 28.7-1.5 -15.8 120.0
Profitability improvements maintained in developed markets and emerging markets.
Business Results: Factors Impacting Operating Income
Scale/Profitability
Exchange Effects
Increased Expenses etc.
Increased Expenses etc.Scale/
Profitability
Exchange Effects
*Growth Strategy Expenses Totals of2015, 5.0 ¥ Bil.2016, 10.0 ¥ Bil.2017, 12.0 ¥ Bil.
60.0 63.2
Net Income
75.0
2015Results
2016Results
2017Forecasts
(¥ Bil.)
6

459.7490.8
534.2
580.0
Net Income Ratio
Total Asset Turnover Equity (¥ Bil.), Equity Ratio
ROE
ROE
Aiming for equity of over 500.0 billion yen and ROE = 15% level.
16.2%
12.6%12.3%
13.5%
4.5%
3.7%
4.2%
4.7%
1.24 1.25
1.151.19
2014 2015 2016 2017 2014 2015 2016 2017
35.1%37.6%
40.5%42.2%
7

Cash-In
Cash-Out
CF (excluding Sales Finance)
2015Results
2016Results
-39.3
(¥ Bil.)
2017Forecasts
Through this stable financial platform, we will increase new growth investment and stock dividends.2016: Secure stable profits, working capital efficiency improves further.2017: Prepare for flexible growth investment.
Growth Investment
16.6Stock Dividends
18.2Stock
Dividends
22.0 Stock Dividends
+24.0+72.2
8

Stock Dividends
EPS: 172 yen
5.0%
181 yen
63.2
To a Dividend Payout Ratio of 30% and Increased Dividends for Five Years Running.2016: 60 yen enacted. 2017: 65 yen forecast
75.0
215 yen
44 yen60 yen 65 yen
Dividend Payout Ratio: 26% 33% 30%
Total Dividend for the Year
Net Income(¥ Bil.)60.0
2015Results
2016Results
2017Forecasts
9

270.4 245.9 250.0
762.2684.2 770.0
309.3297.2
300.0
169.5152.3
150.0
119.8123.2
130.0
1.1
38.1 45.853.0
64.0 55.457.0
16.04.5
1.0
11.2
12.714.0
0
100
200
300
400
500
600
700
800
0
1,000
2,000
3,000
4,000
5,000
6,000
7,000
8,000
9,000
10,000 Net Sales Operating Income
Other
Marine
Power Products
Emerging MarketsMotorcycle
Business
Others: Including industrial machinery & robot products
7.2% 7.5%
(¥ Bil.)
8.0%
2016Results
2017Forecasts
2015Results
2016Results
2017Forecasts
2015Results
Developed MarketsMotorcycle
Business
-9.8
Status of Main Businesses
1,631.21,502.8
1,600.0130.3
108.6120.0
-5.0
10
292.6251.7
296.0
113.4113.4
128.0
65.363.6
81.032.3
44.1
50.0
15年 16年 17年
23% 17% 12% 10% 7%
50%51%
48% 48% 48%
9% 21% 24% 25%
27% 23% 19% 18% 20%
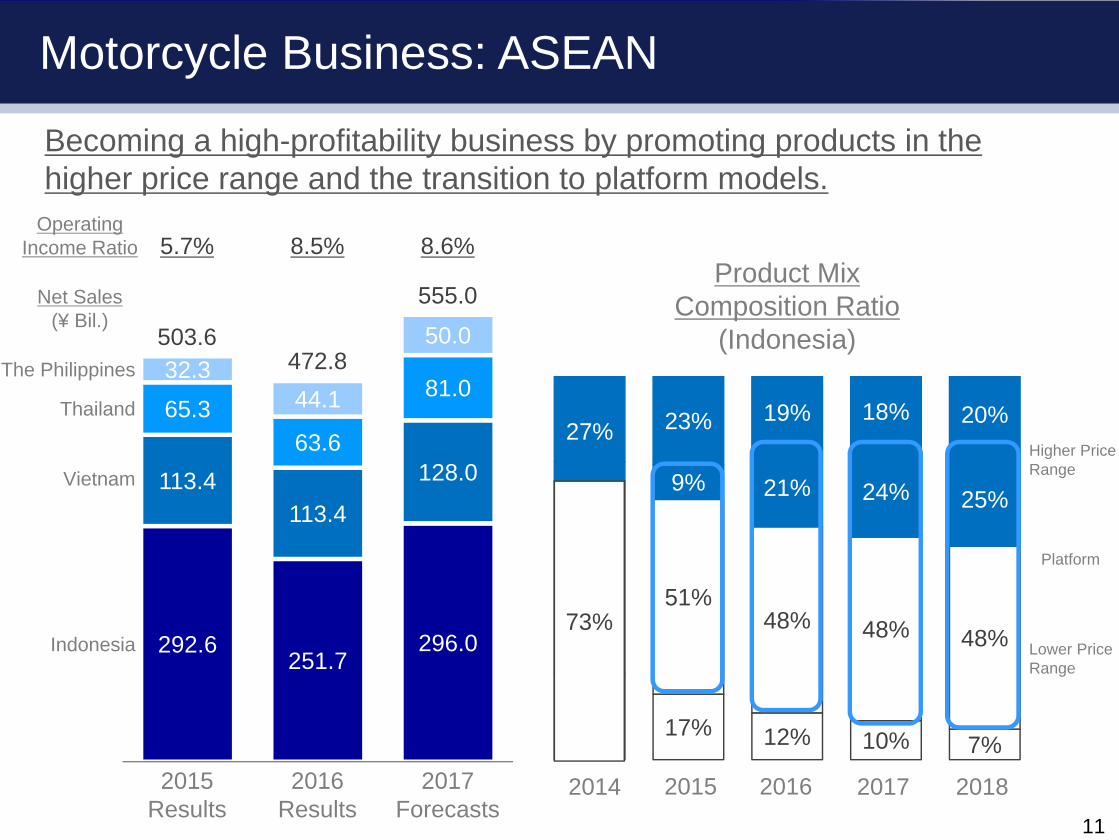
Motorcycle Business: ASEAN
Becoming a high-profitability business by promoting products in the higher price range and the transition to platform models.
Net Sales(¥ Bil.)
Operating Income Ratio
503.6472.8The Philippines
555.0
5.7% 8.5% 8.6%
Vietnam
Thailand
Indonesia
2015Results
2016Results
2017Forecasts
Product Mix Composition Ratio
(Indonesia)
Platform
Higher PriceRange
Lower PriceRange
2014 2015 2016 2017 2018
73%
11
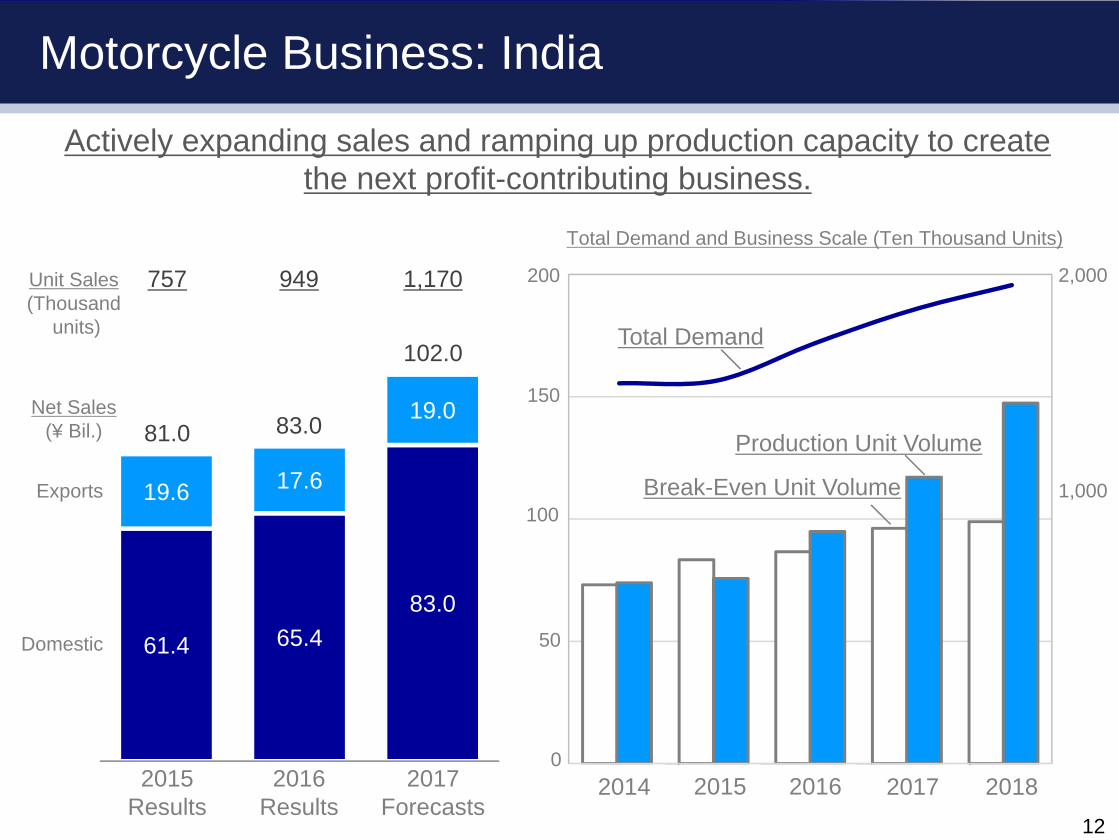
61.4 65.483.0
19.6 17.6
19.0
14年 15年 16年2014 2015 2016 2017 2018
Motorcycle Business: India
Actively expanding sales and ramping up production capacity to create the next profit-contributing business.
81.0
Domestic
Exports
83.0
102.0
Unit Sales(Thousand
units)
Net Sales(¥ Bil.)
757 949 1,170
Break-Even Unit Volume
Production Unit Volume
Total Demand and Business Scale (Ten Thousand Units)
Total Demand
2,000
1,000
2015Results
2016Results
2017Forecasts
150
100
50
200
02014 2015 2016 2017 2018
12

136.2 127.9 130.0
72.355.9 60.0
46.347.0 45.0
15.615.1 15.0
15年 16年 17年0
400
800
1,200
1,600
2,000
2013 2014 2015 2016 2017 2018
13.3%
15.6%16.6% 16.8% 17.0%
Motorcycle Business: Developed Markets
Net Sales(¥ Bil.)
Operating Income Ratio
270.4 245.9
Europe
North America
Oceania
Japan
250.0
0.4% -4.0% -2.0%
Increasing market presence while progressing structural reforms to achieve a stably profitable business.
Total Demand and Market Share(Four regions/50cc and over)
2015Results
2016Results
2017Forecasts
(Thousand units)
2015 2016 2017 20182013 201413

174.6 167.0 170.0
134.8 130.2 130.0
15年 16年 17年
0
20,000
40,000
60,000
80,000
100,000
120,000
140,000
160,000
2010 2011 2012 2013 2014 2015 2016 2017 2018
Marine Products Business
Outboard Motors
Boats/WV etc.
309.3Net Sales(¥ Bil.) 297.2
Operating Income Ratio 20.7% 18.6%
300.0
19.0%
Promoting larger outboard motor models and system supplier strategy to become an even more high-profitability business.
2015Results
2016Results
2017Forecasts
YamahaMotor Sales
(Up to 99HP)
(100HP+)
(200HP+)
Total Demand(100HP and over)
Outboard Motors Total Demand and Yamaha Motor Sales(North American and European Markets, Thousand Units)
160
120
80
40
0
(Thousand units)
14

96.6 87.6 85.0
72.964.7 65.0
15年 16年 17年 2014年 2015年 2016年 2017年 2018年2014年 2015年 2016年 2017年 2018年
Power Products Business
169.5
RV
Net Sales(¥ Bil.)
Other
152.3 150.0
ROV: Returning the business to normal and making an impact in the market with new platform models.
ROV Sales and Production Status(Global Market/Thousand Units)
2627
14
22
18
22
2022Retail unit volume
Production unit volume
2015Results
2016Results
2017Forecasts
1513
2014 2015 2016 2017 2018
Operating Income Ratio 9.4% 3.0% 0.7%
15
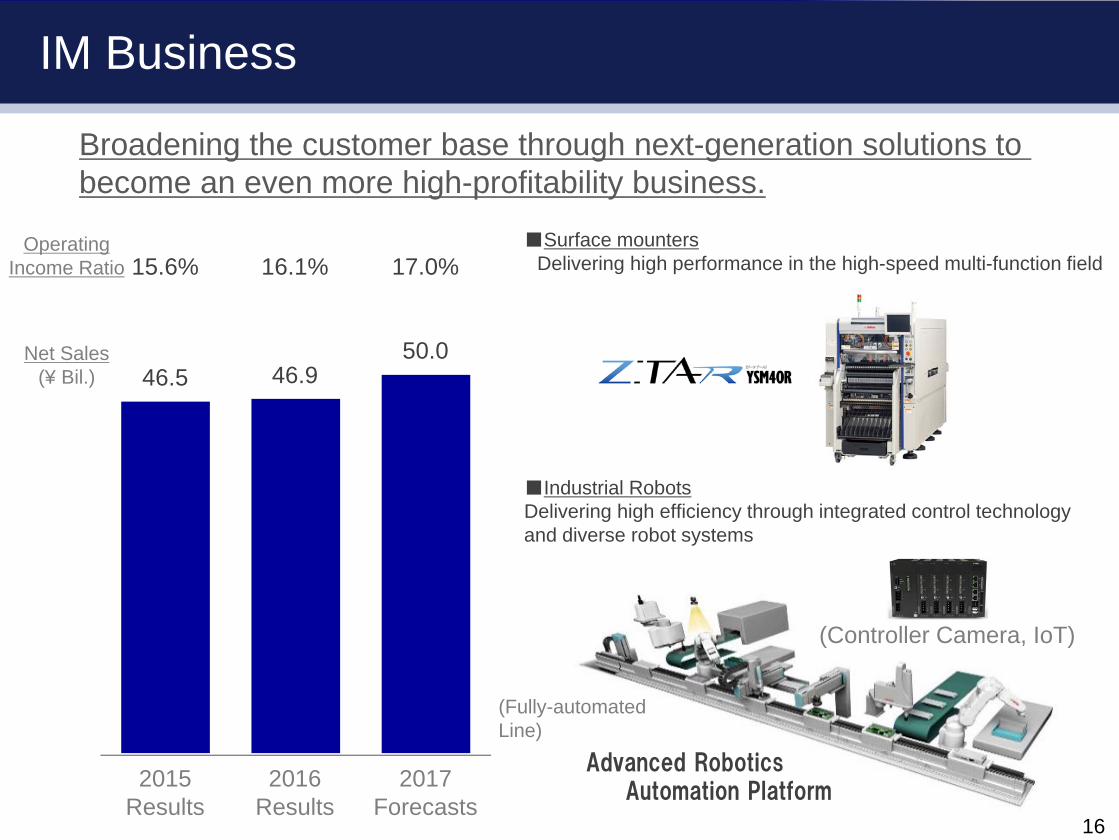
IM Business
15年 16年 17年
46.5 46.950.0
2015Results
2016Results
2017Forecasts
■Surface mountersDelivering high performance in the high-speed multi-function field15.6% 16.1% 17.0%
Net Sales(¥ Bil.)
Operating Income Ratio
Broadening the customer base through next-generation solutions to become an even more high-profitability business.
(Controller Camera, IoT)
(Fully-automated Line)
■Industrial RobotsDelivering high efficiency through integrated control technology and diverse robot systems
Advanced RoboticsAutomation Platform
16

Unit Sales(Thousand
units)
PAS Business
15年 16年 17年
26.4
32.2 33.0
2015Results
2016Results
2017Forecasts
Net Sales(¥ Bil.)
14年 15年 16年 17年 18年
306
356
448470
500+
E-Kit
Completed Vehicles
Operating Income Ratio
2014 2015 2016 2017 2018
Broadening the customer base in global markets to become a high-profitability business.
11.2% 15.6% 16.7%
17
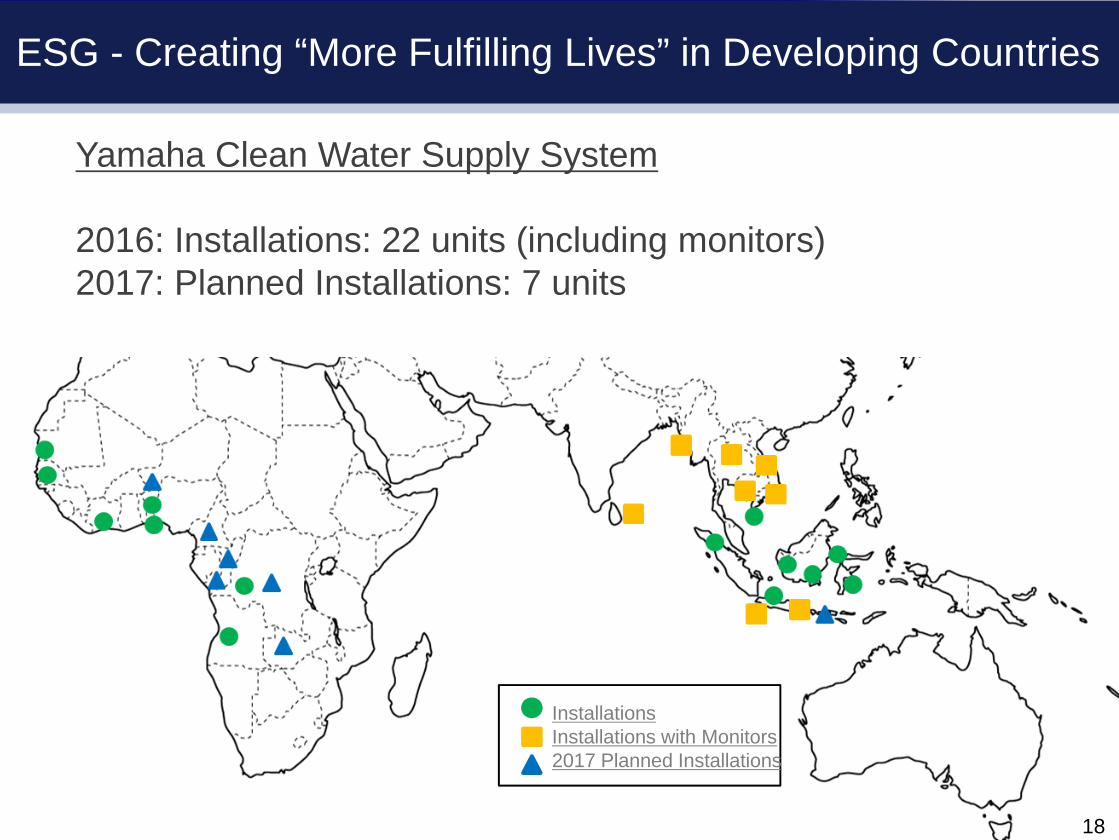
ESG - Creating “More Fulfilling Lives” in Developing Countries
Yamaha Clean Water Supply System
2016: Installations: 22 units (including monitors)2017: Planned Installations: 7 units
InstallationsInstallations with Monitors2017 Planned Installations
18


Total Demand/Company Unit Sales for Major Products
Total Demand(Yamaha Motor Estimate)
2015Results
2016Results
2017Forecasts
Japan 407 373 376North America 559 547 556Europe 1,525 1,576 1,534
Indonesia 6,465 5,557 5,700Thailand 1,677 1,743 1,750India 16,089 17,641 19,000Vietnam 2,849 3,120 3,214Taiwan 706 852 750China 9,080 7,992 7,250Other 4,070 4,822 5,050
Asia Total 40,937 41,728 42,714Brazil 1,208 884 814Other 8,000 6,666 6,874
Other Total 9,209 7,550 7,688Motorcycles Total 52,637 51,774 52,868Outboard Motors 742 717 734ATV 435 412 419
Yamaha Motor Unit Sales
2015Results
2016Results
2017Forecasts
Japan 110 110 100North America 89 77 76Europe 209 208 203
Indonesia 1,799 1,394 1,595Thailand 225 240 288India 595 786 985Vietnam 719 844 926Taiwan 226 254 258China 307 247 269Other 415 540 613
Asia Total 4,286 4,307 4,933Brazil 131 100 102Other 393 353 406
Other Total 524 452 508Motorcycles Total 5,218 5,154 5,820Outboard Motors 300 292 292ATV 55 57 56
(Units: 1,000)
20
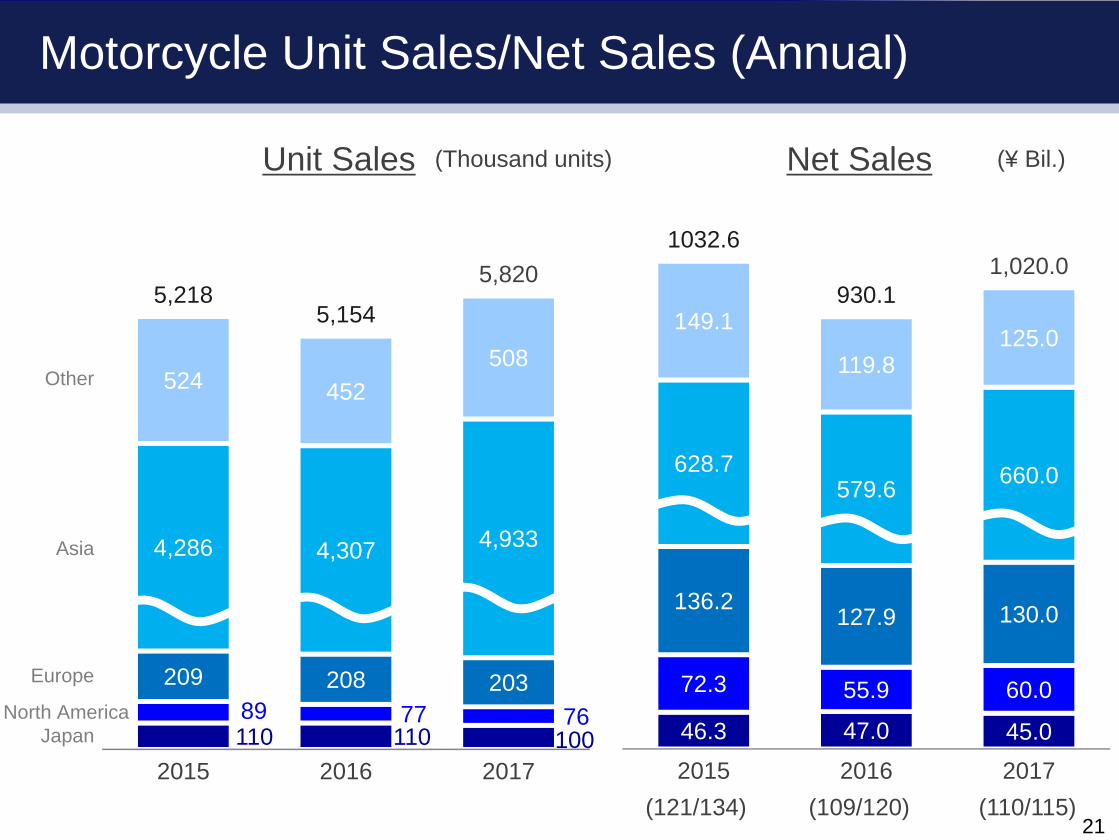
Motorcycle Unit Sales/Net Sales (Annual)
110 110 100 89 77 76
209 208 203
4,286 4,307 4,933
524 452 508
5,2185,154
5,820
2015 2016 2017
46.3 47.0 45.0
72.3 55.9 60.0
136.2127.9 130.0
628.7579.6 660.0
149.1
119.8125.0
1032.6
930.11,020.0
2015 2016 2017
Net SalesUnit Sales (¥ Bil.)
Asia
Europe
North AmericaJapan
Other
(Thousand units)
(109/120)(121/134) (110/115)21
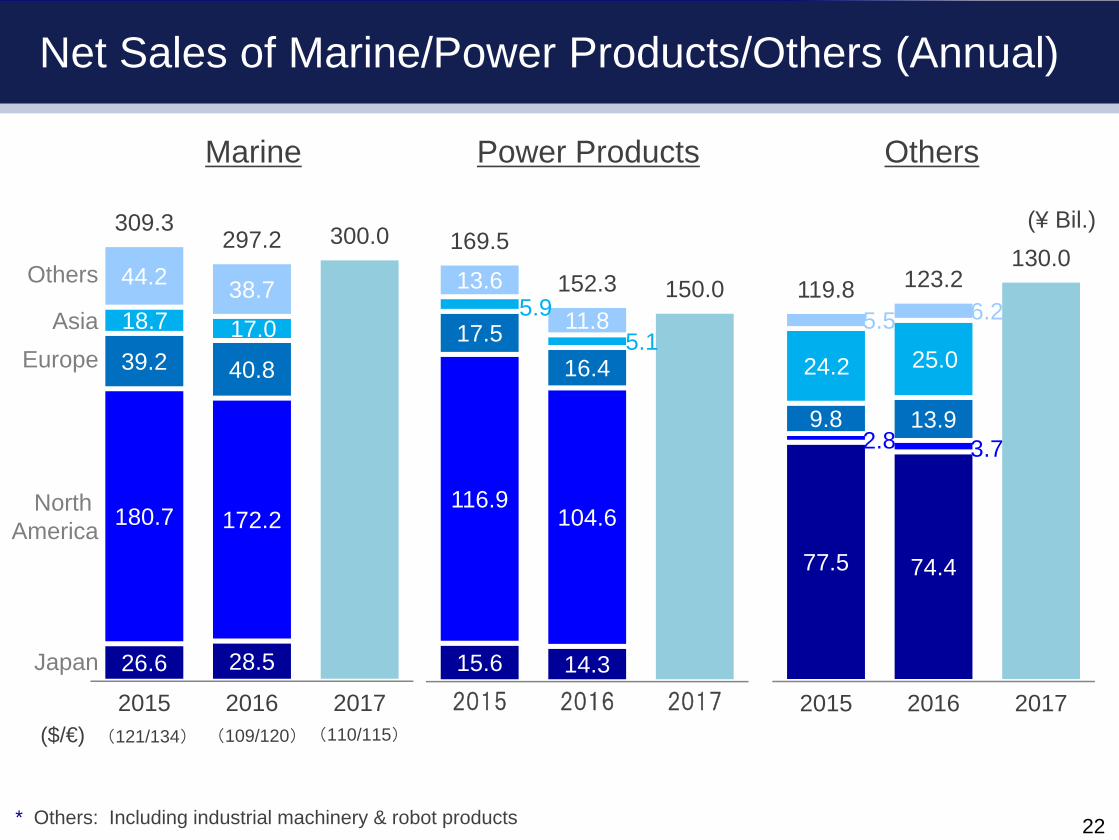
26.6 28.5
180.7 172.2
39.2 40.8
18.7 17.0
44.2 38.7
309.3297.2 300.0
2015 2016 2017
Net Sales of Marine/Power Products/Others (Annual)
(109/120)(121/134) (110/115)
* Others: Including industrial machinery & robot products
AsiaEurope
North America
Japan
Others
Marine Power Products Others
($/€)
15.6 14.3
116.9104.6
17.516.4
5.95.1
13.6
11.8
169.5
152.3 150.0
2015 2016 2017
77.5 74.4
2.8 3.79.8 13.9
24.2 25.05.5 6.2
119.8 123.2130.0
2015 2016 2017
(¥ Bil.)
22
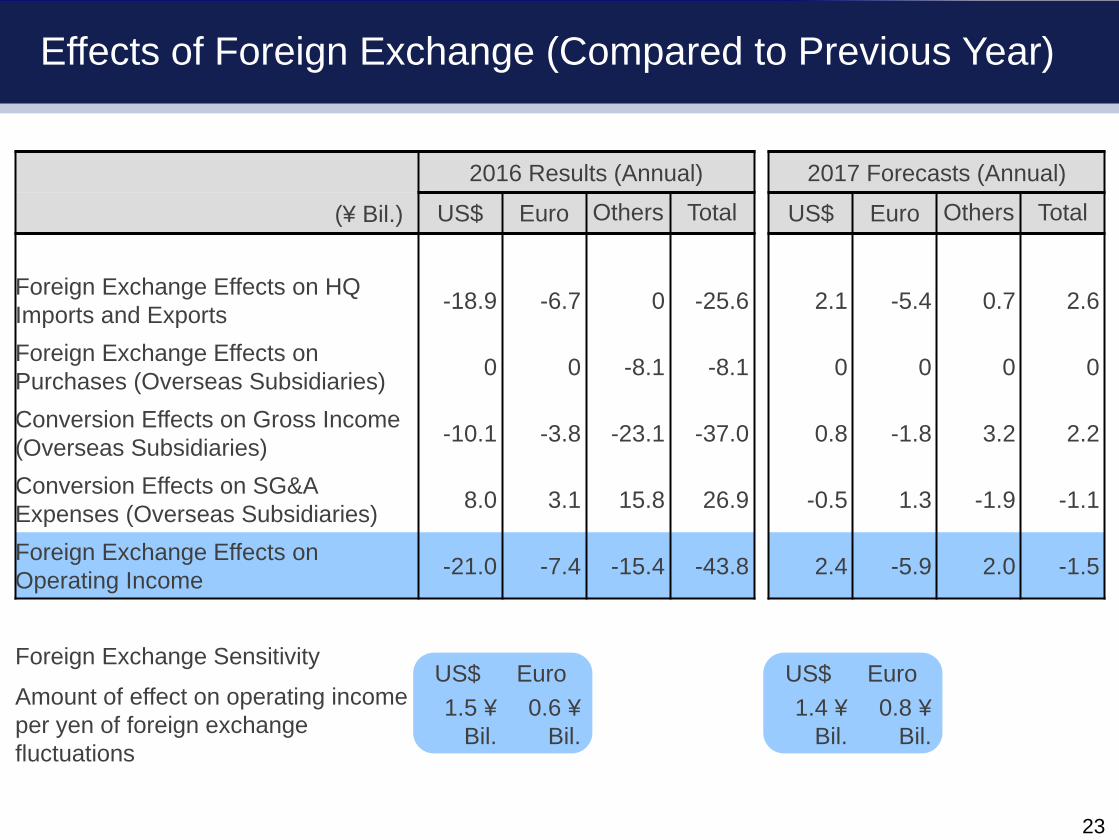
Effects of Foreign Exchange (Compared to Previous Year)
23
2016 Results (Annual) 2017 Forecasts (Annual)
(¥ Bil.) US$ Euro Others Total US$ Euro Others Total
Foreign Exchange Effects on HQ Imports and Exports -18.9 -6.7 0 -25.6 2.1 -5.4 0.7 2.6
Foreign Exchange Effects on Purchases (Overseas Subsidiaries) 0 0 -8.1 -8.1 0 0 0 0
Conversion Effects on Gross Income (Overseas Subsidiaries) -10.1 -3.8 -23.1 -37.0 0.8 -1.8 3.2 2.2
Conversion Effects on SG&A Expenses (Overseas Subsidiaries) 8.0 3.1 15.8 26.9 -0.5 1.3 -1.9 -1.1
Foreign Exchange Effects on Operating Income -21.0 -7.4 -15.4 -43.8 2.4 -5.9 2.0 -1.5
Foreign Exchange Sensitivity
Amount of effect on operating income per yen of foreign exchange fluctuations
US$1.5 ¥
Bil.
Euro0.6 ¥
Bil.
US$1.4 ¥
Bil.
Euro0.8 ¥
Bil.
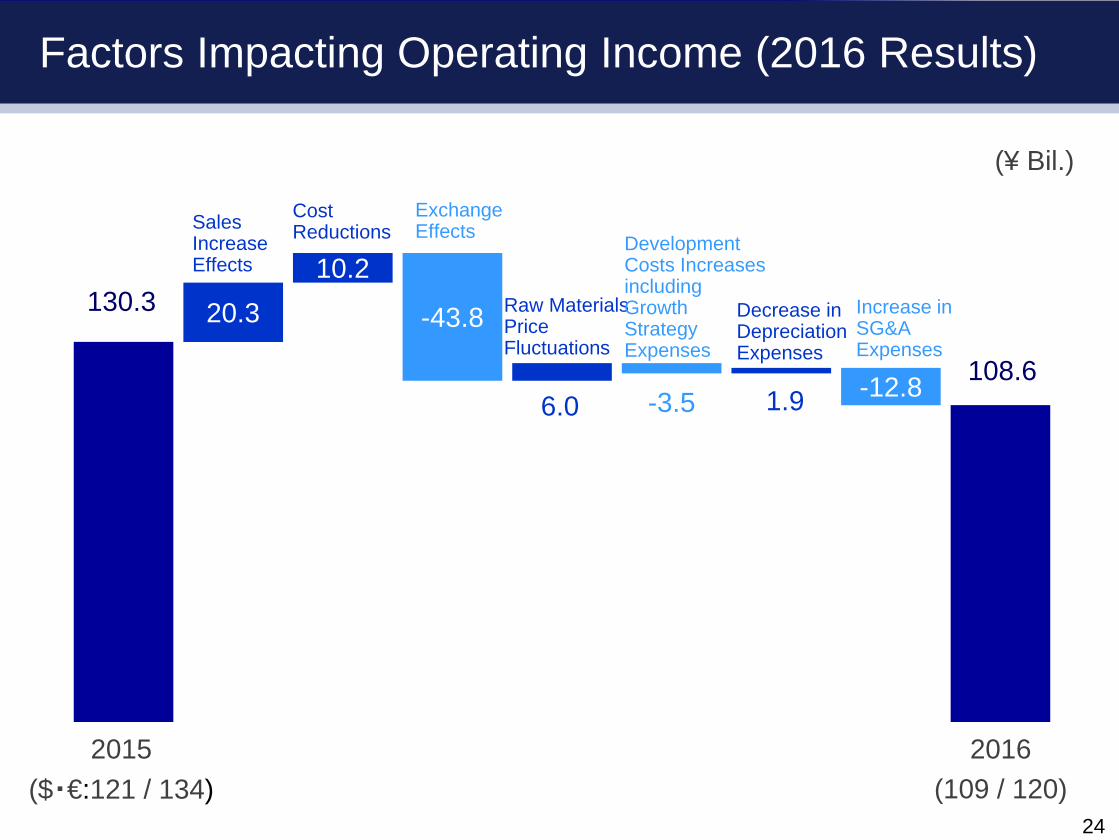
130.3 20.310.2
-43.8
6.0 -3.5 1.9 -12.8 108.6
Factors Impacting Operating Income (2016 Results)
Cost Reductions
Increase in SG&A Expenses
Sales Increase Effects
Exchange Effects
Raw Materials Price Fluctuations
Decrease in Depreciation Expenses
Development Costs Increases including Growth Strategy Expenses
2015($・€:121 / 134)
2016(109 / 120)
(¥ Bil.)
24

108.6 19.310.3 -1.5 -0.9 -2.1 -3.6 -10.1 120.0
Factors Impacting Operating Income (2017 Forecasts)
Cost Reductions Increase in
SG&A Expenses
Sales Increase Effects
Exchange Effects
Raw Materials Price Fluctuations
Increase in Depreciation Expenses
Development Costs Increases including Growth Strategy Expenses
2016($・€:109 / 120)
2017(110 / 115)
(¥ Bil.)
25