Business Report April, 2016 to September, 2016 (Q2 of FY...
62
Business Report April, 2016 to September, 2016 (Q2 of FY ending March 31, 2017) Wacom Co., Ltd. (TSE Sec.1 6727)
Transcript of Business Report April, 2016 to September, 2016 (Q2 of FY...

Business ReportApril, 2016 to September, 2016
(Q2 of FY ending March 31, 2017)
Wacom Co., Ltd.
(TSE Sec.1 6727)

All Rights Reserved. Copyright © 2016 Wacom Co., Ltd. 2
Contents Index3-4 Q2 FY 03/2017 (Apr. to Sep. 2016) Results Overview5-7 Consolidated P/L, Operating Expenses Comparison8 Operating Expenses Comparison9-10 Business Segment Sales/Profit Comparison 11-18 Business Highlights19-21 Sales by Product Line22-24 Sales by Region, Sales Changes for Local Currencies25-26 Consolidated B/S, C/F27-29 FY 03/2017 Business Strategies30-49 FY 03/2017 Financial Forecast (vs. previous forecast)50-51 Shareholders Return Policy for FY 03/201752-57 FY 03/2017 Financial Forecast (vs. previous fiscal year)58-59 Wacom Strategic Business Plan SBP-201960-61 Our Branding62 Disclaimer

All Rights Reserved. Copyright © 2016 Wacom Co., Ltd. 3
Q2 FY 03/17 (Apr. to Sep. 2016) Results OverviewOperating environment Global economic recovery plateaued on growing uncertainties such as a slowdown in China, a
sluggish Japanese recovery, and the UK’s exit from the EU. The yen strengthened against US dollar and euro from the end of last year and further strengthened
during the first quarter. Yen appreciation also progressed against emerging currencies such as the renminbi.
In addition to the penetration of mobile products, cloud computing and SNS, the emergence of new fields such as IoT and VR in the IT industry is causing major changes in our business environment.
Performance overview Consolidated net sales fell below the previous comparable fiscal period, due to the strong yen and
decreased sales in the Brand Business segment during product lifecycle transitions. We posted an operating loss and a net loss due to depreciation and subcontractor expenses associated with global IT infrastructure, and higher R&D expenses for new products.
Sales in the Brand Business segment fell below the previous comparable fiscal period. Creative Business shipments increased in unit base but overall sales decreased due to the strong yen, changes in the product mix, and transitions to new models. Consumer Business and Business Solution segments also struggled due to foreign exchange rates and changes in the market environment.
Sales in the Technology Solution Business fell below the previous comparable fiscal period mainly due to the strong yen and the discontinuation of the Turkish government project. Despite strong shipments for the new Galaxy Note 7 smartphone in Q2, concerns triggered by quality control issues were widespread after September.
.

All Rights Reserved. Copyright © 2016 Wacom Co., Ltd. 4
Q2 FY 03/17 (Apr. to Sep. 2016) Results Overview
Average Forex rate Q2 FY 03/17 YOY Change
1 USD 106.43 JPY -12.4% (Strong JPY)
1 EUR 119.12 JPY -11.5% (Strong JPY)
Business Performance Q2 FY 03/17 YOY Change
Net Sales 33.80 bn -13.2%
Operating Income -0.90 bn -- ( Prev. Q2: 2.05 bn )
Ordinary Income -1.02 bn -- ( 2.10 bn )
Net Profit aft. Tax -1.23 bn -- ( 1.26 bn )
Financial Indices Q2 FY 03/17 Q2 FY 03/2016
EPS -7.48 JPY 7.62 JPY
BPS (Book Value per Share) 150.42 JPY 187.16 JPY
Financial Summary (JPY)
(For reference)
(Note) Net Profit is equivalent to net profit attributable to shareholders of Wacom Co., Ltd.
All Rights Reserved. Copyright © 2016 Wacom Co., Ltd. 5
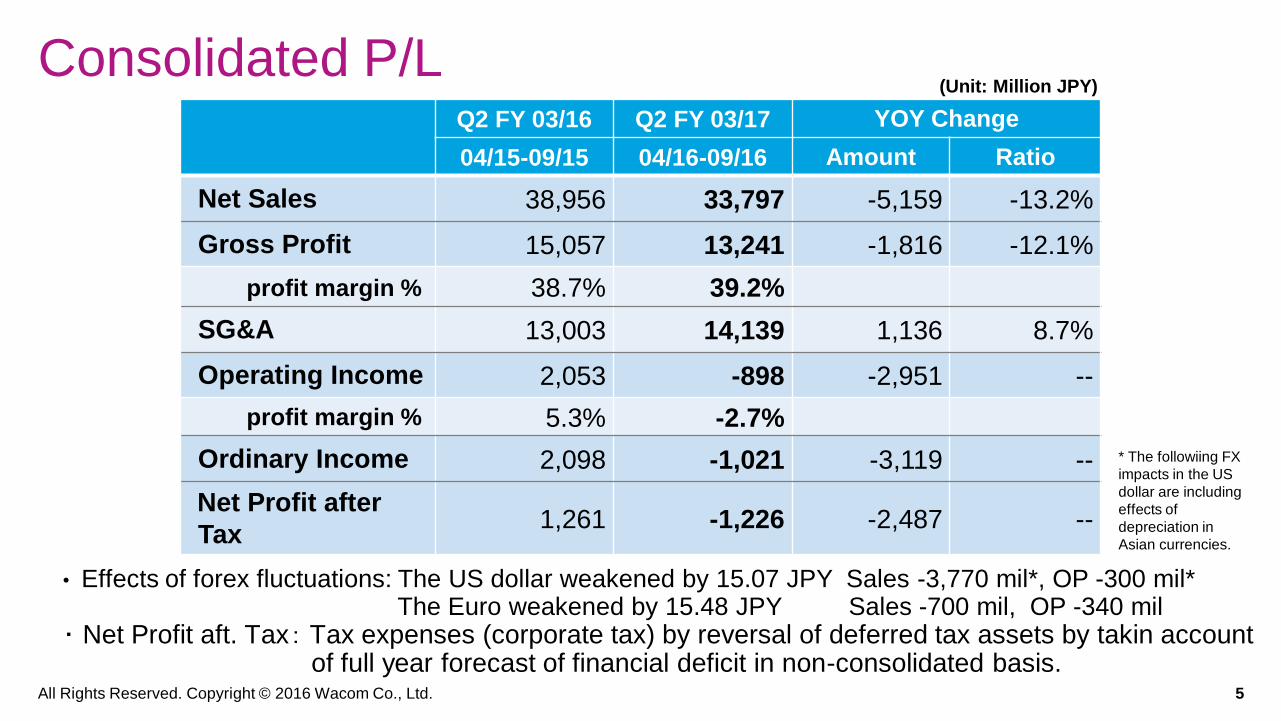
Consolidated P/L Q2 FY 03/16 Q2 FY 03/17 YOY Change
04/15-09/15 04/16-09/16 Amount Ratio
Net Sales 38,956 33,797 -5,159 -13.2%
Gross Profit 15,057 13,241 -1,816 -12.1%
profit margin % 38.7% 39.2%
SG&A 13,003 14,139 1,136 8.7%
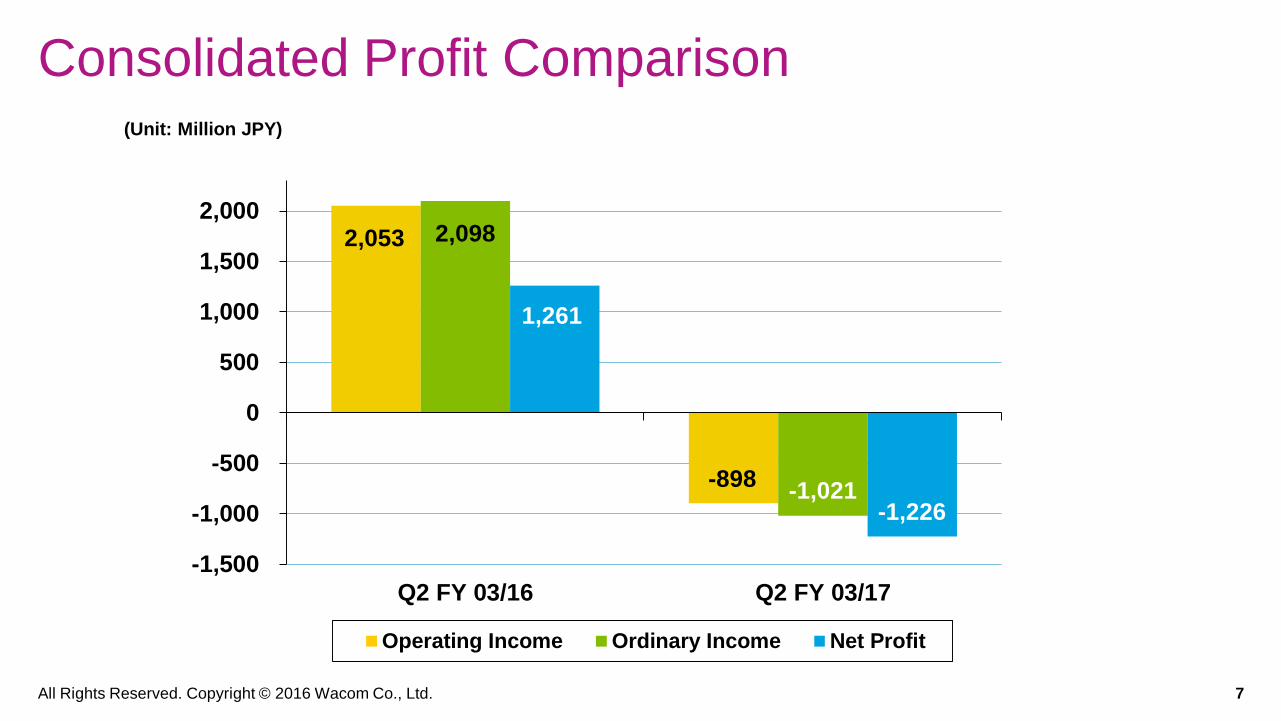
Operating Income 2,053 -898 -2,951 --
profit margin % 5.3% -2.7%
Ordinary Income 2,098 -1,021 -3,119 --
Net Profit after
Tax1,261 -1,226 -2,487 --
(Unit: Million JPY)
• Effects of forex fluctuations: The US dollar weakened by 15.07 JPY Sales -3,770 mil*, OP -300 mil*The Euro weakened by 15.48 JPY Sales -700 mil, OP -340 mil
・ Net Profit aft. Tax: Tax expenses (corporate tax) by reversal of deferred tax assets by takin accountof full year forecast of financial deficit in non-consolidated basis.
* The followiing FX
impacts in the US
dollar are including
effects of
depreciation in
Asian currencies.
All Rights Reserved. Copyright © 2016 Wacom Co., Ltd. 6
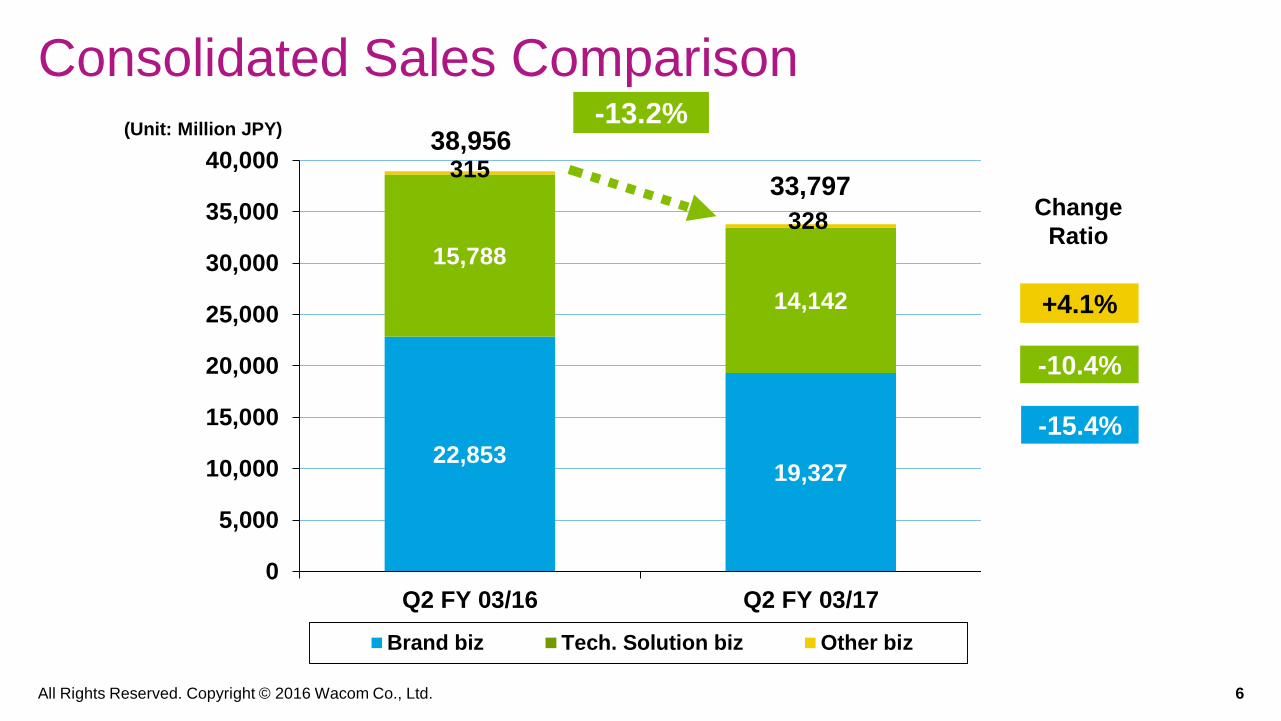
Consolidated Sales Comparison
22,85319,327
15,788
14,142
315
328
0
5,000
10,000
15,000
20,000
25,000
30,000
35,000
40,000
Q2 FY 03/16 Q2 FY 03/17
Brand biz Tech. Solution biz Other biz
+4.1%
-15.4%
-10.4%
-13.2%38,956
33,797
(Unit: Million JPY)
Change
Ratio
All Rights Reserved. Copyright © 2016 Wacom Co., Ltd. 7
Consolidated Profit Comparison
2,053
-898
2,098
-1,021
1,261
-1,226
-1,500
-1,000
-500
0
500
1,000
1,500
2,000
Q2 FY 03/16 Q2 FY 03/17
Operating Income Ordinary Income Net Profit
(Unit: Million JPY)

All Rights Reserved. Copyright © 2016 Wacom Co., Ltd. 8
Operating Expenses ComparisonQ2 FY 03/16 Q2 FY 03/17 YOY Change
04/15-09/15 04/16-09/16 Amount Ratio
Personnel 4,705 4,829 124 2.6%
R&D 2,033 2,265 232 11.4%
Ad. & Promo. 1,716 1,505 -211 -12.3%
Others 4,548 5,539 991 21.8%
Total 13,003 14,139 1,136 8.7%
SG&A ratio % 33.4% 41.8%
(Unit: Million JPY)
Key changes in SG&A
Increase of depreciation (+280 mil) and subcontractor expenses (+430 mil)* in Others and personnel expense* for global IT infrastructure development.
* SG&A decreased by 1,200 mil due to the stronger yen for expenses incurred at subsidiaries.
・Increase of R&D expanses for new products

All Rights Reserved. Copyright © 2016 Wacom Co., Ltd. 9
Business Segment & Business Unit
Technology Solution Business Pen sensor systems for Smartphones and Tablets EMR, AES pen components & modules (feelTM)
Other Business Engineering Solution ・ECAD dio
Consumer Business Makes daily lives more creative and enjoyable
Product Lines: Digital Stationery, etc.
Business Solution Serves society by providing innovative solutions
Product lines: Signature Tablet, Pen Display, etc.
Creative Business Serves the passion of professional and consumer creativity
Product Lines: Pen Tablet, Mobile, Display
Bra
nd
Bu
sin
es
s
Platform &applications
Provides
technology,
apps and
platforms
Cloud Apps
& Services
WILL (digital
Ink solution)

All Rights Reserved. Copyright © 2016 Wacom Co., Ltd. 10
Consolidated P/L by Business Segment
Q2 FY 03/16 Q2 FY 03/17 YOY Change
04/15-09/15 04/16-09/16 Amount Ratio
Net Sales 38,956 33,797 -5,159 -13.2%
Brand Business 22,853 19,327 -3,526 -15.4%
Tech. Solution Biz. 15,788 14,142 -1,646 -10.4%
Other Business 315 328 13 4.1%
Operating Income 2,053 -898 -2,951 --
Brand Business 3,642 2,051 -1,591 -43.7%
Tech. Solution Biz 2,114 1,788 -326 -15.4%
Other Business 34 -13 -47 --
Corp. and others -3,737 -4,724 -987 26.4%
profit margin % 5.3% -2.7%
(Unit: Million JPY)
All Rights Reserved. Copyright © 2016 Wacom Co., Ltd. 11
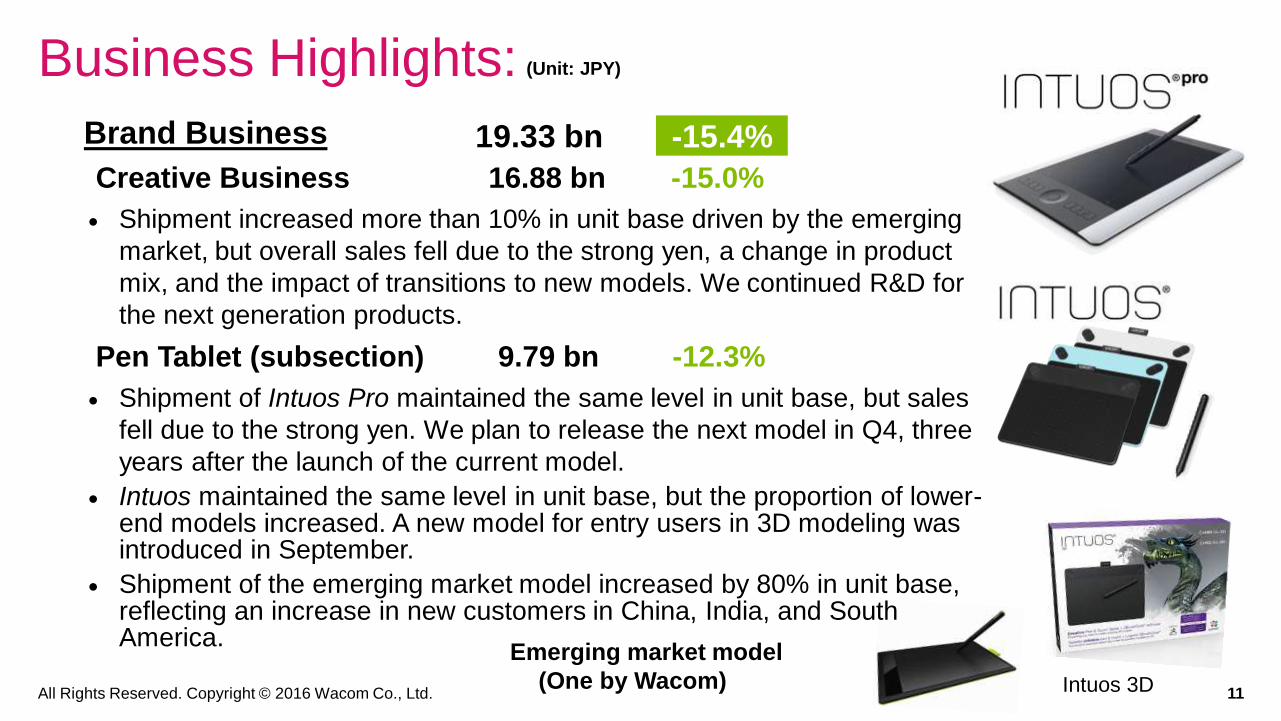
Business Highlights:
Brand Business
Creative Business 16.88 bn -15.0%
Shipment increased more than 10% in unit base driven by the emerging
market, but overall sales fell due to the strong yen, a change in product
mix, and the impact of transitions to new models. We continued R&D for
the next generation products.
Pen Tablet (subsection) 9.79 bn -12.3%
Shipment of Intuos Pro maintained the same level in unit base, but sales
fell due to the strong yen. We plan to release the next model in Q4, three
years after the launch of the current model.
Intuos maintained the same level in unit base, but the proportion of lower-end models increased. A new model for entry users in 3D modeling was introduced in September.
Shipment of the emerging market model increased by 80% in unit base, reflecting an increase in new customers in China, India, and South America.
19.33 bn -15.4%
Emerging market model
(One by Wacom)
(Unit: JPY)
Intuos 3D
All Rights Reserved. Copyright © 2016 Wacom Co., Ltd. 12
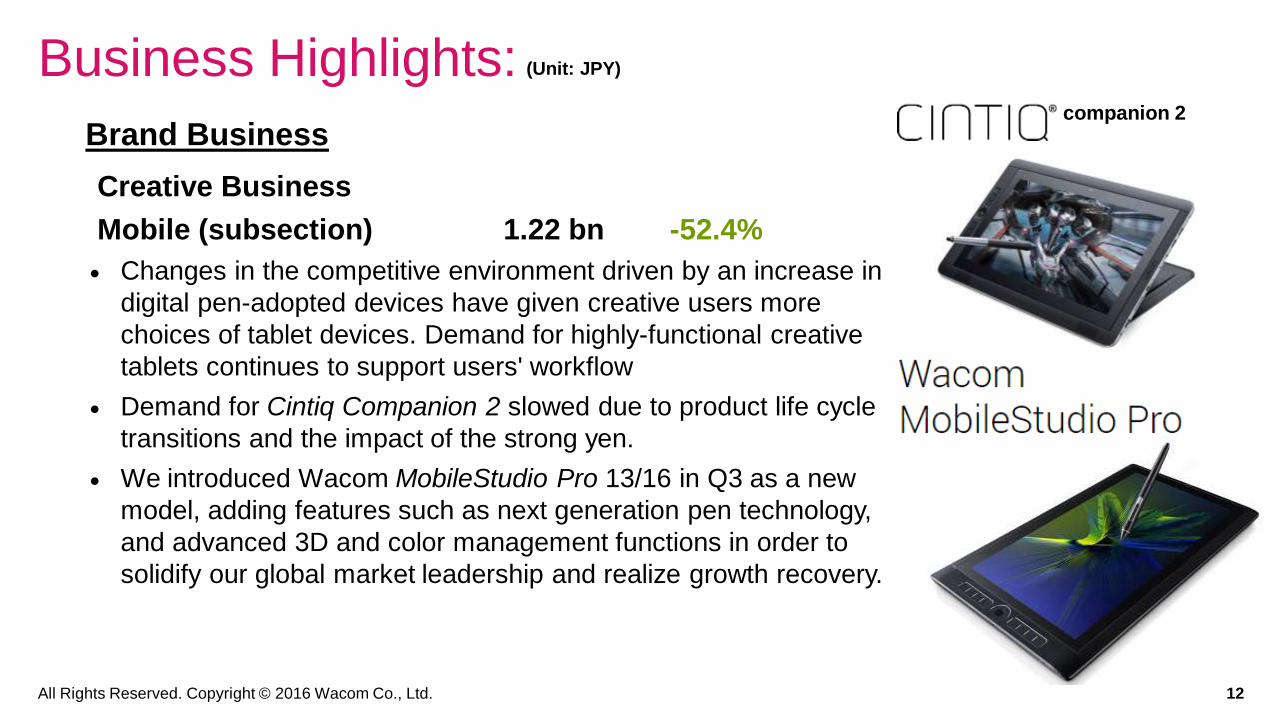
Brand Business
Creative Business
Mobile (subsection) 1.22 bn -52.4%
Changes in the competitive environment driven by an increase in
digital pen-adopted devices have given creative users more
choices of tablet devices. Demand for highly-functional creative
tablets continues to support users' workflow
Demand for Cintiq Companion 2 slowed due to product life cycle
transitions and the impact of the strong yen.
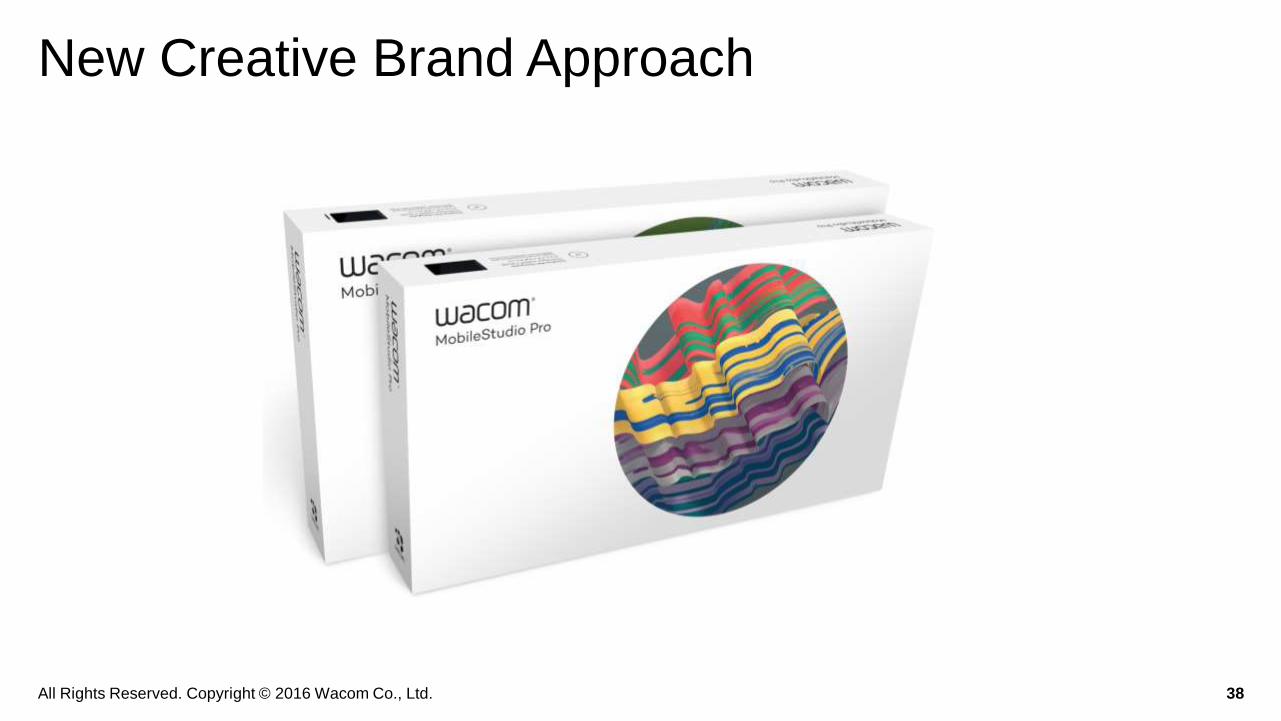
We introduced Wacom MobileStudio Pro 13/16 in Q3 as a new
model, adding features such as next generation pen technology,
and advanced 3D and color management functions in order to
solidify our global market leadership and realize growth recovery.
Business Highlights: (Unit: JPY)
companion 2

All Rights Reserved. Copyright © 2016 Wacom Co., Ltd. 13
Brand Business
Creative Business
Display (subsection) 5.86 bn -4.2%
Shipment of Display products expanded approx. 20% in unit base.
Sales of Cintiq 27 QHD decreased due to the strong yen.
Sales of Cintiq 22HD were steady despite having been on the market for four years.
Shipment of Cintiq 13HD increased, particularly in Asian countries.
We continued R&D for the new models, and plan to launch the next models of all product lines in Q3 and Q4.
13HD
Business Highlights:
27 QHD touch
22HD touch
13HD touch
27 QHD(Unit: JPY)
All Rights Reserved. Copyright © 2016 Wacom Co., Ltd. 14
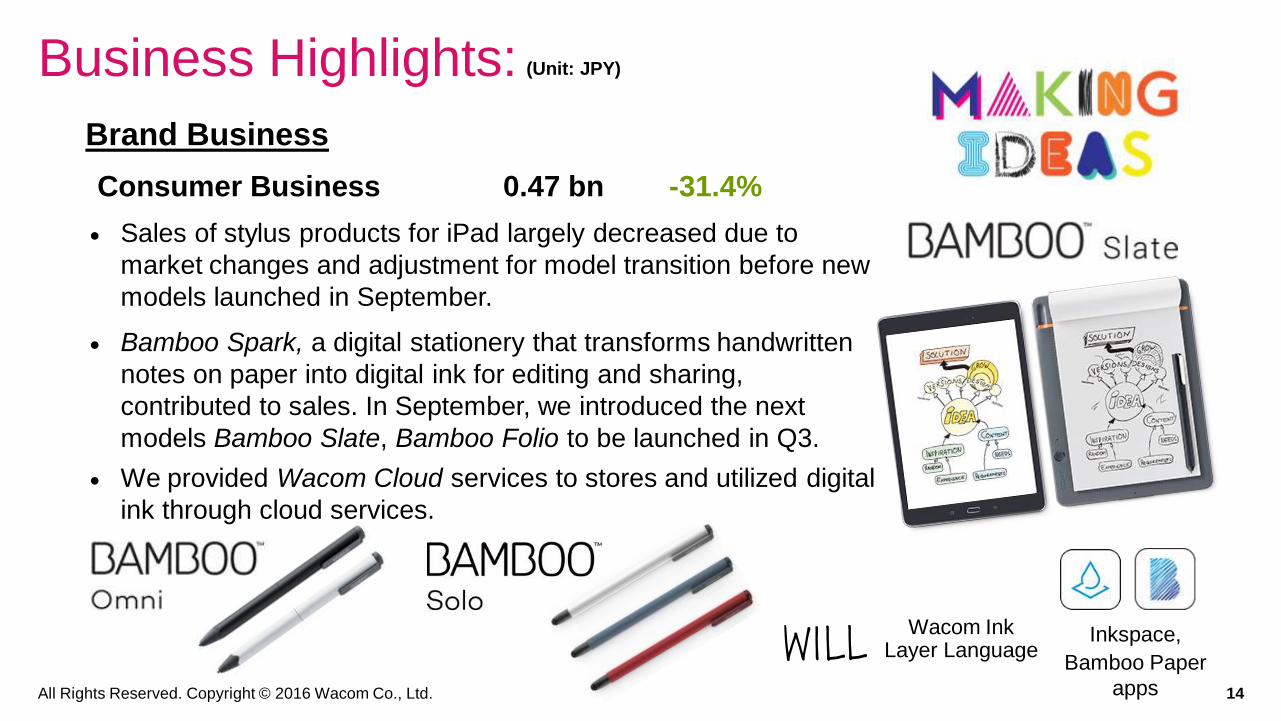
Brand Business
Consumer Business 0.47 bn -31.4%
Sales of stylus products for iPad largely decreased due to
market changes and adjustment for model transition before new
models launched in September.
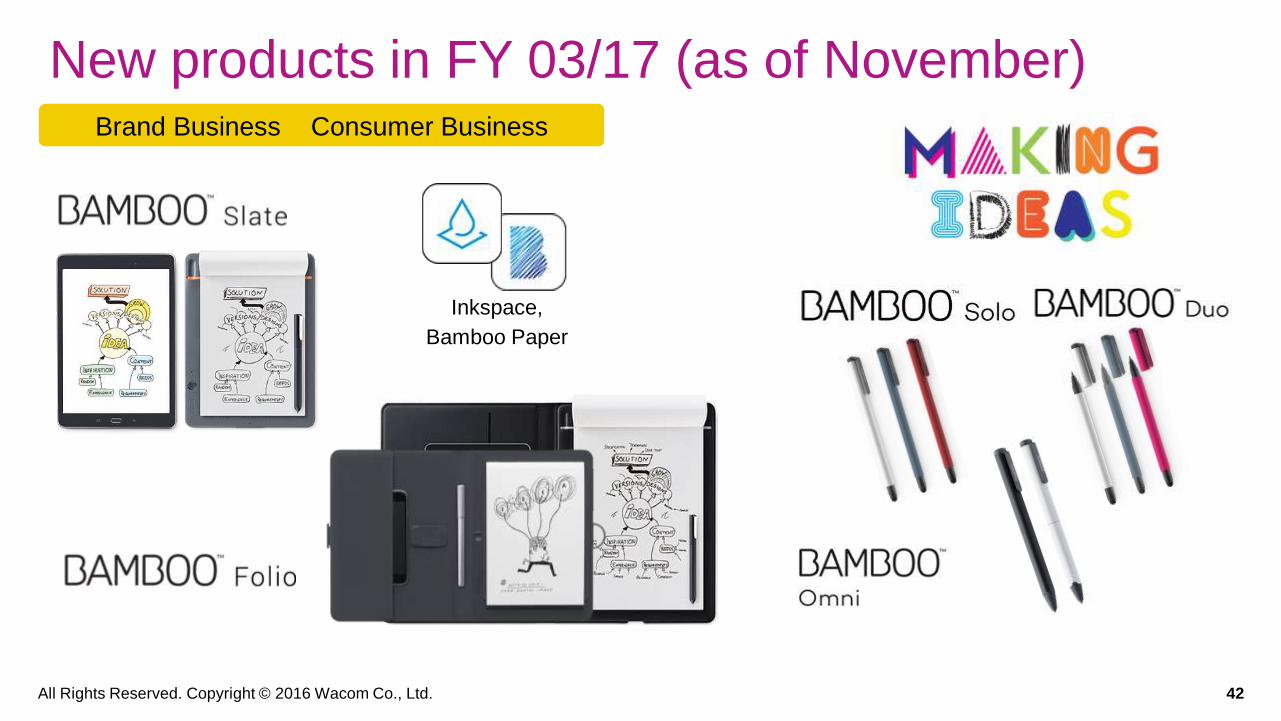
Bamboo Spark, a digital stationery that transforms handwritten
notes on paper into digital ink for editing and sharing,
contributed to sales. In September, we introduced the next
models Bamboo Slate, Bamboo Folio to be launched in Q3.
We provided Wacom Cloud services to stores and utilized digital
ink through cloud services.
Business Highlights: (Unit: JPY)
Wacom InkLayer Language
Inkspace,
Bamboo Paper
apps

All Rights Reserved. Copyright © 2016 Wacom Co., Ltd. 15
Business Highlights: (Unit: JPY)
Brand Business
Business Solution 1.99 bn -14.4%
Sales dropped in the Eurozone due to prolonged investment projects
in the economic uncertainties as well as the strong yen.
STU series expanded in units shipment owing to increased demand for
digital signature solutions at retailers in Japan and public services in
India, and for credit card transactions and over-the-counter services.
LCD signature tablets, the DTU series, expanded widely in sales for
over-the-counter use in the finance field. DTU-1141 adopted by Citi
Bank Korea.
STU series
STU-540/430
DTU-1031DTU-1141 DTH-2242DTK-1651
All Rights Reserved. Copyright © 2016 Wacom Co., Ltd. 16
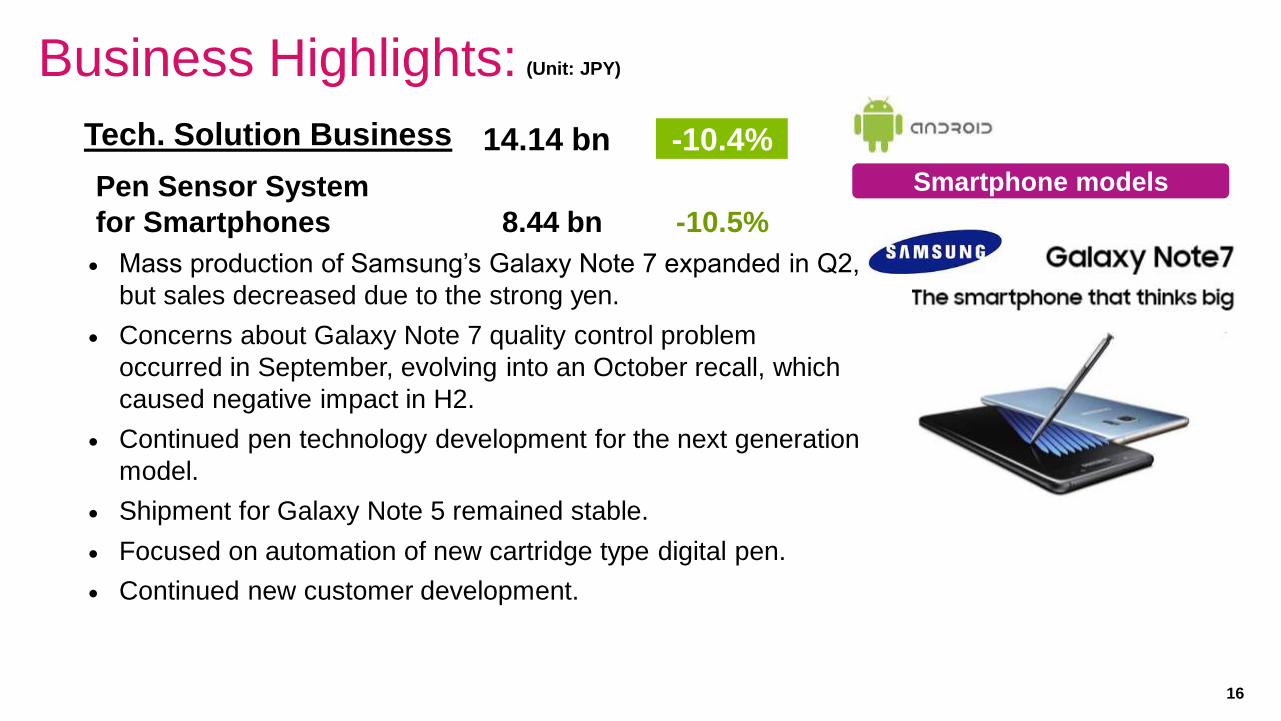
Business Highlights:
Tech. Solution Business
Pen Sensor System
for Smartphones 8.44 bn -10.5%
Mass production of Samsung’s Galaxy Note 7 expanded in Q2,
but sales decreased due to the strong yen.
Concerns about Galaxy Note 7 quality control problem
occurred in September, evolving into an October recall, which
caused negative impact in H2.
Continued pen technology development for the next generation
model.
Shipment for Galaxy Note 5 remained stable.
Focused on automation of new cartridge type digital pen.
Continued new customer development.
14.14 bn -10.4%
(Unit: JPY)
Smartphone models
All Rights Reserved. Copyright © 2016 Wacom Co., Ltd. 17
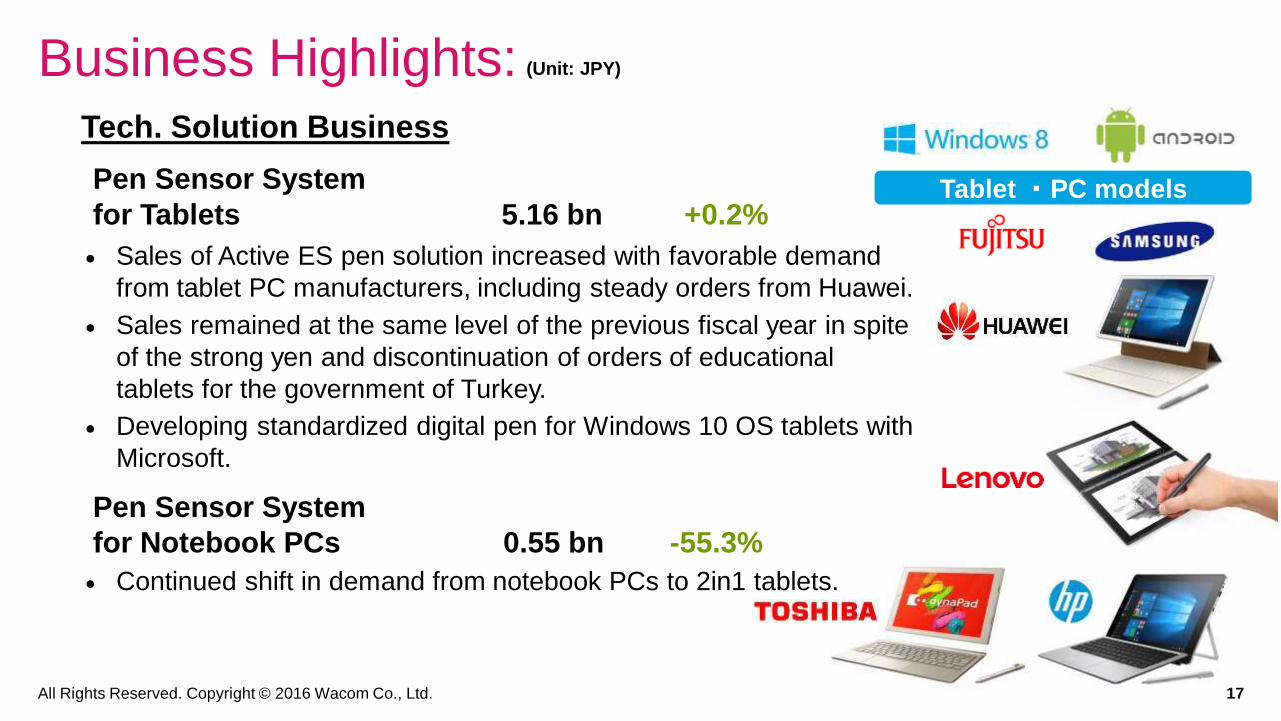
Business Highlights:Tech. Solution Business
Pen Sensor System
for Tablets 5.16 bn +0.2%
Sales of Active ES pen solution increased with favorable demand
from tablet PC manufacturers, including steady orders from Huawei.
Sales remained at the same level of the previous fiscal year in spite
of the strong yen and discontinuation of orders of educational
tablets for the government of Turkey.
Developing standardized digital pen for Windows 10 OS tablets with
Microsoft.
Pen Sensor System
for Notebook PCs 0.55 bn -55.3%
Continued shift in demand from notebook PCs to 2in1 tablets.
(Unit: JPY)
Tablet ・PC models

All Rights Reserved. Copyright © 2016 Wacom Co., Ltd. 18
Business Highlights:
Other Business
CAD software and others 0.33 bn +4.1%
Sales of major product ECAD dio series maintained a steady level.
0.33 bn
(Unit: JPY)
+4.1%
F&A (Corporate)
Continued to invest in business infrastructure for growth and operational efficiency. Major projects include new SCM system for e-commerce and IT infrastructure for global integrated operations.
Promoted WILL (Wacom Ink Layer Language) under our open partnership policy as a new framework to standardize digital ink and engaged in activities for partnership development.
Made preparations for the establishment of the Digital Stationery Consortium in October, held Connected Ink events in Las Vegas, Shanghai and Berlin in January, May and September, 2016 to promote digital ink.
All Rights Reserved. Copyright © 2016 Wacom Co., Ltd. 19
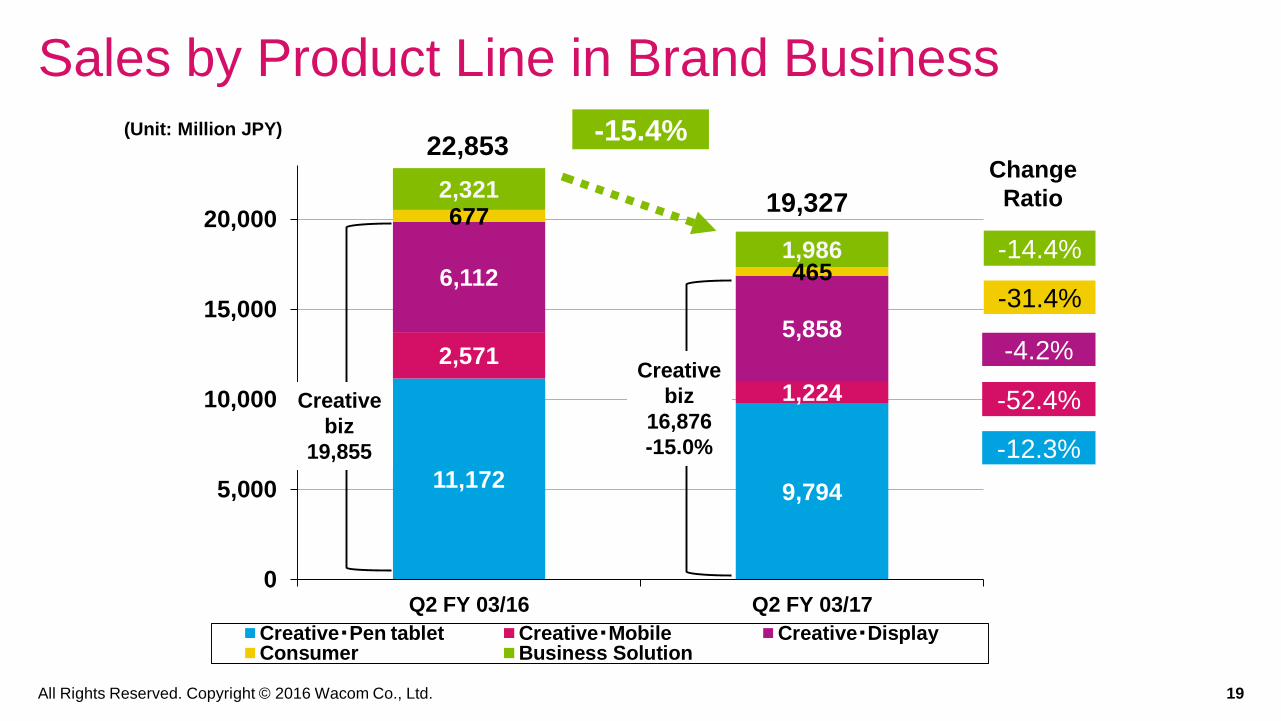
Sales by Product Line in Brand Business
11,1729,794
2,571
1,224
6,112
5,858
677
465
2,321
1,986
0
5,000
10,000
15,000
20,000
Q2 FY 03/16 Q2 FY 03/17
Creative・Pen tablet Creative・Mobile Creative・DisplayConsumer Business Solution
-52.4%
-12.3%
-4.2%
-14.4%
19,327
22,853-15.4%
Creative
biz
19,855
Creative
biz
16,876
-15.0%
-31.4%
(Unit: Million JPY)
Change
Ratio

All Rights Reserved. Copyright © 2016 Wacom Co., Ltd. 20
Sales by Product Line in Tech. Solution Business
9,4198,435
5,1505,162
1,219
545
0
5,000
10,000
15,000
Q2 FY 03/16 Q2 FY 03/17
Pen for Smartphone Pen for Tablet Pen for Notebook PC, etc.
-55.3%
+0.2%
-10.5%
14,142
15,788-10.4%
(Unit: Million JPY)
Change
Ratio

All Rights Reserved. Copyright © 2016 Wacom Co., Ltd. 21
0
5000
10000
15000
20000
25000
13/10-12 14/1-3 14/4-6 14/7-9 14/10-12 15/1-3 15/4-6 15/7-9 15/10-12 16/1-3 16/4-6 16/7-9
Creative Consumer(Stylus, etc.) Business(VM) Tech. Solution CAD, etc.
Quarterly Trend by Product Line
23,389
20,786
13,669
18,342
24,954
17,592
15,142
23,814
21,936
16,676
13,261
20,536
(Unit: Million JPY)

All Rights Reserved. Copyright © 2016 Wacom Co., Ltd. 22
Sales by Region
15,788 14,142
3,5843,270
7,387
5,422
6,474
5,368
5,723
5,595
0
5,000
10,000
15,000
20,000
25,000
30,000
35,000
40,000
Q2 FY 03/16 Q2 FY 03/17
Tech. Solution Japan U.S. Germany Asia Oceania
(-16.1%)
(-5.8%)
-2.2%
-26.6%
-8.7%
-10.4%
-17.1%
38,956
33,797
※2,764
※2,838
(※+17.5%)
-13.2%(Unit: Million JPY)
Change
Ratio※Sales in China
of Asia Oceania
(※% growth based
on local currency)
( ) % growth based
on local currency
(Note) There are no regional segments in the Tech. Solution Biz.
All Rights Reserved. Copyright © 2016 Wacom Co., Ltd. 23
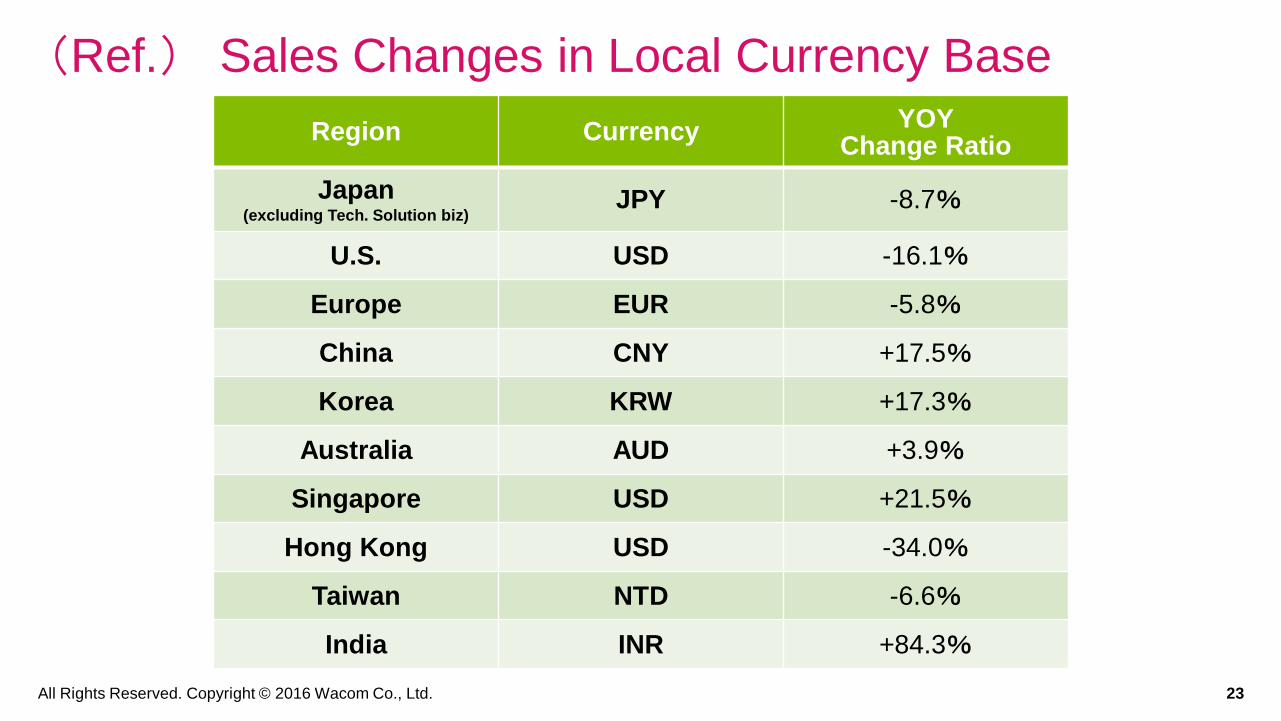
(Ref.) Sales Changes in Local Currency Base
Region CurrencyYOY
Change Ratio
Japan(excluding Tech. Solution biz)
JPY -8.7%
U.S. USD -16.1%
Europe EUR -5.8%
China CNY +17.5%
Korea KRW +17.3%
Australia AUD +3.9%
Singapore USD +21.5%
Hong Kong USD -34.0%
Taiwan NTD -6.6%
India INR +84.3%

All Rights Reserved. Copyright © 2016 Wacom Co., Ltd. 24
0
5,000
10,000
15,000
20,000
25,000
13/10-12 14/1-3 14/4-6 14/7-9 14/10-12 15/1-3 15/4-6 15/7-9 15/10-12 16/1-3 16/4-6 16/7-9
Tech. Solution Japan U.S. Germany Asia Oceania
Quarterly Trend by Region
23,389
20,786
13,669
18,342
24,954
17,592
15,142
23,814
21,936
16,676
13,261
20,536
(Unit: Million JPY)
(Note) There are no regional segments in the Tech. Solution Biz.
All Rights Reserved. Copyright © 2016 Wacom Co., Ltd. 25
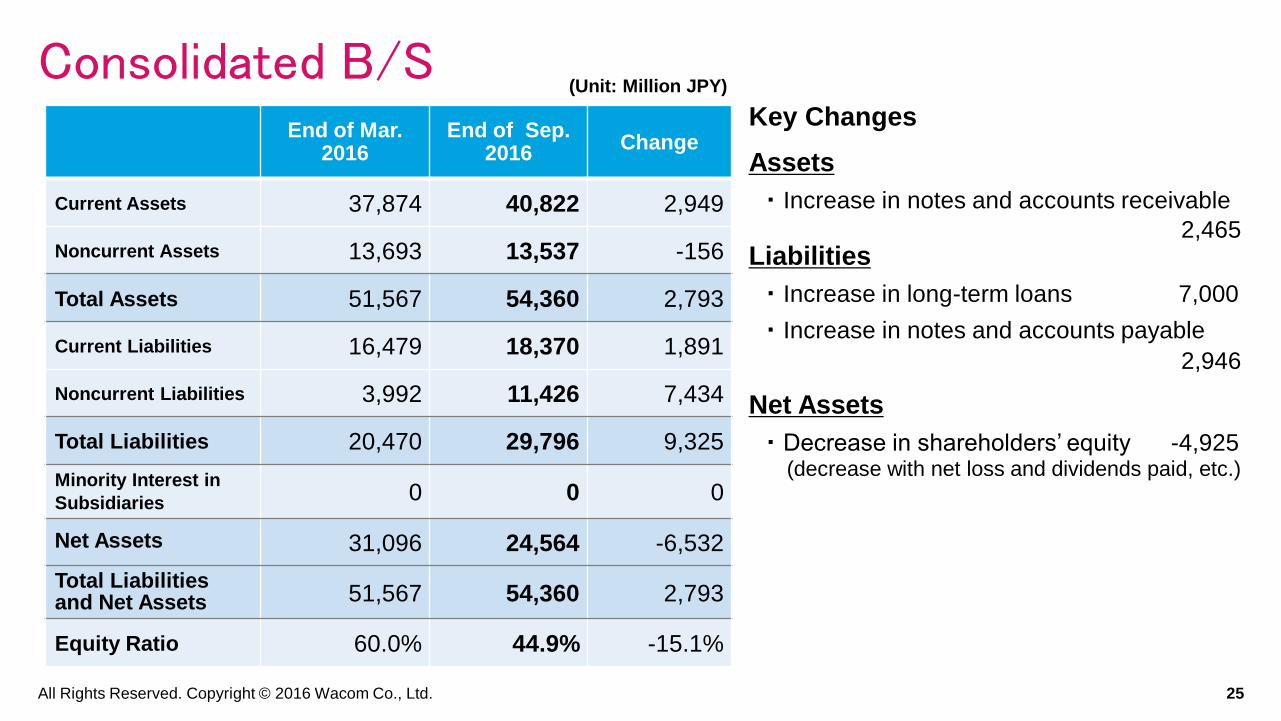
Consolidated B/SKey Changes
Assets
・ Increase in notes and accounts receivable
2,465Liabilities
・ Increase in long-term loans 7,000
・ Increase in notes and accounts payable
2,946
Net Assets
・ Decrease in shareholders’ equity -4,925(decrease with net loss and dividends paid, etc.)
End of Mar. 2016
End of Sep. 2016
Change
Current Assets 37,874 40,822 2,949
Noncurrent Assets 13,693 13,537 -156
Total Assets 51,567 54,360 2,793
Current Liabilities 16,479 18,370 1,891
Noncurrent Liabilities 3,992 11,426 7,434
Total Liabilities 20,470 29,796 9,325
Minority Interest in
Subsidiaries0 0 0
Net Assets 31,096 24,564 -6,532
Total Liabilities and Net Assets 51,567 54,360 2,793
Equity Ratio 60.0% 44.9% -15.1%
(Unit: Million JPY)

All Rights Reserved. Copyright © 2016 Wacom Co., Ltd. 26
Consolidated C/F Major Activities in Q2 FY 03/17
C/F from operating activities
・ Increase in notes and accounts
receivable-trade -4,908
・ Net loss before tax -1,074
・ Increase in notes and accounts
payable-trade 3,475
・ Depreciation 1,240
C/F from investing activities
・ Purchase of fixed assets -1,828(global IT infrastructure, etc.)
・ Proceeds from sales of property 521 (sales of property in US subsidiary, etc.)
C/F from financing activities
・ Increase in long-term loans payable 8,000
・ Decrease in short-term loans payable -1,000
・ Cash dividends paid -2,953
・ Purchase of treasury stock -753
Q2
FY 03/16
Q2
FY 03/17
YoY
Change
04/15-09/15 04/16-09/16 Amount
C/F from operating
activities-1,014 -756 259
C/F from investing
activities-2,360 -1,339 1,021
C/F from financing
activities1,210 3,304 2,093
Effect of change in
exchange rate -88 -897 -808
Increase-decrease of
cash & cash equivalent-2,252 313 2,565
Beginning balance of
cash & cash equivalent16,687 14,365 -2,322
Ending balance of cash
and cash equivalent14,435 14,678 243
(Unit: Million JPY)

FY 03/2017
Basic Strategies and
Business Focus
All Rights Reserved. Copyright © 2016 Wacom Co., Ltd. 28
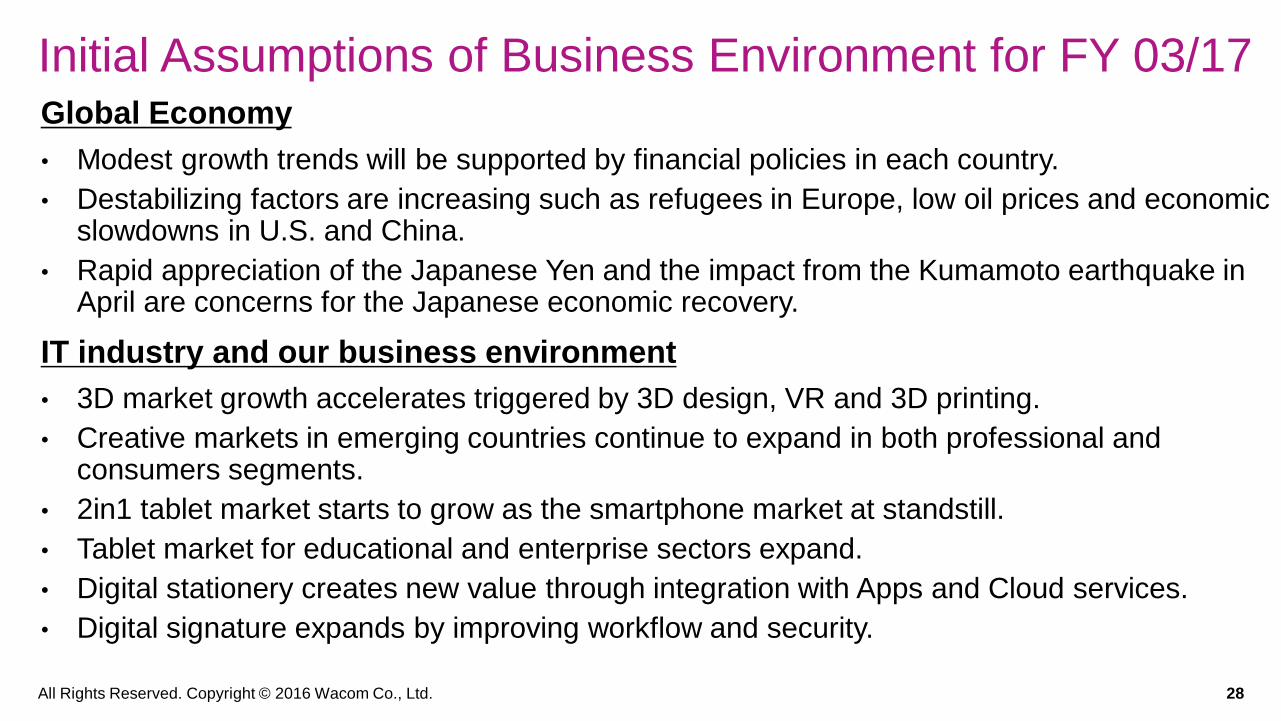
Initial Assumptions of Business Environment for FY 03/17Global Economy
• Modest growth trends will be supported by financial policies in each country.
• Destabilizing factors are increasing such as refugees in Europe, low oil prices and economic slowdowns in U.S. and China.
• Rapid appreciation of the Japanese Yen and the impact from the Kumamoto earthquake in April are concerns for the Japanese economic recovery.
IT industry and our business environment
• 3D market growth accelerates triggered by 3D design, VR and 3D printing.
• Creative markets in emerging countries continue to expand in both professional and consumers segments.
• 2in1 tablet market starts to grow as the smartphone market at standstill.
• Tablet market for educational and enterprise sectors expand.
• Digital stationery creates new value through integration with Apps and Cloud services.
• Digital signature expands by improving workflow and security.

All Rights Reserved. Copyright © 2016 Wacom Co., Ltd. 29
Basic Strategies and Initiatives Expand Creative Business and enhance the market leadership.
Extend 3D design and color management functions with the next generation of product lines.
Accelerate the growth of Creative Business in emerging markets
Establish a new consumer segment by integrating digital stationery and Cloud services.
Promote standardization of digital ink by WILL (Wacom Ink Layer Language).
Enhance paperless workflow and security business with digital signature.
Promote standardization of digital pen and expand Technology Solution Business.
Enhance the collaboration among global organizations and improve business efficiency by
leveraging the new global IT infrastructure.
Enhance corporate governance and processes for improving corporate value.

All Rights Reserved. Copyright © 2016 Wacom Co., Ltd. 30
Assumptions for FY 03/17 Financial Forecast
(Note) Each figure of the above sensitivities shows a opposite sign in case of the weaker JPY.
(Unit: Million JPY)
Revised downward our consolidated financial forecast, based on our further market review
in mid October, 2016.
As for Technology Solution Business, actual results may materially differ from our latest
financial forecast in the short term due to its business nature.
Forex rate assumptions for FY 03/17, effective from November, 2016
1 USD = 103 JPY (YOY +12.9% stronger JPY) (no revision)1 EUR = 114 JPY (YOY +11.8% stronger JPY) (no revision)
Forex exchange sensitivity: 12-month forecast *Assumption: Asian currencies are pegged to USD.
Unit of
sensitivityPer 1 JPY in case of the stronger JPY
FY 03/17 (revised) FY 03/17 (previous)(for ref.) FY 03/16
(result)
Currency USD EUR USD EUR USD EUR
Sales -460 -130 -500 -140 -400 -112
Operating
Income+10 -90 +40 -100 +33 -71

All Rights Reserved. Copyright © 2016 Wacom Co., Ltd. 31
Summary for FY 03/17 Forecast
H2 FY 03/17 (prev.) H2 FY 03/17 (rev.) Prev. vs.
Rev.
10/16-03/17 10/16-03/17 Change
Sales 43,720 36,503 -7,217
Operating Income 3,470 7.9% 398 1.1% -3,072
Ordinary Income 3,440 7.9% 371 1.0% -3,069
Net Profit aft. tax 2,490 5.7% -274 -0.8% -2,764
FY 03/17 (prev.) FY 03/17 (rev.) YOY
04/16-03/17 04/16-03/17 Growth rate
Sales 77,900 70,300 -7,600
Operating Income 2,400 3.1% -500 -0.7% -2,900
Ordinary Income 2,300 3.0% -650 -0.9% -2,950
Net Profit aft. tax 1,620 2.1% -1,500 -2.1% -3,120
ROE 5.5% -5.3% -10.8%
(Unit: Million JPY)
(vs. Previous Forecast as of Aug. 5)

All Rights Reserved. Copyright © 2016 Wacom Co., Ltd. 32
(Note) Due to risks and uncertainties involved in the forecast of customer demand and market in Technology Solution Business,
actual results may materially differ from forward-looking statements in the short term.
Forecast by Business Segment
FY 03/17 (prev.) FY 03/17 (rev.) Prev. vs. Rev.
04/16-03/17 04/16-03/17 Amount Change
Net Sales 77,900 70,300 -7,600 -9.8%
Brand biz 53,200 48,400 -4,800 -9.0%
Tech. Solution biz 23,900 21,200 -2,700 -11.3%
Other biz 800 700 -100 -12.5%
Operating Income 2,400 -500 -2,900 --
Brand biz 9,660 7,300 -2,360 -24.4%
Tech. Solution biz 1,390 900 -490 -35.3%
Other biz 190 100 -90 -47.4%
Corp. and others -8,840 -8,800 40 -0.5%
profit margin % 3.1% -0.7%
(Unit: Mil JPY)
(vs. Previous Forecast as of Aug. 5)

All Rights Reserved. Copyright © 2016 Wacom Co., Ltd. 33
Major Impacts on P/L Forecast Revision -1
• Revised consolidated business forecast for FY 03/17 in response to market trend and
demand forecast in the middle of October, 2016.
• Brand Business: Sales forecast was revised downward due to the delay of new product
launches of several models planned during H2 in addition to the changes competitive
environment,
Creative Business
• The launch of new generation pen tablet models are planned in Q4. However product mix shift
toward low price model in emerging market may cause the decrease of overall sales.
• The delay of product introduction in new display products may have an impact in H2 sales.
• As for mobile products, new models to be launched in Q3 will contribute to the recovery in H2.
(All comparisons are with the previous forecast as of August 2016 unless otherwise stated )
Consumer Business
• Sales in H2 will be lowered due to severe competitive environment in stylus products market,
delay of new model development to be launched in Q3, and downward forecast of Bamboo
Slate / Folio.

All Rights Reserved. Copyright © 2016 Wacom Co., Ltd. 34
Major Impacts on P/L Forecast Revision -1
Business Solution
• Closely re-evaluated the business risk attributable to the changes in competitive environment in
Europe and prolonged investment projects.
(All comparisons are with the previous forecast as of August 2016 unless otherwise stated )
• Technology Solution Business: Full year sales is expected to largely fall below the previous
forecast due to recall issue of Samsung’s new smartphone.
For smartphones
• Sales in H2 will significantly decrease due to the recall and discontinuation of Galaxy Note 7.
• Sales in H2 will consist of the sales of remaining materials for Galaxy Note 7 and the shipment
for previous models only.
For tablet PCs and notebook PCs
• Sales for tablet PCs is expected to be steady with increased digital pen-enabled models.
• Sales for notebook PCs is expected to decrease due to continued shift in toward tablet PCs.
All Rights Reserved. Copyright © 2016 Wacom Co., Ltd. 35
Major Impacts on P/L Forecast Revision -1 (All comparisons are with the previous forecast as of August 2016 unless otherwise stated )
• Corporate expenses
• SG&A remains high and SG&A ratio will increase. System development continues for global IT
infrastructure aiming for business growth and efficiency improvement.. Expenses for ERP
system in Japan continues in H2 for the cut-over in early next fiscal year.
• Extraordinary loss to be reported in H2, due to disposal of non-current assets such as
equipment and mold related to Samsung. (approx. 300 mil. JPY)
• Tax expenses will increase due to reversal of deferred tax assets by taking account of
downward revision of profitability. (approx. 450 mil. JPY)
All Rights Reserved. Copyright © 2016 Wacom Co., Ltd. 36
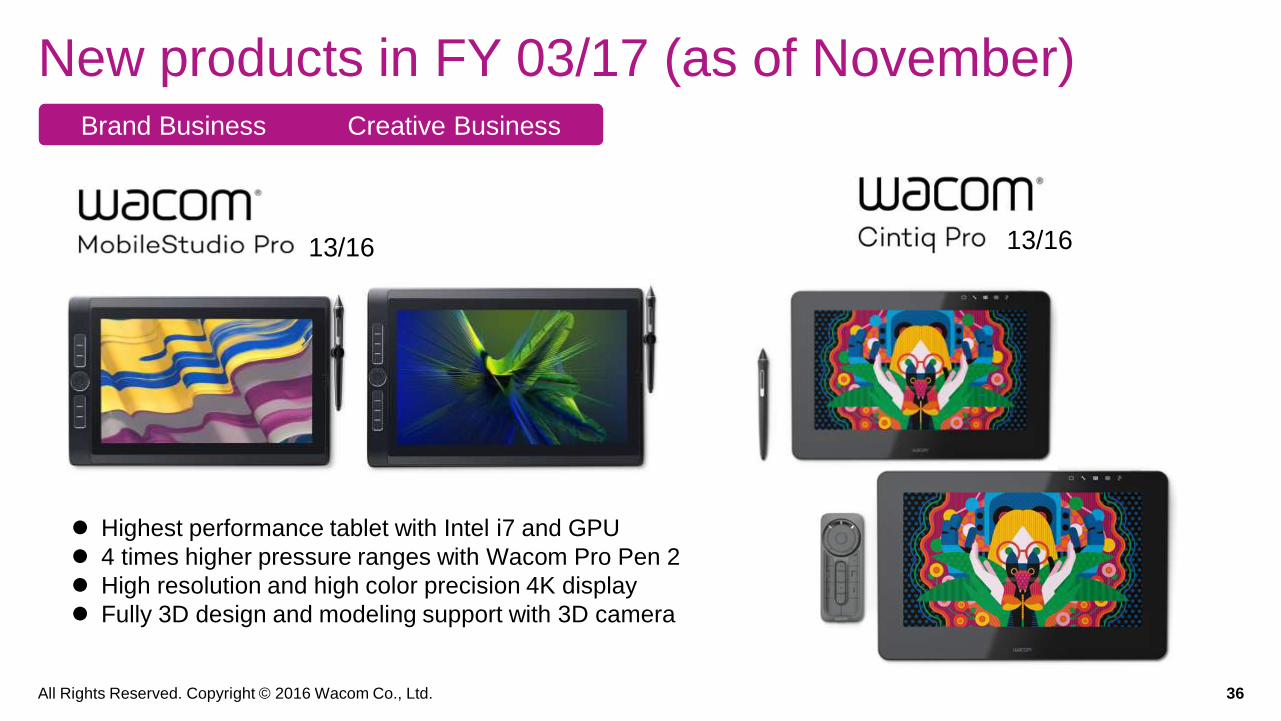
New products in FY 03/17 (as of November)
13/16 13/16
Brand Business Creative Business
Highest performance tablet with Intel i7 and GPU
4 times higher pressure ranges with Wacom Pro Pen 2
High resolution and high color precision 4K display
Fully 3D design and modeling support with 3D camera

All Rights Reserved. Copyright © 2016 Wacom Co., Ltd. 37
New products in FY 03/17 (as of November)
3D
3D Modeling solution for beginners
Integrated solution with 3D printing process
Standard service of 3D printing and delivery
Brand Business Creative Business
All Rights Reserved. Copyright © 2016 Wacom Co., Ltd. 38
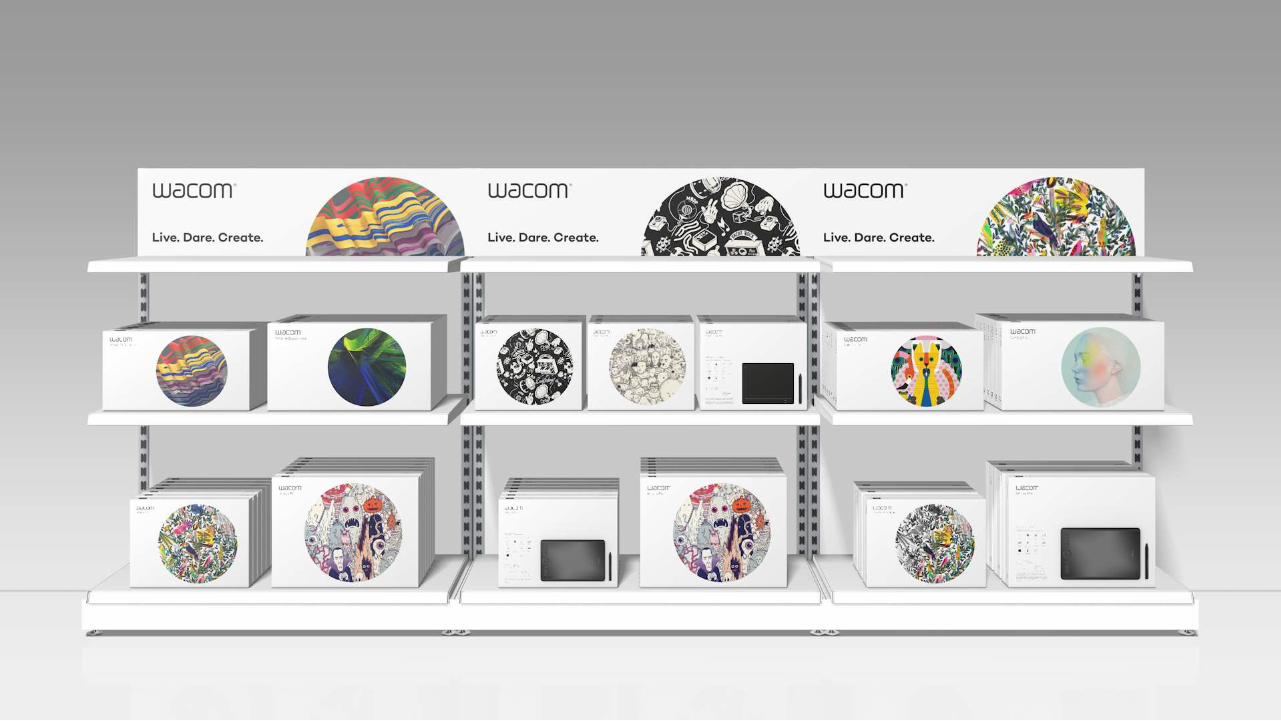
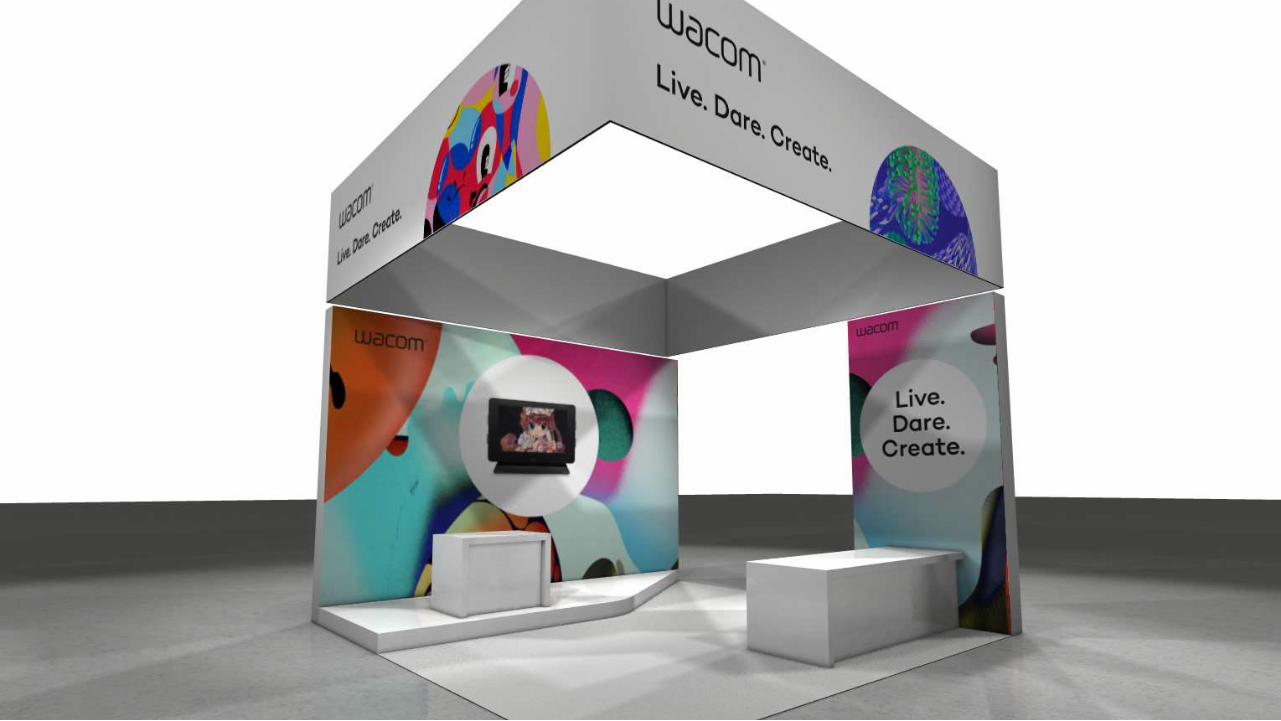
New Creative Brand Approach
All Rights Reserved. Copyright © 2016 Wacom Co., Ltd. 39
Brand CI Great Brand Marketing
Great Products
Great Distribution
Great people

All Rights Reserved. Copyright © 2016 Wacom Co., Ltd. 40
Brand CI Great Brand Marketing
Great Products
Great Distribution
Great people
Brand Implementation at POS
All Rights Reserved. Copyright © 2016 Wacom Co., Ltd. 41
All Rights Reserved. Copyright © 2016 Wacom Co., Ltd. 42
Brand Business Consumer Business
Inkspace,
Bamboo Paper
New products in FY 03/17 (as of November)
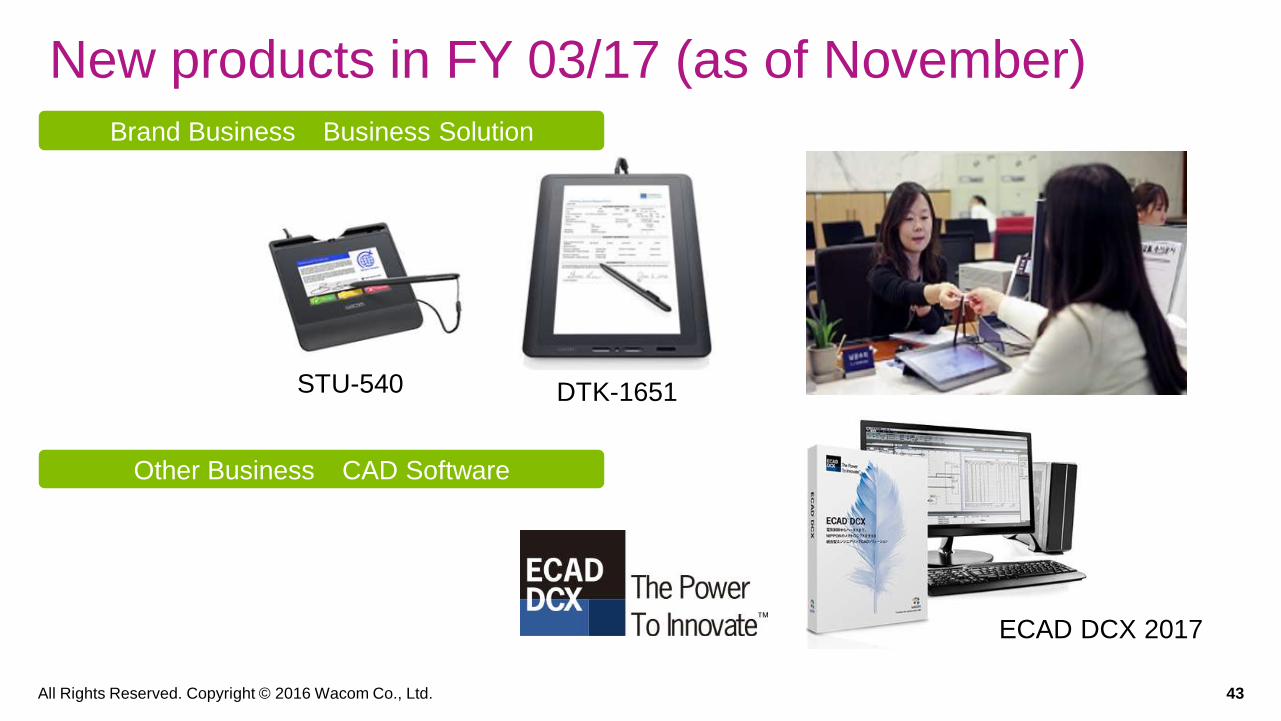
All Rights Reserved. Copyright © 2016 Wacom Co., Ltd. 43
Other Business CAD Software
DTK-1651STU-540
ECAD DCX 2017
Brand Business Business Solution
New products in FY 03/17 (as of November)

All Rights Reserved. Copyright © 2016 Wacom Co., Ltd. 44
• Delaware Corporation founded on
October 26, 2017.
• Promotes WILL “Wacom Ink Layer
Language” as new digital ink
standard and development of new
digital stationery market
www.digitalstationeryconsortium.org
Founding ofDigital Stationery Consortium
Connected Ink Tokyo
October 27, 2016

All Rights Reserved. Copyright © 2016 Wacom Co., Ltd. 45
Sales Forecast by Business Segment
53,20048,400
23,900
21,200
800
700
0
10,000
20,000
30,000
40,000
50,000
60,000
70,000
80,000
FY 03/17 (previous) FY 03/17 (revised)
Brand biz Tech. Solution biz Other biz
-12.5%
-9.0%
-11.3%
-9.8%77,900
70,300
(forecast change)
(Unit: Million JPY)
Change
Ratio
All Rights Reserved. Copyright © 2016 Wacom Co., Ltd. 46
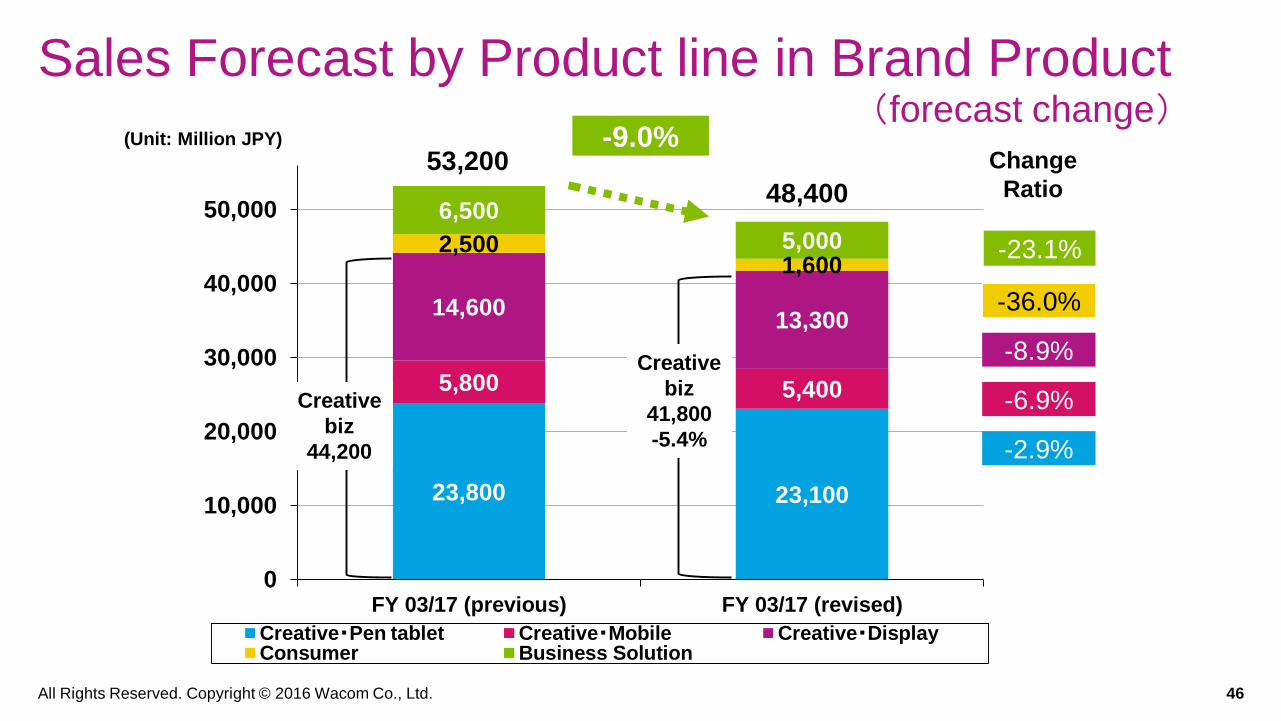
Sales Forecast by Product line in Brand Product
23,800 23,100
5,800 5,400
14,60013,300
2,5001,600
6,500
5,000
0
10,000
20,000
30,000
40,000
50,000
FY 03/17 (previous) FY 03/17 (revised)
Creative・Pen tablet Creative・Mobile Creative・DisplayConsumer Business Solution
-36.0%
-6.9%
-2.9%
-8.9%
-23.1%
48,400
53,200-9.0%
Creative
biz
44,200
Creative
biz
41,800
-5.4%
(Unit: Million JPY)
Change
Ratio
(forecast change)

All Rights Reserved. Copyright © 2016 Wacom Co., Ltd. 47
Sales Forecast by Product line in Tech. Solution
13,00010,500
8,600
9,300
2,300
1,400
0
5,000
10,000
15,000
20,000
25,000
FY 03/17 (previous) FY 03/17 (revised)
Pen for Smartphone Pen for Tablet Pen for Notebook PC, etc.
-39.1%
+8.1%
-19.2%
21,200
23,900
-11.3%(Unit: Million JPY)
Change
Ratio
(forecast change)

All Rights Reserved. Copyright © 2016 Wacom Co., Ltd. 48
Sales Forecast by Region
23,900 21,200
9,3108,480
16,01014,400
16,190
14,680
12,490
11,540
0
10,000
20,000
30,000
40,000
50,000
60,000
70,000
80,000
FY 03/17 (previous) FY 03/17 (revised)
Tech. Solution Japan U.S. Germany Asia Oceania
-7.6%
-10.1%
-8.9%
-11.3%
-9.3%
77,900-9.8%
70,300
(Unit: Million JPY)Change
Ratio
(forecast change)
(Note) There are no regional segments in the Tech. Solution Biz.
All Rights Reserved. Copyright © 2016 Wacom Co., Ltd. 49
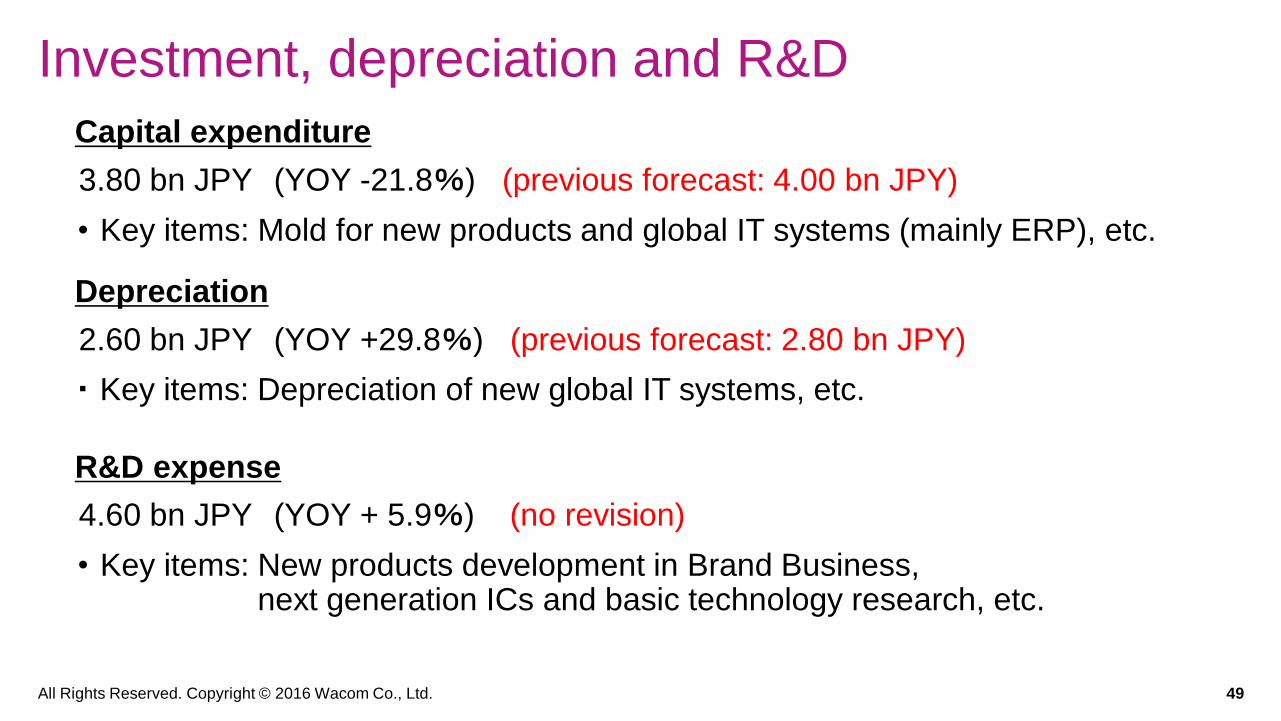
Investment, depreciation and R&D
Capital expenditure
3.80 bn JPY (YOY -21.8%) (previous forecast: 4.00 bn JPY)
• Key items: Mold for new products and global IT systems (mainly ERP), etc.
Depreciation
2.60 bn JPY (YOY +29.8%) (previous forecast: 2.80 bn JPY)
・ Key items: Depreciation of new global IT systems, etc.
R&D expense
4.60 bn JPY (YOY + 5.9%) (no revision)
• Key items: New products development in Brand Business,next generation ICs and basic technology research, etc.

All Rights Reserved. Copyright © 2016 Wacom Co., Ltd. 50
Shareholders Return Policy for FY 03/17
Dividend policy
• Continue steady dividend payout to shareholders while ensuring necessary retained earnings for future business development and sound financial base.
• Target payout ratio maintains approximately 40% or more to attract global investment.
• Revised downward dividend forecast for FY3/17 to reflect our revised business forecast, and maintain sound financial base.
Dividend per share
• 6.00 JPY per share for FY 03/17 (18.00 JPY for FY 03/16) (previous forecast: 12.00 JPY )
• Payout ratio --% (128.6% for FY 03/16) (previous estimation: 121.3%)
All Rights Reserved. Copyright © 2016 Wacom Co., Ltd. 51
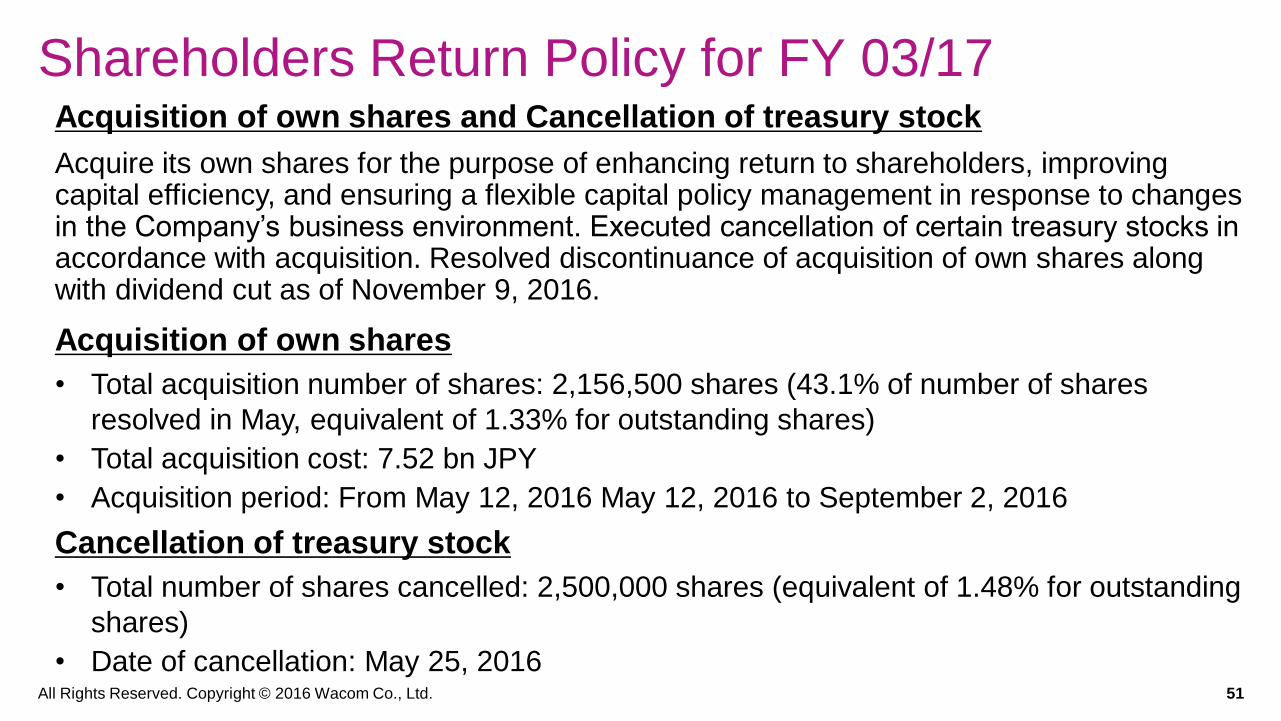
Shareholders Return Policy for FY 03/17Acquisition of own shares and Cancellation of treasury stock
Acquire its own shares for the purpose of enhancing return to shareholders, improving capital efficiency, and ensuring a flexible capital policy management in response to changes in the Company’s business environment. Executed cancellation of certain treasury stocks in accordance with acquisition. Resolved discontinuance of acquisition of own shares along with dividend cut as of November 9, 2016.
Acquisition of own shares
• Total acquisition number of shares: 2,156,500 shares (43.1% of number of shares
resolved in May, equivalent of 1.33% for outstanding shares)
• Total acquisition cost: 7.52 bn JPY
• Acquisition period: From May 12, 2016 May 12, 2016 to September 2, 2016
Cancellation of treasury stock
• Total number of shares cancelled: 2,500,000 shares (equivalent of 1.48% for outstanding
shares)
• Date of cancellation: May 25, 2016
All Rights Reserved. Copyright © 2016 Wacom Co., Ltd. 52
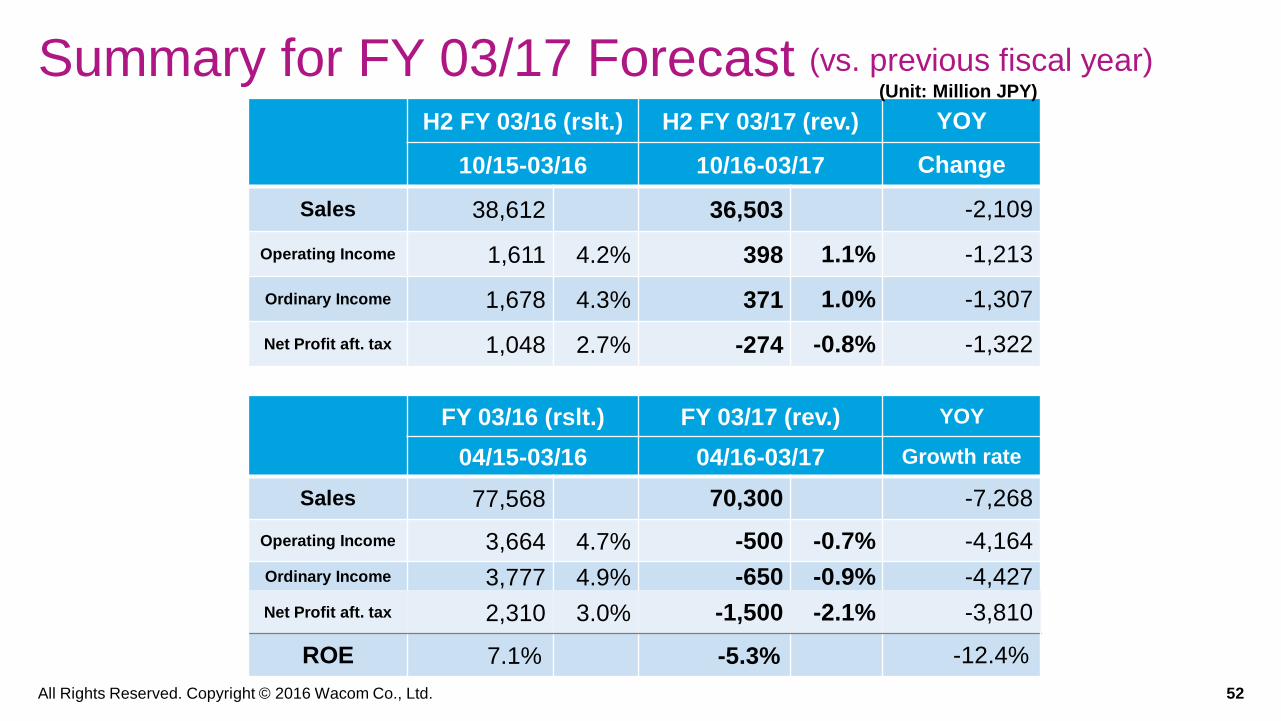
Summary for FY 03/17 ForecastH2 FY 03/16 (rslt.) H2 FY 03/17 (rev.) YOY
10/15-03/16 10/16-03/17 Change
Sales 38,612 36,503 -2,109
Operating Income 1,611 4.2% 398 1.1% -1,213
Ordinary Income 1,678 4.3% 371 1.0% -1,307
Net Profit aft. tax 1,048 2.7% -274 -0.8% -1,322
FY 03/16 (rslt.) FY 03/17 (rev.) YOY
04/15-03/16 04/16-03/17 Growth rate
Sales 77,568 70,300 -7,268
Operating Income 3,664 4.7% -500 -0.7% -4,164
Ordinary Income 3,777 4.9% -650 -0.9% -4,427
Net Profit aft. tax 2,310 3.0% -1,500 -2.1% -3,810
ROE 7.1% -5.3% -12.4%
(Unit: Million JPY)
(vs. previous fiscal year)

All Rights Reserved. Copyright © 2016 Wacom Co., Ltd. 53
(Note) Due to risks and uncertainties involved in the forecast of customer demand and market in Technology Solution Business,
actual results may materially differ from forward-looking statements in the short term.
Forecast by Business Segment
FY 3/16 (rslt.) FY 3/17 (rev.) YOY Change
04/15-03/16 04/16-03/17 Amount Ratio
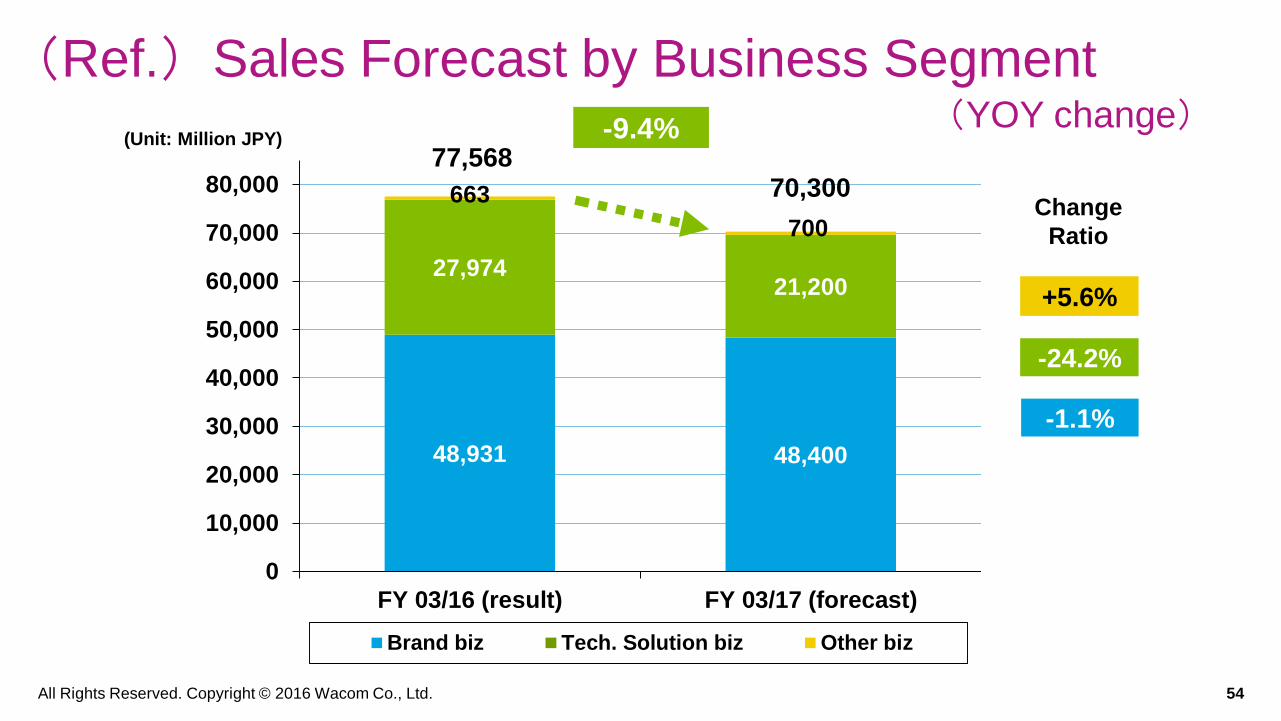
Net Sales 77,568 70,300 -7,268 -9.4%
Brand biz 48,931 48,400 -531 -1.1%
Tech. Solution biz 27,974 21,200 -6,774 -24.2%
Other biz 663 700 37 5.6%
Operating Income 3,664 -500 -4,164 --
Brand biz 8,036 7,300 -736 -9.2%
Tech. Solution biz 3,130 900 -2,230 -71.2%
Other biz 36 100 64 --
Corp. and others -7,538 -8,800 -1,262 16.8%
profit margin % 4.7% -0.7%
(Unit: Mil JPY)
(vs. previous fiscal year)
All Rights Reserved. Copyright © 2016 Wacom Co., Ltd. 54
(Ref.)Sales Forecast by Business Segment
48,931 48,400
27,97421,200
663
700
0
10,000
20,000
30,000
40,000
50,000
60,000
70,000
80,000
FY 03/16 (result) FY 03/17 (forecast)
Brand biz Tech. Solution biz Other biz
+5.6%
-1.1%
-24.2%
-9.4%77,568
70,300
(Unit: Million JPY)
Change
Ratio
(YOY change)
All Rights Reserved. Copyright © 2016 Wacom Co., Ltd. 55
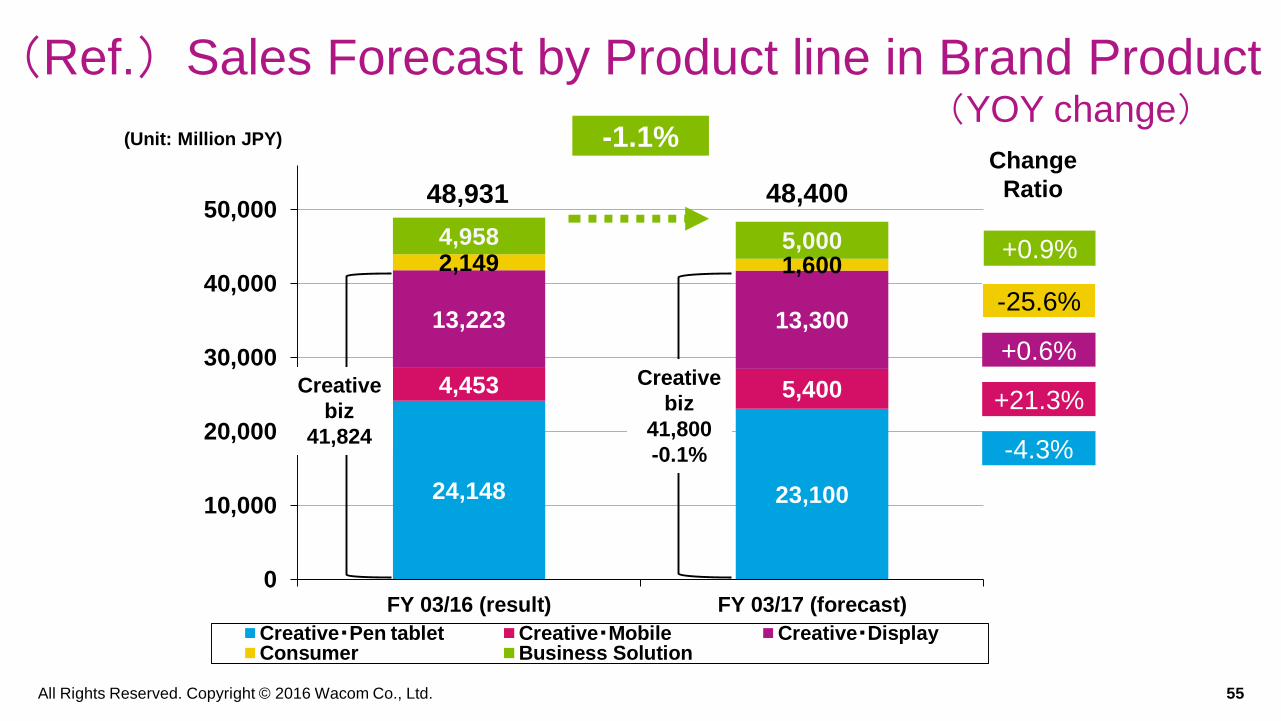
(Ref.)Sales Forecast by Product line in Brand Product
24,148 23,100
4,453 5,400
13,223 13,300
2,149 1,600
4,958 5,000
0
10,000
20,000
30,000
40,000
50,000
FY 03/16 (result) FY 03/17 (forecast)
Creative・Pen tablet Creative・Mobile Creative・DisplayConsumer Business Solution
-25.6%
+21.3%
-4.3%
+0.6%
+0.9%
48,931
-1.1%
48,400
Creative
biz
41,800
-0.1%
(Unit: Million JPY)
Change
Ratio
(YOY change)
Creative
biz
41,824

All Rights Reserved. Copyright © 2016 Wacom Co., Ltd. 56
(Ref.)Sales Forecast by Product line in Tech. Solution
16,353
10,500
9,532
9,300
2,089
1,400
0
5,000
10,000
15,000
20,000
25,000
FY 03/16 (result) FY 03/17 (forecast)
Pen for Smartphone Pen for Tablet Pen for Notebook PC, etc.
-33.0%
-2.4%
-35.8%
21,200
27,974-24.2%
(YOY change)(Unit: Million JPY)
Change
Ratio

All Rights Reserved. Copyright © 2016 Wacom Co., Ltd. 57
(Ref.)Sales Forecast by Region
27,97421,200
7,914
8,480
15,631
14,400
14,845
14,680
11,204
11,540
0
10,000
20,000
30,000
40,000
50,000
60,000
70,000
80,000
FY 03/16 (result) FY 03/17 (forecast)
Tech. Solution Japan U.S. Germany Asia Oceania
+3.0%
-7.9%
+7.2%
-24.2%
-1.1%
77,568
-9.4%
70,300
(YOY change)
(Unit: Million JPY)Change
Ratio
(Note) There are no regional segments in the Tech. Solution Biz.

Wacom Strategic Business Plan
SBP-2019Evolve the business model toward mobile and
Cloud for reaching new customers as well as
expanding existing business. In addition, improve
the speed and profitability by leveraging our global
business infrastructure.
Financial Goals by FY ending March, 2019
• Consolidated sales: 120 billion JPY
• Consolidated operating profit margin: 12%
• Consolidated ROE: 20% or higher
We proceed to review and revise the
plan, as we have difficulty to accomplish
its financial goal by March 2019.

All Rights Reserved. Copyright © 2016 Wacom Co., Ltd. 59
SBP-2019 Basic Strategy
Evolve the business toward mobile, Cloud and ecosystems.
Accelerate the growth with a new global business organization and enhanced global integration.
Accelerate creative business with mobile product line expansion, 3D penetration and emerging market investment.
Reach new consumer users with Digital Stationery and Cloud.
Expand the Technology Solution Business with AES and WILL (Wacom Ink Layer Language).
Enhance business workflow and security solutions by leveraging WILL and digital signature solutions.
Leverage global business system for efficiency, speed and profitability.

All Rights Reserved. Copyright © 2016 Wacom Co., Ltd. 60
our vision

All Rights Reserved. Copyright © 2016 Wacom Co., Ltd. 61our mission

DisclaimerForward-looking statements regarding future events and
performance contained in this presentation are based on currently
available information and involve risks and uncertainties, including
macroeconomic conditions, trends of the industry in which the
company is engaged and progress in new technologies. Please
note that actual results could materially differ from those expressed
or implied by the forward-looking statements in this presentation
due to these risks and uncertainties.
Investor Relations Inquiries
TEL: +81-3-5337-6502 FAX: +81-3-5337-6519
Wacom Co., Ltd.
Sumitomo Fudosan Shinjuku Grand Tower 31F,
8-17-1 Nishi-Shinjuku, Shinjuku-ku, Tokyo
160-6131, Japan
Wacom Co., Ltd.
http://www.wacom.com