Business processes of the layered S-DWH … · miscoding. It can also be referred to as input data...
15
1 1.4 Business processes of the layered S-DWH The layered architecture vision was mentioned in introduction. In this sub-chapter we identify the business processes for each layer; the ground level corresponds to the area where the external sources are incoming and interfaced, while the top of the pile is where aggregated, or deliverable, data are available for external users. In the intermediate layers we manage the ETL functions for uploading the DWH in which are carried out strategic analysis, data mining and design, for possible new strategies or data re-use. This will reflect a conceptual organization in which we will consider the first two levels as pure statistical operational infrastructures. In these first two levels necessary information is produced and functions like acquiring, storing, coding, checking, imputing, editing and validating data are performed. We consider the last two layers as the effective data warehouse, i.e. levels in which data are accessible for execute analysis, re-use of data and perform reporting. These four levels are described in figure 1. Figure 1. Business processes for layer architecture The core of the S-DWH system is the interpretation and analysis layer, this is the effective data warehouse and must support all kinds of statistical analysis or data mining, on micro and macro data, in order to support statistical design, data re-use or real-time quality checks during productions. The layers II and III are reciprocally functional to each other (Figure 2). Layer II always prepare the elaborated information for the layer III: from raw data, just uploaded into the S-DWH and not yet included in a production process, to micro/macro statistical data at any elaboration step of any production processes. Otherwise in layer III it must be possible to easily access and analyse this micro/macro elaborated data of the production processes in any state of elaboration, from raw data to cleaned and validate micro data. This because, in layer III methodologists should correct possible operational elaboration mistakes before, during and after any statistical production line, or design new elaboration processes for new surveys. In this way the new concept or strategy can generate a feedback toward layer II which is able to correct, or increase the quality, of the regular production lines. SOURCES LAYER INTEGRATION LAYER INTERPRETATION AND ANALYSIS LAYER ACCESS LAYER produce the necessary information new outputs perform reporting re-use data to create new data execute analysis
Transcript of Business processes of the layered S-DWH … · miscoding. It can also be referred to as input data...

1
1.4 Business processes of the layered S-DWH The layered architecture vision was mentioned in introduction. In this sub-chapter we identify the
business processes for each layer; the ground level corresponds to the area where the external sources
are incoming and interfaced, while the top of the pile is where aggregated, or deliverable, data are
available for external users. In the intermediate layers we manage the ETL functions for uploading the
DWH in which are carried out strategic analysis, data mining and design, for possible new strategies
or data re-use.
This will reflect a conceptual organization in which we will consider the first two levels as pure
statistical operational infrastructures. In these first two levels necessary information is produced and
functions like acquiring, storing, coding, checking, imputing, editing and validating data are performed.
We consider the last two layers as the effective data warehouse, i.e. levels in which data are accessible
for execute analysis, re-use of data and perform reporting. These four levels are described in figure 1.
Figure 1. Business processes for layer architecture
The core of the S-DWH system is the interpretation and analysis layer, this is the effective data
warehouse and must support all kinds of statistical analysis or data mining, on micro and macro data,
in order to support statistical design, data re-use or real-time quality checks during productions.
The layers II and III are reciprocally functional to each other (Figure 2). Layer II always prepare the
elaborated information for the layer III: from raw data, just uploaded into the S-DWH and not yet
included in a production process, to micro/macro statistical data at any elaboration step of any
production processes. Otherwise in layer III it must be possible to easily access and analyse this
micro/macro elaborated data of the production processes in any state of elaboration, from raw data
to cleaned and validate micro data. This because, in layer III methodologists should correct possible
operational elaboration mistakes before, during and after any statistical production line, or design
new elaboration processes for new surveys. In this way the new concept or strategy can generate a
feedback toward layer II which is able to correct, or increase the quality, of the regular production
lines.
SOURCES LAYER
INTEGRATION LAYER
INTERPRETATION AND ANALYSIS LAYER
ACCESS LAYER
produce the necessary information
new outputs perform reporting
re-use data to create new dataexecute analysis
2
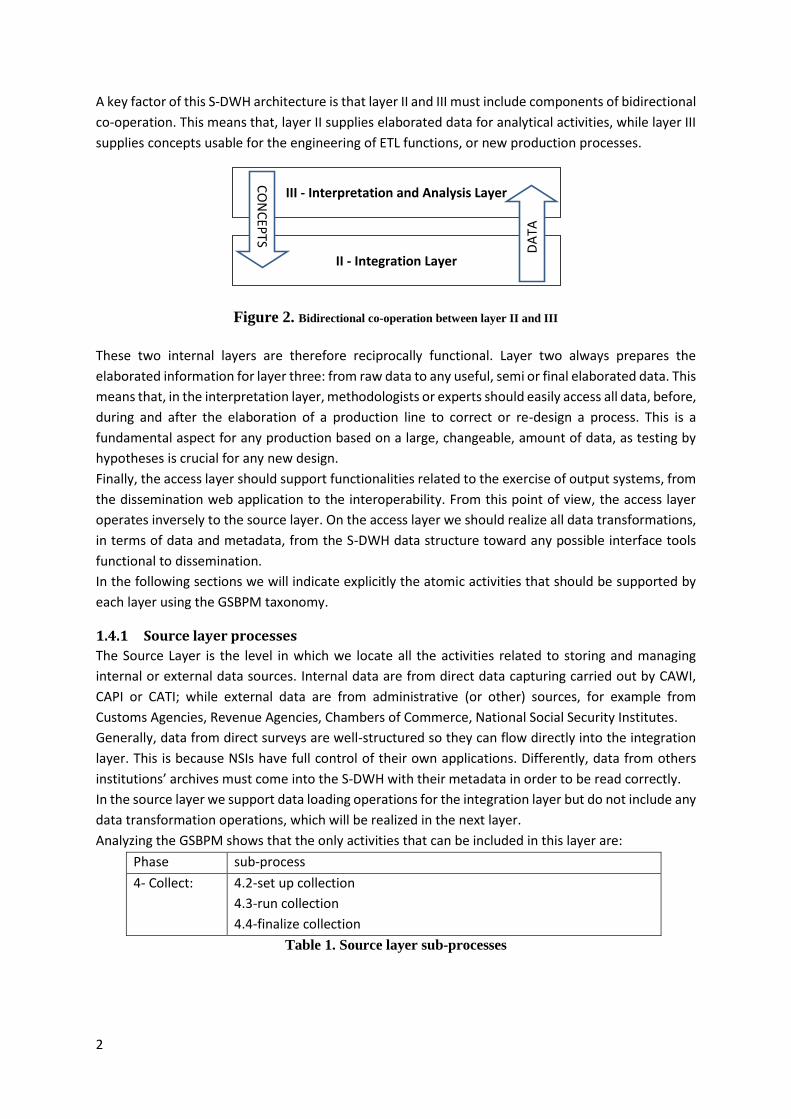
A key factor of this S-DWH architecture is that layer II and III must include components of bidirectional
co-operation. This means that, layer II supplies elaborated data for analytical activities, while layer III
supplies concepts usable for the engineering of ETL functions, or new production processes.
Figure 2. Bidirectional co-operation between layer II and III
These two internal layers are therefore reciprocally functional. Layer two always prepares the
elaborated information for layer three: from raw data to any useful, semi or final elaborated data. This
means that, in the interpretation layer, methodologists or experts should easily access all data, before,
during and after the elaboration of a production line to correct or re-design a process. This is a
fundamental aspect for any production based on a large, changeable, amount of data, as testing by
hypotheses is crucial for any new design.
Finally, the access layer should support functionalities related to the exercise of output systems, from
the dissemination web application to the interoperability. From this point of view, the access layer
operates inversely to the source layer. On the access layer we should realize all data transformations,
in terms of data and metadata, from the S-DWH data structure toward any possible interface tools
functional to dissemination.
In the following sections we will indicate explicitly the atomic activities that should be supported by
each layer using the GSBPM taxonomy.
1.4.1 Source layer processes
The Source Layer is the level in which we locate all the activities related to storing and managing
internal or external data sources. Internal data are from direct data capturing carried out by CAWI,
CAPI or CATI; while external data are from administrative (or other) sources, for example from
Customs Agencies, Revenue Agencies, Chambers of Commerce, National Social Security Institutes.
Generally, data from direct surveys are well-structured so they can flow directly into the integration
layer. This is because NSIs have full control of their own applications. Differently, data from others
institutions’ archives must come into the S-DWH with their metadata in order to be read correctly.
In the source layer we support data loading operations for the integration layer but do not include any
data transformation operations, which will be realized in the next layer.
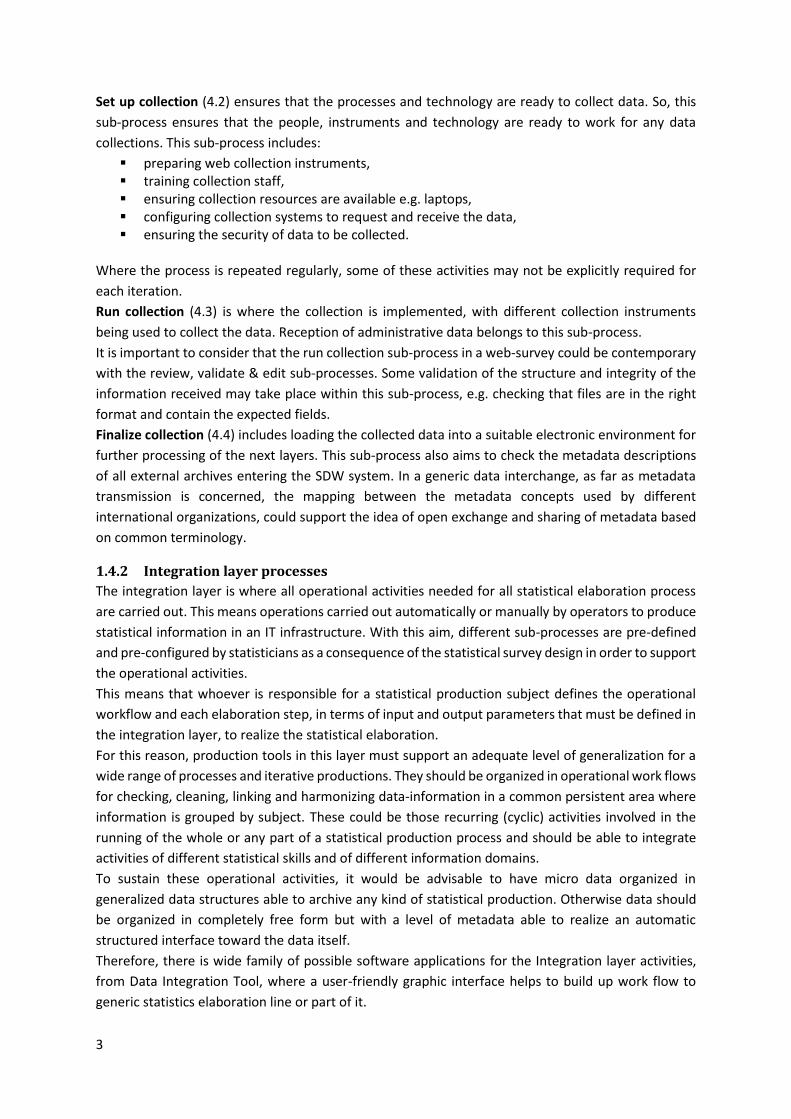
Analyzing the GSBPM shows that the only activities that can be included in this layer are:
Phase sub-process
4- Collect: 4.2-set up collection
4.3-run collection
4.4-finalize collection
Table 1. Source layer sub-processes
II - Integration Layer
III - Interpretation and Analysis Layer
DA
TAC
ON
CEP
TS
3
Set up collection (4.2) ensures that the processes and technology are ready to collect data. So, this
sub-process ensures that the people, instruments and technology are ready to work for any data
collections. This sub-process includes:
preparing web collection instruments, training collection staff, ensuring collection resources are available e.g. laptops, configuring collection systems to request and receive the data, ensuring the security of data to be collected.
Where the process is repeated regularly, some of these activities may not be explicitly required for
each iteration.
Run collection (4.3) is where the collection is implemented, with different collection instruments
being used to collect the data. Reception of administrative data belongs to this sub-process.
It is important to consider that the run collection sub-process in a web-survey could be contemporary
with the review, validate & edit sub-processes. Some validation of the structure and integrity of the
information received may take place within this sub-process, e.g. checking that files are in the right
format and contain the expected fields.
Finalize collection (4.4) includes loading the collected data into a suitable electronic environment for
further processing of the next layers. This sub-process also aims to check the metadata descriptions
of all external archives entering the SDW system. In a generic data interchange, as far as metadata
transmission is concerned, the mapping between the metadata concepts used by different
international organizations, could support the idea of open exchange and sharing of metadata based
on common terminology.
1.4.2 Integration layer processes
The integration layer is where all operational activities needed for all statistical elaboration process
are carried out. This means operations carried out automatically or manually by operators to produce
statistical information in an IT infrastructure. With this aim, different sub-processes are pre-defined
and pre-configured by statisticians as a consequence of the statistical survey design in order to support
the operational activities.
This means that whoever is responsible for a statistical production subject defines the operational
workflow and each elaboration step, in terms of input and output parameters that must be defined in
the integration layer, to realize the statistical elaboration.
For this reason, production tools in this layer must support an adequate level of generalization for a
wide range of processes and iterative productions. They should be organized in operational work flows
for checking, cleaning, linking and harmonizing data-information in a common persistent area where
information is grouped by subject. These could be those recurring (cyclic) activities involved in the
running of the whole or any part of a statistical production process and should be able to integrate
activities of different statistical skills and of different information domains.
To sustain these operational activities, it would be advisable to have micro data organized in
generalized data structures able to archive any kind of statistical production. Otherwise data should
be organized in completely free form but with a level of metadata able to realize an automatic
structured interface toward the data itself.
Therefore, there is wide family of possible software applications for the Integration layer activities,
from Data Integration Tool, where a user-friendly graphic interface helps to build up work flow to
generic statistics elaboration line or part of it.

4
In this layer, we should include all the sub-processes of phase 5 and one sub-process from phase 6 of
the GSBPM:
Phase sub-process
5- Process 5.1-integrate data
5.2-classify & code
5.3-review and validate
5.4-edit and impute
5.5-derive new variables and statistical units
5.6-calculate weights
5.7-calculate aggregates
5.8-finalize data files
6- Analyse 6.1-prepare draft outputs
Table 2. Integration layer sub-processes
Integrate data (5.1), this sub-process integrates data from one or more sources. Input data can be
from external or internal data sources and the result is a harmonized data set. Data integration
typically includes record linkage routines and prioritising, when two or more sources contain data for
the same variable (with potentially different values).
The integration sub-process includes micro data record linkage which can be realized before or after
any reviewing or editing, in function of the statistical process. At the end of each production process,
data organized by subject area should be clean and linkable.
Classify and code (5.2), this sub-process classifies and codes data. For example automatic coding
routines may assign numeric codes to text responses according to a pre-determined classification
scheme.
Review and validate (5.3), this sub-process applies to collected micro-data, and looks at each record
to try to identify potential problems, errors and discrepancies such as outliers, item non-response and
miscoding. It can also be referred to as input data validation. It may be run iteratively, validating data
against predefined edit rules, usually in a set order. It may raise alerts for manual inspection and
correction of the data. Reviewing and validating can apply to unit records both from surveys and
administrative sources, before and after integration.
Edit and impute (5.4), this sub-process refers to insertion of new values when data are considered
incorrect, missing or unreliable. Estimates may be edited or imputed, often using a rule-based
approach.
Derive new variables and statistical units (5.5), this sub-process in this layer describes the simple
function of the derivation of new variables and statistical units from existing data using logical rules
defined by statistical methodologists.
Calculate weights, (5.6), this sub process creates weights for unit data records according to the
defined methodology and is automatically applied for each iteration.
Calculate aggregates (5.7), this sub process creates already defined aggregate data from micro-data
for each iteration. Sometimes this may be an intermediate rather than a final activity, particularly for
business processes where there are strong time pressures, and a requirement to produce both
preliminary and final estimates.
Finalize data files (5.8), this sub-process brings together the results of the production process, usually
macro-data, which will be used as input for dissemination.
5
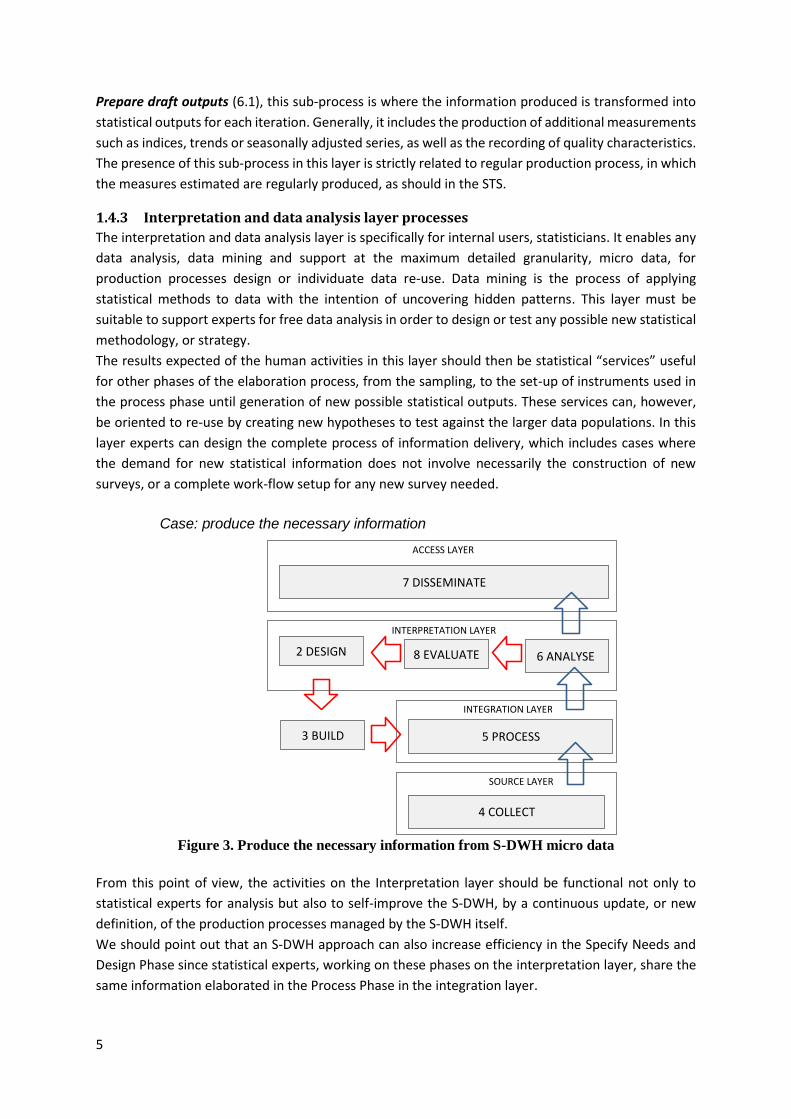
Prepare draft outputs (6.1), this sub-process is where the information produced is transformed into
statistical outputs for each iteration. Generally, it includes the production of additional measurements
such as indices, trends or seasonally adjusted series, as well as the recording of quality characteristics.
The presence of this sub-process in this layer is strictly related to regular production process, in which
the measures estimated are regularly produced, as should in the STS.
1.4.3 Interpretation and data analysis layer processes
The interpretation and data analysis layer is specifically for internal users, statisticians. It enables any
data analysis, data mining and support at the maximum detailed granularity, micro data, for
production processes design or individuate data re-use. Data mining is the process of applying
statistical methods to data with the intention of uncovering hidden patterns. This layer must be
suitable to support experts for free data analysis in order to design or test any possible new statistical
methodology, or strategy.
The results expected of the human activities in this layer should then be statistical “services” useful
for other phases of the elaboration process, from the sampling, to the set-up of instruments used in
the process phase until generation of new possible statistical outputs. These services can, however,
be oriented to re-use by creating new hypotheses to test against the larger data populations. In this
layer experts can design the complete process of information delivery, which includes cases where
the demand for new statistical information does not involve necessarily the construction of new
surveys, or a complete work-flow setup for any new survey needed.
Figure 3. Produce the necessary information from S-DWH micro data
From this point of view, the activities on the Interpretation layer should be functional not only to
statistical experts for analysis but also to self-improve the S-DWH, by a continuous update, or new
definition, of the production processes managed by the S-DWH itself.
We should point out that an S-DWH approach can also increase efficiency in the Specify Needs and
Design Phase since statistical experts, working on these phases on the interpretation layer, share the
same information elaborated in the Process Phase in the integration layer.
SOURCE LAYER
INTEGRATION LAYER
INTERPRETATION LAYER
ACCESS LAYER
4 COLLECT
7 DISSEMINATE
5 PROCESS
6 ANALYSE 2 DESIGN 8 EVALUATE
Case: produce the necessary information
3 BUILD

6
Figure 4. Re-use S-DWH microdata to create new information
The use of a data warehouse approach for statistical production has the advantage of forcing different
typologies of users to share the same information data. That is, the same stored-data are usable for
different statistical phases. Therefore, this layer supports any possible activities for new statistical
production strategies aimed at recovering facts from large administrative archives. This would create
more production efficiency and less of a statistical burden and production costs.
From the GSBPM then we consider:
1- Specify Needs: 1.5 - check data availability
2- Design: 2.1-design outputs
2.2-design variable descriptions
2.4-design frame and sample
2.5-design processing and analysis
2.6-design production systems and workflow
4- Collect: 4.1-create frame and select sample
5- Process 5.1-integrate data
5.5-derive new variables and units
5.6-calculate weights
5.7-calculate aggregates
6- Analyze 6.1-prepare draft outputs
6.2-validate outputs
6.3-interpret and explain outputs
6.4-apply disclosure control
6.5-finalise outputs
7- Disseminate 7.1-update output systems
8- Evaluate 8.1- gather evaluation inputs
8.2- conduct evaluation
Table 3. Interpretation and data analysis layer sub-processes
7
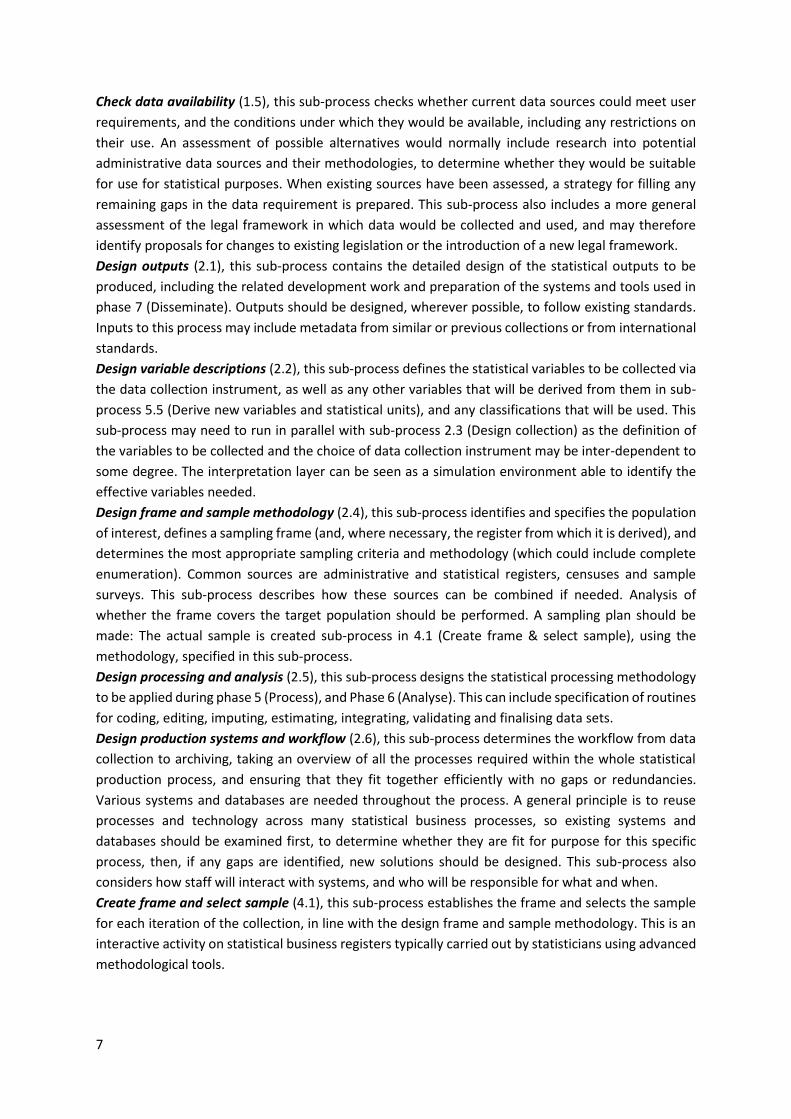
Check data availability (1.5), this sub-process checks whether current data sources could meet user
requirements, and the conditions under which they would be available, including any restrictions on
their use. An assessment of possible alternatives would normally include research into potential
administrative data sources and their methodologies, to determine whether they would be suitable
for use for statistical purposes. When existing sources have been assessed, a strategy for filling any
remaining gaps in the data requirement is prepared. This sub-process also includes a more general
assessment of the legal framework in which data would be collected and used, and may therefore
identify proposals for changes to existing legislation or the introduction of a new legal framework.
Design outputs (2.1), this sub-process contains the detailed design of the statistical outputs to be
produced, including the related development work and preparation of the systems and tools used in
phase 7 (Disseminate). Outputs should be designed, wherever possible, to follow existing standards.
Inputs to this process may include metadata from similar or previous collections or from international
standards.
Design variable descriptions (2.2), this sub-process defines the statistical variables to be collected via
the data collection instrument, as well as any other variables that will be derived from them in sub-
process 5.5 (Derive new variables and statistical units), and any classifications that will be used. This
sub-process may need to run in parallel with sub-process 2.3 (Design collection) as the definition of
the variables to be collected and the choice of data collection instrument may be inter-dependent to
some degree. The interpretation layer can be seen as a simulation environment able to identify the
effective variables needed.
Design frame and sample methodology (2.4), this sub-process identifies and specifies the population
of interest, defines a sampling frame (and, where necessary, the register from which it is derived), and
determines the most appropriate sampling criteria and methodology (which could include complete
enumeration). Common sources are administrative and statistical registers, censuses and sample
surveys. This sub-process describes how these sources can be combined if needed. Analysis of
whether the frame covers the target population should be performed. A sampling plan should be
made: The actual sample is created sub-process in 4.1 (Create frame & select sample), using the
methodology, specified in this sub-process.
Design processing and analysis (2.5), this sub-process designs the statistical processing methodology
to be applied during phase 5 (Process), and Phase 6 (Analyse). This can include specification of routines
for coding, editing, imputing, estimating, integrating, validating and finalising data sets.
Design production systems and workflow (2.6), this sub-process determines the workflow from data
collection to archiving, taking an overview of all the processes required within the whole statistical
production process, and ensuring that they fit together efficiently with no gaps or redundancies.
Various systems and databases are needed throughout the process. A general principle is to reuse
processes and technology across many statistical business processes, so existing systems and
databases should be examined first, to determine whether they are fit for purpose for this specific
process, then, if any gaps are identified, new solutions should be designed. This sub-process also
considers how staff will interact with systems, and who will be responsible for what and when.
Create frame and select sample (4.1), this sub-process establishes the frame and selects the sample
for each iteration of the collection, in line with the design frame and sample methodology. This is an
interactive activity on statistical business registers typically carried out by statisticians using advanced
methodological tools.

8
Sub process includes the coordination of samples between instances of the same statistical business
process (for example to manage overlap or rotation), and between different processes using a
common frame or register (for example to manage overlap or to spread response burden).
Integrate data (5.1), in this layer this sub-process makes it possible for experts to freely carry out
micro data record linkage from different information data sources when these refer to the same
statistical analysis unit.
In this layer this sub-process must be intended as an evaluation for the data linking design, wherever
needs.
Derive new variables and units (5.5), this sub-process derives variables and statistical units that are
not explicitly provided in the collection, but are needed to deliver the required outputs. In this layer
this function would be used to set up procedures or for defining the derivation roles applicable in each
production iteration. In this layer this sub-process must be intended as an evaluation for evaluation
on designing new variable.
Calculate weights (5.6), see chapter 1.4.2.
Calculate aggregates (5.7), see chapter 1.4.2.
Prepare draft outputs (6.1), in this layer this sub-process means the free construction of not regular
outputs.
Validate outputs (6.2), this sub-process is where statisticians validate the quality of the outputs
produced. Also this sub process is intended as a regular operational activity, and the validations are
carried out at the end of each iteration on an already defined quality framework.
Interpret and explain outputs (6.3) this sub-process is where the in-depth understanding of the
outputs is gained by statisticians. They use that understanding to interpret and explain the statistics
produced for this cycle by assessing how well the statistics reflect their initial expectations, viewing
the statistics from all perspectives using different tools and media, and carrying out in-depth statistical
analyses.
Apply disclosure control (6.4), this sub-process ensures that the data (and metadata) to be
disseminated do not breach the appropriate rules on confidentiality. This means the use of specific
methodological tools to check the primary and secondary disclosure
Finalise outputs (6.5), this sub-process ensures the statistics and associated information are fit for
purpose and reach the required quality level, and are thus ready for use.
Update output systems (7.1), this sub-process manages update to systems where data and metadata
are stored for dissemination purposes.
Gather evaluation inputs (8.1), evaluation material can be produced in any other phase or sub-
process. It may take many forms, including feedback from users, process metadata, system metrics
and staff suggestions. Reports of progress against an action plan agreed during a previous iteration
may also form an input to evaluations of subsequent iterations. This sub-process gathers all of these
inputs, and makes them available for the person or team producing the evaluation.
Conduct evaluation (8.2), this process analyses the evaluation inputs and synthesizes them into an
evaluation report. The resulting report should note any quality issues specific to this iteration of the
statistical business process, and should make recommendations for changes if appropriate. These
recommendations can cover changes to any phase or sub-process for future iterations of the process,
or can suggest that the process is not repeated.
9
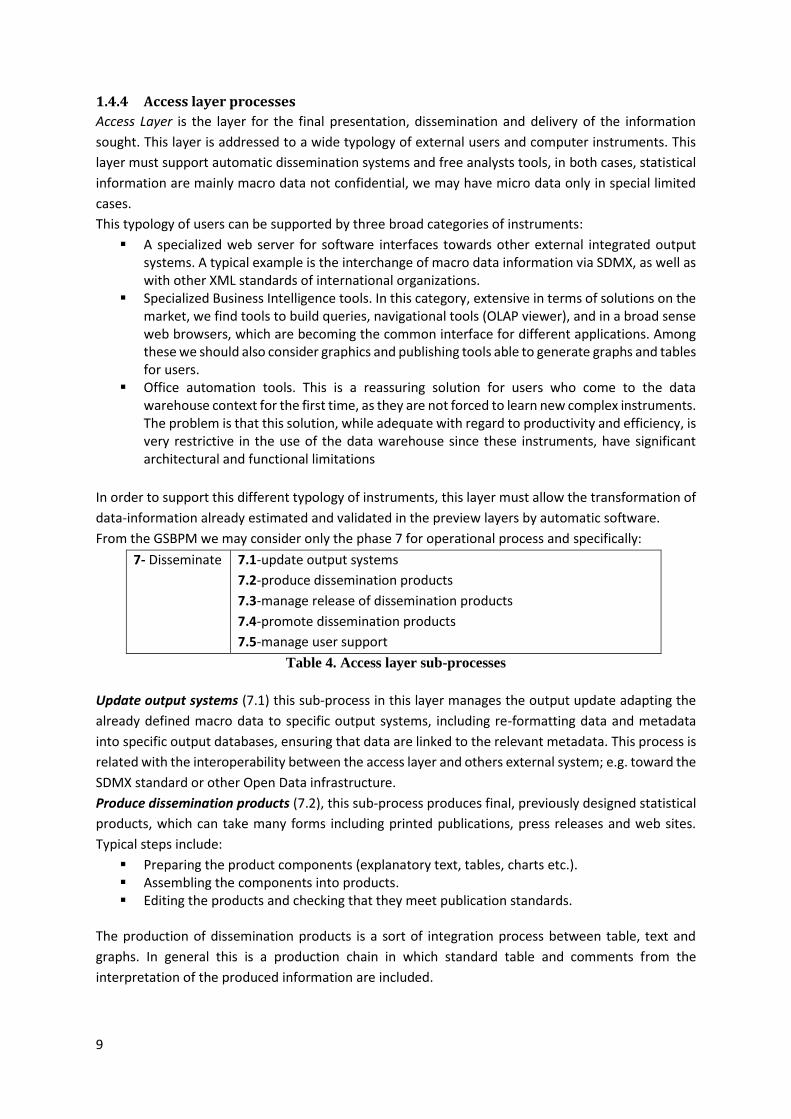
1.4.4 Access layer processes
Access Layer is the layer for the final presentation, dissemination and delivery of the information
sought. This layer is addressed to a wide typology of external users and computer instruments. This
layer must support automatic dissemination systems and free analysts tools, in both cases, statistical
information are mainly macro data not confidential, we may have micro data only in special limited
cases.
This typology of users can be supported by three broad categories of instruments:
A specialized web server for software interfaces towards other external integrated output systems. A typical example is the interchange of macro data information via SDMX, as well as with other XML standards of international organizations.
Specialized Business Intelligence tools. In this category, extensive in terms of solutions on the market, we find tools to build queries, navigational tools (OLAP viewer), and in a broad sense web browsers, which are becoming the common interface for different applications. Among these we should also consider graphics and publishing tools able to generate graphs and tables for users.
Office automation tools. This is a reassuring solution for users who come to the data warehouse context for the first time, as they are not forced to learn new complex instruments. The problem is that this solution, while adequate with regard to productivity and efficiency, is very restrictive in the use of the data warehouse since these instruments, have significant architectural and functional limitations
In order to support this different typology of instruments, this layer must allow the transformation of
data-information already estimated and validated in the preview layers by automatic software.
From the GSBPM we may consider only the phase 7 for operational process and specifically:
7- Disseminate 7.1-update output systems
7.2-produce dissemination products
7.3-manage release of dissemination products
7.4-promote dissemination products
7.5-manage user support
Table 4. Access layer sub-processes
Update output systems (7.1) this sub-process in this layer manages the output update adapting the
already defined macro data to specific output systems, including re-formatting data and metadata
into specific output databases, ensuring that data are linked to the relevant metadata. This process is
related with the interoperability between the access layer and others external system; e.g. toward the
SDMX standard or other Open Data infrastructure.
Produce dissemination products (7.2), this sub-process produces final, previously designed statistical
products, which can take many forms including printed publications, press releases and web sites.
Typical steps include:
Preparing the product components (explanatory text, tables, charts etc.). Assembling the components into products. Editing the products and checking that they meet publication standards.
The production of dissemination products is a sort of integration process between table, text and
graphs. In general this is a production chain in which standard table and comments from the
interpretation of the produced information are included.
10
Manage release of dissemination products (7.3), this sub-process ensures that all elements for the
release are in place including managing the timing of the release. It includes briefings for specific
groups such as the press or ministers, as well as the arrangements for any pre-release embargoes. It
also includes the provision of products to subscribers.
Promote dissemination products (7.4), this sub-process concerns the active promotion of the
statistical products produced in a specific statistical business process, to help them reach the widest
possible audience. It includes the use of customer relationship management tools, to better target
potential users of the products, as well as the use of tools including web sites, wikis and blogs to
facilitate the process of communicating statistical information to users.
Manage user support (7.5), this sub-process ensures that customer queries are recorded, and that
responses are provided within agreed deadlines. These queries should be regularly reviewed to
provide an input to the over-arching quality management process, as they can indicate new or
changing user needs.
1.4.5 Data linking process
The purpose of this section is to make overview on data linking in a Statistical Data Warehouse and to
mention problems that we can meet linking data from multiple sources. Data linking methods and
present guidelines about methodological challenges on data linking are discussed in methodological
Chapter.
The main goal of the S-DWH process is to increase the better use of data already exist in the National
Statistical institute. First and the main step in data linking process is to determine needs and check
data availability. It is considered to have all available data of interest in S-DWH.
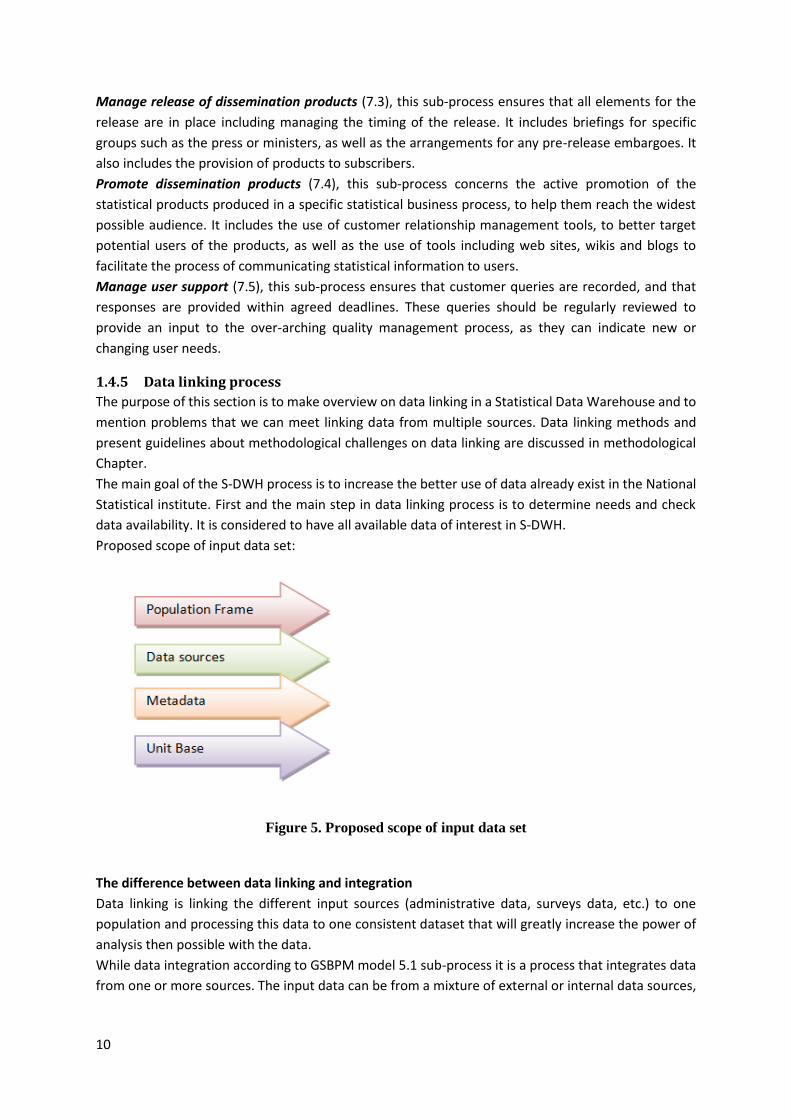
Proposed scope of input data set:
Figure 5. Proposed scope of input data set
The difference between data linking and integration
Data linking is linking the different input sources (administrative data, surveys data, etc.) to one
population and processing this data to one consistent dataset that will greatly increase the power of
analysis then possible with the data.
While data integration according to GSBPM model 5.1 sub-process it is a process that integrates data
from one or more sources. The input data can be from a mixture of external or internal data sources,
11
and a variety of collection modes, including extracts of administrative data. The result is a harmonized
data set. Data integration typically includes:
Matching / record linkage routines, with the aim of linking data from different sources, where those data refer to the same unit.
Prioritising, when two or more sources contain data for the same variable (with potentially different values).
Data integration may take place at any point in process phase, before or after any of the other sub-
processes. There may also be several instances of data integration in any statistical business process.
Following integration, depending on data protection requirements, data may be anonymized, that is
stripped of identifiers such as name and address, to help to protect confidentiality.
Data integration process put data from disparate sources into a consistent format. Must be resolved
such problems as naming conflicts and inconsistencies among units of measure. When this is achieved,
data are said to be integrated.
Data integration is a big opportunity for NSIs, it opening up possibilities for reducing costs, leads to
reduced survey burden on respondents and may increase data quality. But also it is a big challenge, a
lot of preparatory work must be done by NSIs, should be examined the data sources, the metadata
should be defined before linking data. There are a lot of issues and questions that should be analysed
and answered in order to create fully integrated data sets for enterprise and trade statistics at micro
level.
If the data include error-free and unique common identifiers as a unique identification code of the
legal entity or a social security number, record linkage is a simple file merge operation which can be
done by any standard database management system. In other cases it is necessary to resort to a
combination of ambiguous and error-prone identifiers as surnames, names, address, NACE code
information. Data quality problems of such identifiers usually yield a considerable amount of
unlinkable cases. In this situation the use of much more sophisticated techniques and specialised
record linkage software is inevitable. These techniques are discussed in methodological Chapter.
In a Data Warehouse system the Statistical Register has a crucial role in linking data from several
sources and defining the population for all statistical output.
The statistical unit base in business statistics
The statistical community should have the aim that all Member States use a unique identifier for
enterprises based on the statistical unit having the advantage that all data sources can be easily linked
to the statistical-DWH. In practice, data holders may use several definitions of enterprises in some
countries. As a result, several enterprises units may exist. Related to this, different definitions of units
may also exist when producing output (LKAU, KAU, etc.).
The relationship between the different in- and output units on the one hand and the statistical
enterprise units on the other hand should be known (or estimated) before the processing phase,
because it is a crucial step for data linking and producing output. Maintaining this relationship in a
database is recommended when outputs are produced by releases; e.g. newer more precise estimates
when more data (sources) become available. This prevents redoing a time-consuming linking process
at every flexible estimate.
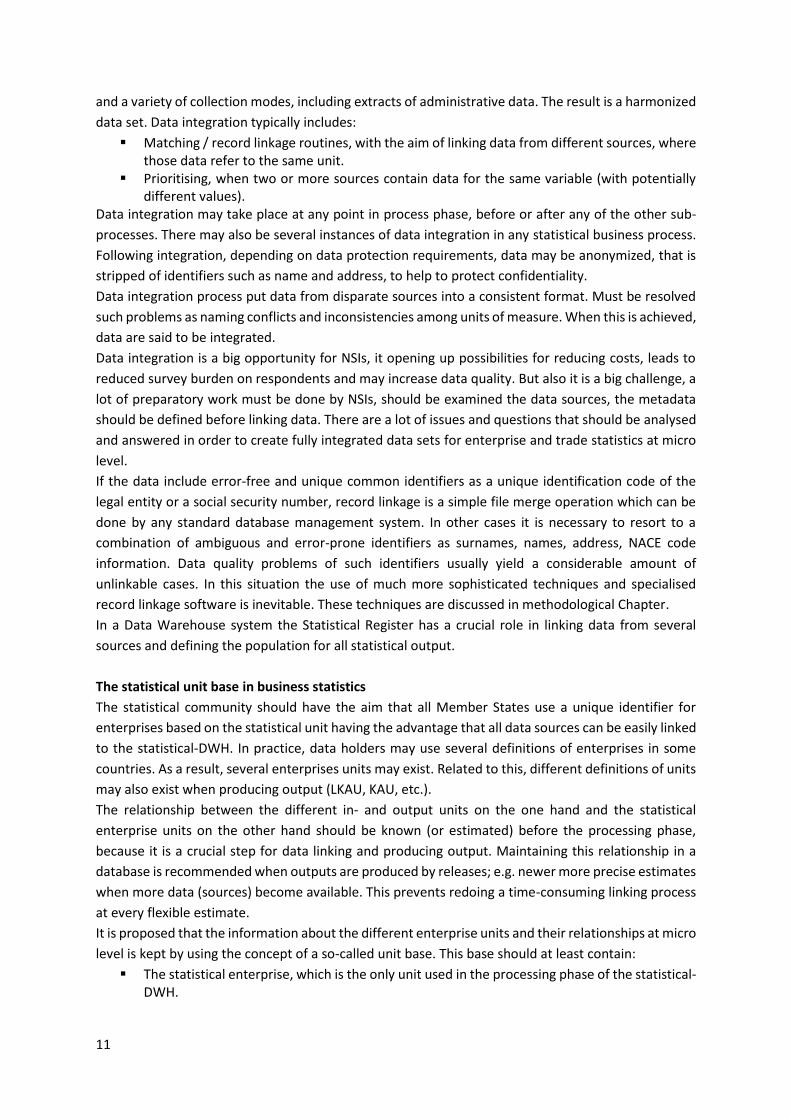
It is proposed that the information about the different enterprise units and their relationships at micro
level is kept by using the concept of a so-called unit base. This base should at least contain:
The statistical enterprise, which is the only unit used in the processing phase of the statistical-DWH.
12
The enterprise group, which is the unit for some output obligations. Moreover the enterprise group may be the base for tax and legal units, because in some countries, like the Netherlands, the enterprise unit is allowed to choose its own tax and legal units of the underlying enterprises.
The unit base contains the link between the statistical enterprise, the enterprise group and all other
units. Of course, it should also include the relationship between the enterprise group and the
statistical enterprise. In case of x-to-y relationships between the units, i.e. one statistical unit
corresponds with several units in another data source or vice versa, the estimated share in terms of
turnover (or employment) of the ‘data source’ units to the corresponding statistical enterprise(s) and
enterprise group needs to be mentioned. This share can be used to relate levels of variables from
other data sources based on enterprises unit x1 to levels of turnover and employment in the backbone
based on the (slightly different) statistical enterprise unit x2 . We refer to deliverable 2.4 of the ESSnet
on data warehousing1 for further information about data linking and estimating shares.
The unit base can be subdivided into ‘input’ units, used to link the different dataset to the statistical
enterprise unit at the beginning of the processing phase (GSBPM-step 5.1: “integrate data”) and
‘output’ unit used to produce output on units other than the statistical enterprise at the end of the
processing phase (GSBPM-step 5.5 “derive new variable and units”).
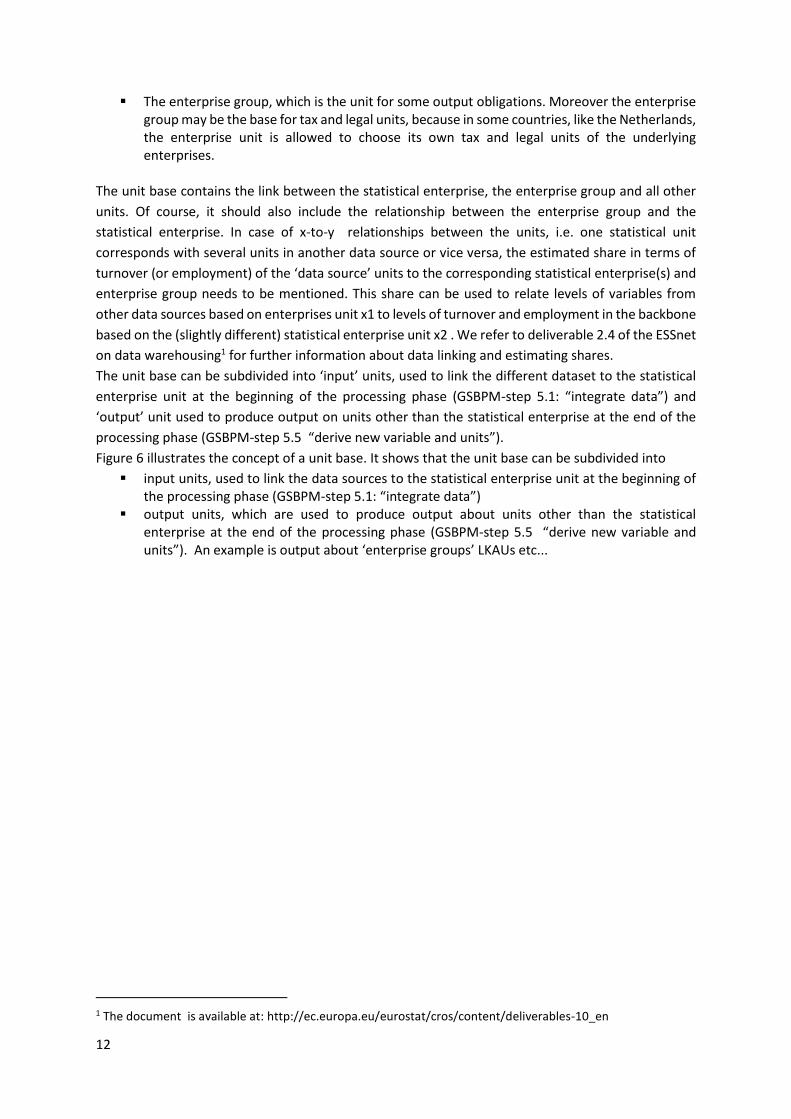
Figure 6 illustrates the concept of a unit base. It shows that the unit base can be subdivided into
input units, used to link the data sources to the statistical enterprise unit at the beginning of the processing phase (GSBPM-step 5.1: “integrate data”)
output units, which are used to produce output about units other than the statistical enterprise at the end of the processing phase (GSBPM-step 5.5 “derive new variable and units”). An example is output about ‘enterprise groups’ LKAUs etc...
1 The document is available at: http://ec.europa.eu/eurostat/cros/content/deliverables-10_en
13
Figure 6. Proposed scope of input data set
The exact contents of the unit base (and related to this its complexity) depends on
legislation for a particular country, output requirements and desired output of a statistical-DWH, available input data.
It is a matter of debate
whether the concept of a unit base should be included in the SBR or whether the concept of a unit base should result in a physically independent database.
In the case of the latter it is closely related to the SBR, because both contain the statistical enterprise.
Basically, the choice depends on the complexity of the unit base. If the unit base is complex, the
maintenance becomes more challenging and a separate unit base might be considered. The
complexity depends on
the number of enterprise unit in a country the number of (flexible) data sources an NSI uses to produce statistics.
As these factors differ by country and NSI, the decision to include or exclude the concept of a unit base
in the SBR depends on the individual NSI and won’t be discussed further in this paper. However, the
Unit Base is essential for data linking process. You need to have established links between data to
make the process of data integration fluid, accurate and quality assured.
Linking data sources to the statistical unit
When we are linking data from different sources like sample surveys, combined data and
administrative data we can meet such problems as data missing, data overlapping, “unlinked data”

14
etc. Errors might be detected in statistical units and target population when linking other data to this
information. And if these errors are influential they need to be corrected in the S-DWH.
The simplest and most transparent statistical process can be generated by
Linking all input sources to the statistical enterprise unit at the beginning of the processing phase (GSBPM-step 5.1).
Performing data cleaning, plausibility checks and data integration on statistical units only (GSBPM steps 5.2-5.5).
Producing statistical output (GSBPM-steps 5.7-5.8) by default on the statistical unit and the target populations according to the SBS and STS regulations. Flexible outputs on other target populations and other units are also produced in these steps by using repeated weighting techniques and/or domain estimates.
Note that it is theoretically possible to perform data analysis and data cleaning on several units
simultaneously. However, the experience of Statistics Netherlands with cleaning VAT-data on
statistical units and ‘implementing’ these changes on the original VAT-units too, reveal that the
statistical process becomes quite complex. Therefore, it is proposed that
linking to the statistical units is carried out at the beginning of the processing phase only, the creation of a fully integrated dataset is done for statistical units only, statistical estimates for other units are produced at the end of the processing phase only, relationships between the different in- and output units on the one hand and the statistical
enterprise units on the other hand should be known (or estimated) beforehand.
1.4.6 Correcting information in the population frame and feedback to Statistical register
The statistical register is the sampling frame for the surveys, which are an important data-source of
the statistical-DWH (for variables which cannot be derived from admin data). This point implies that
errors in the backbone source, which might be detected during the statistical process, should be
incorporated in the statistical register. Hence, a process to incorporate revised information from the
backbone in the statistical-DWH to the statistical register should be established. By not doing this, the
same errors will return in survey results in subsequent periods.
The key questions are:
At which step of the process of the statistical-DWH is the backbone corrected when errors are detected?
How is revised information from the backbone of integrated sources in the statistical-DWH incorporated in the statistical register?
Backbone should be corrected and the feedback to the statistical register should be provided in
parallel with the GSBPM sub-processes 5.7 and 5.8 after the GSBPM sub-processes 5.1-5.6 of the
process phase (GSBPM 5) in the integration layer are carried out. Deliverable 2.2.2 of the ESSnet of
data Warehousing2 addresses the question how this feedback process should be implemented in
case of S-DWH for business statistics and business register. Deliverable discusses also how the timing
of this feedback should be handled.
2 Deliverable WH-SGA2-WP2 - 2.2.2 Guidelines on how the BR interacts with the S-DWH is available on theCROS portal: http://ec.europa.eu/eurostat/cros/content/deliverables-10_en
15
in partnership with
Title: S-DWH Manual
Chapter: 1 Implementation - 1.4 Business processes of the
layered S-DWH
Version: Author: Date:
3.0 CoE on Data Warehousing 17 Nov 2016