Business Processes Analysis & Exchange Network Return on Investment Exchange Network Users Meeting...
23
Business Processes Analysis & Exchange Network Return on Investment Exchange Network Users Meeting Hilton San Francisco Hotel, Continental Ballroom April 18-19, 2006
-
date post
18-Dec-2015 -
Category
Documents
-
view
222 -
download
0
Transcript of Business Processes Analysis & Exchange Network Return on Investment Exchange Network Users Meeting...

Business Processes Analysis &
Exchange Network Return on Investment
Exchange Network Users MeetingHilton San Francisco Hotel, Continental BallroomApril 18-19, 2006

ROI for Exchange Network
Purposes EPA needs cost saving data to justify future EN funding States need cost data to show benefits prior to EN projects
ROI Project Results Investigate 5 data flows Develop a model to systematically quantify ROI values
Monetary values Qualitative improvements
Develop an Excel program that: Calculates ROI values for five data flows Extensible to accommodate different state IT project environments Screening tool for developing plans for EN projects

We Need Quantifiable Answers to These Questions ….
“What are either the benefits of, or compelling reasons for, electronic reporting (i.e., EN technologies)?”
“What percent of your target audience is using it?”
“Do you think you’ll see a return on your application development investment?”

ROI Project Objectives
1. analyze environmental business processes, 2. develop a reusable tool to model the return on
investment from implementing EN technologies,
3. develop a final report & guide describing the ROI model and its application for facility, state, & EPA applications, and
4. publicize economic benefits of implementing EN technologies

Data Flows
AQS - The Air Quality System DMR - Discharge Monitoring Reports RCRA - Resource Conservation and Recovery Act SDWIS - Safe Drinking Water Information System TRI - Toxics Release Inventory

Surveyed States
Michigan New Jersey Washington Pennsylvania

Site Visit Accomplishments Gather state information to verify the initial Model’s
Business Processes for the data flows (before & after EN) Operational scenario differences among different states Actual state values for ROI calcuations Improve the ROI model
Collect quantitative information regarding the cost of maintaining data flows
Use information gathered to assess the Return on Investment associated with the implementation of EN technology
Document qualitative improvements

ROI Model – Technical ProceduresBusiness Process Analysis
ROI Research
Cost Factors
Initial ROI Model
· Developed a diagram of each data flow’s business process
· Identified the cost factors of each step in each process
For each Cost Factor found in the Business Process Diagram, determine the following: · Input Parameters· Default Values· Assumptions
· Research other ROI Models· Determined that MI Evaluator
would be a suitable basis for the development of the ROI Model to be developed in this project
· Incorporate the Cost Factors (including all input parameters and default values) into the model
· Develop a Financial Model· Develop calculations
· ROI· Payback Period· Total Cost of Ownership
State Interviews
· Evaluate Business Processes· Investigate missing Cost
Factors· Collect actual state data· Refine default value
assumptions· Collection of Qualitative
Factors
1
2
Final ROI Model
Revise Initial Model based on site visits· Add/remove cost factors· Increase usability· Change analysis boundary
3
4
5
6
7
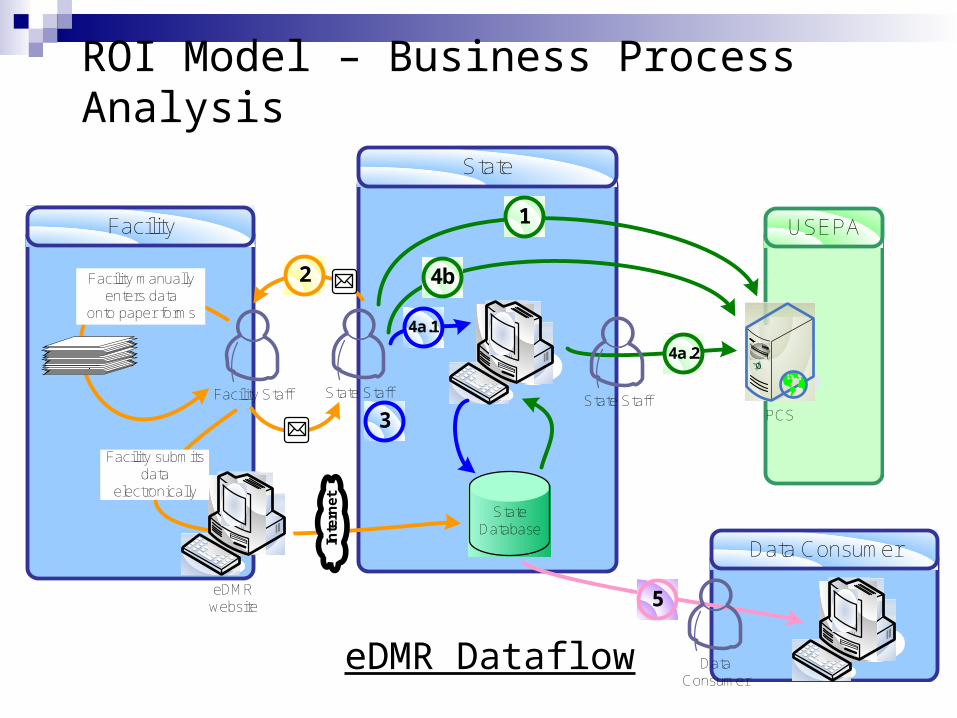
Facility USEPA
State
Facility Staff State Staff
2
3
`
4a.1
4a.2
PCSState Staff
StateDatabase
`
eDMR website
In
tern
et
Data Consumer
`
5
Data Consumer
Facility manuallyenters data
onto paper forms
1
4b
Facility submits data
electronically
ROI Model – Business Process Analysis
eDMR Dataflow

ROI Model – ROI Factors & Input Parameters
eDMR Pre Exchange Network Key Factor Description
State makes the blank submission DMRs available to the facility. They either mail blank copies to the facility or make them available online. Input parameters: a. Hourly rate of state staff
($/hr) The hourly rate each state staff earns (including all benefits and indirect costs)
b. Time spent preparing mailings (hr/year)
The time it takes state staff to prepare blank DMR forms to be mailed to the facilities.
c. Cost of mailing ($/mailing) The cost to mail each package of DMRs to the facility
d. Number of mailings sent by the state
The total number of mailings sent to the facility each year.
e. Average amount of lost mail.
The percentage of DMRs lost in the mail
2 Sending blank DMR forms (from the state to the facility)
Equation: Annual mail preparation cost ($) = (a*b)*(1+e) Annual postage cost ($) = (c*d)*(1+e)

ROI Model – State Survey
State Survey is divided into 3 sections Business Process Analysis – Verify the business
processes associated with each data flow (including all potential cost factors and various operational scenarios for every state)
Assessment of State Costs – Determine cost estimates for each ROI factor (step in the business process)
Qualitative Factors Survey – Determine what qualitative benefits are associated with the project
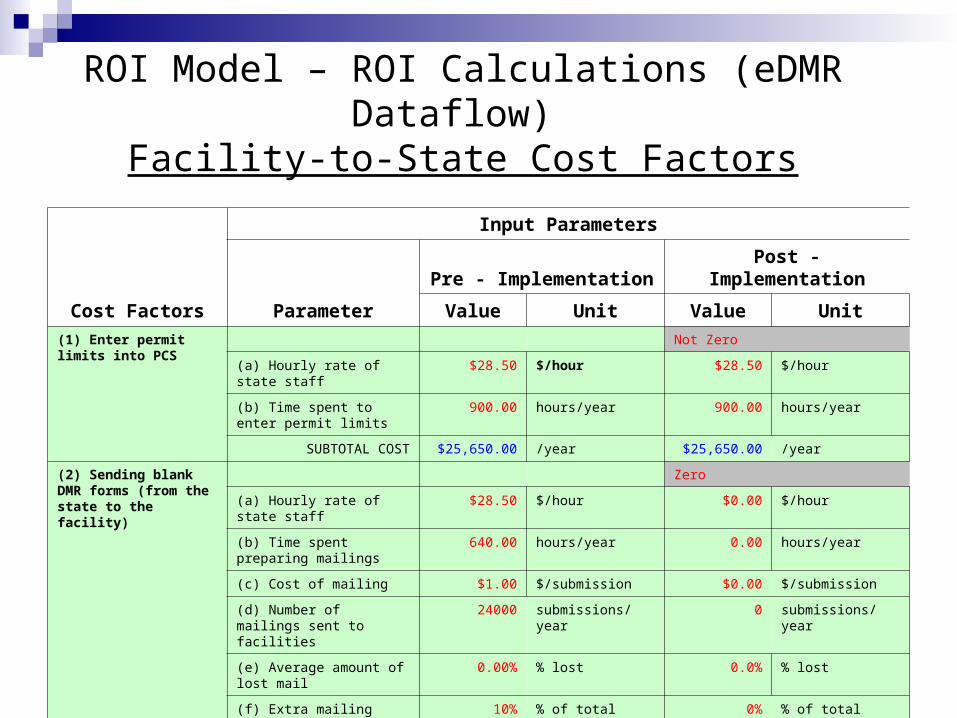
ROI Model – ROI Calculations (eDMR Dataflow) Facility-to-State Cost Factors
Cost Factors
Input Parameters
Parameter
Pre - Implementation Post - Implementation
Value Unit Value Unit
(1) Enter permit limits into PCS
Not Zero
(a) Hourly rate of state staff $28.50 $/hour $28.50 $/hour
(b) Time spent to enter permit limits
900.00 hours/year 900.00 hours/year
SUBTOTAL COST $25,650.00 /year $25,650.00 /year
(2) Sending blank DMR forms (from the state to the facility)
Zero
(a) Hourly rate of state staff $28.50 $/hour $0.00 $/hour
(b) Time spent preparing mailings
640.00 hours/year 0.00 hours/year
(c) Cost of mailing $1.00 $/submission $0.00 $/submission
(d) Number of mailings sent to facilities
24000 submissions/year 0 submissions/year
(e) Average amount of lost mail
0.00% % lost 0.0% % lost
(f) Extra mailing 10% % of total mailing 0% % of total mailing
SUBTOTAL COST $46,464.00 /year $0.00 /year

Cost Factors
Input Parameters
Parameter
Pre - Implementation Post - Implementation
Value Unit Value Unit
(3) Processing of paper submissions
Zero
(a) Hourly rate of state staff $47,840.00 $/year $0.00 $/hour
(b) Total Processing Time 200.00 hours/year 0.00 hours/year
SUBTOTAL COST $4,600.00 /year $0.00 /year
(4a.1) Data entry cost (by state)
Zero
(a) Hourly rate of state staff $30.00 $/hour $0.00 $/hour
(b) Number of DMRs/year 24000 DMRs/year 0 DMRs/year
(c) Time spent - enter each DMR 1.5 hours/DMR 0 hours/DMR
(d) Accuracy of data entry 98% % entered correct 0.0% % entered correct
SUBTOTAL COST $1,101,600.00 /year $0.00 /year
(5) Data usage cost to respond to inquiries and additional data analyses
Zero
(a) Hourly rate of state staff $35.00 $/hour $0.00 $/hour
(b) Time to enter data 16 hours/permit 0 hours/permit
(c) # of permits data entered 80 permits/year 0 permits/year
SUBTOTAL COST $44,800.00 /year $0.00 /year
Facility to State Total $1,223,114.00 /year $25,650.00 /year
ROI Model – ROI Calculations (eDMR Dataflow) Facility-to-State Cost Factors
Cost Factors
Input Parameters
Parameter
Pre - Implementation Post - Implementation
Value Unit Value Unit
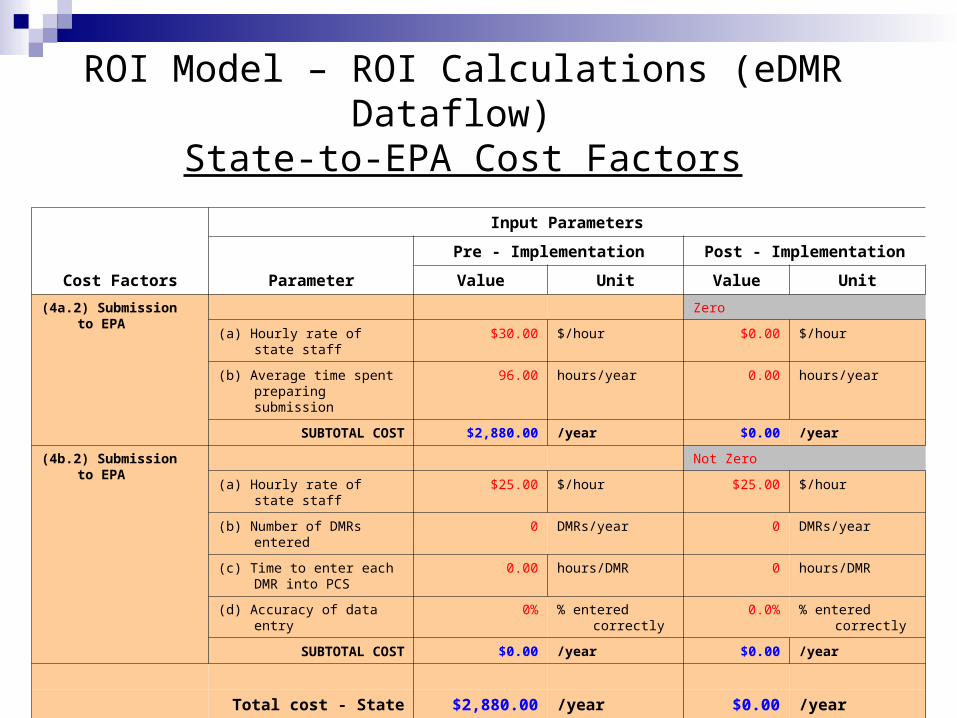
(4a.2) Submission to EPA
Zero
(a) Hourly rate of state staff $30.00 $/hour $0.00 $/hour
(b) Average time spent preparing submission
96.00 hours/year 0.00 hours/year
SUBTOTAL COST $2,880.00 /year $0.00 /year
(4b.2) Submission to EPA
Not Zero
(a) Hourly rate of state staff $25.00 $/hour $25.00 $/hour
(b) Number of DMRs entered 0 DMRs/year 0 DMRs/year
(c) Time to enter each DMR into PCS
0.00 hours/DMR 0 hours/DMR
(d) Accuracy of data entry 0% % entered correctly 0.0% % entered correctly
SUBTOTAL COST $0.00 /year $0.00 /year
Total cost - State to EPA $2,880.00 /year $0.00 /year
Total Cost Pre-EN: $1,225,994 /year $25,650 /year
ROI Model – ROI Calculations (eDMR Dataflow) State-to-EPA Cost Factors

Project Implementation Cost Factors
Input Parameters
ParameterValue
State to EPA (Node)
Platform Java
Database Oracle
Server Hardware $30,000
Software Operating System $0
Database Software $25,000
Node Software $45,000
Node Implementation $100,000
(a) TOTAL NODE COST $200,000
(b) How many data flows will be sharing this node by the end of the next three years? 15
(c) What was the eDMR specific implementation cost (to plug in the eDMR data flow)? $130,000
SUBTOTAL COST $143,333
Total EN Implementation Cost: $143,333
ROI Model – ROI Calculations (eDMR Dataflow) Implementation Cost Factors
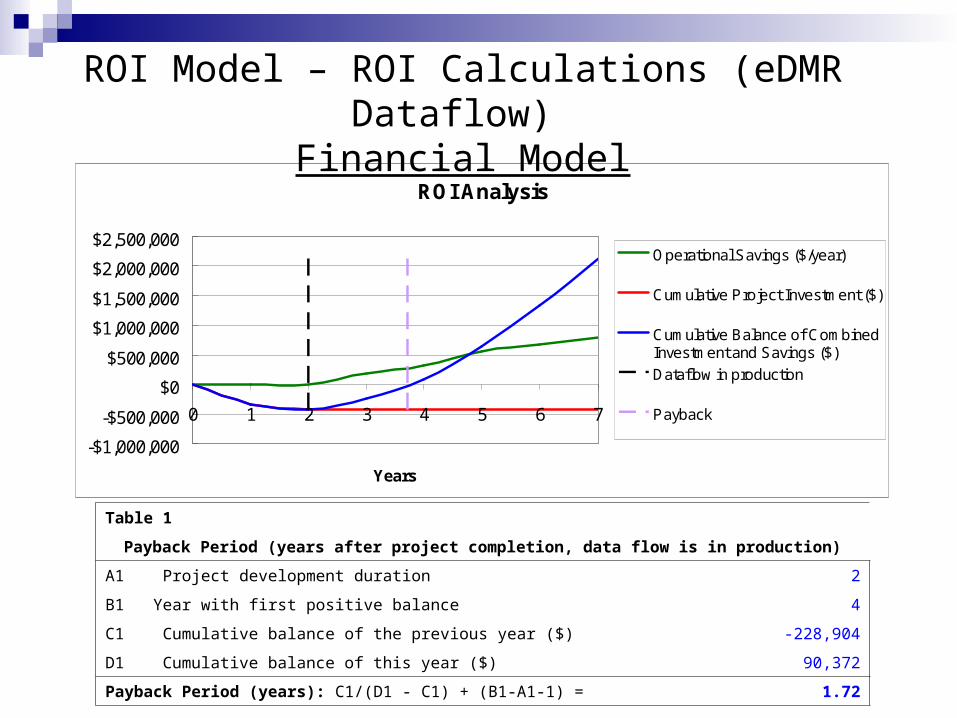
ROI Analysis
-$1,000,000
-$500,000
$0
$500,000
$1,000,000
$1,500,000
$2,000,000
$2,500,000
0 1 2 3 4 5 6 7
Years
Operational Savings ($/year)
Cumulative Project Investment ($)
Cumulative Balance of CombinedInvestment and Savings ($)
Dataflow in production
Payback
Table 1
Payback Period (years after project completion, data flow is in production)
A1 Project development duration 2
B1 Year with first positive balance 4
C1 Cumulative balance of the previous year ($) -228,904
D1 Cumulative balance of this year ($) 90,372
Payback Period (years): C1/(D1 - C1) + (B1-A1-1) = 1.72
ROI Model – ROI Calculations (eDMR Dataflow) Financial Model

Key Questions
NPDES Permittees 1200Project development duration (Years)
1Key values for ROI Analysis
1 Operational Scenario
Choose facility DMR submission method
Paper
Choose DMR types: BothChoose DMR tracking method:
State database and PCS
Business Scenario Questions:
2
Default Values
Facility to State Cost Factors:(A4) Data entry cost (by state)
Pre - EN Post - EN
Hourly rate of state staff ($/hour)
28.5 0
Number of Permittees 1200 1200Frequency of submissions 12 12# of DMRs/year (Data entered)
14400 14400
Time spent to enter each DMR (hours/DMR)
0.29 0.00
Time spent to enter each monthly DMR
0.87 0.00
Accuracy of data entry (% entered correctly)
100% 100%
SUBTOTAL COST ($/year)
$474,240.00 $0.00
State to EPA Cost Factors:(5) Submission to EPA
Pre - EN Post - EN
Hourly rate of state staff ($/hour)
28.5 37.5
Average time spent preparing submissions (hours/month)
0 0
Number of DMRs entered 14400 0Time to enter each DMR into PCS
0.29 0
Time spent to fix submission problems (hours/year)
N/A 60
SUBTOTAL COST ($/year)
$118,560.00 $2,250.00
3
ROI Model Overview – Step 1, 2, 3
Add to all other facility to statecost factors
Add to all other state to EPAcost factors

Financial Model5
% Participation by facilities (a projected
goal)
% Project spending (% of total
implementation Cost)Year 0 0% (Development) 50%Year 1 0% (Development) 50%Year 2 25% (Production Year)Year 3 37%Year 4 50%Year 5 60%Year 6 70%
4
ROI Calculations
Year 2 $446,475Year 3 $379,781Year 4 $307,530Year 5 $251,952Year 6 $196,3745 year
average $316,422
Annual Facility to State operational Cost (Post-EN)
Implementation Cost6
7
Average Annual Operational Cost Pre-EN ($/year) (5 year basis) $703,980Average Annual Operational Cost Post-EN ($/year) (5 year basis) $318,672Initial Capital Investment ($) $506,850Annual Maintenance Cost ($/year) $50,685Annual Savings ($/year) $334,623
ROI SummaryAverage ROI (5 year basis) 66%Payback period (years) 2.1Expected % Participation after 5 years 70%% Participation needed for positive ROI 0%
Facility to StateSUBTOTAL COST $270,850.00
State to EPATOTAL NODE COST $240,000Total # of flows implemented on the Node within first 3 years (estimate)
10
Shared Node Cost $24,000Implementation $212,000
SUBTOTAL COST $236,000.00TOTAL IMPLEMENTATION COST $506,850.00
Pre - EN Post - EN
Total cost from Facility to State ($/year)
$585,420 $29,640Pre - EN Post - EN
Total cost from Facility to State ($/year)
$118,560 $2,250
Annual State to EPA operational Cost (Post-EN)
$2,250
ROI Model Overview – Step 4, 5, 6, 7

Qualified Benefits to Facilities & Labs“Saves my compliance administration costs…
streamlines the reporting process”
“…provides immediate feedback of compliance status for proper actions”
“…will increase the amount of data accessible for trend analysis”
“…data entry errors are reduced…”
“Time saver…more traceable than paper…immediate confirmation of receipt”
“…at least half a million dollars [savings] for all community and non-community facilities and labs…”

Qualified Benefits to State & EPA
Eliminates data entry operators and other staff resources
Improves facility to state data quality by elimination of data entry errors
Improves the program effectiveness/efficiency
Improves response to public health concerns
Allows staff to better utilize precious resources
Eliminates backlog of paper reports

Deliverables 1. Analytical ROI model and guidance documentation
capable of incorporating facility, state and EPA business process variables.
2. Business process analysis of 5 data flows at four states, survey of facility and state representatives with data collection of ROI variables and quotes.
3. Final report.
4. Marketing materials highlighting project purpose, process, analysis and model development results.
Final Report/Guide
Report Content: Explain the ROI modeling tool Summarize findings in each state Draw conclusions about EN impacts to business process efficiencies
The report benefits: Aid state agencies with annual budgets, IT project strategies and
priority deliberations; Assist state project managers in making EN investment proposals to
management; and Assist ongoing state, Network & CDX performance measures
projects.

More Info?
Michael Beaulac Tony Jeng
Executive Division enfoTech & Consulting, Inc.
MI Department of Environmental Quality Lawrenceville, NJ 08648
Lansing, MI 48867 609-896-9777, ext. #107
517-241-7808 [email protected]
Kurt Rakouskas Molly O’Neill
ECOS ECOS
Washington, D.C. 20001 Washington, D.C. 20001
202-624-3684 202-624-3507 [email protected] [email protected]