
BPO jobs in Bangalore | BPO jobs for fresher’s |Gratitude India - BPO briefing
1
BUSINESS PROCESS OUT SOURCING (BPO)BUSINESS PROCESS OUT SOURCING (BPO)BUSINESS PROCESS OUT SOURCING (BPO)BUSINESS PROCESS OUT SOURCING (BPO)
A. INTRODUCTIONA. INTRODUCTIONA. INTRODUCTIONA. INTRODUCTION
In simple words, Business Process Outsourcing is the transfer of operational
responsibility of either business process or functions to an external service provider,
together with information technology that supports these processes. Thus while the
corporation continues to function commercially in the field of its core competence, it
necessarily fans out every other aspect of its venture that it does not do itself.
The Global major companies have rated India as a prime destination for outsourcing.
Recent surveys suggest that most US companies consider India as the best destination
for offshore outsourcing. The BPO is made possible by new forms of encryption and
faster methodologies that allow confidential data to dart instantly around the world.
Initially low end work such as data entry, setting up of call centres etc were considered
as India based investment form global companies, but now the back office operations
by several IT, Finance companies are being done from here.
Presently the share of outsourcing from India in sectors like Finance & Accounting, HR/
Payroll services, settlement and Clearing, Administration, occupies the major share.
Several factors have acted as catalysts to the phenomenal growth of outsourcing.
2
B. B. B. B. MARKET POTENTIALMARKET POTENTIALMARKET POTENTIALMARKET POTENTIAL
Over the past decade, the Indian BPO segment has witnessed significant
transformation. Starting with basic data entry tasks, the industry graduated to a high
proportion of voice-based services and a range of back-office processing activities.
The last 3-4 years have seen the scope of services expanding to include increasingly
complex processes involving rule-based decision making and even research services
requiring informed individual judgment.
The rapid expansion in scope of BPO has been accompanied by an equally rapid
adoption across a range of vertical industries. This wide range of services may be
summarised into four broad categories comprising Finance and Accounting (F&A),
Customer Interaction Services (CIS) and Human Resource Administration (HRA), and a
wide range of other vertical-specific and niche services.
The BPO industry grew by 33.5% in 2006-07 contributing Rs 37,800 crore to software
and services exports: Nasscom
A growth of 33.5% to reach Rs 37,800 crore, as estimated by Nasscom, is just one
measure of the Indian offshore BPO industry’s evolution in FY 2007. More importantly,
FY 2007 is a year in which three significant trends marked the coming of age of the
industry as a whole.
The sector saw a steady growth across horizontals like Finance and Accounting, Customer
Interaction Services and Human Resource Administration. The expansion of emerging service
lines like legal and risk management along with M & A, complemented the organic growth of
this segment. Indian ITES-BPO exports grew from USD 6.3 billion in FY 2005-06 to USD 8.4
billion in FY 2006-07 and is expected to grow to USD 10.5-11bn in FY08.
� ITES-BPO employee base has grown to 553,000 in FY 07 from 415,000 in FY 06
3
Key Highlights of DomestiKey Highlights of DomestiKey Highlights of DomestiKey Highlights of Domestic BPO industry c BPO industry c BPO industry c BPO industry
� BPO demand in the domestic market has witnessed noticeable growth over the past
few years. The annual revenue aggregate of the domestic market for ITES-BPO grew
to USD 1.2 billion in FY 2006-07 from USD 0.9 billion in FY 2005-06, illustrating a
significant increase in demand. While the high growth rate may be attributed to a
small-base effect, the rapid adoption of BPO in the domestic market is receiving
well-deserved attention.
� As the Indian economy becomes more globally integrated, businesses in India are
beginning to face increasing levels of global competition and being pushed to
deliver world class levels of product and service quality. BPO has emerged as an
effective means of entrusting specialists with the task of consistently delivering the
desired high-levels of quality – leaving the client organisations to focus on their
core businesses.
India has already made its presence felt in business process outsourcing by leveraging
on its cost advantage vis-a-vis other countries. However these operations can be
further scaled up to provide employment to the teeming educated millions in the
country.
The major market segments include voice based call centres, health care segments
(medical transcription, billing, claims, coding, claim adjudication, information services,
etc), etc. Telemarketing call centres offers services in Tele-banking, Airline Bookings,
Records Verification, etc. India with its huge English speaking population is already
leveraging on this strength.
4
It is estimated that by 2008, US healthcare industry alone will outsource business
process worth US$ 4.5 billion offering employment to 200,000 people. According to
estimates by Frost & Sullivan, Indian call center industry will be worth US$ 750 million
by 2008 growing at a CAGR of 21%.
During 2006-07, hiring of lawyers was stepped up with legal outsourcing in India
which is expected to grow more than ten-fold by 2010. LPOs are headed for
consolidation as only a few are doing high-end legal work.
- Operating costs of ITES/BPO per full time employee in India is typically 20% of
the US costs.
- A well-established IT/BPO industry with a proven track record in terms of
quality of service, reliability and productivity.
- A large and growing pool of highly skilled professionals fluent in English.
- The geographical advantage for 24/7 operations.
- World-class infrastructure facilities for outsourcing.
There is wide scope for Indian BPO companies to tap the global healthcare industry in
the advanced areas such as Imaging, Disease Management and Claims Processing.
5
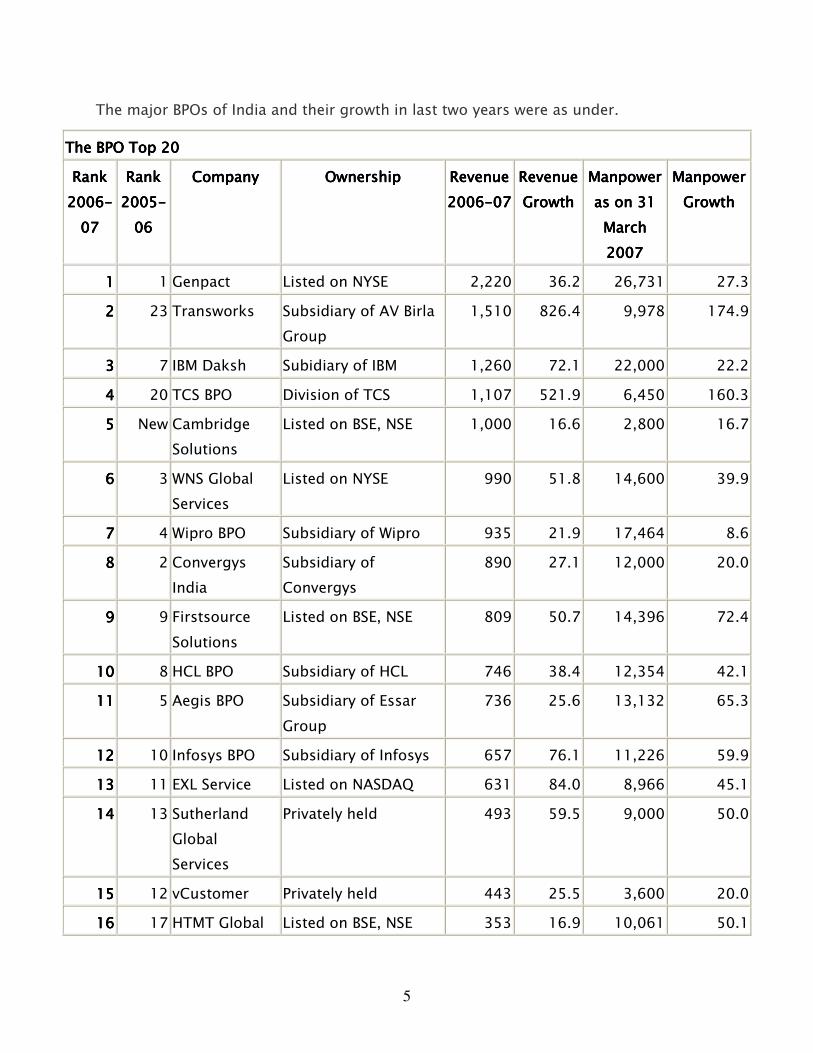
The major BPOs of India and their growth in last two years were as under.
The BPO Top 20The BPO Top 20The BPO Top 20The BPO Top 20
Rank Rank Rank Rank
2006200620062006----
07070707
Rank Rank Rank Rank
2005200520052005----
06060606
CompanyCompanyCompanyCompany OwnershipOwnershipOwnershipOwnership RevenueRevenueRevenueRevenue
2006200620062006----07070707
RevenueRevenueRevenueRevenue
GrowthGrowthGrowthGrowth
Manpower Manpower Manpower Manpower
as on 31 as on 31 as on 31 as on 31
March March March March
2007200720072007
ManpowerManpowerManpowerManpower
GrowtGrowtGrowtGrowthhhh
1111 1 Genpact Listed on NYSE 2,220 36.2 26,731 27.3
2222 23 Transworks Subsidiary of AV Birla
Group
1,510 826.4 9,978 174.9
3333 7 IBM Daksh Subidiary of IBM 1,260 72.1 22,000 22.2
4444 20 TCS BPO Division of TCS 1,107 521.9 6,450 160.3
5555 New Cambridge
Solutions
Listed on BSE, NSE 1,000 16.6 2,800 16.7
6666 3 WNS Global
Services
Listed on NYSE 990 51.8 14,600 39.9
7777 4 Wipro BPO Subsidiary of Wipro 935 21.9 17,464 8.6
8888 2 Convergys
India
Subsidiary of
Convergys
890 27.1 12,000 20.0
9999 9 Firstsource
Solutions
Listed on BSE, NSE 809 50.7 14,396 72.4
10101010 8 HCL BPO Subsidiary of HCL 746 38.4 12,354 42.1
11111111 5 Aegis BPO Subsidiary of Essar
Group
736 25.6 13,132 65.3
12121212 10 Infosys BPO Subsidiary of Infosys 657 76.1 11,226 59.9
13131313 11 EXL Service Listed on NASDAQ 631 84.0 8,966 45.1
14141414 13 Sutherland
Global
Services
Privately held 493 59.5 9,000 50.0
15151515 12 vCustomer Privately held 443 25.5 3,600 20.0
16161616 17 HTMT Global Listed on BSE, NSE 353 16.9 10,061 50.1
6
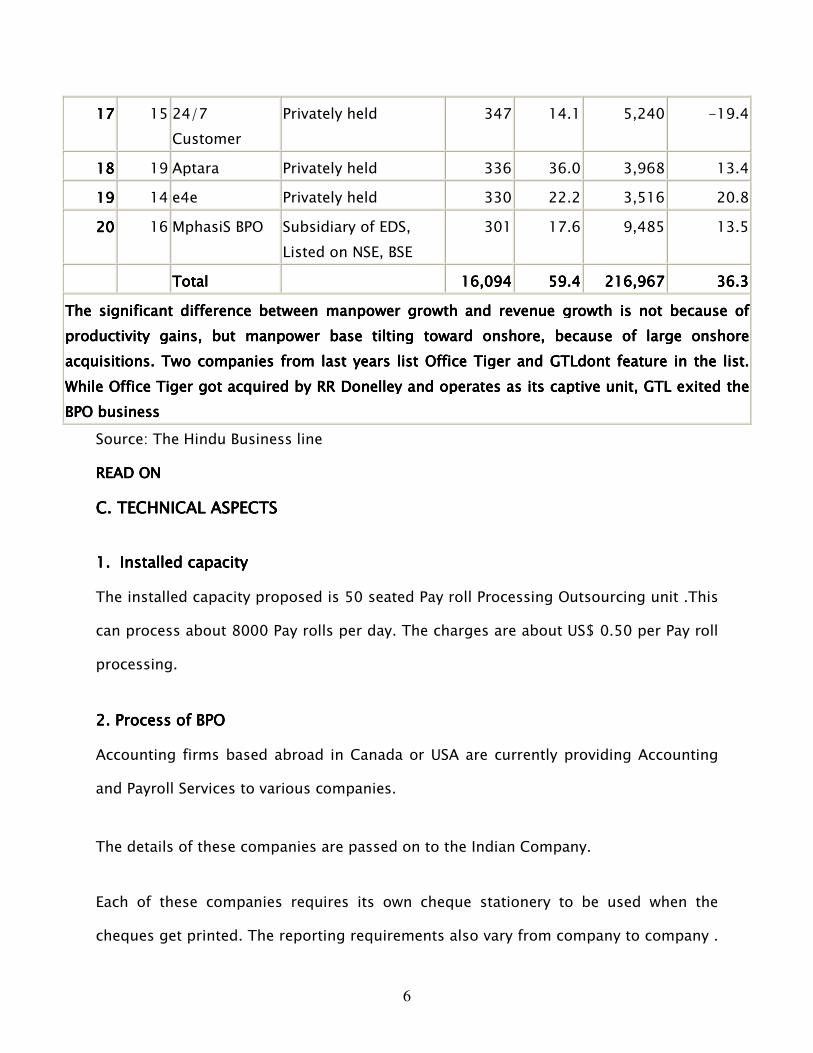
17171717 15 24/7
Customer
Privately held 347 14.1 5,240 -19.4
18181818 19 Aptara Privately held 336 36.0 3,968 13.4
19191919 14 e4e Privately held 330 22.2 3,516 20.8
20202020 16 MphasiS BPO Subsidiary of EDS,
Listed on NSE, BSE
301 17.6 9,485 13.5
TotalTotalTotalTotal 16,09416,09416,09416,094 59.459.459.459.4 216,967216,967216,967216,967 36.336.336.336.3
The significant difference between manpower growth aThe significant difference between manpower growth aThe significant difference between manpower growth aThe significant difference between manpower growth and revenue growth is not because of nd revenue growth is not because of nd revenue growth is not because of nd revenue growth is not because of
productivity gains, but manpower base tilting toward onshore, because of large onshore productivity gains, but manpower base tilting toward onshore, because of large onshore productivity gains, but manpower base tilting toward onshore, because of large onshore productivity gains, but manpower base tilting toward onshore, because of large onshore
acquisitions. Two companies from last years listacquisitions. Two companies from last years listacquisitions. Two companies from last years listacquisitions. Two companies from last years list Office Tiger and GTLdont feature in the list. Office Tiger and GTLdont feature in the list. Office Tiger and GTLdont feature in the list. Office Tiger and GTLdont feature in the list.
While Office Tiger got acquired by RR While Office Tiger got acquired by RR While Office Tiger got acquired by RR While Office Tiger got acquired by RR Donelley and operates as its captive unit, GTL exited the Donelley and operates as its captive unit, GTL exited the Donelley and operates as its captive unit, GTL exited the Donelley and operates as its captive unit, GTL exited the
BPO businessBPO businessBPO businessBPO business
Source: The Hindu Business line
READ ONREAD ONREAD ONREAD ON
C. TECHNICAL ASPECTSC. TECHNICAL ASPECTSC. TECHNICAL ASPECTSC. TECHNICAL ASPECTS
1.1.1.1. Installed capacityInstalled capacityInstalled capacityInstalled capacity
The installed capacity proposed is 50 seated Pay roll Processing Outsourcing unit .This
can process about 8000 Pay rolls per day. The charges are about US$ 0.50 per Pay roll
processing.
2. Process of BPO2. Process of BPO2. Process of BPO2. Process of BPO
Accounting firms based abroad in Canada or USA are currently providing Accounting
and Payroll Services to various companies.
The details of these companies are passed on to the Indian Company.
Each of these companies requires its own cheque stationery to be used when the
cheques get printed. The reporting requirements also vary from company to company .
7
A set of employees are responsible to carry out these activities which is non optimal
and time consuming as they have to mount and dismount various types of stationeries
depending on the company for which they are processing. The frequency of the payroll
run also varies from company to company and can be once a week , once in two weeks
or once in a month.
There would be basically two types of data elements to be captured for processing the
Pay Roll system
A. The Master or One Time Information and
B. The Transactions for a period of processing on a continuous basis
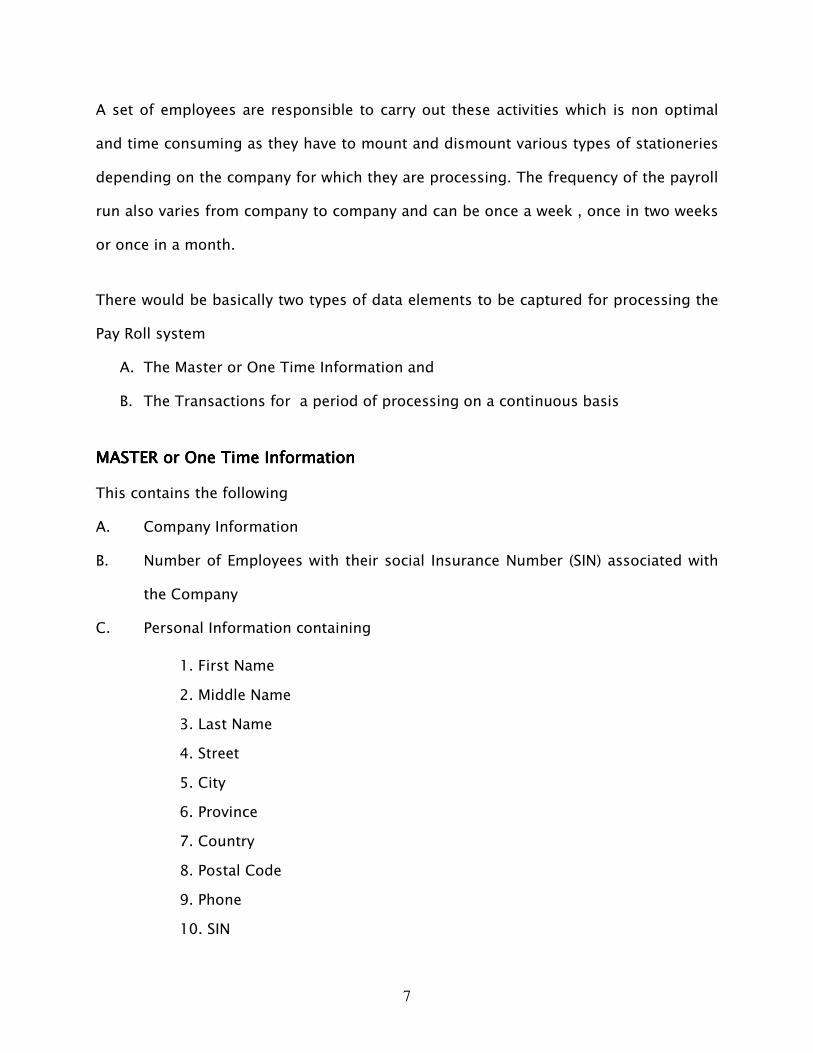
MASTER or One Time InformationMASTER or One Time InformationMASTER or One Time InformationMASTER or One Time Information
This contains the following
A. Company Information
B. Number of Employees with their social Insurance Number (SIN) associated with
the Company
C. Personal Information containing
1. First Name
2. Middle Name
3. Last Name
4. Street
5. City
6. Province
7. Country
8. Postal Code
9. Phone
10. SIN
8
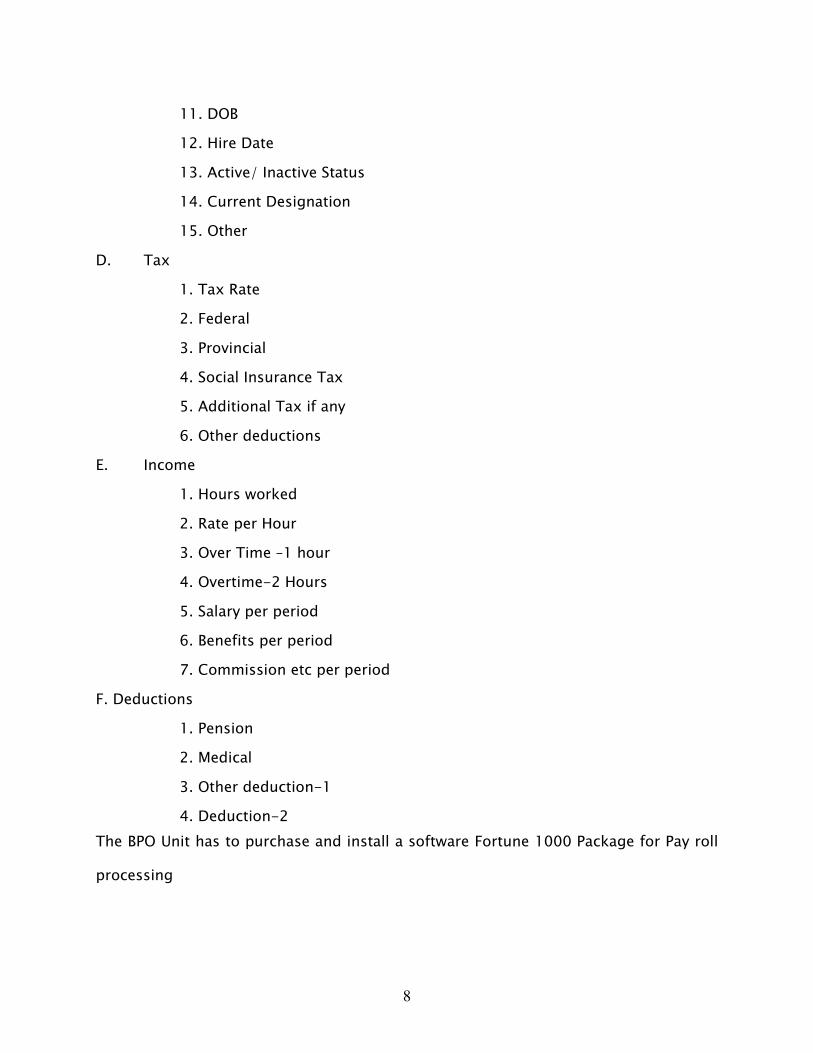
11. DOB
12. Hire Date
13. Active/ Inactive Status
14. Current Designation
15. Other
D. Tax
1. Tax Rate
2. Federal
3. Provincial
4. Social Insurance Tax
5. Additional Tax if any
6. Other deductions
E. Income
1. Hours worked
2. Rate per Hour
3. Over Time –1 hour
4. Overtime-2 Hours
5. Salary per period
6. Benefits per period
7. Commission etc per period
F. Deductions
1. Pension
2. Medical
3. Other deduction-1
4. Deduction-2
The BPO Unit has to purchase and install a software Fortune 1000 Package for Pay roll
processing
9
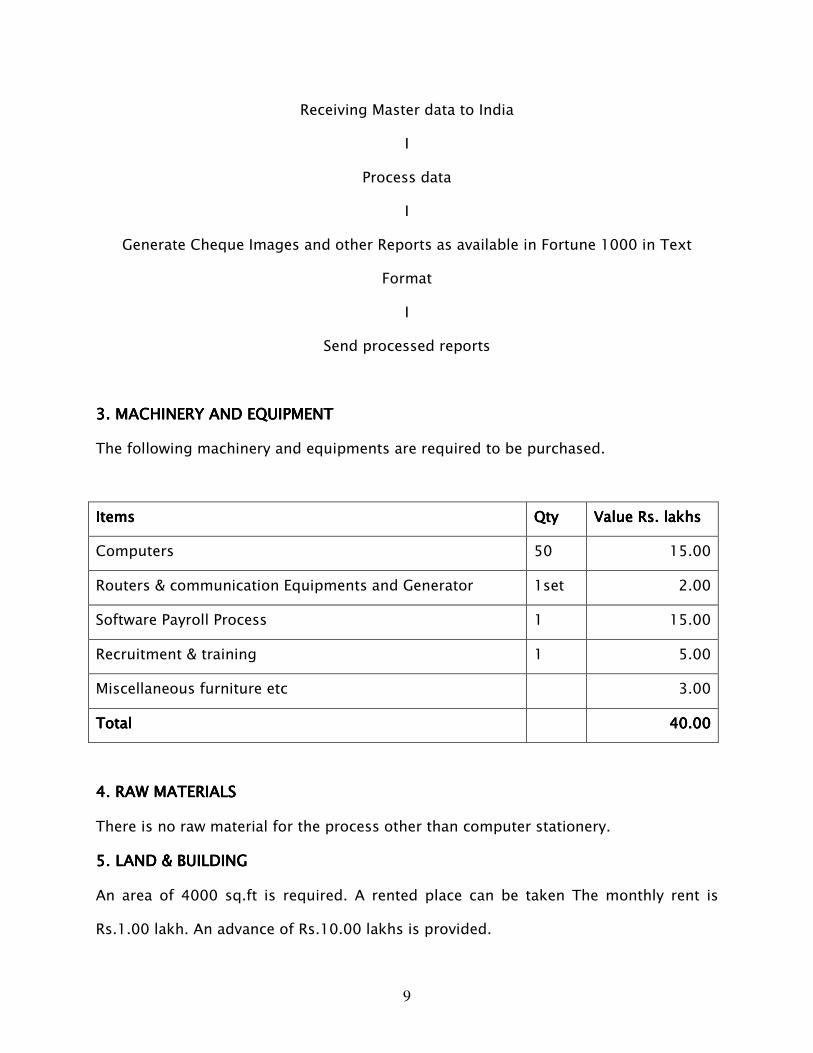
Receiving Master data to India
I
Process data
I
Generate Cheque Images and other Reports as available in Fortune 1000 in Text
Format
I
Send processed reports
3. 3. 3. 3. MACHINERY AND EQUIPMENTMACHINERY AND EQUIPMENTMACHINERY AND EQUIPMENTMACHINERY AND EQUIPMENT
The following machinery and equipments are required to be purchased.
ItemsItemsItemsItems QtyQtyQtyQty Value Rs. lakhsValue Rs. lakhsValue Rs. lakhsValue Rs. lakhs
Computers 50 15.00
Routers & communication Equipments and Generator 1set 2.00
Software Payroll Process 1 15.00
Recruitment & training 1 5.00
Miscellaneous furniture etc 3.00
TotalTotalTotalTotal 40404040.00.00.00.00
4. RAW MATERIALS4. RAW MATERIALS4. RAW MATERIALS4. RAW MATERIALS
There is no raw material for the process other than computer stationery.
5.5.5.5. LAND & BUILDINGLAND & BUILDINGLAND & BUILDINGLAND & BUILDING
An area of 4000 sq.ft is required. A rented place can be taken The monthly rent is
Rs.1.00 lakh. An advance of Rs.10.00 lakhs is provided.
10
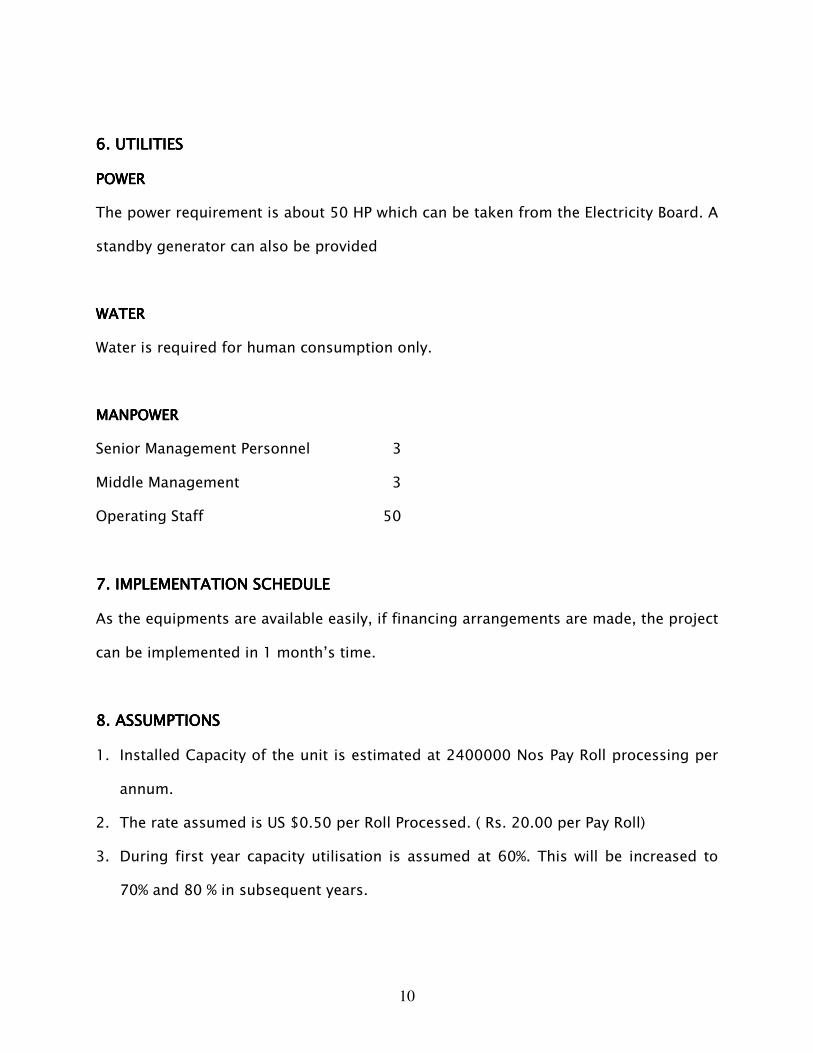
6.6.6.6. UTILITIESUTILITIESUTILITIESUTILITIES
POWERPOWERPOWERPOWER
The power requirement is about 50 HP which can be taken from the Electricity Board. A
standby generator can also be provided
WATERWATERWATERWATER
Water is required for human consumption only.
MANPOMANPOMANPOMANPOWERWERWERWER
Senior Management Personnel 3
Middle Management 3
Operating Staff 50
7. IMPLEMENTATION SCHEDULE7. IMPLEMENTATION SCHEDULE7. IMPLEMENTATION SCHEDULE7. IMPLEMENTATION SCHEDULE
As the equipments are available easily, if financing arrangements are made, the project
can be implemented in 1 month’s time.
8. ASSUMPTIONS8. ASSUMPTIONS8. ASSUMPTIONS8. ASSUMPTIONS
1. Installed Capacity of the unit is estimated at 2400000 Nos Pay Roll processing per
annum.
2. The rate assumed is US $0.50 per Roll Processed. ( Rs. 20.00 per Pay Roll)
3. During first year capacity utilisation is assumed at 60%. This will be increased to
70% and 80 % in subsequent years.

11
4. Salary Rs 90.00 lakhs per annum for 50 operating employees at Rs 15000 per
month.
5. Rent is estimated at Rs 1.00 lakh per month.
6. Electricity charges Rs.1.25 lakhs per month.
7. Employees welfare Rs 1.25 lakhs per month
8. Communication Expenses Rs.2.50 lakhs per month
9. Transport expenses Rs.1.25 lakhs per month
10 .Executives salary Rs 4.50 lakhs per month
11. Depreciation is provided at 60% on written own value method.
12. Interest on Term Loan 12% per annum
13. Interest on working capital is not provided as the working
14. Capital finance is not envisaged.
SUPPLIERS OF EQUIPMENTSUPPLIERS OF EQUIPMENTSUPPLIERS OF EQUIPMENTSUPPLIERS OF EQUIPMENT
RoutersRoutersRoutersRouters
1. Skylark Information Technologies Pvt Ltd, "Lakshmi House" No:42,40 Ft Scheme
Road, Kamdhar Nagar,Mahalingapuram, Nungambakkam, Chennai-600 034
12
ComputersComputersComputersComputers
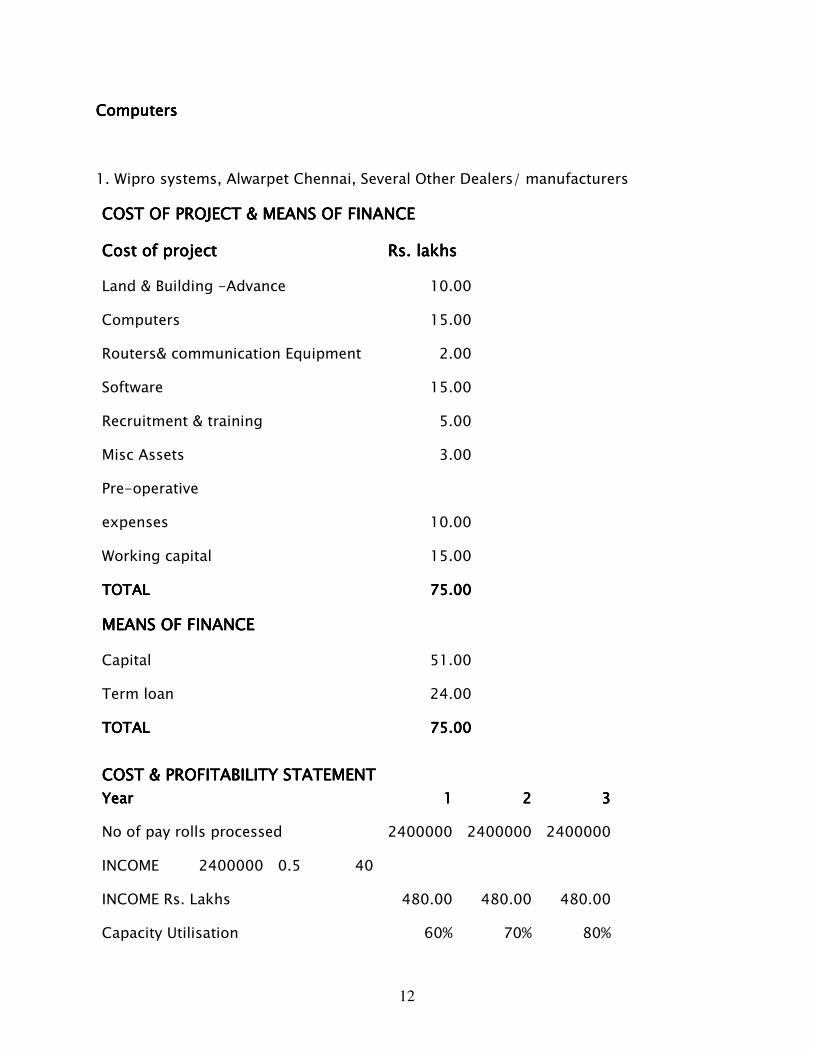
1. Wipro systems, Alwarpet Chennai, Several Other Dealers/ manufacturers
COST OF PROJECT & MEANS OF FINANCECOST OF PROJECT & MEANS OF FINANCECOST OF PROJECT & MEANS OF FINANCECOST OF PROJECT & MEANS OF FINANCE
Cost of project Cost of project Cost of project Cost of project Rs. lakhsRs. lakhsRs. lakhsRs. lakhs
Land & Building -Advance 10.00
Computers 15.00
Routers& communication Equipment 2.00
Software 15.00
Recruitment & training 5.00
Misc Assets 3.00
Pre-operative
expenses 10.00
Working capital 15.00
TOTALTOTALTOTALTOTAL 75.0075.0075.0075.00
MEANS OF FINANCE MEANS OF FINANCE MEANS OF FINANCE MEANS OF FINANCE
Capital 51.00
Term loan 24.00
TOTALTOTALTOTALTOTAL 75.0075.0075.0075.00
COSTCOSTCOSTCOST & PROFITABILITY STATEMENT & PROFITABILITY STATEMENT & PROFITABILITY STATEMENT & PROFITABILITY STATEMENT
YearYearYearYear 1111 2222 3333
No of pay rolls processed 2400000 2400000 2400000
INCOME 2400000 0.5 40
INCOME Rs. Lakhs 480.00 480.00 480.00
Capacity Utilisation 60% 70% 80%
13
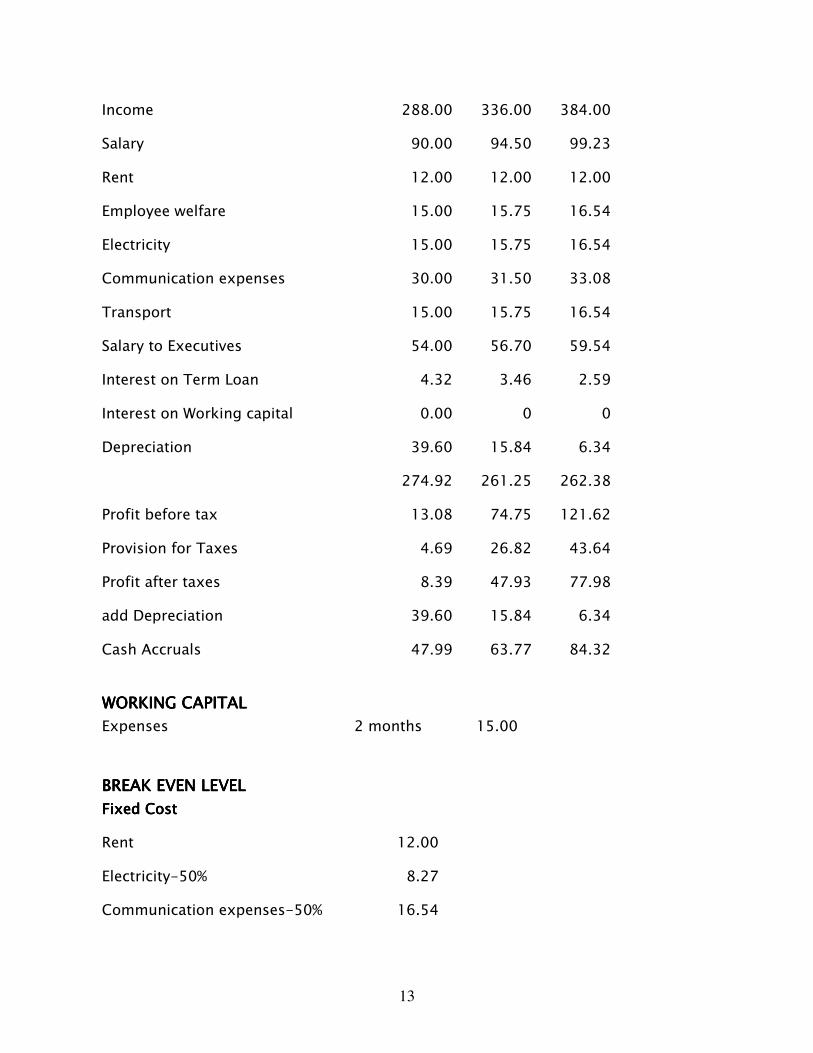
Income 288.00 336.00 384.00
Salary 90.00 94.50 99.23
Rent 12.00 12.00 12.00
Employee welfare 15.00 15.75 16.54
Electricity 15.00 15.75 16.54
Communication expenses 30.00 31.50 33.08
Transport 15.00 15.75 16.54
Salary to Executives 54.00 56.70 59.54
Interest on Term Loan 4.32 3.46 2.59
Interest on Working capital 0.00 0 0
Depreciation 39.60 15.84 6.34
274.92 261.25 262.38
Profit before tax 13.08 74.75 121.62
Provision for Taxes 4.69 26.82 43.64
Profit after taxes 8.39 47.93 77.98
add Depreciation 39.60 15.84 6.34
Cash Accruals 47.99 63.77 84.32
WORKING CAPITALWORKING CAPITALWORKING CAPITALWORKING CAPITAL
Expenses 2 months 15.00
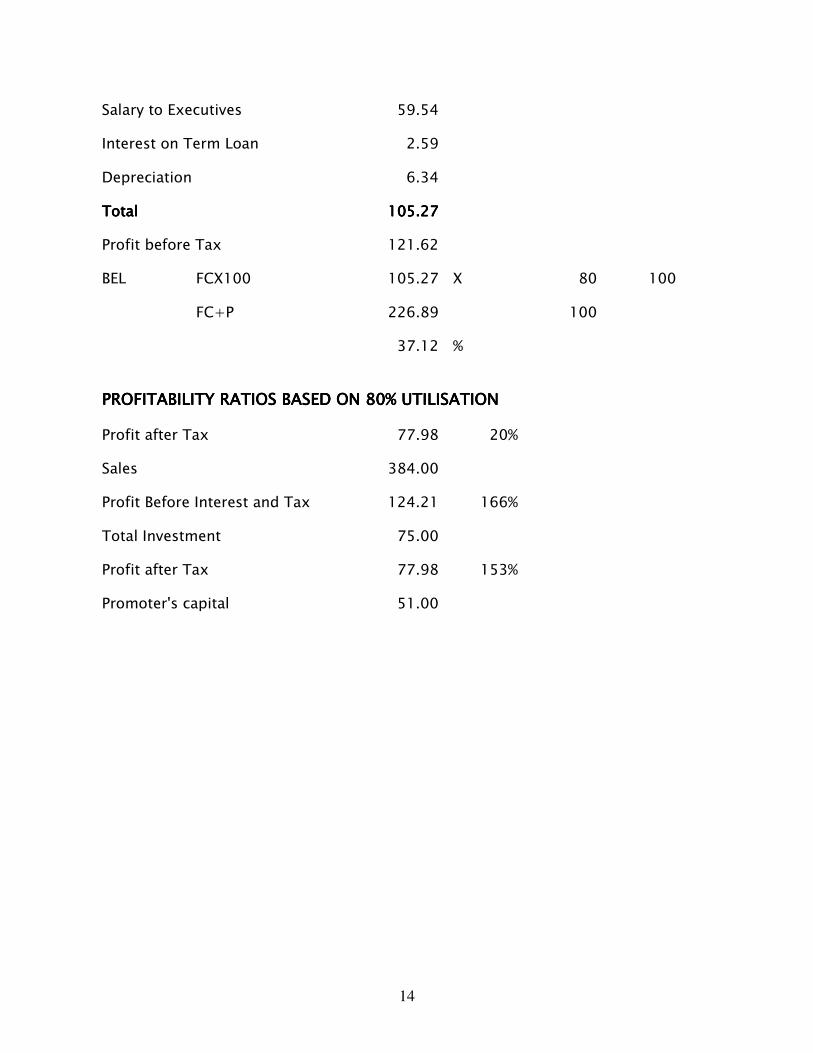
BREAK EVEN LEVELBREAK EVEN LEVELBREAK EVEN LEVELBREAK EVEN LEVEL
Fixed CostFixed CostFixed CostFixed Cost
Rent 12.00
Electricity-50% 8.27
Communication expenses-50% 16.54
14
Salary to Executives 59.54
Interest on Term Loan 2.59
Depreciation 6.34
TotalTotalTotalTotal 105.27105.27105.27105.27
Profit before Tax 121.62
BEL FCX100 105.27 X 80 100
FC+P 226.89 100
37.12 %
PROFITABILITY RATIOS BASED ON 80% UTILISATIONPROFITABILITY RATIOS BASED ON 80% UTILISATIONPROFITABILITY RATIOS BASED ON 80% UTILISATIONPROFITABILITY RATIOS BASED ON 80% UTILISATION
Profit after Tax 77.98 20%
Sales 384.00
Profit Before Interest and Tax 124.21 166%
Total Investment 75.00
Profit after Tax 77.98 153%
Promoter's capital 51.00
CALL CENTRECALL CENTRECALL CENTRECALL CENTRE
A.A.A.A. INTRODUCTIONINTRODUCTIONINTRODUCTIONINTRODUCTION
A typical call center is a service center which has adequate telecom facilities, trained
consultants, access to wide database, internet and other on-line information
support infrastructure to provide information and support to a customer. It
operates to provide round the clock and year round service i.e. 365 days and 24
hour service.
India has emerged as destination for international companies to set up their Call
Centres. Some of the reasons for this are Indian companies leveraging on the
booming IT Industry, English speaking population and low cost.
B.B.B.B. MARKET POTENTIALMARKET POTENTIALMARKET POTENTIALMARKET POTENTIAL
The following services are being provided by the call centres.
1.1.1.1. Automatic Call Distributor (ACD)Automatic Call Distributor (ACD)Automatic Call Distributor (ACD)Automatic Call Distributor (ACD)
Calls may be distributed in various ways to optimize usage of the call centre
resources and allow the best possible agent to service the customer calls. Call
Centre performs all the tasks of an automatic call distribution system with powerful
skills and rules based routing functionalities that apply across all media types.
2.2.2.2. Interactive Voice Response (IVR) Fax on Demand (FoD)Interactive Voice Response (IVR) Fax on Demand (FoD)Interactive Voice Response (IVR) Fax on Demand (FoD)Interactive Voice Response (IVR) Fax on Demand (FoD)
These allow routing information dissemination using fax on pre-recorded voice
messages, which reduces the time spent by the agent in providing unnecessary
details, thus increasing his efficiency and reducing fatigue. Call Centre's Interactive
Voice Response functionality includes self-service, speech recognition and fax
management capabilities.
3.3.3.3. Outbound call management & predictive dialingOutbound call management & predictive dialingOutbound call management & predictive dialingOutbound call management & predictive dialing
Predictive dialing goes beyond just automating the dialing process to eliminate time
which would otherwise be wasted in the calling process and improves productivity.
This is done by dialing calls according to a complex calling algorithm to smooth out
the centre’s workflow. The calling process is also made efficient by screening out
no answer, busy, out of order and answering machine calls.
4.4.4.4. Computer Telephony Integration (CTI)Computer Telephony Integration (CTI)Computer Telephony Integration (CTI)Computer Telephony Integration (CTI)
A common perception is that CTI is just for a “Screen pop”, in which customer
information “pops up” on an agent’s screen as a call is received. However CTI
encompasses much more as the coordination of real time voice events and database
events allows real time feedback for Dynamic Routing Schemes, Call Flow Scripting,
workforce Management and Real Time Reporting.
5.5.5.5. Email ManagementEmail ManagementEmail ManagementEmail Management
Automated Email responses; Knowledge base and intelligent routing features enable
agents to effectively address the needs of customers.
6.6.6.6. Web Chat and Web collaborationWeb Chat and Web collaborationWeb Chat and Web collaborationWeb Chat and Web collaboration
Using Web Chat and Collaboration, agents are able to assist customers visiting a
company’s web site via live interactive chat sessions and collaborative assistance
through agent/customer browser synchronization.
A recent study by the National Association of Software and Service Companies
(Nasscom) McKinsey has estimated that this industry can earn almost $17 billion of
revenue and provide jobs to more than one million work force.
Advantage of getting Call Centres done in IndiaAdvantage of getting Call Centres done in IndiaAdvantage of getting Call Centres done in IndiaAdvantage of getting Call Centres done in India
• Availability of huge English speaking population
• Infrastructure - communications, technology, geography
• Emerging open economic policy
• Dollar to Rupee conversion.
• Customized and excellent Call Centre Training
• Pioneers in the business with a varied and rich experience spreading 5 years.
• Time tested and proven comprehensive training program developed for the
Indian scenario
• Direct Marketing and business development experience
• Direct clients and links to IT Service industry.
• Front office marketing and administrative hubs all over the United States.
• Have one of the largest communication lines and infrastructure facility.
• Comprehensive consulting program in setting up and running a viable Call
Centres operation.
• Readily available work that can be outsourced.
• Specially designed "Train the Trainer" module that covers a novice to a full
fledged trainer in month.
Currently the Indian market has about 50 computer telephony integrated (CTI)
enabled centres while non CTI Call Centres are between 400 and 700.
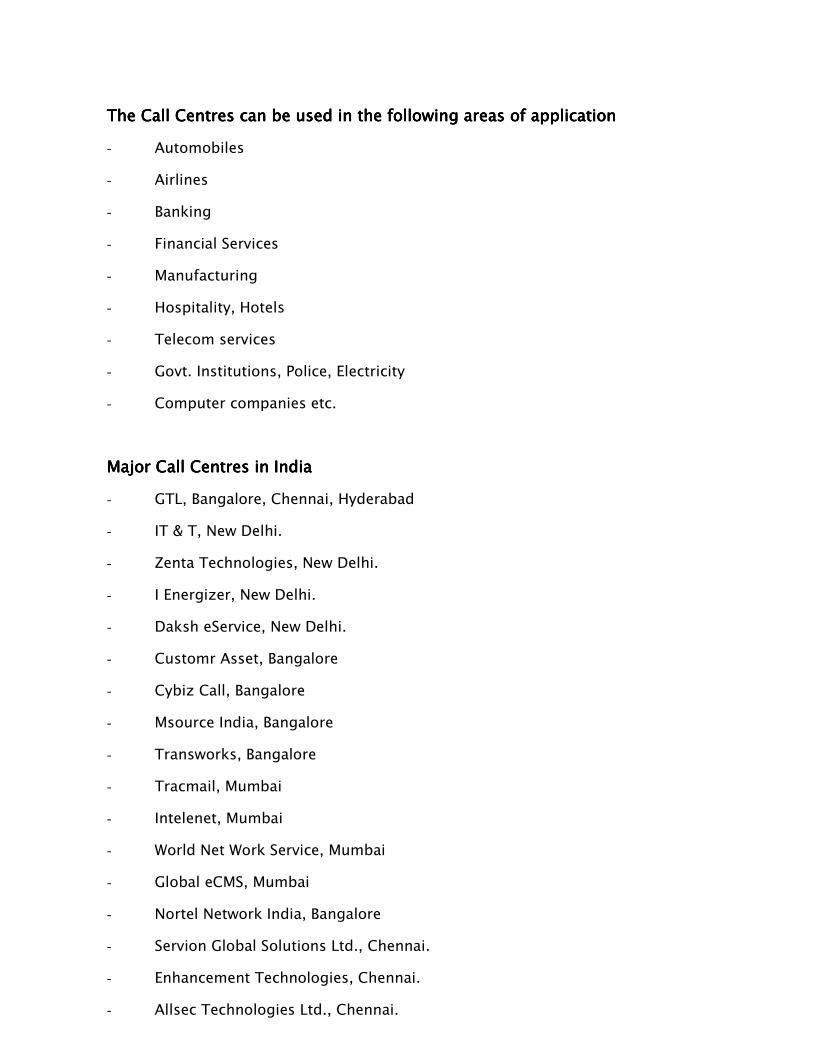
The Call Centres can be used in the following areas of applicationThe Call Centres can be used in the following areas of applicationThe Call Centres can be used in the following areas of applicationThe Call Centres can be used in the following areas of application
- Automobiles
- Airlines
- Banking
- Financial Services
- Manufacturing
- Hospitality, Hotels
- Telecom services
- Govt. Institutions, Police, Electricity
- Computer companies etc.
Major Call Centres in IndiaMajor Call Centres in IndiaMajor Call Centres in IndiaMajor Call Centres in India
- GTL, Bangalore, Chennai, Hyderabad
- IT & T, New Delhi.
- Zenta Technologies, New Delhi.
- I Energizer, New Delhi.
- Daksh eService, New Delhi.
- Customr Asset, Bangalore
- Cybiz Call, Bangalore
- Msource India, Bangalore
- Transworks, Bangalore
- Tracmail, Mumbai
- Intelenet, Mumbai
- World Net Work Service, Mumbai
- Global eCMS, Mumbai
- Nortel Network India, Bangalore
- Servion Global Solutions Ltd., Chennai.
- Enhancement Technologies, Chennai.
- Allsec Technologies Ltd., Chennai.
The OperationThe OperationThe OperationThe Operation
The US company’s computers will receive calls from clients. The data is then
compressed and encrypted. This data is then piped through the n x 64kbps
satellite link to India. In India the data is received by the gateway earth-station
(STPI/VSNL) and is sent via Microwave link to the office. Data is uncompressed and
stored on a server and then fed via the LAN to the individual workstations. Each
workstation comprises a computer with a sound card and an audio-feed mechanism
and software and voice telephone. The Call Centreists convert the queries data into
electronic text. The host computer keeps track of productivity and error rate of
each caller. The data is later post-processed for errors and formatted and is then
compressed and uploaded back to US as voice via the satellite link.
ObjectivesObjectivesObjectivesObjectives
The Indian operation will have to engineer very high levels of quality into its
operations since this is a critical criterion which can affect the future of the
company. To this end, the best quality of infrastructure has to be set up and high
caliber staff will need to be recruited. The training component is a very important
criterion in producing high quality output.
Call centers cater to international clientele and they need people with the right
skills and attitude. It's also a fast-growing business: last year the Indian IT-enabled
services industry recorded a growth rate of 60 percent plus in the middle of an
economic recession. Recruitment is only the first step in the process. Thousands of
fresh recruits have to be put through crash courses on their specific jobs on a
continuous basis.
Right now, the companies providing IT-enabled services are doing most of their
own recruiting and training. But this will be hard to sustain as the numbers keep
growing.
The global business in IT-enabled services is expected to cross $ 600 billion in
2005. According to Nasscom-McKinsey estimates, the IT-e industry will create
employment for over 1.1 million Indians by 2008. India is currently the preferred
destination for this business because of the availability of large numbers of people
with fluency in English and basic computing skills, and the relatively low cost of
employing them in India.
Analysts say India has the potential to get more than a third of the total business in
IT-enabled services, which includes call centers. However translation of that
potential into reality will require relevant manpower, specially trained for this
market
C.C.C.C. TECHNICAL ASPECTSTECHNICAL ASPECTSTECHNICAL ASPECTSTECHNICAL ASPECTS
1.1.1.1. Installed capacityInstalled capacityInstalled capacityInstalled capacity
A small Call Centre with 30 seaters is proposed to be set up.
In India, call center operates may have to take a special NOC ( No Objection
Relations) from Deputy Director General ( Customer Relations ) at Department of
Telecommunications, Government of India at New Delhi. This NOC is issued with the
aim of generating a special permission to use voice circuits over international
gateways with the Dedicated and stated purpose of serving overseas customers,
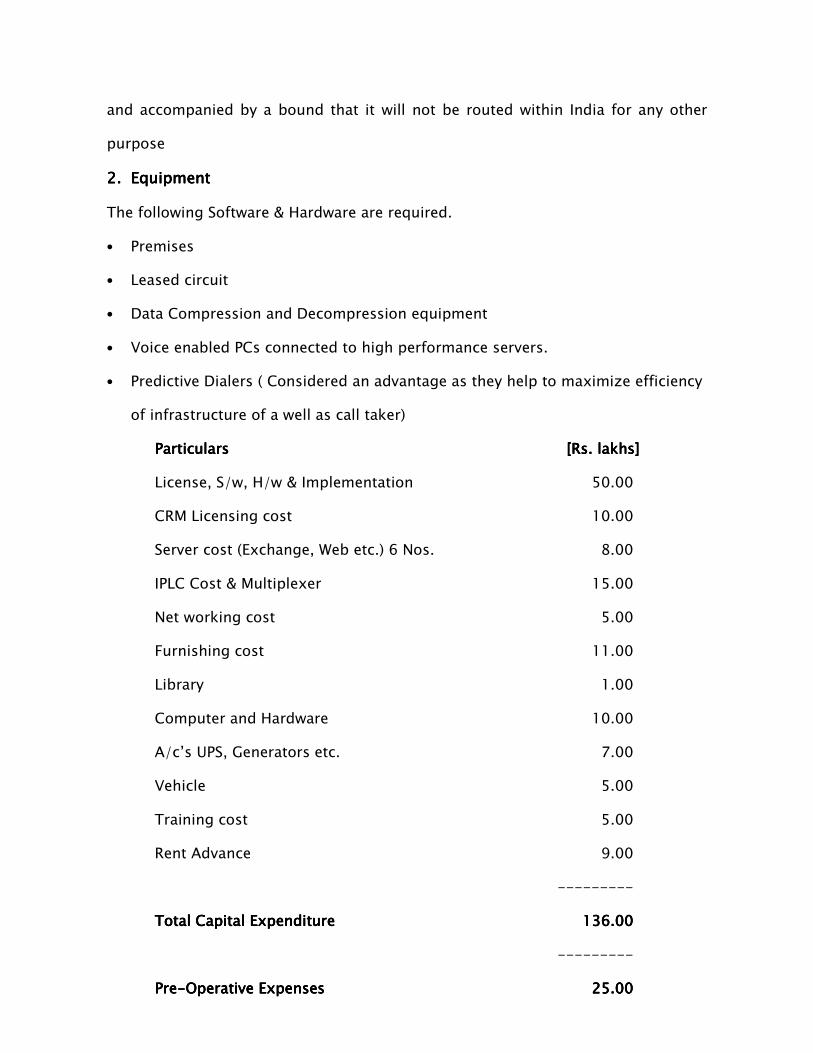
and accompanied by a bound that it will not be routed within India for any other
purpose
2.2.2.2. EquipmentEquipmentEquipmentEquipment
The following Software & Hardware are required.
• Premises
• Leased circuit
• Data Compression and Decompression equipment
• Voice enabled PCs connected to high performance servers.
• Predictive Dialers ( Considered an advantage as they help to maximize efficiency
of infrastructure of a well as call taker)
ParticularsParticularsParticularsParticulars [Rs.[Rs.[Rs.[Rs. lakhs]lakhs]lakhs]lakhs]
License, S/w, H/w & Implementation 50.00
CRM Licensing cost 10.00
Server cost (Exchange, Web etc.) 6 Nos. 8.00
IPLC Cost & Multiplexer 15.00
Net working cost 5.00
Furnishing cost 11.00
Library 1.00
Computer and Hardware 10.00
A/c’s UPS, Generators etc. 7.00
Vehicle 5.00
Training cost 5.00
Rent Advance 9.00
---------
Total Capital ExpendTotal Capital ExpendTotal Capital ExpendTotal Capital Expenditureitureitureiture 136136136136.00.00.00.00
---------
PrePrePrePre----Operative ExpensesOperative ExpensesOperative ExpensesOperative Expenses 25.0025.0025.0025.00
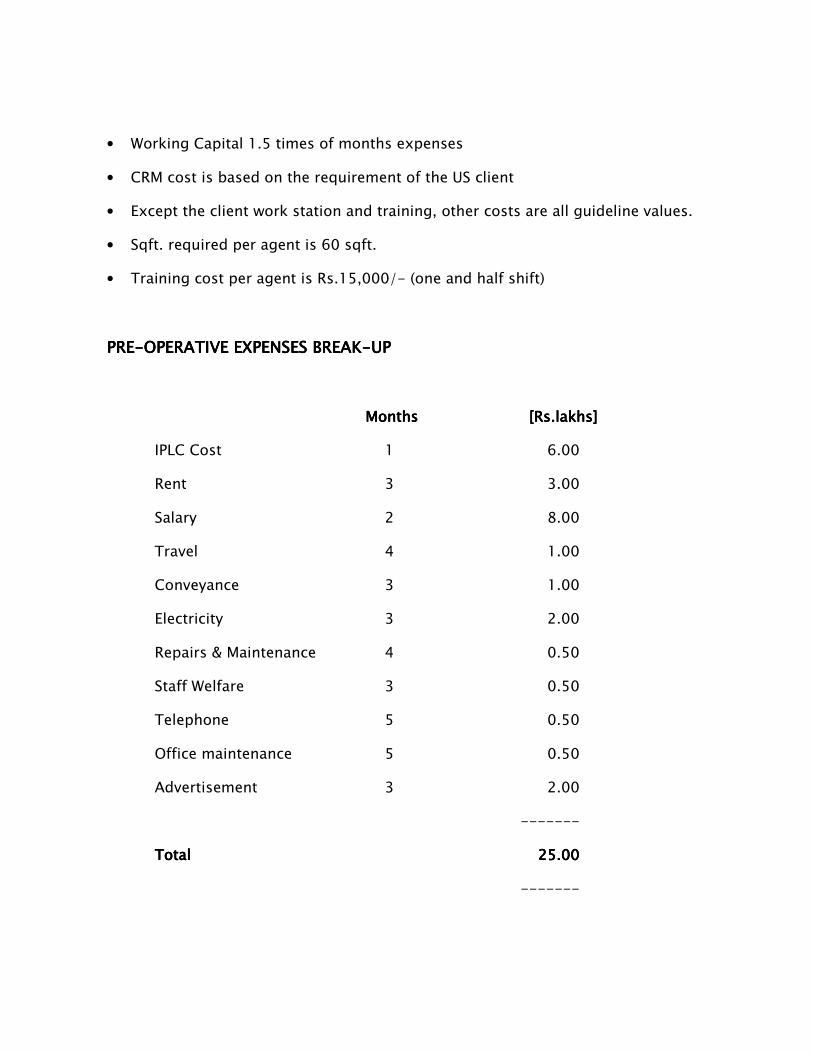
• Working Capital 1.5 times of months expenses
• CRM cost is based on the requirement of the US client
• Except the client work station and training, other costs are all guideline values.
• Sqft. required per agent is 60 sqft.
• Training cost per agent is Rs.15,000/- (one and half shift)
PREPREPREPRE----OPERATIVE EXPENSES BREAKOPERATIVE EXPENSES BREAKOPERATIVE EXPENSES BREAKOPERATIVE EXPENSES BREAK----UPUPUPUP
MonthsMonthsMonthsMonths [Rs.lakhs][Rs.lakhs][Rs.lakhs][Rs.lakhs]
IPLC Cost 1 6.00
Rent 3 3.00
Salary 2 8.00
Travel 4 1.00
Conveyance 3 1.00
Electricity 3 2.00
Repairs & Maintenance 4 0.50
Staff Welfare 3 0.50
Telephone 5 0.50
Office maintenance 5 0.50
Advertisement 3 2.00
-------
TotalTotalTotalTotal 25.0025.0025.0025.00
-------
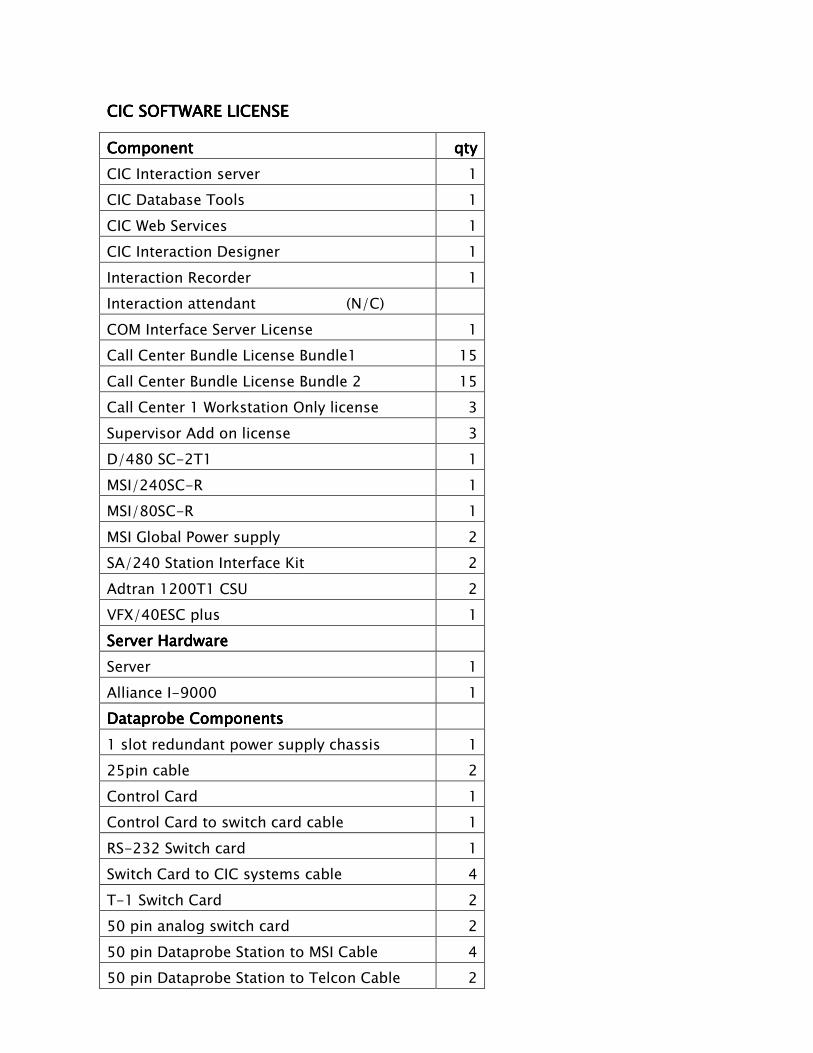
CIC SOFTWARE LICENSE CIC SOFTWARE LICENSE CIC SOFTWARE LICENSE CIC SOFTWARE LICENSE
Component Component Component Component qtyqtyqtyqty
CIC Interaction server 1
CIC Database Tools 1
CIC Web Services 1
CIC Interaction Designer 1
Interaction Recorder 1
Interaction attendant (N/C)
COM Interface Server License 1
Call Center Bundle License Bundle1 15
Call Center Bundle License Bundle 2 15
Call Center 1 Workstation Only license 3
Supervisor Add on license 3
D/480 SC-2T1 1
MSI/240SC-R 1
MSI/80SC-R 1
MSI Global Power supply 2
SA/240 Station Interface Kit 2
Adtran 1200T1 CSU 2
VFX/40ESC plus 1
Server HardwareServer HardwareServer HardwareServer Hardware
Server 1
Alliance I-9000 1
Dataprobe ComponentsDataprobe ComponentsDataprobe ComponentsDataprobe Components
1 slot redundant power supply chassis 1
25pin cable 2
Control Card 1
Control Card to switch card cable 1
RS-232 Switch card 1
Switch Card to CIC systems cable 4
T-1 Switch Card 2
50 pin analog switch card 2
50 pin Dataprobe Station to MSI Cable 4
50 pin Dataprobe Station to Telcon Cable 2
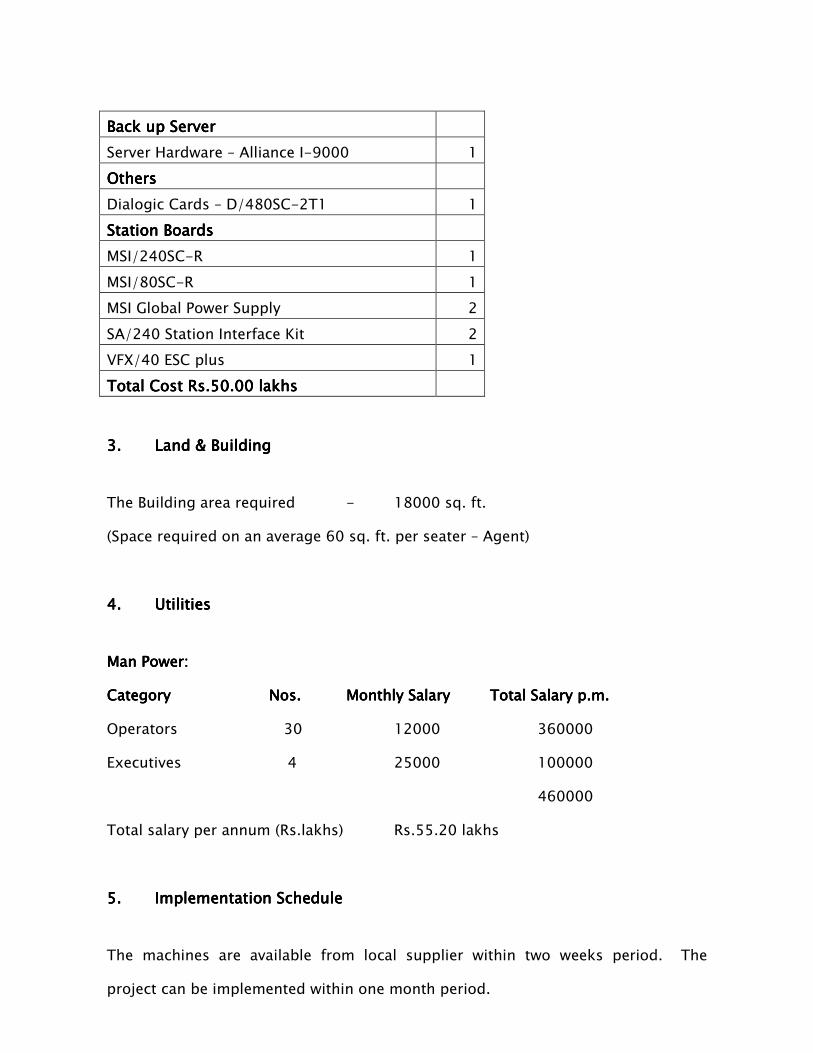
Back up ServerBack up ServerBack up ServerBack up Server
Server Hardware – Alliance I-9000 1
OthersOthersOthersOthers
Dialogic Cards – D/480SC-2T1 1
Station BoardsStation BoardsStation BoardsStation Boards
MSI/240SC-R 1
MSI/80SC-R 1
MSI Global Power Supply 2
SA/240 Station Interface Kit 2
VFX/40 ESC plus 1
Total Cost Rs.50.00 lakhsTotal Cost Rs.50.00 lakhsTotal Cost Rs.50.00 lakhsTotal Cost Rs.50.00 lakhs
3.3.3.3. LLLLand & Buildingand & Buildingand & Buildingand & Building
The Building area required - 18000 sq. ft.
(Space required on an average 60 sq. ft. per seater – Agent)
4.4.4.4. UtilitiesUtilitiesUtilitiesUtilities
Man Power:Man Power:Man Power:Man Power:
CategoryCategoryCategoryCategory Nos.Nos.Nos.Nos. MonthlyMonthlyMonthlyMonthly Salary Salary Salary Salary TotalTotalTotalTotal Salary p.m. Salary p.m. Salary p.m. Salary p.m.
Operators 30 12000 360000
Executives 4 25000 100000
460000
Total salary per annum (Rs.lakhs) Rs.55.20 lakhs
5.5.5.5. Implementation ScheduleImplementation ScheduleImplementation ScheduleImplementation Schedule
The machines are available from local supplier within two weeks period. The
project can be implemented within one month period.
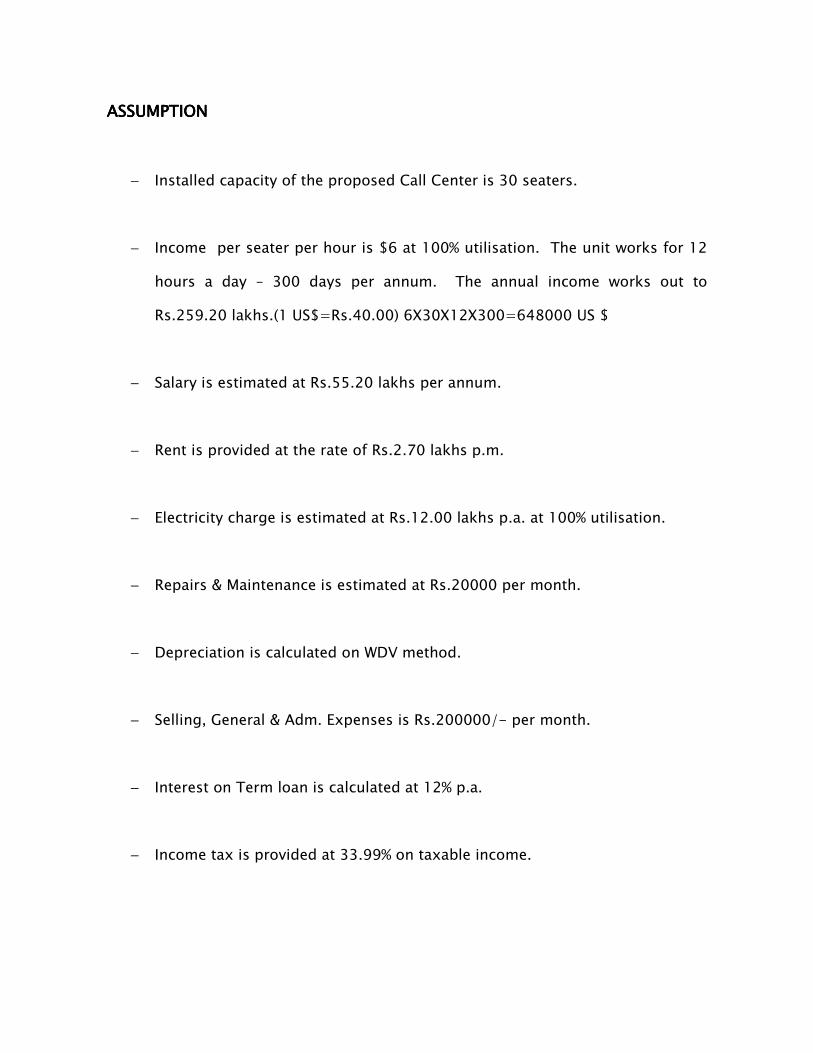
ASSUMPTIONASSUMPTIONASSUMPTIONASSUMPTION
− Installed capacity of the proposed Call Center is 30 seaters.
− Income per seater per hour is $6 at 100% utilisation. The unit works for 12
hours a day – 300 days per annum. The annual income works out to
Rs.259.20 lakhs.(1 US$=Rs.40.00) 6X30X12X300=648000 US $
− Salary is estimated at Rs.55.20 lakhs per annum.
− Rent is provided at the rate of Rs.2.70 lakhs p.m.
− Electricity charge is estimated at Rs.12.00 lakhs p.a. at 100% utilisation.
− Repairs & Maintenance is estimated at Rs.20000 per month.
− Depreciation is calculated on WDV method.
− Selling, General & Adm. Expenses is Rs.200000/- per month.
− Interest on Term loan is calculated at 12% p.a.
− Income tax is provided at 33.99% on taxable income.
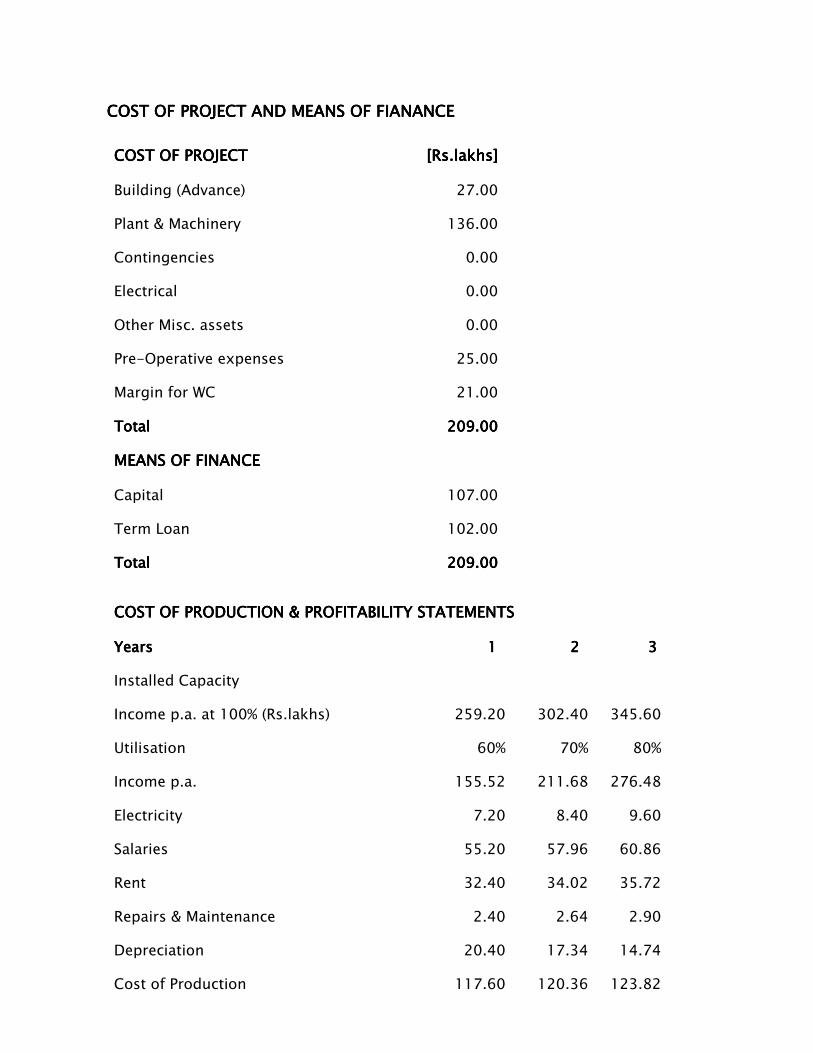
COST OF PROCOST OF PROCOST OF PROCOST OF PROJECT AND MEANS OF FIANANCE JECT AND MEANS OF FIANANCE JECT AND MEANS OF FIANANCE JECT AND MEANS OF FIANANCE
COST OF PROJECT COST OF PROJECT COST OF PROJECT COST OF PROJECT [Rs.lakhs][Rs.lakhs][Rs.lakhs][Rs.lakhs]
Building (Advance) 27.00
Plant & Machinery 136.00
Contingencies 0.00
Electrical 0.00
Other Misc. assets 0.00
Pre-Operative expenses 25.00
Margin for WC 21.00
Total Total Total Total 209.00209.00209.00209.00
MEANS OF FINANCEMEANS OF FINANCEMEANS OF FINANCEMEANS OF FINANCE
Capital 107.00
Term Loan 102.00
Total Total Total Total 209.00209.00209.00209.00
COST OF PRODUCTION & PROFITABILITY STATEMENTSCOST OF PRODUCTION & PROFITABILITY STATEMENTSCOST OF PRODUCTION & PROFITABILITY STATEMENTSCOST OF PRODUCTION & PROFITABILITY STATEMENTS
YearsYearsYearsYears 1 1 1 1 2 2 2 2 3 3 3 3
Installed Capacity
Income p.a. at 100% (Rs.lakhs) 259.20 302.40 345.60
Utilisation 60% 70% 80%
Income p.a. 155.52 211.68 276.48
Electricity 7.20 8.40 9.60
Salaries 55.20 57.96 60.86
Rent 32.40 34.02 35.72
Repairs & Maintenance 2.40 2.64 2.90
Depreciation 20.40 17.34 14.74
Cost of Production 117.60 120.36 123.82
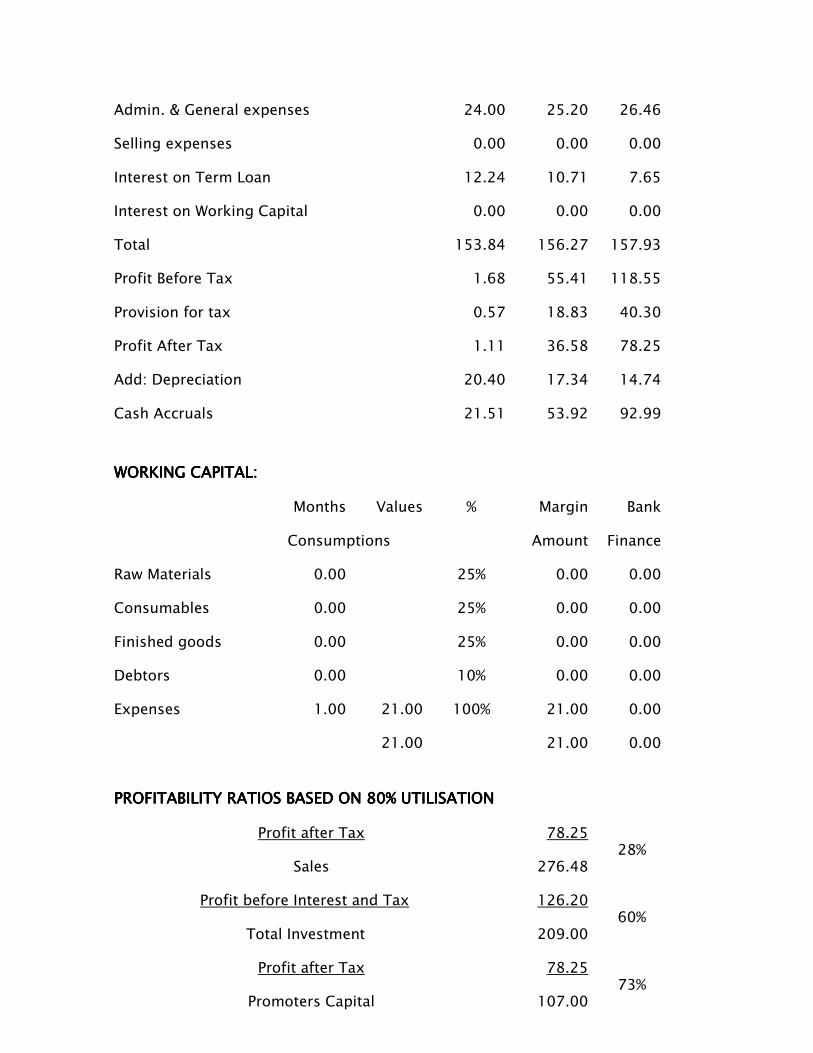
Admin. & General expenses 24.00 25.20 26.46
Selling expenses 0.00 0.00 0.00
Interest on Term Loan 12.24 10.71 7.65
Interest on Working Capital 0.00 0.00 0.00
Total 153.84 156.27 157.93
Profit Before Tax 1.68 55.41 118.55
Provision for tax 0.57 18.83 40.30
Profit After Tax 1.11 36.58 78.25
Add: Depreciation 20.40 17.34 14.74
Cash Accruals 21.51 53.92 92.99
WORKING CAPITAL:WORKING CAPITAL:WORKING CAPITAL:WORKING CAPITAL:
Months Values % Margin Bank
Consumptions Amount Finance
Raw Materials 0.00 25% 0.00 0.00
Consumables 0.00 25% 0.00 0.00
Finished goods 0.00 25% 0.00 0.00
Debtors 0.00 10% 0.00 0.00
Expenses 1.00 21.00 100% 21.00 0.00
21.00 21.00 0.00
PROFITABILITY RATIOS BASED ON 80% UTILISATIONPROFITABILITY RATIOS BASED ON 80% UTILISATIONPROFITABILITY RATIOS BASED ON 80% UTILISATIONPROFITABILITY RATIOS BASED ON 80% UTILISATION
Profit after Tax 78.25
Sales 276.48 28%
Profit before Interest and Tax 126.20
Total Investment 209.00 60%
Profit after Tax 78.25
Promoters Capital 107.00 73%
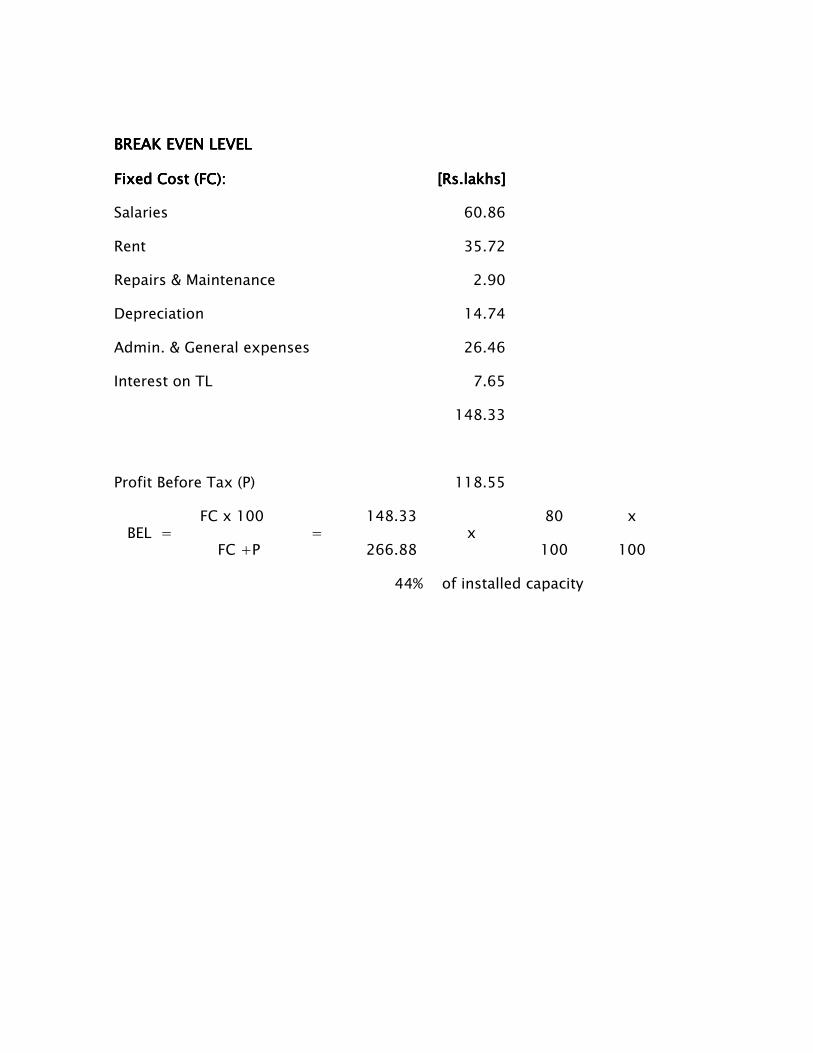
BREAK EVEN LEVELBREAK EVEN LEVELBREAK EVEN LEVELBREAK EVEN LEVEL
Fixed Cost (FC):Fixed Cost (FC):Fixed Cost (FC):Fixed Cost (FC): [Rs.lakhs][Rs.lakhs][Rs.lakhs][Rs.lakhs]
Salaries 60.86
Rent 35.72
Repairs & Maintenance 2.90
Depreciation 14.74
Admin. & General expenses 26.46
Interest on TL 7.65
148.33
Profit Before Tax (P) 118.55
FC x 100 148.33 80 BEL =
FC +P =
266.88 x
100
x
100
44% of installed capacity
COMPUTER BASED TUTORIALCOMPUTER BASED TUTORIALCOMPUTER BASED TUTORIALCOMPUTER BASED TUTORIAL
INTRODUCTIONINTRODUCTIONINTRODUCTIONINTRODUCTION
Computer based tutorial is a new method to enhance the learning capabilities by
adopting modern technology to the educational arena. Different methods of approach
to provide better learning methods by students have to be provided. According to the
level of the learner, under graduate, post graduate, national and international should
be logically arranged. The material presentation should be accurate and proof reading
should be impeccable.
PRODUCT SPECIFICATIONSPRODUCT SPECIFICATIONSPRODUCT SPECIFICATIONSPRODUCT SPECIFICATIONS
The material developed for learning should have the following features:
Flexibility:Flexibility:Flexibility:Flexibility: There should be a provision for presenting as much as material for gifted
learners and as small as possible for slow learners, flexible access to different parts of
a course, which means, a provision to navigate, to go backward / forward; to pause; to
exit or change to any other module as needed by the learner.
Structure and Structure and Structure and Structure and OrganizationOrganizationOrganizationOrganization of Modules of Modules of Modules of Modules: : : : Each module content should be precisely
defined; the sequence should be logically developed, not in jumps and bits and each
module should naturally end up in the beginning of the succeeding one. Links
between the modules and guided learning posts should be based on learner’s
responses. There should be suggestions for advanced areas of the subject matter.
Learner Control:Learner Control:Learner Control:Learner Control: The learner should have a control on what he learns and how he
learnt for which interface design between the computer and the learner, should be
user- friendly, the software used should not complicate the learner. The screen format
should be in few lines, good fonts, and colour contrast suitable for the topic, graphic,
images, dynamic pictures with animation in 2D, 3D wherever necessary, video and
suitable audio guiding the learner.
Links:Links:Links:Links: Optional linking routes and guided learning posts and freedom of movement,
links with menus, control navigational buttons, diagrams, route maps. Zooming for
picture, sound, as needed, overview through video and audio, instructions on how to
use the program sign posting through help should all be provided for.
System Performance:System Performance:System Performance:System Performance: Response should not be too slow or too fast. Learner
response should be stored until asked for removal.
Support MaterialSupport MaterialSupport MaterialSupport Material:::: CBT developed should integrate with other resource in the field.
ProductioProductioProductioProduction quality:n quality:n quality:n quality: Graphics, images, pictures, graphs should be clear and the
explanation should be proper with necessary mathematical back up, simulation should
be used, and not line drawings.
Effective Presentations:Effective Presentations:Effective Presentations:Effective Presentations: Simple language, clarity in explanation; avoidance of
complex jargon and unnecessary information examples from real life; short sentences
and paragraphs and explanation in all technical terms and notational derivations.
Interactivity:Interactivity:Interactivity:Interactivity: Allow for two-way interaction through links.
Testing and monitoTesting and monitoTesting and monitoTesting and monitoring:ring:ring:ring: This is very much needed at the end of each chapter
through, quiz, questionnaire and evaluation exercise.
A.A.A.A. MARKET POTENTIALMARKET POTENTIALMARKET POTENTIALMARKET POTENTIAL
IT enabled services such as computer based Tutorial has good scope to be developed
in India on account of several advantages such as large English speaking population
and well connected telecommunication system. Cost benefits such as low man power
cost etc. persons with good knowledge in academic and other subjects are abundant.
CBT can be developed for several foreign customers.
B.B.B.B. TECHNICAL ASPECTSTECHNICAL ASPECTSTECHNICAL ASPECTSTECHNICAL ASPECTS
1.1.1.1. Installed capacityInstalled capacityInstalled capacityInstalled capacity
The small unit for developing CBT can develop 24 titles per annum at the rate of 2
titles per month.
2.2.2.2. Equipment requiredEquipment requiredEquipment requiredEquipment required
The following infrastructure is required.
Qty.Qty.Qty.Qty. [Rs.lakhs] [Rs.lakhs] [Rs.lakhs] [Rs.lakhs]
Servers 1 no 1.50
Computers 5 nos. 1.50
Cabling in meters 20 mt. 0.05
Interiors 1.80
Connectivity 0.20
UPS 0.10
5555....15151515
3.3.3.3. Process of DevelopmentProcess of DevelopmentProcess of DevelopmentProcess of Development
On receipt of orders for development of CBT on various subjects from overseas buyers,
the unit has to engage professors on different subjects on a retainer basis for
development of the learning material. The materials have to be checked for quality
control. The approval has to be obtained from quality control authority for developed
programmes. A security deposit of $ 500 per title is to be paid to the overseas client
for successful completion of the project. On successful completion this amount will be
refunded. This will be revolving in nature. A commission equivalent to 25% will be to
be paid to overseas agent who obtains the order. The commission can also be
included in the invoice.
4.4.4.4. Land & BuildingLand & BuildingLand & BuildingLand & Building
An area of 1500 sq. ft will be sufficient. This can be arranged on lease basis, Rent of
Rs.12000 p.m., with an advance of Rs.120,000.
5.5.5.5. UtilitiesUtilitiesUtilitiesUtilities
POWERPOWERPOWERPOWER::::
Normal electricity connection is required for office.
MAN POWERMAN POWERMAN POWERMAN POWER::::
CategoryCategoryCategoryCategory Nos.Nos.Nos.Nos. MonthlyMonthlyMonthlyMonthly TotalTotalTotalTotal
Project Manager 1 15000 15000
Programmer 3 10000 30000
Designer 1 9000 9000
Admin. Assistant 1 6000 6000
60606060000000000000
Total salary per annum (Rs.lakhs) Rs.7.20 lakhs
Professors - on retainer basis, Contract.
6.6.6.6. Implementation ScheduleImplementation ScheduleImplementation ScheduleImplementation Schedule
The machines are obtainable from local supplier within two weeks period. The project
can be implemented within one month period.
7.7.7.7. AssumptionsAssumptionsAssumptionsAssumptions
− Installed capacity is 24 No. of titles per annum (2 titles Per month)
− Selling price is assumed at Rs.1.00 lakhs per title,
− Electricity charge is calculated at Rs.1.20 lakh per annum at 100% capacity.
− Wages & Salaries is estimated at Rs.7.20 lakhs per annum.
− Rent is provided at Rs.90000 per annum.
− Repairs & Maintenance is estimated at Rs.5000 per month.
− Professors' fees is provided at Rs.1.40 lakhs per annum.
− Depreciation is calculated on WDV method.
− Selling, General & Adm. Expenses is Rs.20000 per month.
− Interest on Term loan is calculated at 12% p.a.
− Income tax is provided at 33.99% on taxable income.
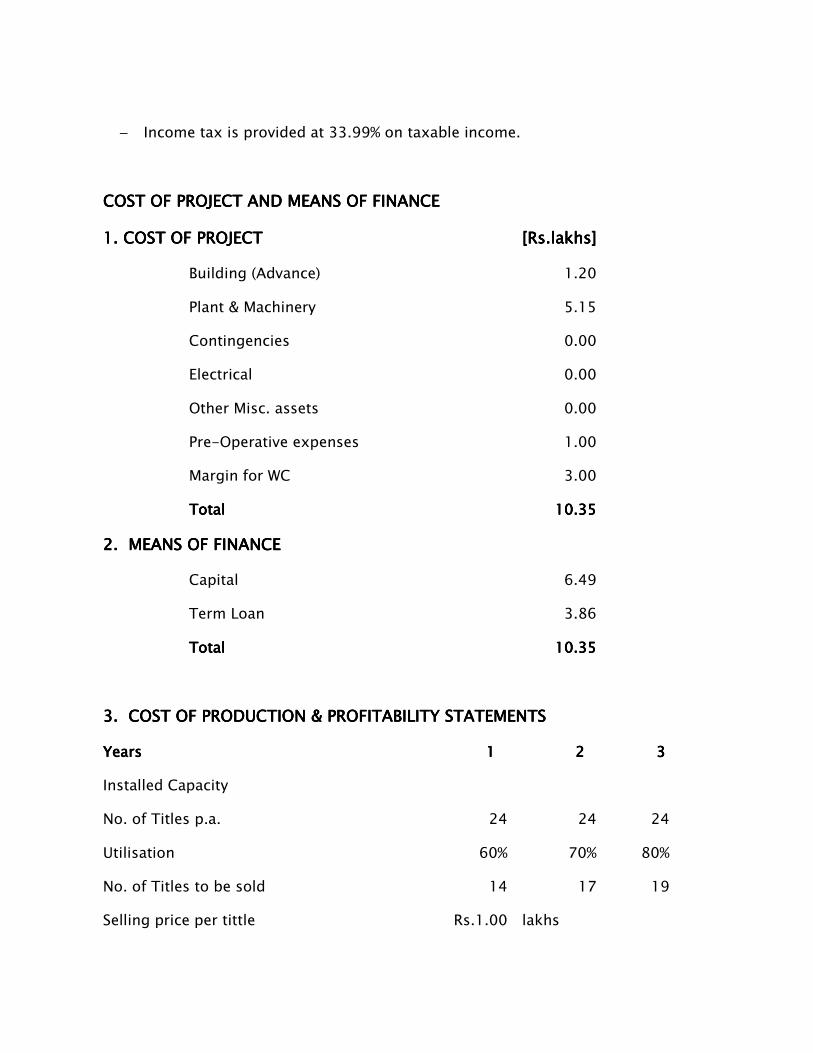
COST OF PROJECT AND MEANS OF FINANCE COST OF PROJECT AND MEANS OF FINANCE COST OF PROJECT AND MEANS OF FINANCE COST OF PROJECT AND MEANS OF FINANCE
1. COST OF PROJECT1. COST OF PROJECT1. COST OF PROJECT1. COST OF PROJECT [Rs.lakhs][Rs.lakhs][Rs.lakhs][Rs.lakhs]
Building (Advance) 1.20
Plant & Machinery 5.15
Contingencies 0.00
Electrical 0.00
Other Misc. assets 0.00
Pre-Operative expenses 1.00
Margin for WC 3.00
Total Total Total Total 10.3510.3510.3510.35
2. MEANS OF FINANCE2. MEANS OF FINANCE2. MEANS OF FINANCE2. MEANS OF FINANCE
Capital 6.49
Term Loan 3.86
Total Total Total Total 10.3510.3510.3510.35
3. COST OF PRODUCTION & PROFITABILITY STATEMENTS3. COST OF PRODUCTION & PROFITABILITY STATEMENTS3. COST OF PRODUCTION & PROFITABILITY STATEMENTS3. COST OF PRODUCTION & PROFITABILITY STATEMENTS
YearYearYearYearssss 1 1 1 1 2 2 2 2 3 3 3 3
Installed Capacity
No. of Titles p.a. 24 24 24
Utilisation 60% 70% 80%
No. of Titles to be sold 14 17 19
Selling price per tittle Rs.1.00 lakhs
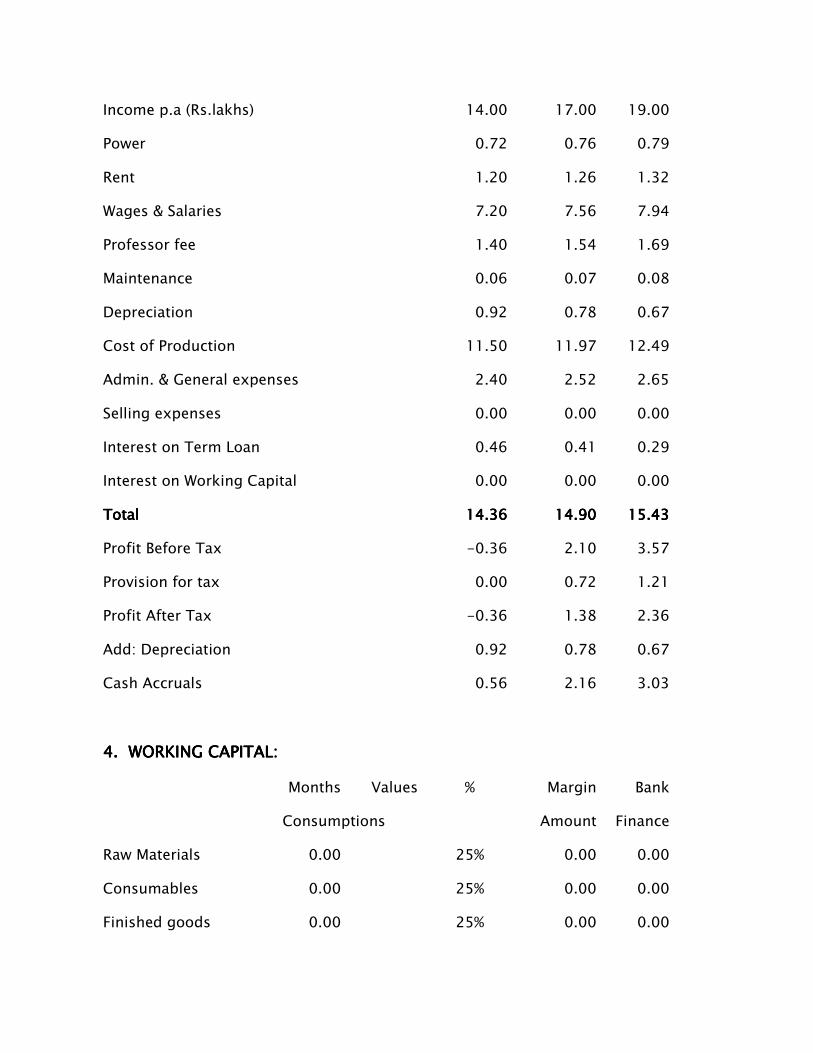
Income p.a (Rs.lakhs) 14.00 17.00 19.00
Power 0.72 0.76 0.79
Rent 1.20 1.26 1.32
Wages & Salaries 7.20 7.56 7.94
Professor fee 1.40 1.54 1.69
Maintenance 0.06 0.07 0.08
Depreciation 0.92 0.78 0.67
Cost of Production 11.50 11.97 12.49
Admin. & General expenses 2.40 2.52 2.65
Selling expenses 0.00 0.00 0.00
Interest on Term Loan 0.46 0.41 0.29
Interest on Working Capital 0.00 0.00 0.00
TotalTotalTotalTotal 14.3614.3614.3614.36 14.9014.9014.9014.90 15.4315.4315.4315.43
Profit Before Tax -0.36 2.10 3.57
Provision for tax 0.00 0.72 1.21
Profit After Tax -0.36 1.38 2.36
Add: Depreciation 0.92 0.78 0.67
Cash Accruals 0.56 2.16 3.03
4. WORKING CAPITAL:4. WORKING CAPITAL:4. WORKING CAPITAL:4. WORKING CAPITAL:
Months Values % Margin Bank
Consumptions Amount Finance
Raw Materials 0.00 25% 0.00 0.00
Consumables 0.00 25% 0.00 0.00
Finished goods 0.00 25% 0.00 0.00
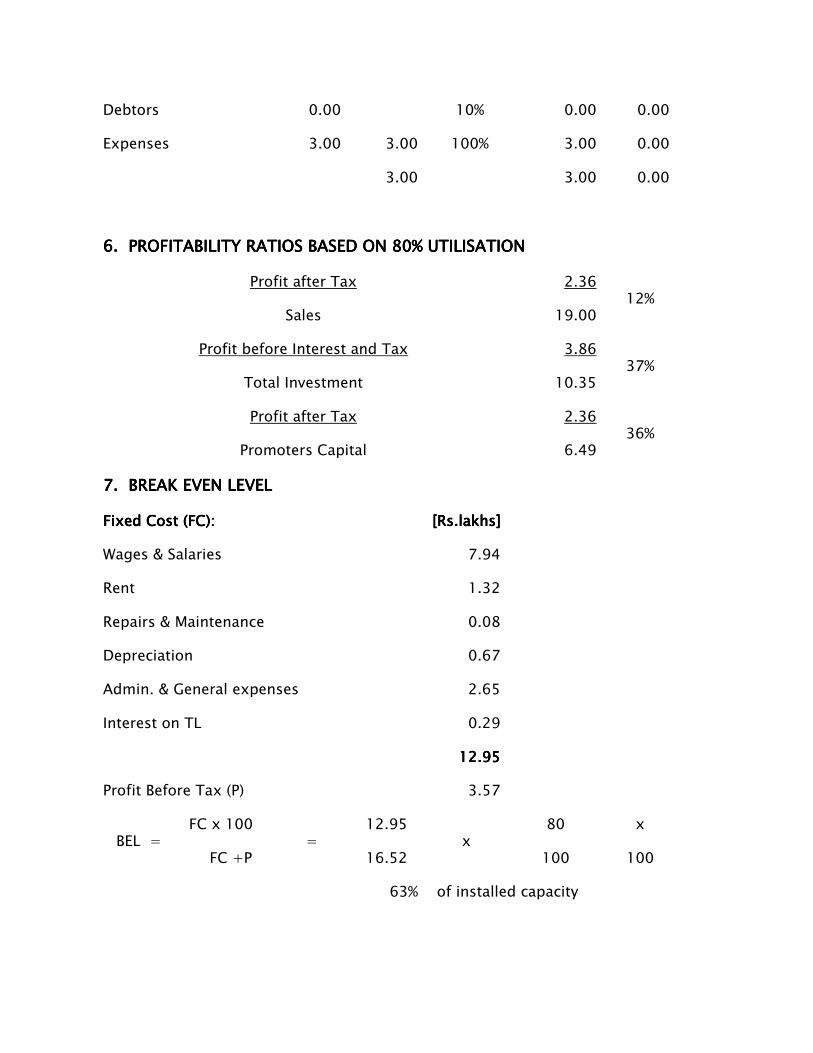
Debtors 0.00 10% 0.00 0.00
Expenses 3.00 3.00 100% 3.00 0.00
3.00 3.00 0.00
6. PROFITABILITY RATIOS BASED ON 80% UTILISATION6. PROFITABILITY RATIOS BASED ON 80% UTILISATION6. PROFITABILITY RATIOS BASED ON 80% UTILISATION6. PROFITABILITY RATIOS BASED ON 80% UTILISATION
Profit after Tax 2.36
Sales 19.00 12%
Profit before Interest and Tax 3.86
Total Investment 10.35 37%
Profit after Tax 2.36
Promoters Capital 6.49 36%
7. BREAK EVEN LEVEL7. BREAK EVEN LEVEL7. BREAK EVEN LEVEL7. BREAK EVEN LEVEL
Fixed Cost (FC):Fixed Cost (FC):Fixed Cost (FC):Fixed Cost (FC): [Rs.lakhs][Rs.lakhs][Rs.lakhs][Rs.lakhs]
Wages & Salaries 7.94
Rent 1.32
Repairs & Maintenance 0.08
Depreciation 0.67
Admin. & General expenses 2.65
Interest on TL 0.29
12.9512.9512.9512.95
Profit Before Tax (P) 3.57
FC x 100 12.95 80 BEL =
FC +P =
16.52 x
100
x
100
63% of installed capacity
1
COMPUTER CONTINUOUS STATIONERY PRINTINGCOMPUTER CONTINUOUS STATIONERY PRINTINGCOMPUTER CONTINUOUS STATIONERY PRINTINGCOMPUTER CONTINUOUS STATIONERY PRINTING
A.A.A.A. INTRODUCTIONINTRODUCTIONINTRODUCTIONINTRODUCTION
This is an age of computers. Computerization is being carried out at an ever
increasing rate in all the fields. The consumption of computer stationery has been
increasing due to the following reasons:
(a) The demand for computer stationery and computer forms is dependent on
overall growth of computers and usage of computers.
(b) Computer in modern world has emerged as a major driving force for the
progress of a nation.
(c) No machine has ever undergone such a rapid change over last forty years to the
extent the computer has.
The modern computer is known as Fifth Generation Computer. It is small in size (as
small as the briefcase in the case of note book computer) speedy and are having a
large memory.
The computer is used for preparing pay rolls, Inventory controls, Statistical quality
control, Building management and Information System for Production Planning and
Control, Project Monitoring and Design Calculations, Analysing and Tabulating data,
Monitoring examinations and their results, Storing and Forwarding telegrams, Handling
Reservations in Railways and Airlines, Repair of Locomotives, Control of freight
movement, Deposit and Credit Management and so on.
The computer industry has been registering remarkable growth as high as 48% during
the past 3 years. The computer has been well accepted in all walks of life and,
therefore, there is an immediate necessity for making available large number of
2
computers in-houses, schools, business houses, industries, hotels, hospitals, trading
houses etc.
B.B.B.B. PRODUCT SPECIFICATION & USESPRODUCT SPECIFICATION & USESPRODUCT SPECIFICATION & USESPRODUCT SPECIFICATION & USES
IS : 12799 – 1989 prescribes the requirements and methods of sampling and tests for
computer papers for use on computer printers or similar machines for recording,
transmitting, reproducing and storage of data. The other relevant standards for
quality are as follows:
i. Methods of sampling and test for paper are dealt in
IS : 1060 (Part I) – 1966 (revised) and
IS : 1060 (Part II) 1060
ii. The quality of computer paper shall be in accordance with IS : 1848 – 1981
iii. The paper is tested for fibre content in accordance with IS : 5285 – 1969
iv. The smoothness/roughness of paper is checked in accordance with IS : 9894 –
1981
v. Various requirements for computer paper such as Bulk, Moisture content, Ash
content, Tensile index, Burst index, Tear Index, one minute cobb test, opacity
percentage, are specified in IS : 12766 – 1989 and tested in accordance with IS :
1060 (Part I) – 1966. The other characteristics like Brightness and smoothness,
which are also specified in IS : 1060 (Part II) and IS : 9894.
The proposed project can produce blank forms, EZR and multi-coloured pre-printed
forms of all standard sizes required for use in computer and EDP machines such as
3
invoice, challans, receipts, pay slips, statements, bank statements, insurance railway
defence forms, allotment letter etc.
C.C.C.C. MARKET POTENTIALMARKET POTENTIALMARKET POTENTIALMARKET POTENTIAL
Since 1984, India has witnessed an unprecedented computer boom. Along with it
boomed another industry - computer stationery manufacturing. According to available
estimates, on an average, each computer consumes 4000 computer forms every
month. With over 3.5 million computers in the Indian market, the demand for
computer forms works out to a staggering 14 billion forms monthly.
The computer forms industry is one of India’s fastest growing industries having a
volume growth rate of approximately 30% per annum as against the Indian industry’s
average growth rate of 5%.
As of now, only 7% of the urban population in India has access to computers. This
translates to only 2.3% of the entire Indian population. The computer stationery
consumption has already reached a staggering 3600 crores. And this is only the tip of
the iceberg. Everyone, from the street corner-restaurant to the big corporations, is
using computers. States like Andhra and Karnataka are creating an atmosphere
favorable enough for giants like Microsoft to shift their bases to India. All the States
are promoting infotech parks to promote e-commerce.
4
The computers are widely used in all the areas of business and service industries like
Airlines, Railways, Hotel industries etc. The following applications of computers have
developed in India:
1.1.1.1. Elementary Tasks:Elementary Tasks:Elementary Tasks:Elementary Tasks:
a. For preparing Pay rolls
b. For inventory controls
c. For Statistical Quality Control
d. For Building Management Information System
e. For Production Planning and Control
f. For Project Monitoring and Design Calculation.
2.2.2.2. In Government departments:In Government departments:In Government departments:In Government departments:
a. For Planning
b. For Analysing and Tabulating Data
c. For Monitoring preparation of statements
3.3.3.3. In Police Departments:In Police Departments:In Police Departments:In Police Departments:
a. For Preparing Crime Statistics
b. For Maintaining Criminal Records
5
4.4.4.4. In Educational Departments:In Educational Departments:In Educational Departments:In Educational Departments:
a. In Monitoring Examinations and their results
b. Maintaining Students’ Records
c. In General University Administration.
5.5.5.5. In Posts and Telegraphs In Posts and Telegraphs In Posts and Telegraphs In Posts and Telegraphs & Telephone & Telephone & Telephone & Telephone DepartmenDepartmenDepartmenDepartments:ts:ts:ts:
a. Storing and Forwarding Telegrams
b. In the operation of Electronic Exchange Systems
c. Billing telephones
6.6.6.6. In Transport Sectors:In Transport Sectors:In Transport Sectors:In Transport Sectors:
a. For Handling Reservations in Airlines and Railways
b. For Cargo dispatch and Records
c. For Ports’ Inventory Controls
d. For General Management Functions
e. For Repairs of Locomotives in the workshops in railways
f. For Monitoring Wagon and control of freight movements in Railways
7.7.7.7. In Banking Sectors:In Banking Sectors:In Banking Sectors:In Banking Sectors:
a. For Deposit Management
b. For Credit Management
6
c. For Inter-Branch and reconciliation work
8.8.8.8. In ManuIn ManuIn ManuIn Manufacturing Units:facturing Units:facturing Units:facturing Units:
a. To direct process control in any large units
b. In Thermal Power Stations.
In developed countries computers are used for personal work also, like assisting family
budgeting, keeping records of bills and payments etc. Attempt is being made to
incorporate artificial intelligence in computer and USA has already introduced a
computer which can learn as well. Japan is planning for a computer city, where no
human beings will be required to perform any activity. New invention in this direction
will, beyond doubt, increase the utility of computer and thus boost computer and allied
industries.
D.D.D.D. TECHNICAL ASPECTSTECHNICAL ASPECTSTECHNICAL ASPECTSTECHNICAL ASPECTS
1.1.1.1. Installed capacityInstalled capacityInstalled capacityInstalled capacity
The installed capacity of the unit proposed is 96,000 forms per day of standard size
10” X 12”. This works out to 288 lakhs forms per annum. The capacity is based on
single shift basis 8 hours per shift for 300 days.
7
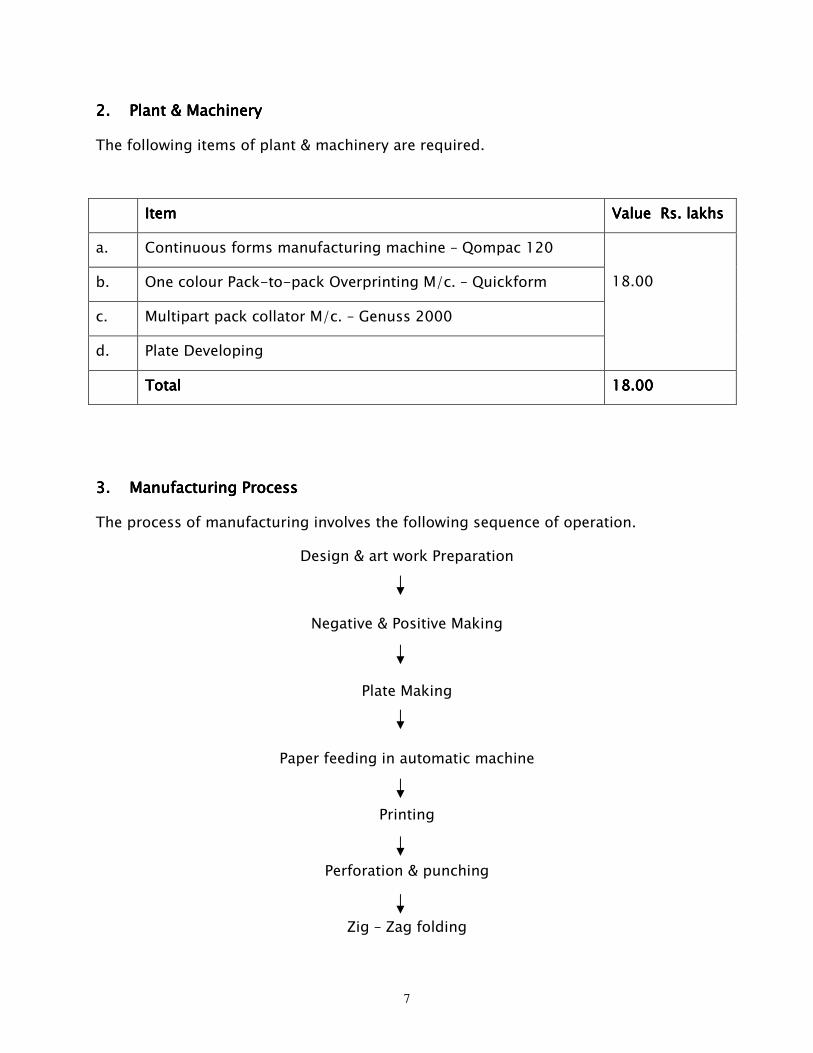
2.2.2.2. Plant & MachineryPlant & MachineryPlant & MachineryPlant & Machinery
The following items of plant & machinery are required.
ItemItemItemItem Value Value Value Value Rs.Rs.Rs.Rs. lakhslakhslakhslakhs
a. Continuous forms manufacturing machine – Qompac 120
b. One colour Pack-to-pack Overprinting M/c. – Quickform
c. Multipart pack collator M/c. – Genuss 2000
d. Plate Developing
18.00
TotalTotalTotalTotal 11118888.00.00.00.00
3.3.3.3. Manufacturing ProcessManufacturing ProcessManufacturing ProcessManufacturing Process
The process of manufacturing involves the following sequence of operation.
Design & art work Preparation
Negative & Positive Making
Plate Making
Paper feeding in automatic machine
Printing
Perforation & punching
Zig – Zag folding
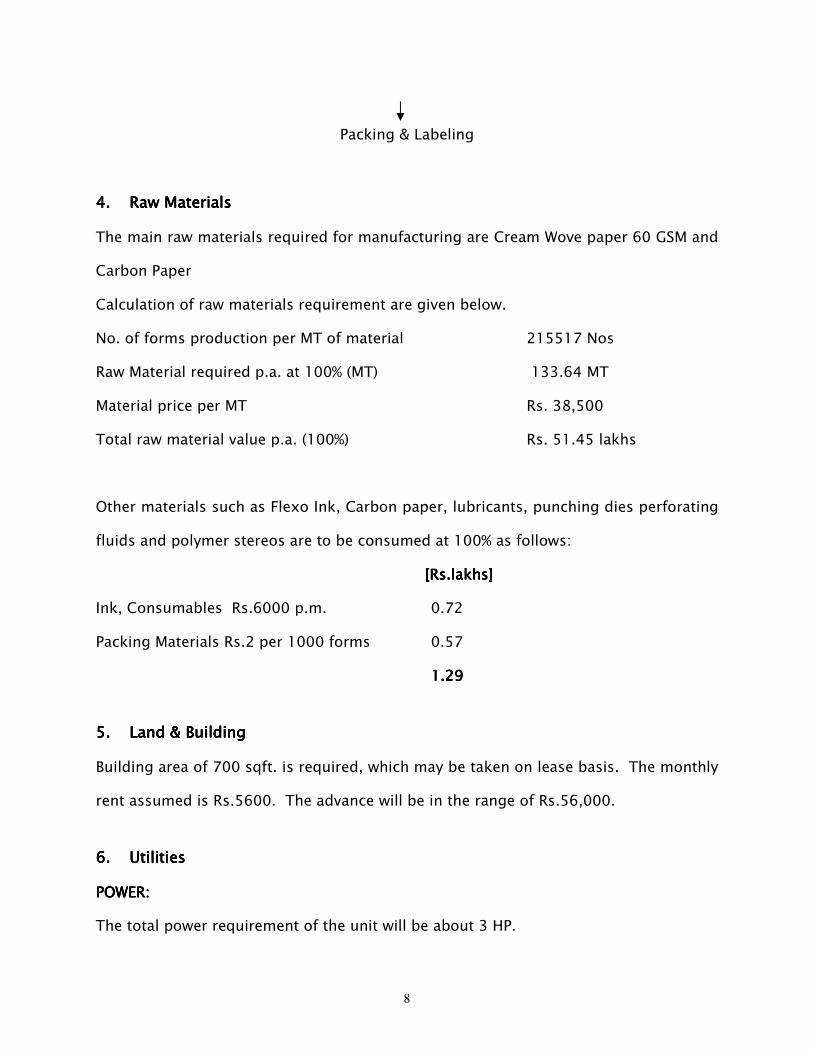
8
Packing & Labeling
4.4.4.4. Raw MaterialsRaw MaterialsRaw MaterialsRaw Materials
The main raw materials required for manufacturing are Cream Wove paper 60 GSM and
Carbon Paper
Calculation of raw materials requirement are given below.
No. of forms production per MT of material 215517 Nos
Raw Material required p.a. at 100% (MT) 133.64 MT
Material price per MT Rs. 38,500
Total raw material value p.a. (100%) Rs. 51.45 lakhs
Other materials such as Flexo Ink, Carbon paper, lubricants, punching dies perforating
fluids and polymer stereos are to be consumed at 100% as follows:
[Rs.lakhs][Rs.lakhs][Rs.lakhs][Rs.lakhs]
Ink, Consumables Rs.6000 p.m. 0.72
Packing Materials Rs.2 per 1000 forms 0.57
1.21.21.21.29999
5.5.5.5. Land & BuildingLand & BuildingLand & BuildingLand & Building
Building area of 700 sqft. is required, which may be taken on lease basis. The monthly
rent assumed is Rs.5600. The advance will be in the range of Rs.56,000.
6.6.6.6. UtilitiesUtilitiesUtilitiesUtilities
POWERPOWERPOWERPOWER: : : :
The total power requirement of the unit will be about 3 HP.
9
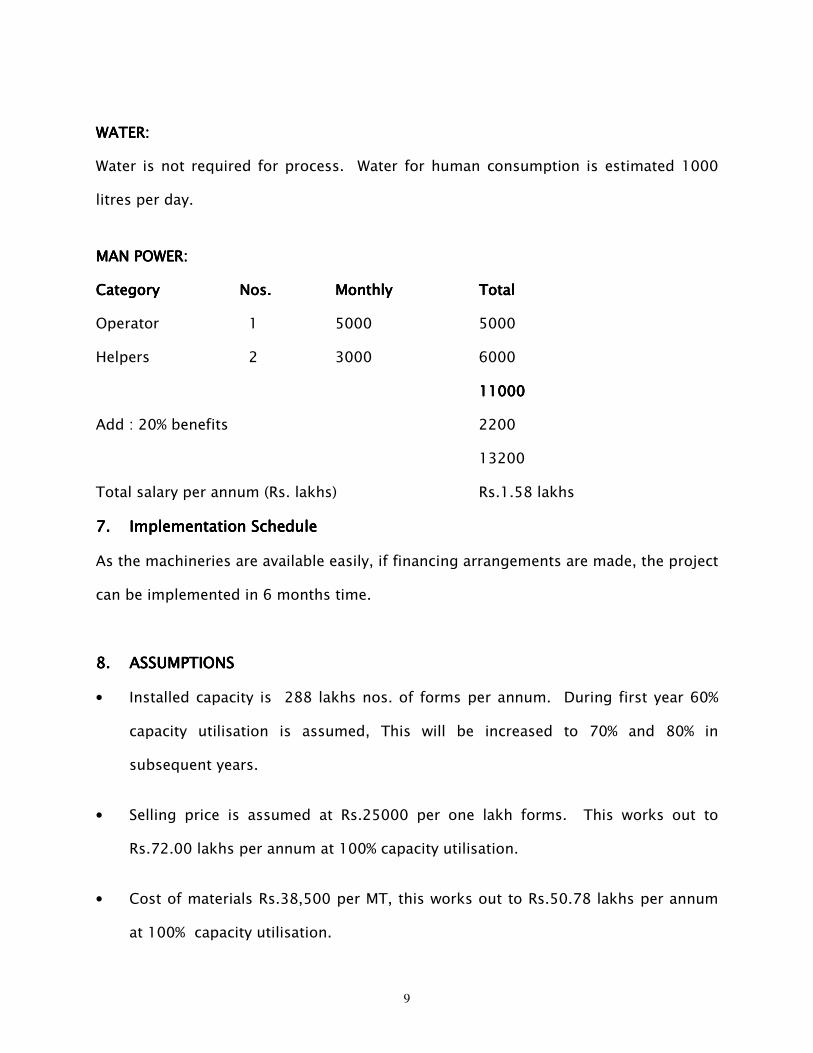
WATERWATERWATERWATER::::
Water is not required for process. Water for human consumption is estimated 1000
litres per day.
MAN POWERMAN POWERMAN POWERMAN POWER::::
CategoryCategoryCategoryCategory Nos.Nos.Nos.Nos. MonthlyMonthlyMonthlyMonthly TotalTotalTotalTotal
Operator 1 5000 5000
Helpers 2 3000 6000
11011011011000000000
Add : 20% benefits 2200
13200
Total salary per annum (Rs. lakhs) Rs.1.58 lakhs
7.7.7.7. Implementation ScheduleImplementation ScheduleImplementation ScheduleImplementation Schedule
As the machineries are available easily, if financing arrangements are made, the project
can be implemented in 6 months time.
8.8.8.8. ASSUMPTIONSASSUMPTIONSASSUMPTIONSASSUMPTIONS
• Installed capacity is 288 lakhs nos. of forms per annum. During first year 60%
capacity utilisation is assumed, This will be increased to 70% and 80% in
subsequent years.
• Selling price is assumed at Rs.25000 per one lakh forms. This works out to
Rs.72.00 lakhs per annum at 100% capacity utilisation.
• Cost of materials Rs.38,500 per MT, this works out to Rs.50.78 lakhs per annum
at 100% capacity utilisation.
10
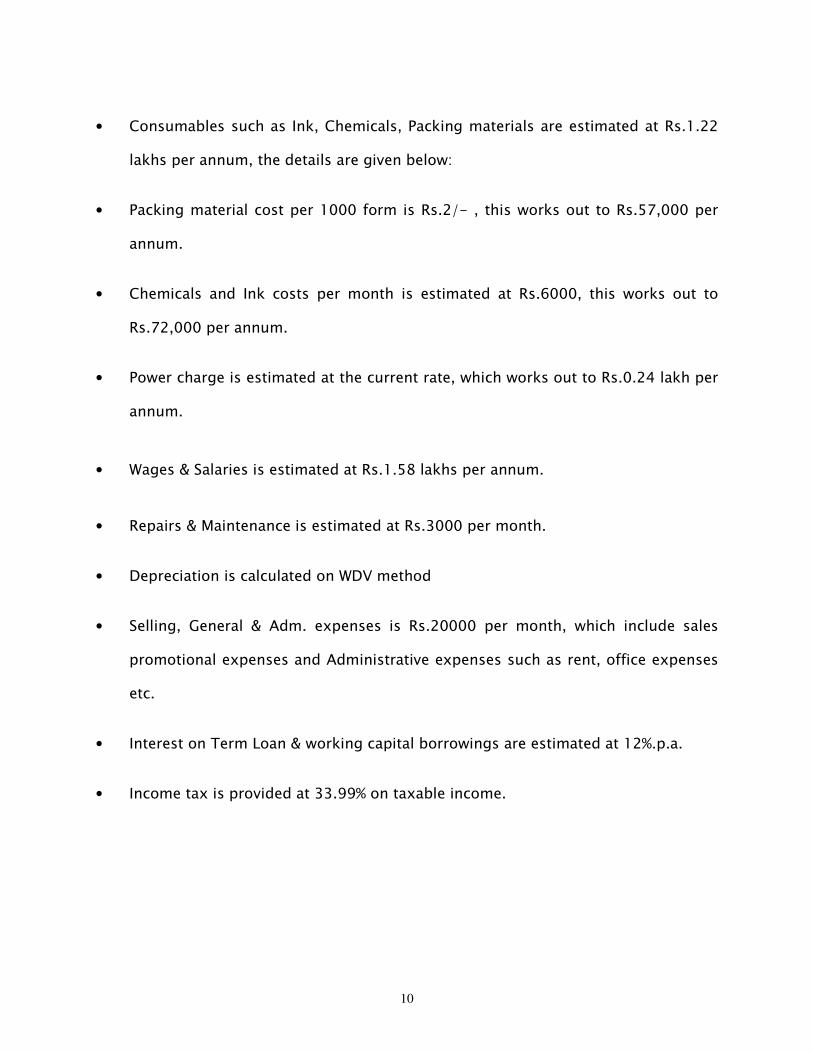
• Consumables such as Ink, Chemicals, Packing materials are estimated at Rs.1.22
lakhs per annum, the details are given below:
• Packing material cost per 1000 form is Rs.2/- , this works out to Rs.57,000 per
annum.
• Chemicals and Ink costs per month is estimated at Rs.6000, this works out to
Rs.72,000 per annum.
• Power charge is estimated at the current rate, which works out to Rs.0.24 lakh per
annum.
• Wages & Salaries is estimated at Rs.1.58 lakhs per annum.
• Repairs & Maintenance is estimated at Rs.3000 per month.
• Depreciation is calculated on WDV method
• Selling, General & Adm. expenses is Rs.20000 per month, which include sales
promotional expenses and Administrative expenses such as rent, office expenses
etc.
• Interest on Term Loan & working capital borrowings are estimated at 12%.p.a.
• Income tax is provided at 33.99% on taxable income.
11
LIST OF MACHINERY SUPPLIERSLIST OF MACHINERY SUPPLIERSLIST OF MACHINERY SUPPLIERSLIST OF MACHINERY SUPPLIERS
1. Alois Gutenberg Machines Pvt. Ltd., Dealer: Shri Gutenbery Graphics, Plot No.4,
Gangai Aman Koil Street, Vijaya Nagar, Sridevikuppam, Valasarvakkam, Chennai
600 087.
2. M/s.Raviraj Computer Forms (P) Ltd., 113, Lawley Road, Coimbatore 641 003
3. M/s. Allegro Consultancy & Marketing (P) Ltd., 4, IIIrd Floor, Park View Complex
85, G.N.Complex Chennai 600 017.
4. M/c. Gayathri Machineries, No.30, Jones Street, Chennai 600 0021.
LIST OF RLIST OF RLIST OF RLIST OF RAW MATERIAL SUPPLIERSAW MATERIAL SUPPLIERSAW MATERIAL SUPPLIERSAW MATERIAL SUPPLIERS
PAPER:PAPER:PAPER:PAPER:
1. M/s. Tamil Nadu Newsprint & Papers Ltd., No.16, Whites Road,, Chennai - 14
2. M/s. Pandiyan Paper Co., No.9, Baker Street, Chennai 600 001
3. M/s. ITC Bhadrachalam Paper boards Ltd., No.106, Sardar Patel Road,
Secunderabad 500 003., Andhra Pradesh.
PRINTING INKPRINTING INKPRINTING INKPRINTING INK
1. M/s. Reprographic System & Supplies, No.52, Triplicane High Raod, Chennai - 5.
2. M/s.Chemi – Dyes, No.148, Govindappa Naicken Street, Chennai 600 001
3. M/s.Coates of India Ltd., No.92, Shaik Mistry Street, Chennai 600 013.
4. M/s. Kapoor Sales Corporation, No.2, Masilamani Road, Chennai 600 014.
12
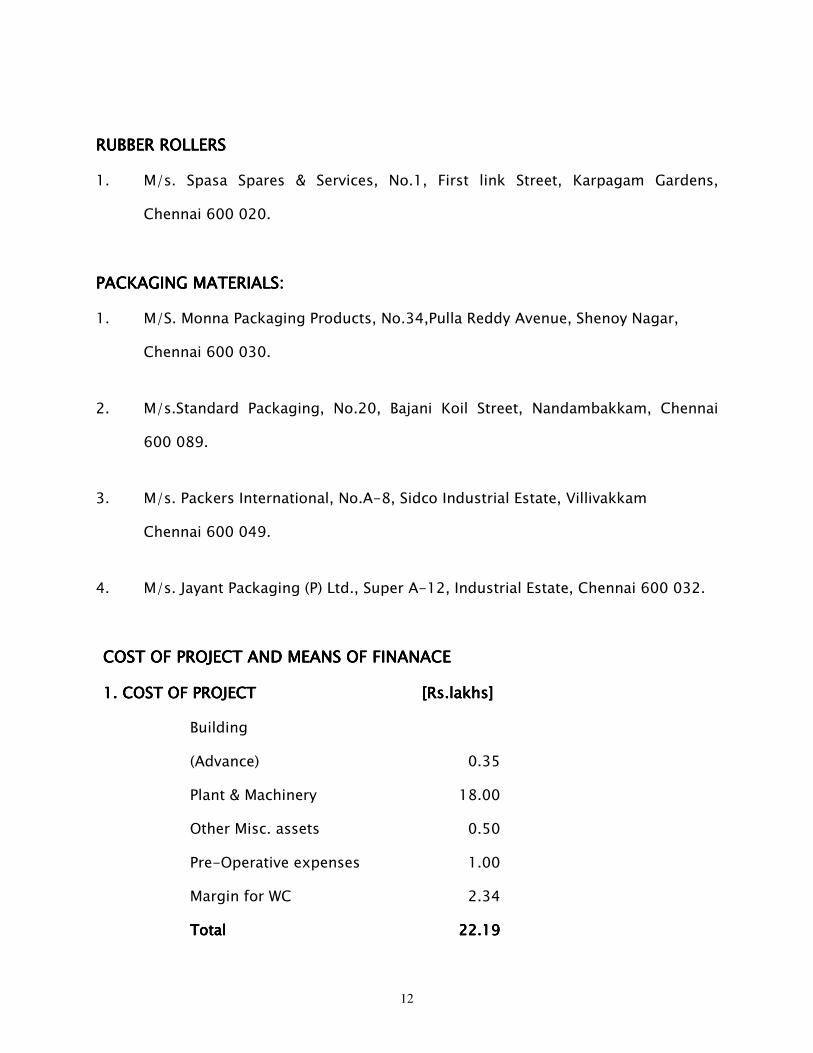
RUBBER ROLLERSRUBBER ROLLERSRUBBER ROLLERSRUBBER ROLLERS
1. M/s. Spasa Spares & Services, No.1, First link Street, Karpagam Gardens,
Chennai 600 020.
PACKAGING MATERIALS:PACKAGING MATERIALS:PACKAGING MATERIALS:PACKAGING MATERIALS:
1. M/S. Monna Packaging Products, No.34,Pulla Reddy Avenue, Shenoy Nagar,
Chennai 600 030.
2. M/s.Standard Packaging, No.20, Bajani Koil Street, Nandambakkam, Chennai
600 089.
3. M/s. Packers International, No.A-8, Sidco Industrial Estate, Villivakkam
Chennai 600 049.
4. M/s. Jayant Packaging (P) Ltd., Super A-12, Industrial Estate, Chennai 600 032.
COST OF PROJECT AND MEANS OF FINANACECOST OF PROJECT AND MEANS OF FINANACECOST OF PROJECT AND MEANS OF FINANACECOST OF PROJECT AND MEANS OF FINANACE
1. COST OF PROJECT1. COST OF PROJECT1. COST OF PROJECT1. COST OF PROJECT [Rs.lakhs][Rs.lakhs][Rs.lakhs][Rs.lakhs]
Building
(Advance) 0.35
Plant & Machinery 18.00
Other Misc. assets 0.50
Pre-Operative expenses 1.00
Margin for WC 2.34
Total Total Total Total 22.1922.1922.1922.19
13
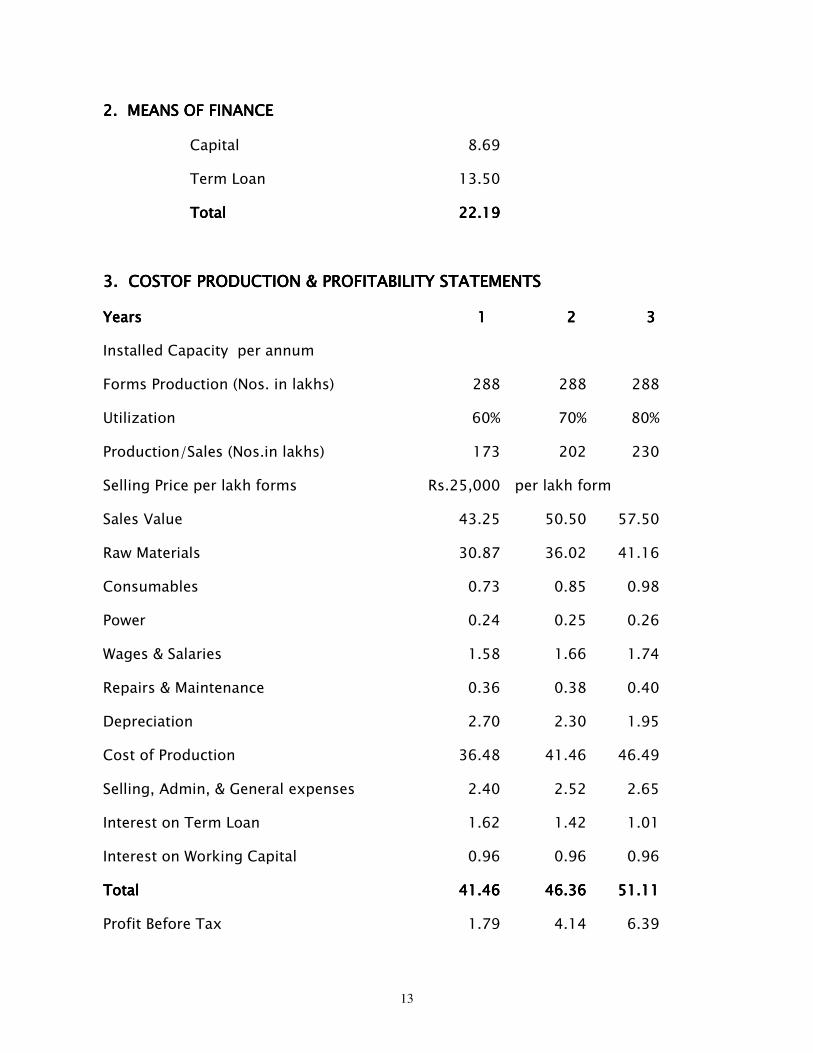
2. MEANS OF FINANCE2. MEANS OF FINANCE2. MEANS OF FINANCE2. MEANS OF FINANCE
Capital 8.69
Term Loan 13.50
TotalTotalTotalTotal 22.1922.1922.1922.19
3. COSTOF PRODUCTION & PROFITABILITY STATEMENTS3. COSTOF PRODUCTION & PROFITABILITY STATEMENTS3. COSTOF PRODUCTION & PROFITABILITY STATEMENTS3. COSTOF PRODUCTION & PROFITABILITY STATEMENTS
YearsYearsYearsYears 1 1 1 1 2 2 2 2 3 3 3 3
Installed Capacity per annum
Forms Production (Nos. in lakhs) 288 288 288
Utilization 60% 70% 80%
Production/Sales (Nos.in lakhs) 173 202 230
Selling Price per lakh forms Rs.25,000 per lakh form
Sales Value 43.25 50.50 57.50
Raw Materials 30.87 36.02 41.16
Consumables 0.73 0.85 0.98
Power 0.24 0.25 0.26
Wages & Salaries 1.58 1.66 1.74
Repairs & Maintenance 0.36 0.38 0.40
Depreciation 2.70 2.30 1.95
Cost of Production 36.48 41.46 46.49
Selling, Admin, & General expenses 2.40 2.52 2.65
Interest on Term Loan 1.62 1.42 1.01
Interest on Working Capital 0.96 0.96 0.96
TotalTotalTotalTotal 41.4641.4641.4641.46 46.3646.3646.3646.36 51.1151.1151.1151.11
Profit Before Tax 1.79 4.14 6.39
14
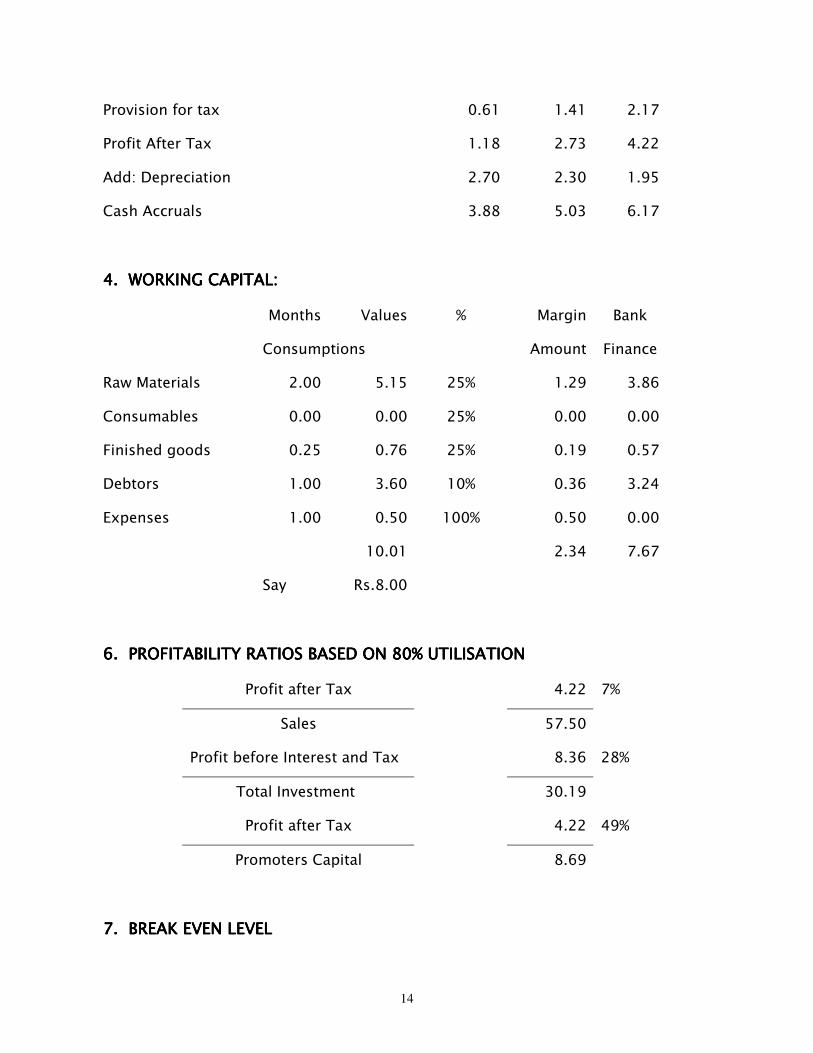
Provision for tax 0.61 1.41 2.17
Profit After Tax 1.18 2.73 4.22
Add: Depreciation 2.70 2.30 1.95
Cash Accruals 3.88 5.03 6.17
4. W4. W4. W4. WORKING CAPITAL:ORKING CAPITAL:ORKING CAPITAL:ORKING CAPITAL:
Months Values % Margin Bank
Consumptions Amount Finance
Raw Materials 2.00 5.15 25% 1.29 3.86
Consumables 0.00 0.00 25% 0.00 0.00
Finished goods 0.25 0.76 25% 0.19 0.57
Debtors 1.00 3.60 10% 0.36 3.24
Expenses 1.00 0.50 100% 0.50 0.00
10.01 2.34 7.67
Say Rs.8.00
6. PROFITABILITY RATIOS BASED ON 80% UTILISATION6. PROFITABILITY RATIOS BASED ON 80% UTILISATION6. PROFITABILITY RATIOS BASED ON 80% UTILISATION6. PROFITABILITY RATIOS BASED ON 80% UTILISATION
Profit after Tax 4.22 7%
Sales 57.50
Profit before Interest and Tax 8.36 28%
Total Investment 30.19
Profit after Tax 4.22 49%
Promoters Capital 8.69
7. BREAK EVEN LEVEL7. BREAK EVEN LEVEL7. BREAK EVEN LEVEL7. BREAK EVEN LEVEL
15
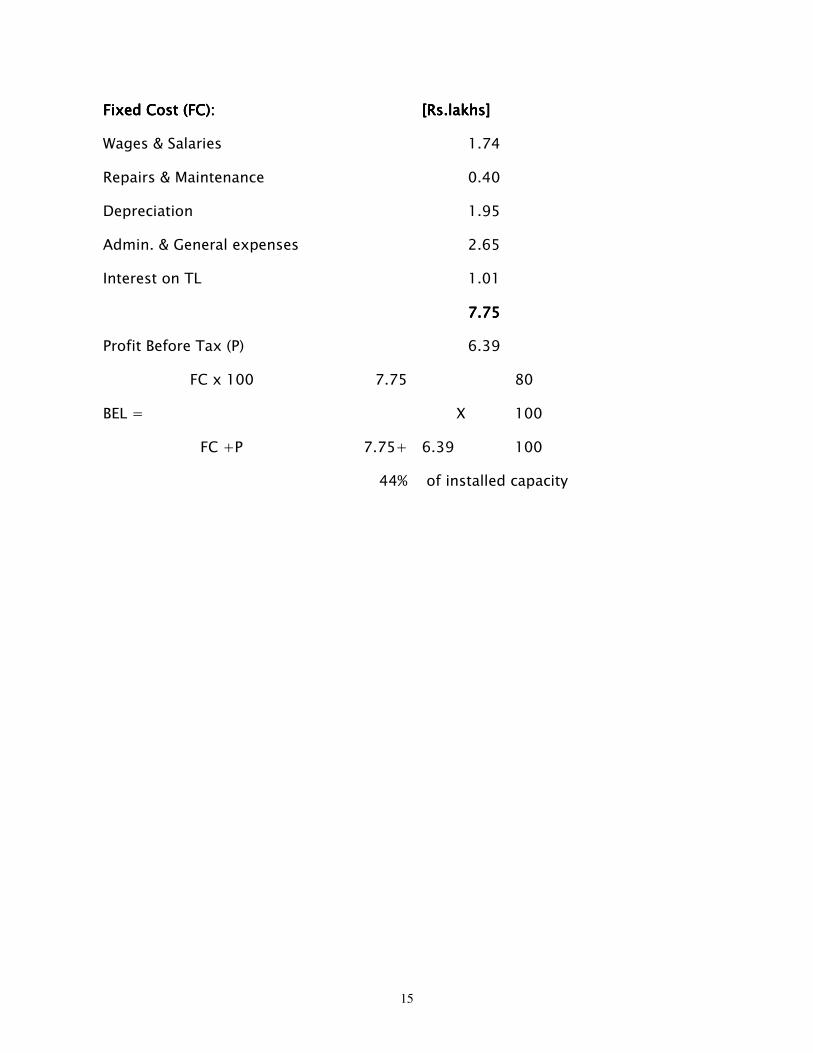
Fixed Cost (FC):Fixed Cost (FC):Fixed Cost (FC):Fixed Cost (FC): [Rs.lakhs][Rs.lakhs][Rs.lakhs][Rs.lakhs]
Wages & Salaries 1.74
Repairs & Maintenance 0.40
Depreciation 1.95
Admin. & General expenses 2.65
Interest on TL 1.01
7.77.77.77.75555
Profit Before Tax (P) 6.39
FC x 100 7.75 80
BEL = X 100
FC +P 7.75+ 6.39 100
44% of installed capacity
1
COMPUTER DATA ENTRYCOMPUTER DATA ENTRYCOMPUTER DATA ENTRYCOMPUTER DATA ENTRY
A.A.A.A. INTRODUCTIONINTRODUCTIONINTRODUCTIONINTRODUCTION
Data in its most useful form is well presented and informative. This is what data
processing aims to do. Global corporations with their large numbers of customers,
products, dealers, affiliates, and shareholders are finding that their data processing
needs are ever-growing and adding to operational overheads. Outsourcing data
processing to India provides cost-effective, reliable solutions to the day-to-day
running of a business.
A few years ago, data processing was as simple as entering data into a computer.
However, the digital revolution has changed this definition. The scope and range of
processing have grown and will continue to grow.
Equally diverse is the input-output media and software used in the processing. Since
India has become a leader in providing these services to companies around the globe,
Indian companies have become skilled enough in managing this diversity.
DDDData processingata processingata processingata processing services include extracting data off the Internet and entering it into
an excel spreadsheet, editing and tagging digital photos, online monitoring of
competitor pricing and much more. The range also includes more typical services like
converting and processing printed documents, forms, vector plans, maps and so on.
2
Specific projectsSpecific projectsSpecific projectsSpecific projects and services that can be outsourced and services that can be outsourced and services that can be outsourced and services that can be outsourced
o Data miningData miningData miningData mining refers to entering foreign language directories into a database
manually; entering product descriptions from hard copy catalogues to online
client web based system and categorizing comments for coding and for
converting them to XML or analysis.
o Form ConversionForm ConversionForm ConversionForm Conversion refers to conversion from paper to electronic form like
converting data from PDF files to Excel format.
o Data captureData captureData captureData capture refers to scanning paper documents and converting them to
electronic format.
o LegaLegaLegaLegal Document l Document l Document l Document preparation and organization.
o DigitizingDigitizingDigitizingDigitizing courthouse records and extracting property legal descriptions for title
companies.
o Form processingForm processingForm processingForm processing using OCR or manually if necessary.
o Data ExtractionData ExtractionData ExtractionData Extraction from a variety of sources with or without extraction software
Data Entry is a process of entering basic data into a computer system. In this case,
Data Entry is considered as a separate project by which industries, institutions and
other corporate entrust the data entering process as a job work. This saves their in
house and expensive resources for their own more meaningful usage and helps them
save computer time and cost. The data entry work is normally entrusted to job
workers and through floppy discs / CD-ROM, the data is brought back. Sometimes,
the customers need print-outs of the data entered. Since voluminous data has to be
processed in all leading institutions and corporate, there is a good potential for setting
up data entry centres. The data entry jobs can be started on a tiny scale also.
3
B.B.B.B. PRODUCT SPECIFICATION & USESPRODUCT SPECIFICATION & USESPRODUCT SPECIFICATION & USESPRODUCT SPECIFICATION & USES
The data entry jobs are wide and varied in nature. The jobs can be classified as:
a. Share applications
b. Financial Statements
c. Applications processing for recruitment
d. Dividend warrants
e. Inventory Statements
f. Word Processing
g. Units Applications
h. Directory information
i. Address data saves
j. Yellow Pages
The charges are collected as per data basis or per page basis.
C.C.C.C. MARKET POTENTIALMARKET POTENTIALMARKET POTENTIALMARKET POTENTIAL
India has made rapid strides in telecommunications and internet connectivity in the
past few years. India has matured as an outsourcing destination and well-established
outsourcing service providers have global-class buildings and infrastructure with
back-up generators, fiber-optic connectivity and 24x7 support.
When one outsources to India, one can expect a quaquaquaquality of servicelity of servicelity of servicelity of service that is on par with
any Western company. In fact, because such a large volume of work is being done in
India, sometimes our skills surpass those of many international companies.
4
Some data processing trends are:Some data processing trends are:Some data processing trends are:Some data processing trends are:
• Usage of various software psoftware psoftware psoftware programsrogramsrogramsrograms to speed up processing.
• Much of the processing work is done onlineonlineonlineonline.
• There is a big movement in India to increase data securitydata securitydata securitydata security.
• Data entry from product catalogs to web based systems
• Data entry from hard/soft copy to any database format
• Insurance claims entry
• PDF document indexing
Online Capture ServicesOnline Capture ServicesOnline Capture ServicesOnline Capture Services
• Data entry from images
• Online order entry and follow up
Creation of new databasesCreation of new databasesCreation of new databasesCreation of new databases and updates to existing databases for banks, airlines,
government agencies, direct marketing services and service providers
• Web based indexed document retrieval services, tools and support
• Mailing lists
• Data mining and warehousing
• Data Cleansing
• Audio Transcriptions
• Legal Documentation
• Indexing of vouchers and documents
5
• Hand written ballot/cards entry
• Online completion of surveys and responses of customers for various companies, at
call centers
• E-book and e-magazine publications on the internet
• Hospital records, patient notes and accident reports
• Business card indexing
• Custom data export/import interfaces with audits
• Bonded mail handling Cash, credit and check processing
In the domestic market also there is good scope for data entry. The requirement of
data entry jobs arises because of repetitive nature of jobs in computer data processing.
Several existing companies who are going in for computerisation need data entry jobs.
Similarly new concerns also require data entry. The user industries where
computerisation takes place have been growing well all over these years.
With stock markets in a state of flux and stagnating industrial output, Indian industry
is looking to the Government for rapid implementation of second generation economic
reforms. These are considered critical in the areas of labour, infrastructure, financial
services and agriculture as well as privatisation of the public sector. A push in these
sectors is expected to help boost economic growth from the present level of 5-6 per
cent to 8-9 per cent annually over the next few years.
Considering the expected growth in all sectors of the economy the data entry jobs also
will gain momentum.
6
D.D.D.D. TECHNICAL TECHNICAL TECHNICAL TECHNICAL ASPECTSASPECTSASPECTSASPECTS
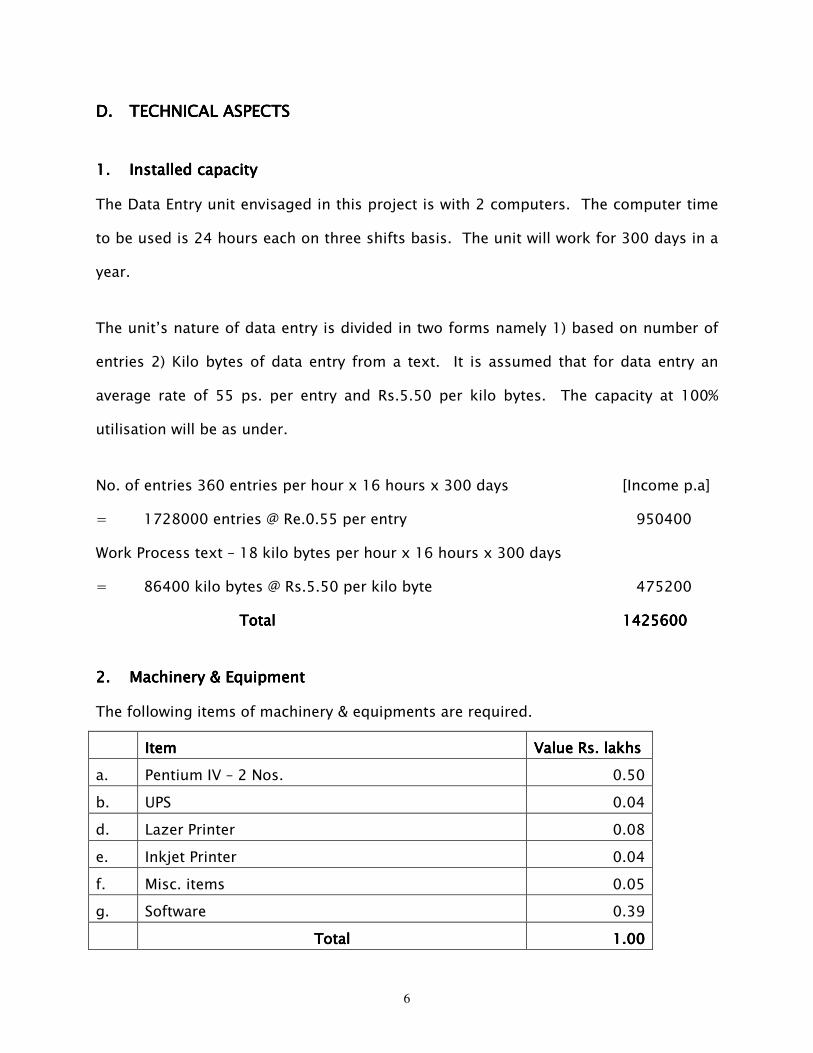
1.1.1.1. Installed capacityInstalled capacityInstalled capacityInstalled capacity
The Data Entry unit envisaged in this project is with 2 computers. The computer time
to be used is 24 hours each on three shifts basis. The unit will work for 300 days in a
year.
The unit’s nature of data entry is divided in two forms namely 1) based on number of
entries 2) Kilo bytes of data entry from a text. It is assumed that for data entry an
average rate of 55 ps. per entry and Rs.5.50 per kilo bytes. The capacity at 100%
utilisation will be as under.
No. of entries 360 entries per hour x 16 hours x 300 days [Income p.a]
= 1728000 entries @ Re.0.55 per entry 950400
Work Process text – 18 kilo bytes per hour x 16 hours x 300 days
= 86400 kilo bytes @ Rs.5.50 per kilo byte 475200
TotalTotalTotalTotal 1111425600425600425600425600
2.2.2.2. Machinery & EquipmentMachinery & EquipmentMachinery & EquipmentMachinery & Equipment
The following items of machinery & equipments are required.
ItemItemItemItem Value Rs.Value Rs.Value Rs.Value Rs. lakhslakhslakhslakhs
a. Pentium IV – 2 Nos. 0.50
b. UPS 0.04
d. Lazer Printer 0.08
e. Inkjet Printer 0.04
f. Misc. items 0.05
g. Software 0.39
TotalTotalTotalTotal 1.1.1.1.00000000
7
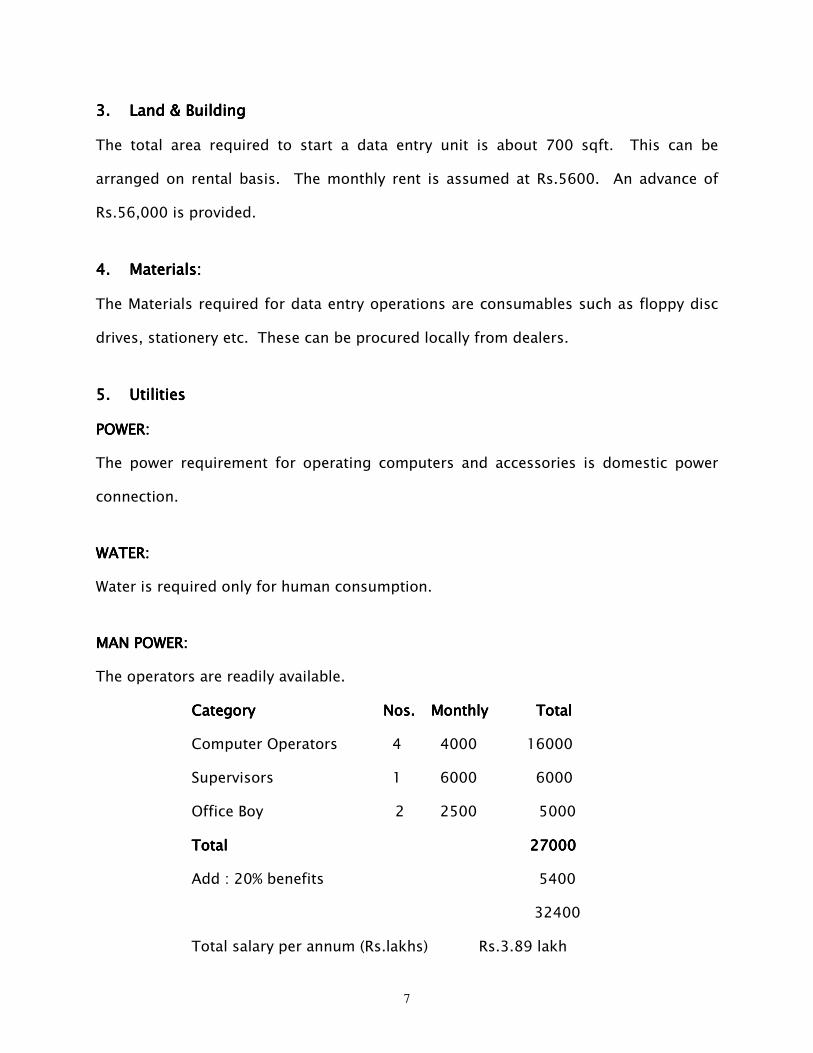
3.3.3.3. Land & BuildingLand & BuildingLand & BuildingLand & Building
The total area required to start a data entry unit is about 700 sqft. This can be
arranged on rental basis. The monthly rent is assumed at Rs.5600. An advance of
Rs.56,000 is provided.
4.4.4.4. Materials:Materials:Materials:Materials:
The Materials required for data entry operations are consumables such as floppy disc
drives, stationery etc. These can be procured locally from dealers.
5.5.5.5. UtilitiesUtilitiesUtilitiesUtilities
POWER: POWER: POWER: POWER:
The power requirement for operating computers and accessories is domestic power
connection.
WATER:WATER:WATER:WATER:
Water is required only for human consumption.
MAN POWER:MAN POWER:MAN POWER:MAN POWER:
The operators are readily available.
CategoryCategoryCategoryCategory Nos.Nos.Nos.Nos. MonthlyMonthlyMonthlyMonthly Total Total Total Total
Computer Operators 4 4000 16000
Supervisors 1 6000 6000
Office Boy 2 2500 5000
Total Total Total Total 2 2 2 27070707000000000
Add : 20% benefits 5400
32400
Total salary per annum (Rs.lakhs) Rs.3.89 lakh
8
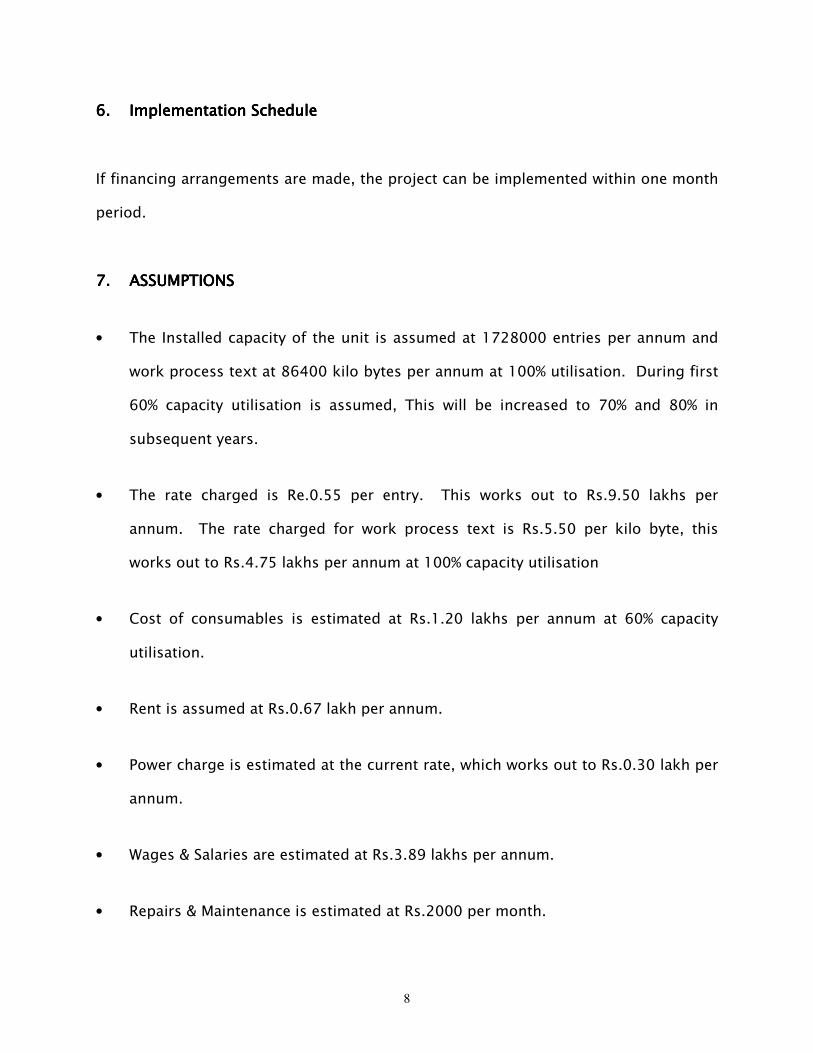
6.6.6.6. Implementation ScheduleImplementation ScheduleImplementation ScheduleImplementation Schedule
If financing arrangements are made, the project can be implemented within one month
period.
7.7.7.7. ASSUMPTIONSASSUMPTIONSASSUMPTIONSASSUMPTIONS
• The Installed capacity of the unit is assumed at 1728000 entries per annum and
work process text at 86400 kilo bytes per annum at 100% utilisation. During first
60% capacity utilisation is assumed, This will be increased to 70% and 80% in
subsequent years.
• The rate charged is Re.0.55 per entry. This works out to Rs.9.50 lakhs per
annum. The rate charged for work process text is Rs.5.50 per kilo byte, this
works out to Rs.4.75 lakhs per annum at 100% capacity utilisation
• Cost of consumables is estimated at Rs.1.20 lakhs per annum at 60% capacity
utilisation.
• Rent is assumed at Rs.0.67 lakh per annum.
• Power charge is estimated at the current rate, which works out to Rs.0.30 lakh per
annum.
• Wages & Salaries are estimated at Rs.3.89 lakhs per annum.
• Repairs & Maintenance is estimated at Rs.2000 per month.
9
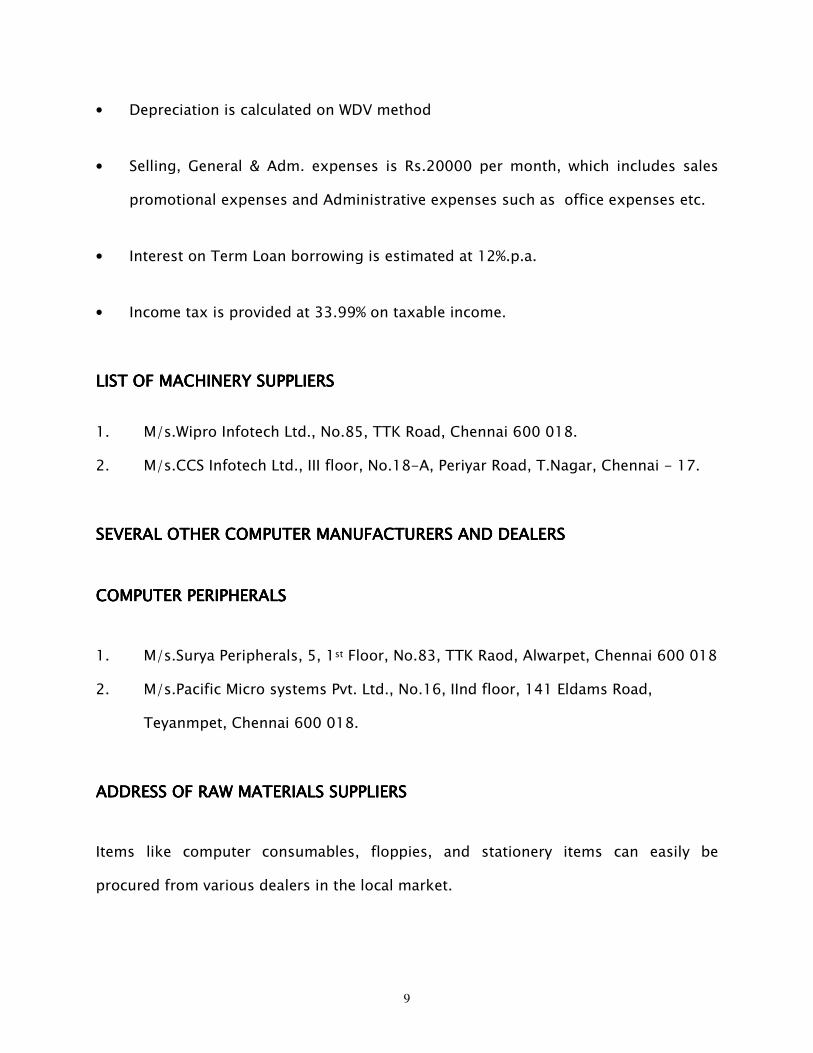
• Depreciation is calculated on WDV method
• Selling, General & Adm. expenses is Rs.20000 per month, which includes sales
promotional expenses and Administrative expenses such as office expenses etc.
• Interest on Term Loan borrowing is estimated at 12%.p.a.
• Income tax is provided at 33.99% on taxable income.
LIST OF MACHINERY SUPPLIERSLIST OF MACHINERY SUPPLIERSLIST OF MACHINERY SUPPLIERSLIST OF MACHINERY SUPPLIERS
1. M/s.Wipro Infotech Ltd., No.85, TTK Road, Chennai 600 018.
2. M/s.CCS Infotech Ltd., III floor, No.18-A, Periyar Road, T.Nagar, Chennai - 17.
SEVERAL OTHER COMPUTER MANUFACTURERS AND DEALERSSEVERAL OTHER COMPUTER MANUFACTURERS AND DEALERSSEVERAL OTHER COMPUTER MANUFACTURERS AND DEALERSSEVERAL OTHER COMPUTER MANUFACTURERS AND DEALERS
COMPUTER PERIPHERALSCOMPUTER PERIPHERALSCOMPUTER PERIPHERALSCOMPUTER PERIPHERALS
1. M/s.Surya Peripherals, 5, 1st Floor, No.83, TTK Raod, Alwarpet, Chennai 600 018
2. M/s.Pacific Micro systems Pvt. Ltd., No.16, IInd floor, 141 Eldams Road,
Teyanmpet, Chennai 600 018.
ADDRESS OF RAW MATERIALS SUPPLIERSADDRESS OF RAW MATERIALS SUPPLIERSADDRESS OF RAW MATERIALS SUPPLIERSADDRESS OF RAW MATERIALS SUPPLIERS
Items like computer consumables, floppies, and stationery items can easily be
procured from various dealers in the local market.
10
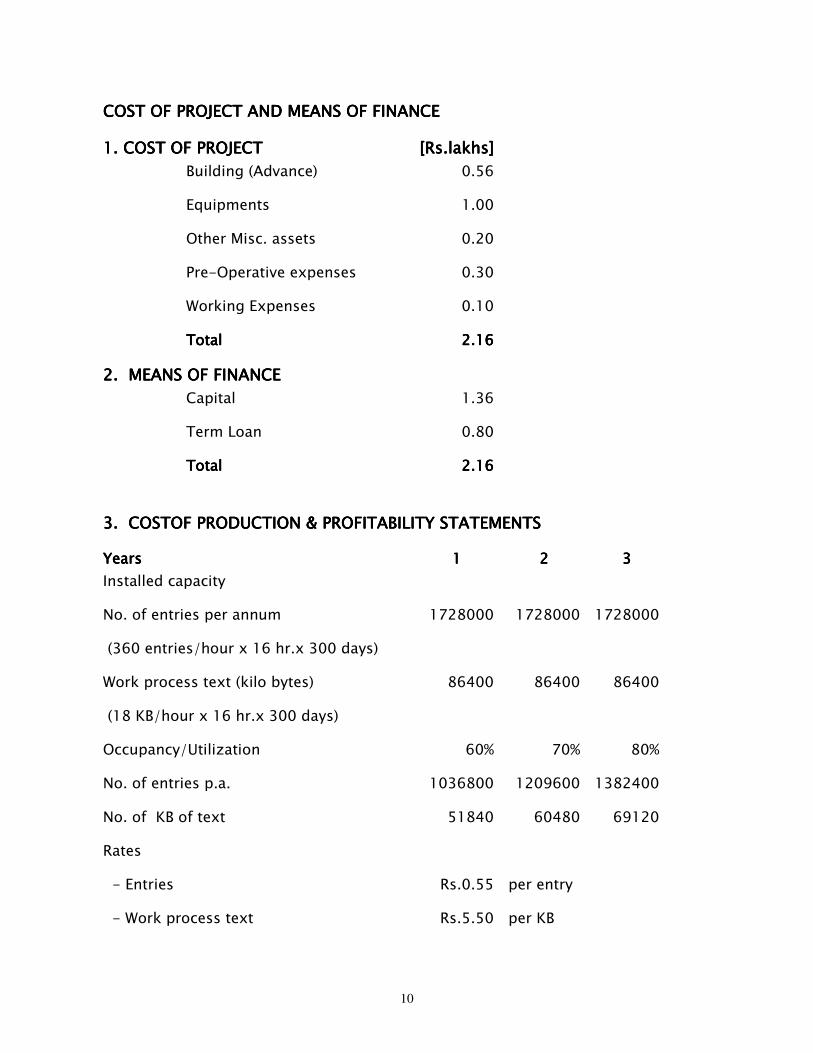
COST OF PROJECT AND MEANS OF FINANCECOST OF PROJECT AND MEANS OF FINANCECOST OF PROJECT AND MEANS OF FINANCECOST OF PROJECT AND MEANS OF FINANCE
1. COST OF PROJECT1. COST OF PROJECT1. COST OF PROJECT1. COST OF PROJECT [Rs.lakhs][Rs.lakhs][Rs.lakhs][Rs.lakhs]
Building (Advance) 0.56
Equipments 1.00
Other Misc. assets 0.20
Pre-Operative expenses 0.30
Working Expenses 0.10
Total Total Total Total 2.162.162.162.16
2. MEANS O2. MEANS O2. MEANS O2. MEANS OF FINANCEF FINANCEF FINANCEF FINANCE
Capital 1.36
Term Loan 0.80
Total Total Total Total 2.162.162.162.16
3. COSTOF PRODUCTION & PROFITABILITY STATEMENTS3. COSTOF PRODUCTION & PROFITABILITY STATEMENTS3. COSTOF PRODUCTION & PROFITABILITY STATEMENTS3. COSTOF PRODUCTION & PROFITABILITY STATEMENTS
YearsYearsYearsYears 1111 2222 3333
Installed capacity
No. of entries per annum 1728000 1728000 1728000
(360 entries/hour x 16 hr.x 300 days)
Work process text (kilo bytes) 86400 86400 86400
(18 KB/hour x 16 hr.x 300 days)
Occupancy/Utilization 60% 70% 80%
No. of entries p.a. 1036800 1209600 1382400
No. of KB of text 51840 60480 69120
Rates
- Entries Rs.0.55 per entry
- Work process text Rs.5.50 per KB
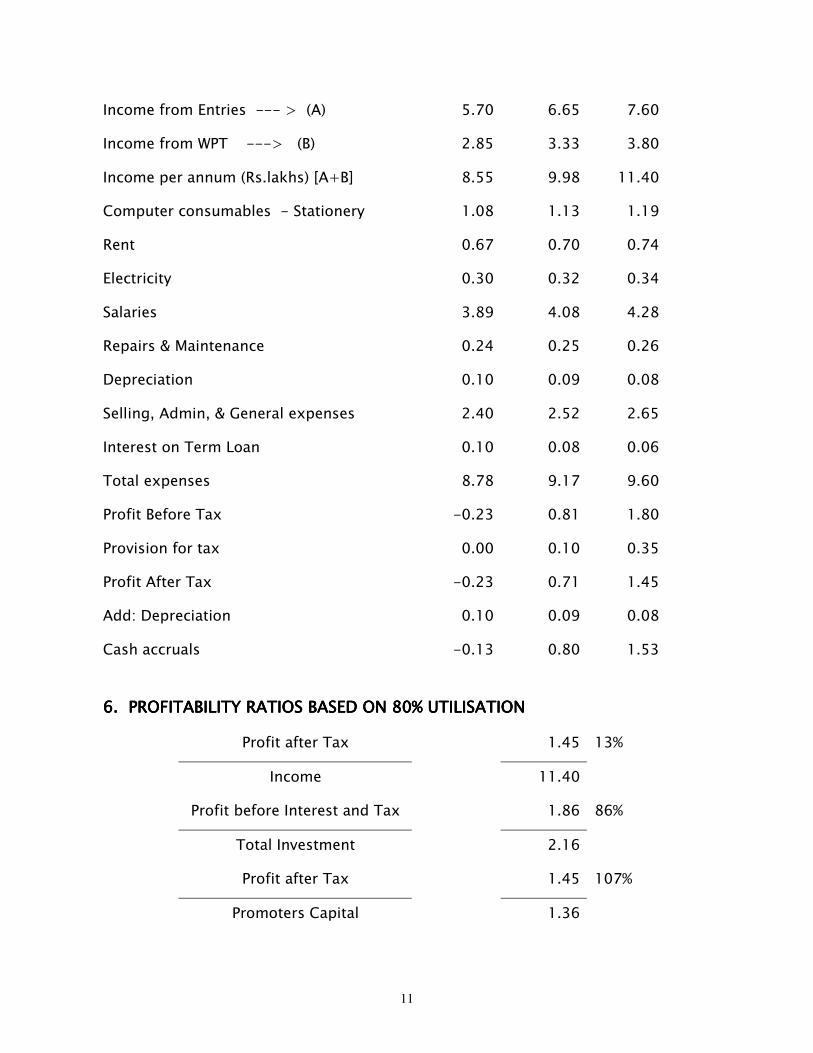
11
Income from Entries --- > (A) 5.70 6.65 7.60
Income from WPT ---> (B) 2.85 3.33 3.80
Income per annum (Rs.lakhs) [A+B] 8.55 9.98 11.40
Computer consumables - Stationery 1.08 1.13 1.19
Rent 0.67 0.70 0.74
Electricity 0.30 0.32 0.34
Salaries 3.89 4.08 4.28
Repairs & Maintenance 0.24 0.25 0.26
Depreciation 0.10 0.09 0.08
Selling, Admin, & General expenses 2.40 2.52 2.65
Interest on Term Loan 0.10 0.08 0.06
Total expenses 8.78 9.17 9.60
Profit Before Tax -0.23 0.81 1.80
Provision for tax 0.00 0.10 0.35
Profit After Tax -0.23 0.71 1.45
Add: Depreciation 0.10 0.09 0.08
Cash accruals -0.13 0.80 1.53
6. PROFITABILITY RATIOS BASED ON 80% UTILISATION6. PROFITABILITY RATIOS BASED ON 80% UTILISATION6. PROFITABILITY RATIOS BASED ON 80% UTILISATION6. PROFITABILITY RATIOS BASED ON 80% UTILISATION
Profit after Tax 1.45 13%
Income 11.40
Profit before Interest and Tax 1.86 86%
Total Investment 2.16
Profit after Tax 1.45 107%
Promoters Capital 1.36
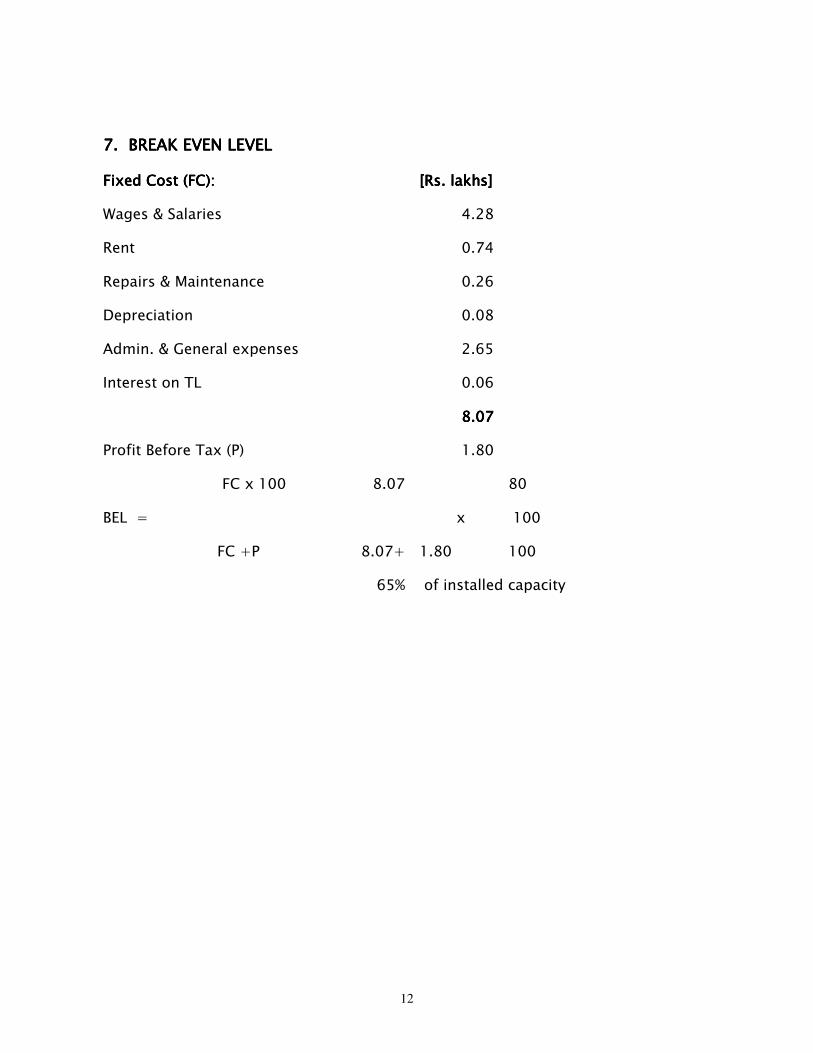
12
7. BREAK EVEN LEVEL7. BREAK EVEN LEVEL7. BREAK EVEN LEVEL7. BREAK EVEN LEVEL
Fixed Cost (FC):Fixed Cost (FC):Fixed Cost (FC):Fixed Cost (FC): [Rs.[Rs.[Rs.[Rs. lakhs]lakhs]lakhs]lakhs]
Wages & Salaries 4.28
Rent 0.74
Repairs & Maintenance 0.26
Depreciation 0.08
Admin. & General expenses 2.65
Interest on TL 0.06
8.078.078.078.07
Profit Before Tax (P) 1.80
FC x 100 8.07 80
BEL = x 100
FC +P 8.07+ 1.80 100
65% of installed capacity
1
COMPUTER SOFTWARECOMPUTER SOFTWARECOMPUTER SOFTWARECOMPUTER SOFTWARE
A.A.A.A. INTRODUCTIONINTRODUCTIONINTRODUCTIONINTRODUCTION
Computer software refers to a group of programmes to accomplish a particular
function. Computer software is the user and system programme of a computer
system, all of the programmes required to perform the processing tasks of the
computer system. Computer software is the collection of programmes owned by the
computer system and or computer user which aid a computer user in fulfilling the
computational requirements (i) conveniently by using a programming language (and
other programming facilities) of his own choice and (ii) by building on his own or
other people’s earlier work so as to minimise the fresh effort involved in having his
requirements fulfilled. The system is commonly known as Application Package /
Package programme. The package for example may comprise of a simple pay roll
system, Inventory control, Production Scheduling, Sales analysis or an Accounting
package etc.,
B.B.B.B. PRODUCT SPECIFICATION & USESPRODUCT SPECIFICATION & USESPRODUCT SPECIFICATION & USESPRODUCT SPECIFICATION & USES
There is no specific standard for testing of the programmes developed with reference
to standards already set. The programme developed should be customer friendly and
easy for use.
2
C.C.C.C. MARKET POTENTIALMARKET POTENTIALMARKET POTENTIALMARKET POTENTIAL
Computer in modern world has emerged as a major driving force for the progress of a
nation. No machine has ever undergone such a rapid change over last forty years as
the computer has.
The modern computer is known as Fifth Generation Computer. They are small in size
(as small as the briefcase in the case of note book computer), speedy and having a
large memory.
The computer is used for preparing Pay Rolls, Inventory Controls, Statistical Quality
Control, Building Management and information system for production planning and
control, Project monitoring and design calculations, analysing and tabulating data,
monitoring examinations and its results, storing and forwarding telegrams, handling
reservations in Railways and Airlines, repair of locomotives, control of freight
movement and deposit and credit management and so on.
The computer has been well accepted in all walks of life and therefore there is an
immediate necessity for making available large number of computers in houses,
schools, business houses, industries, hotels, hospitals, trading houses etc.
The computers are widely used in all the areas of business and service industries like
Airlines, Railways, Hotel Industries etc. The following applications of computers have
developed in India.
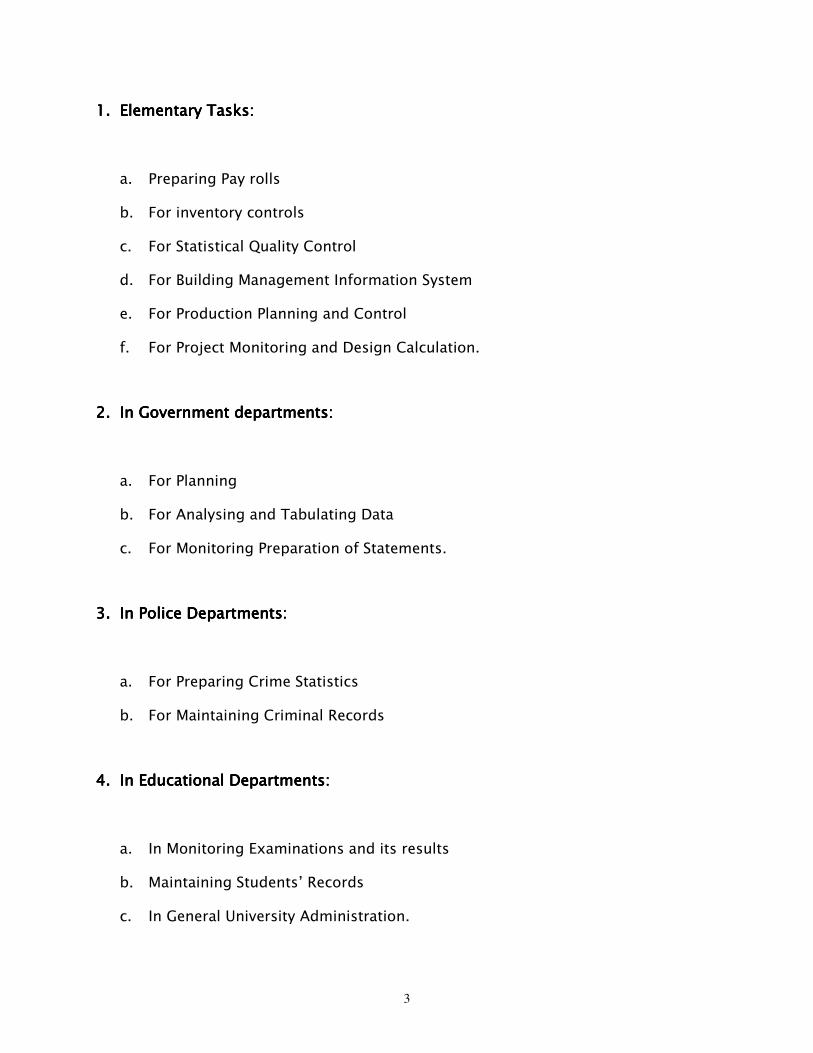
3
1.1.1.1. Elementary Tasks:Elementary Tasks:Elementary Tasks:Elementary Tasks:
a. Preparing Pay rolls
b. For inventory controls
c. For Statistical Quality Control
d. For Building Management Information System
e. For Production Planning and Control
f. For Project Monitoring and Design Calculation.
2.2.2.2. In Government departments:In Government departments:In Government departments:In Government departments:
a. For Planning
b. For Analysing and Tabulating Data
c. For Monitoring Preparation of Statements.
3.3.3.3. In Police Departments:In Police Departments:In Police Departments:In Police Departments:
a. For Preparing Crime Statistics
b. For Maintaining Criminal Records
4.4.4.4. In Educational Departments:In Educational Departments:In Educational Departments:In Educational Departments:
a. In Monitoring Examinations and its results
b. Maintaining Students’ Records
c. In General University Administration.
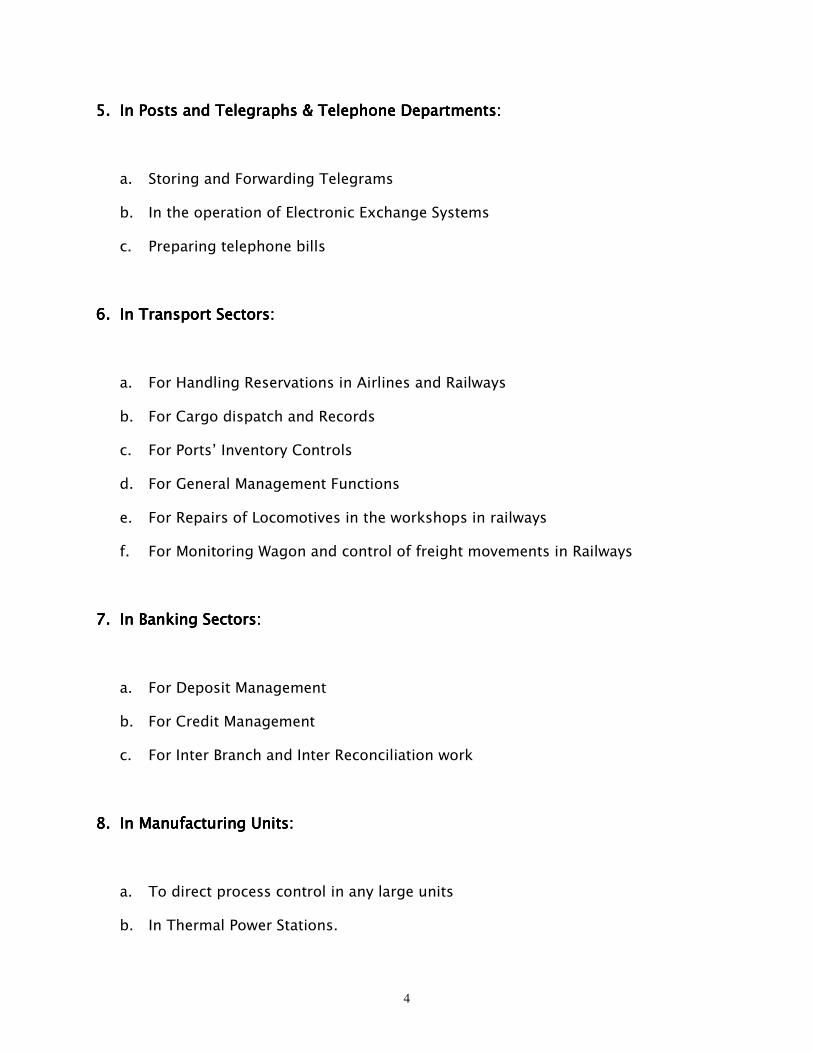
4
5.5.5.5. In Posts and Telegraphs In Posts and Telegraphs In Posts and Telegraphs In Posts and Telegraphs & Telephone & Telephone & Telephone & Telephone Departments:Departments:Departments:Departments:
a. Storing and Forwarding Telegrams
b. In the operation of Electronic Exchange Systems
c. Preparing telephone bills
6.6.6.6. In Transport Sectors:In Transport Sectors:In Transport Sectors:In Transport Sectors:
a. For Handling Reservations in Airlines and Railways
b. For Cargo dispatch and Records
c. For Ports’ Inventory Controls
d. For General Management Functions
e. For Repairs of Locomotives in the workshops in railways
f. For Monitoring Wagon and control of freight movements in Railways
7.7.7.7. In Banking Sectors:In Banking Sectors:In Banking Sectors:In Banking Sectors:
a. For Deposit Management
b. For Credit Management
c. For Inter Branch and Inter Reconciliation work
8.8.8.8. In ManufacturinIn ManufacturinIn ManufacturinIn Manufacturing Units:g Units:g Units:g Units:
a. To direct process control in any large units
b. In Thermal Power Stations.
5
In developed countries computers are used for doing personal items of work also, like
assisting family budgeting, keeping records of bills and payments etc. Attempt is
being made to incorporate artificial intelligence in computer and USA has already
introduced a computer which can learn as well. Japan is planning for a computer city,
where no human beings will be required to perform any activity. New invention in this
direction will, beyond doubt, increase the utility of computer and thus boost computer
and allied industries.
FY 2006-07 witnessed a revalidation of the Indian Information Technology – Business
Process Outsourcing (IT-BPO) growth story, driven by a maturing appreciation of
India’s role and growing importance in global services trade. Industry performance is
marked by sustained double-digit revenue growth, steady expansion into newer
service-lines and increased geographic penetration, and an unprecedented rise in
investments by Multi-national Corporations (MNCs) – in spite of lingering concerns
about gaps in talent and infrastructure impacting India’s cost competitiveness. The
sector looks set to close the year at record levels, with the revenue aggregate growing
by nearly ten times over the past ten years.
Positive market indicators including large unaddressed white-spaces and the
unbundling of IT-BPO mega-deals with increasing shares of global delivery, strongly
support the optimism of the industry in achieving its aspired target of USD 60 billion in
exports by 2010.
As India has the uniquely advantage to grab these opportunities, they are not lost to
others. Timely, coherent and continued action is needed to ensure that India makes the
most of these opportunities and maintains its lead.
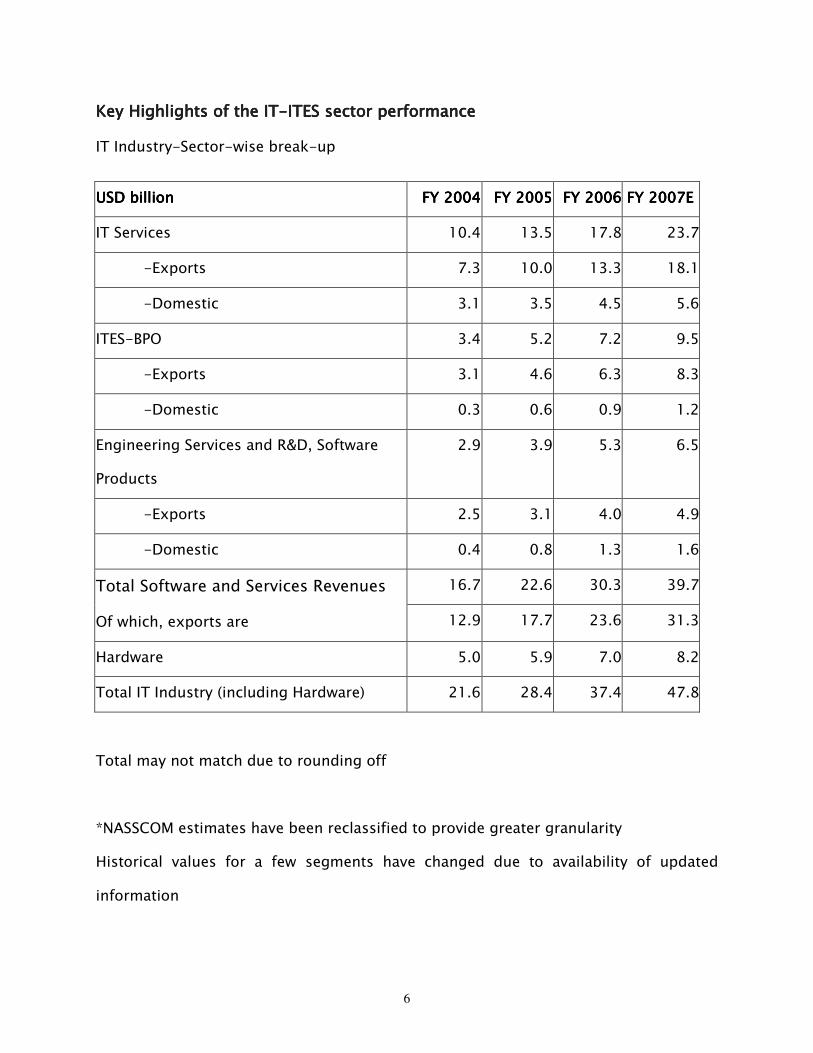
6
Key Highlights of the ITKey Highlights of the ITKey Highlights of the ITKey Highlights of the IT----ITES sector performanceITES sector performanceITES sector performanceITES sector performance
IT Industry-Sector-wise break-up
USD billion USD billion USD billion USD billion FY 2004FY 2004FY 2004FY 2004 FY 2005FY 2005FY 2005FY 2005 FY 2006FY 2006FY 2006FY 2006 FY 2007EFY 2007EFY 2007EFY 2007E
IT Services 10.4 13.5 17.8 23.7
-Exports 7.3 10.0 13.3 18.1
-Domestic 3.1 3.5 4.5 5.6
ITES-BPO 3.4 5.2 7.2 9.5
-Exports 3.1 4.6 6.3 8.3
-Domestic 0.3 0.6 0.9 1.2
Engineering Services and R&D, Software
Products
2.9 3.9 5.3 6.5
-Exports 2.5 3.1 4.0 4.9
-Domestic 0.4 0.8 1.3 1.6
16.7 22.6 30.3 39.7Total Software and Services Revenues
Of which, exports are 12.9 17.7 23.6 31.3
Hardware 5.0 5.9 7.0 8.2
Total IT Industry (including Hardware) 21.6 28.4 37.4 47.8
Total may not match due to rounding off
*NASSCOM estimates have been reclassified to provide greater granularity
Historical values for a few segments have changed due to availability of updated
information
7
� Growth in RevenuesGrowth in RevenuesGrowth in RevenuesGrowth in Revenues: : : : The Indian IT-ITES sector (including the domestic and
exports segments) is expected to exceed USD 47.8 billion in annual revenue in
FY07, an increase of nearly 28 percent in the current fiscal
� Contribution to GDP estimated to be 5.4% up from 4.8% last year.
� Service and software exports remain the mainstay of the sector contributing USD
31.3 billion and beating forecast to register a 32.6% growth
� Increasing traction in off-shore product development and engineering services
is supplementing India’s efforts in IP creation. This segment is growing at 22-23
percent and is expected to report USD 4.9 billion in exports, in FY 2006-07.
� MNC investments reach an unprecedented scale; over USD 10 billion announced
in FY 2006-07, to be invested over the next few years.
� ServiceServiceServiceService----line expansion:line expansion:line expansion:line expansion: Aiding service providers to take on larger and more
complex deals, and increasing the average size of contracts awarded to Indian
firms are the twin objectives. Indian Service Providers have grown their share of
contracts of values in excess of USD 50 million dollars from 1% in 2002 to 7% in
2006.
� High off-shore component of delivery and superior execution in multi-location
delivery continue to be key differentiators
� Broad-based industry structure - IT led by large Indian firms, BPO by a mix of
Indian and MNC third-party providers and captives - reflects the depth of the
supply-base
� Even though larger players continue to lead growth, gradually increasing their
share in the industry aggregate, several high-performing SMEs also stand out.
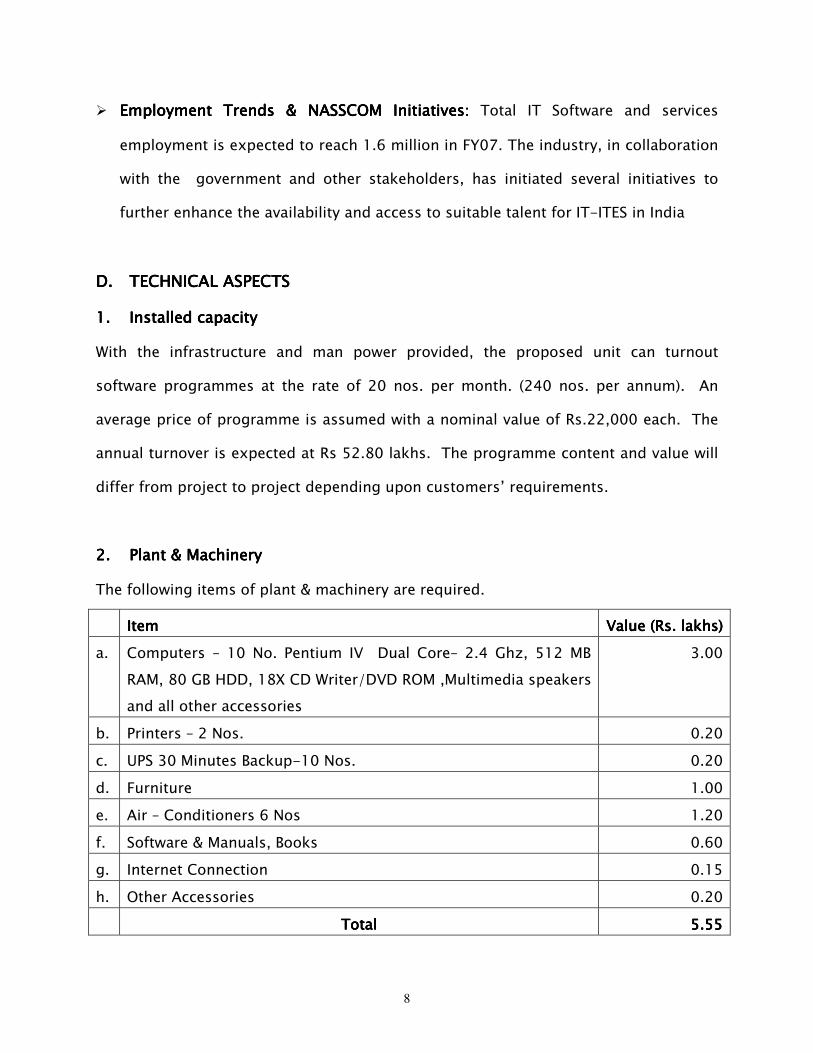
8
� Employment Trends & NASSCOM InitiativesEmployment Trends & NASSCOM InitiativesEmployment Trends & NASSCOM InitiativesEmployment Trends & NASSCOM Initiatives:::: Total IT Software and services
employment is expected to reach 1.6 million in FY07. The industry, in collaboration
with the government and other stakeholders, has initiated several initiatives to
further enhance the availability and access to suitable talent for IT-ITES in India
D.D.D.D. TECHNICAL ASPECTSTECHNICAL ASPECTSTECHNICAL ASPECTSTECHNICAL ASPECTS
1.1.1.1. Installed capacityInstalled capacityInstalled capacityInstalled capacity
With the infrastructure and man power provided, the proposed unit can turnout
software programmes at the rate of 20 nos. per month. (240 nos. per annum). An
average price of programme is assumed with a nominal value of Rs.22,000 each. The
annual turnover is expected at Rs 52.80 lakhs. The programme content and value will
differ from project to project depending upon customers’ requirements.
2.2.2.2. Plant & MachineryPlant & MachineryPlant & MachineryPlant & Machinery
The following items of plant & machinery are required.
ItemItemItemItem Value Value Value Value ((((Rs.Rs.Rs.Rs. lakhs)lakhs)lakhs)lakhs)
a. Computers – 10 No. Pentium IV Dual Core– 2.4 Ghz, 512 MB
RAM, 80 GB HDD, 18X CD Writer/DVD ROM ,Multimedia speakers
and all other accessories
3.00
b. Printers – 2 Nos. 0.20
c. UPS 30 Minutes Backup-10 Nos. 0.20
d. Furniture 1.00
e. Air – Conditioners 6 Nos 1.20
f. Software & Manuals, Books 0.60
g. Internet Connection 0.15
h. Other Accessories 0.20
TotalTotalTotalTotal 5555....55555555
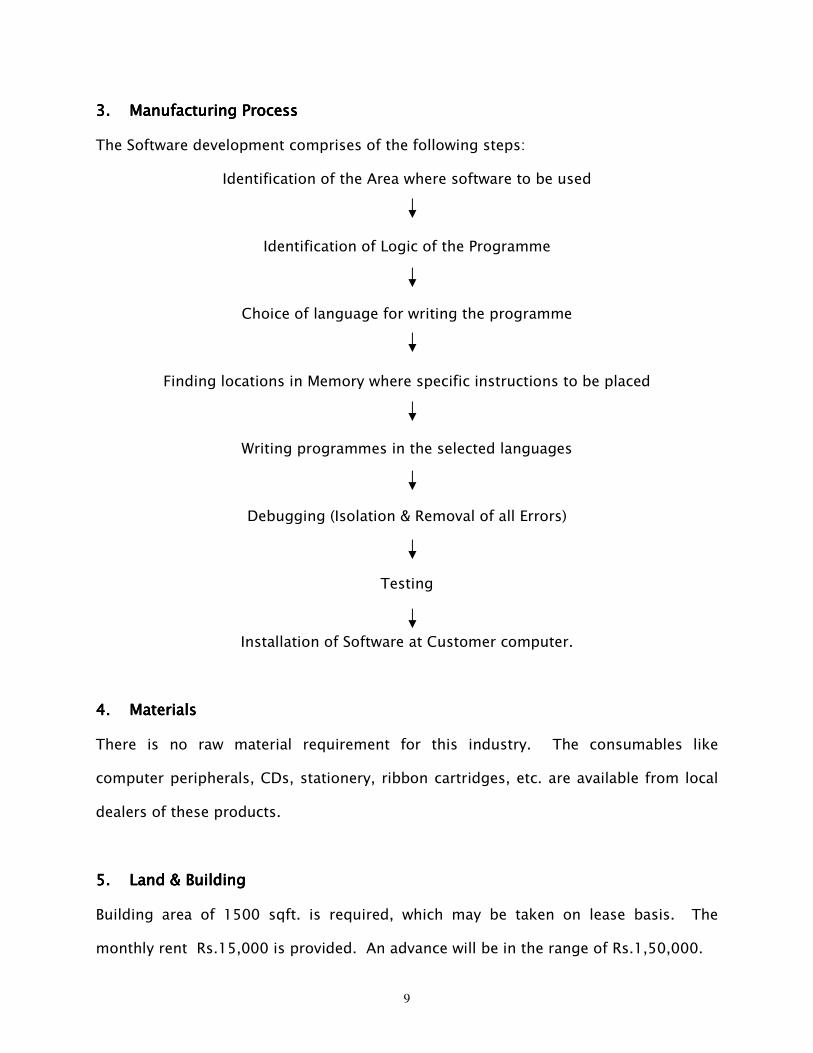
9
3.3.3.3. Manufacturing ProcessManufacturing ProcessManufacturing ProcessManufacturing Process
The Software development comprises of the following steps:
Identification of the Area where software to be used
Identification of Logic of the Programme
Choice of language for writing the programme
Finding locations in Memory where specific instructions to be placed
Writing programmes in the selected languages
Debugging (Isolation & Removal of all Errors)
Testing
Installation of Software at Customer computer.
4.4.4.4. MaterialsMaterialsMaterialsMaterials
There is no raw material requirement for this industry. The consumables like
computer peripherals, CDs, stationery, ribbon cartridges, etc. are available from local
dealers of these products.
5.5.5.5. Land & BuildingLand & BuildingLand & BuildingLand & Building
Building area of 1500 sqft. is required, which may be taken on lease basis. The
monthly rent Rs.15,000 is provided. An advance will be in the range of Rs.1,50,000.
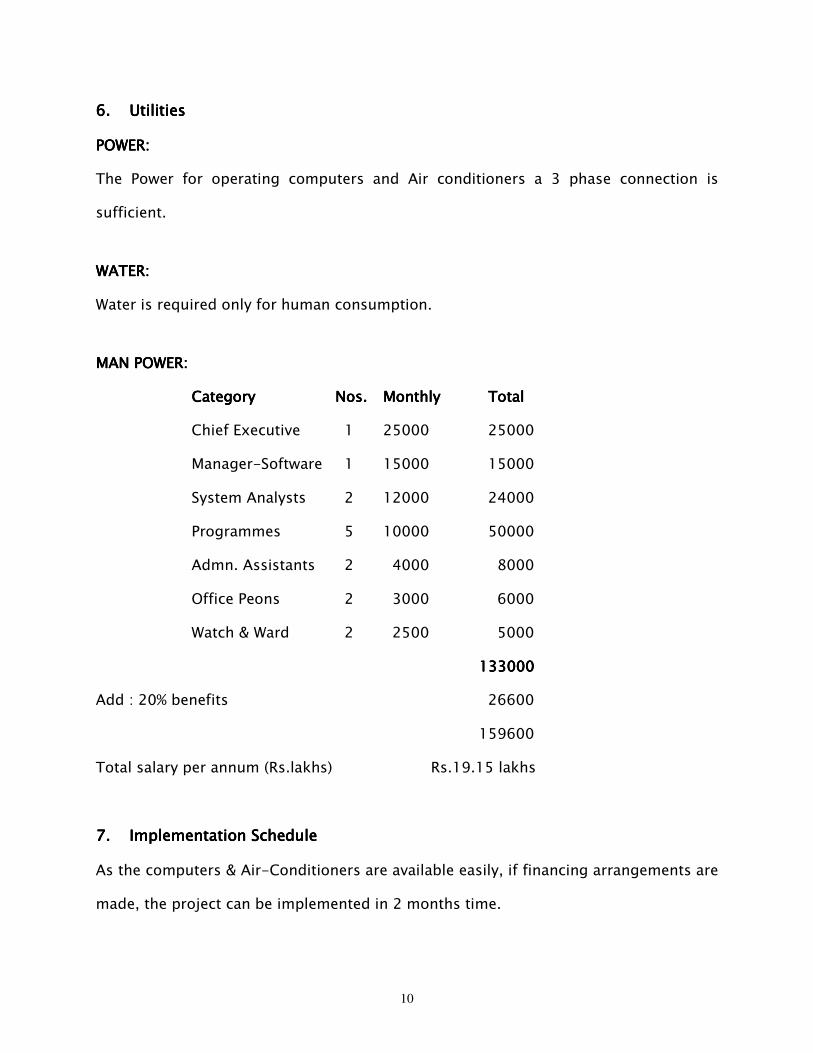
10
6.6.6.6. UtilitiesUtilitiesUtilitiesUtilities
POWERPOWERPOWERPOWER: : : :
The Power for operating computers and Air conditioners a 3 phase connection is
sufficient.
WATERWATERWATERWATER::::
Water is required only for human consumption.
MAN POWERMAN POWERMAN POWERMAN POWER::::
CategoryCategoryCategoryCategory Nos.Nos.Nos.Nos. MonthlyMonthlyMonthlyMonthly Total Total Total Total
Chief Executive 1 25000 25000
Manager-Software 1 15000 15000
System Analysts 2 12000 24000
Programmes 5 10000 50000
Admn. Assistants 2 4000 8000
Office Peons 2 3000 6000
Watch & Ward 2 2500 5000
111133333333000000000000
Add : 20% benefits 26600
159600
Total salary per annum (Rs.lakhs) Rs.19.15 lakhs
7.7.7.7. Implementation ScheduleImplementation ScheduleImplementation ScheduleImplementation Schedule
As the computers & Air-Conditioners are available easily, if financing arrangements are
made, the project can be implemented in 2 months time.
11
ASSUMPTIONSASSUMPTIONSASSUMPTIONSASSUMPTIONS
• Installed capacity is 240 nos. of software programmes per annum. During first
year, 60% capacity utilisation is assumed, This will be increased to 70% and 80% in
subsequent years.
• Average selling price is assumed at Rs.22000 per software. This works out to
Rs.52.80 lakhs per annum at 100% capacity utilisation.
• Consumables such as CDs, stationery, etc. are estimated at Rs.0.72 lakh per
annum.
• Power charge is estimated at the current rate, which works out to Rs.1.20 lakhs per
annum.
• Wages & Salaries is estimated at Rs.19.15 lakhs per annum.
• Repairs & Maintenance is estimated at Rs.5000 per month.
• Depreciation is calculated on WDV method
• Selling, General & Adm. expenses is Rs.40000 per month, which includes sales
promotional expenses and Administrative expenses such as rent, office expenses
etc.
• Interest on Term Loan & working capital borrowings are estimated at 12%.p.a.
• Income tax is provided at 33.99% on taxable income.
12
LIST OF MACHINERY SUPPLIERSLIST OF MACHINERY SUPPLIERSLIST OF MACHINERY SUPPLIERSLIST OF MACHINERY SUPPLIERS
1. Wipro Infotech Ltd. No.85, TTK Road, Chennai 600 018.
2. CCS Infotech Ltd., III Floor, No.18-A, Periyar Road, Chennai 600 0017.
And there are several computer dealers located in cities like Chennai, Coimbatore,
Madurai, Tirchy, Salem and other major towns in Tamilnadu. Their addresses can be
collected from respective Yellow Pages. Most of them are dealing with computers
manufactured by reputed manufacturing companies. Purchase of assembled sets from
reliable suppliers is also economical.
UPSUPSUPSUPS
1. M/s. American Power Conversion (India) Pvt. Ltd., No.5, A Century Plaza, 560
Anna salai, Chennai 600 018.
LIST OF RAW MATERIAL SUPPLIERSLIST OF RAW MATERIAL SUPPLIERSLIST OF RAW MATERIAL SUPPLIERSLIST OF RAW MATERIAL SUPPLIERS
The consumables can be obtained from dealers of computer peripherals located in
cities and all major towns.
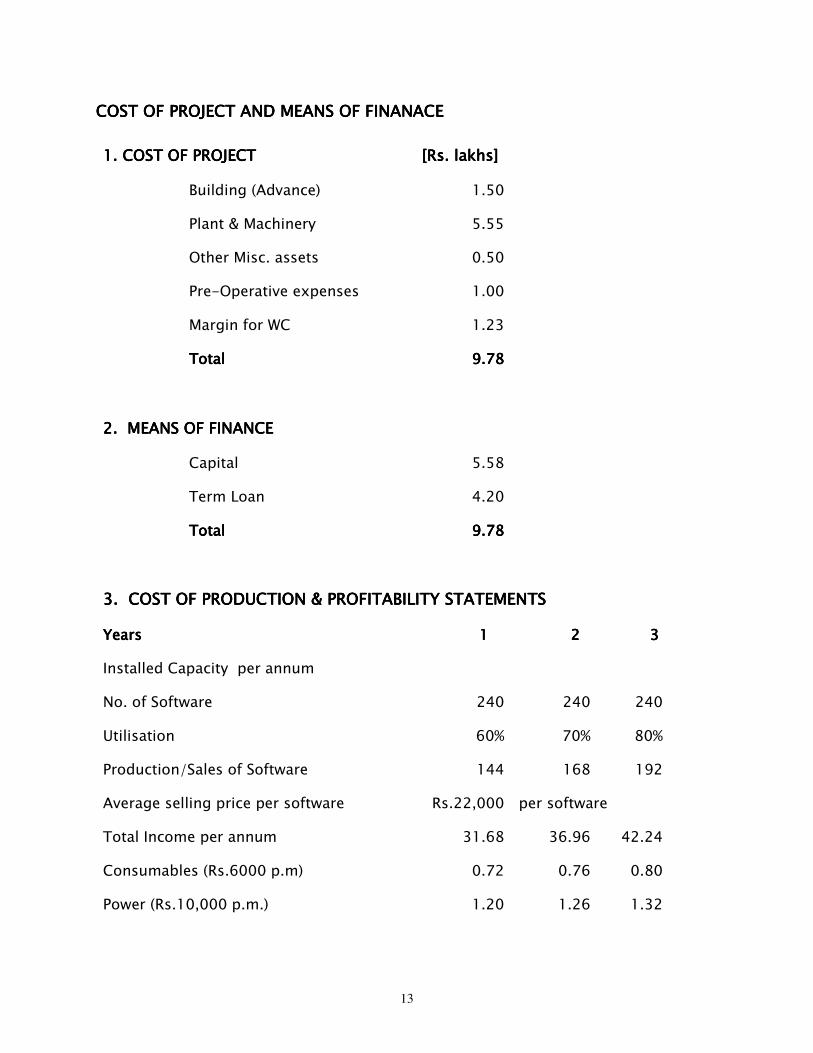
13
COST OF PROJECT AND MEANS OF FINANACE COST OF PROJECT AND MEANS OF FINANACE COST OF PROJECT AND MEANS OF FINANACE COST OF PROJECT AND MEANS OF FINANACE
1. COST OF PROJECT1. COST OF PROJECT1. COST OF PROJECT1. COST OF PROJECT [Rs. lakhs][Rs. lakhs][Rs. lakhs][Rs. lakhs]
Building (Advance) 1.50
Plant & Machinery 5.55
Other Misc. assets 0.50
Pre-Operative expenses 1.00
Margin for WC 1.23
Total Total Total Total 9.789.789.789.78
2. MEANS OF FINANCE2. MEANS OF FINANCE2. MEANS OF FINANCE2. MEANS OF FINANCE
Capital 5.58
Term Loan 4.20
TotalTotalTotalTotal 9.789.789.789.78
3. COST OF PRODUCTION & PROFITABILITY STATEMENTS3. COST OF PRODUCTION & PROFITABILITY STATEMENTS3. COST OF PRODUCTION & PROFITABILITY STATEMENTS3. COST OF PRODUCTION & PROFITABILITY STATEMENTS
YearsYearsYearsYears 1 1 1 1 2 2 2 2 3 3 3 3
Installed Capacity per annum
No. of Software 240 240 240
Utilisation 60% 70% 80%
Production/Sales of Software 144 168 192
Average selling price per software Rs.22,000 per software
Total Income per annum 31.68 36.96 42.24
Consumables (Rs.6000 p.m) 0.72 0.76 0.80
Power (Rs.10,000 p.m.) 1.20 1.26 1.32
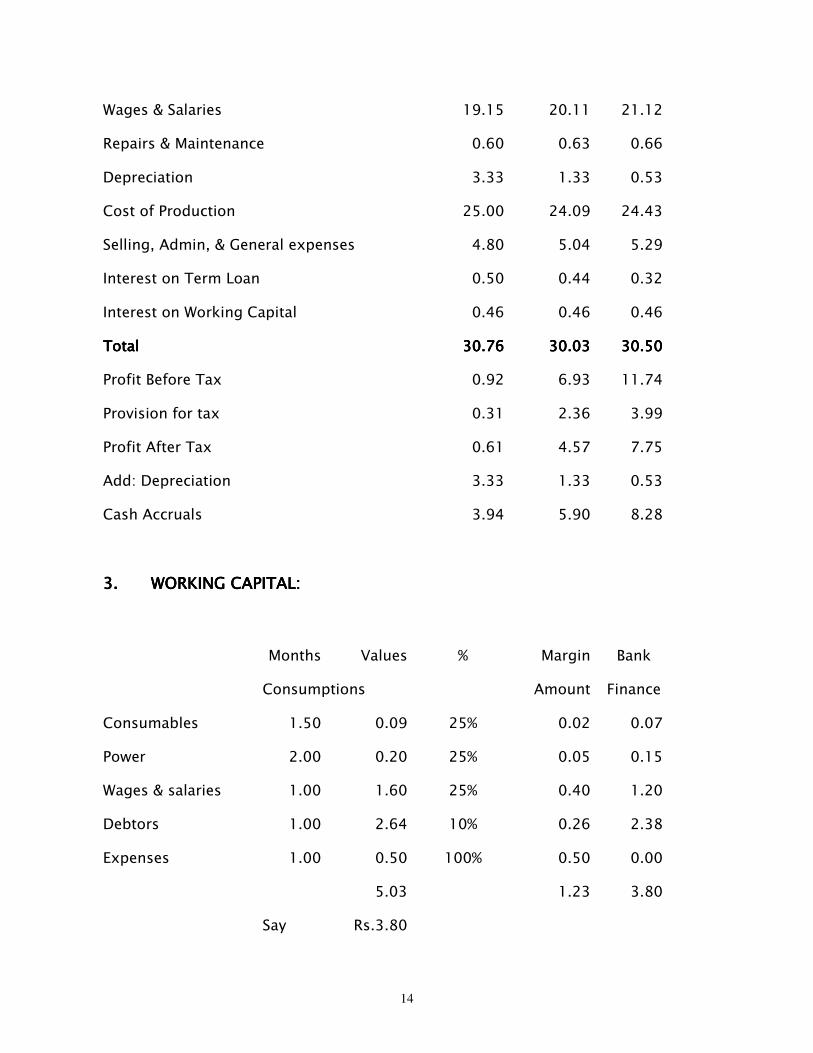
14
Wages & Salaries 19.15 20.11 21.12
Repairs & Maintenance 0.60 0.63 0.66
Depreciation 3.33 1.33 0.53
Cost of Production 25.00 24.09 24.43
Selling, Admin, & General expenses 4.80 5.04 5.29
Interest on Term Loan 0.50 0.44 0.32
Interest on Working Capital 0.46 0.46 0.46
TotalTotalTotalTotal 30.7630.7630.7630.76 30.0330.0330.0330.03 30.5030.5030.5030.50
Profit Before Tax 0.92 6.93 11.74
Provision for tax 0.31 2.36 3.99
Profit After Tax 0.61 4.57 7.75
Add: Depreciation 3.33 1.33 0.53
Cash Accruals 3.94 5.90 8.28
3.3.3.3. WORKING CAPITAL:WORKING CAPITAL:WORKING CAPITAL:WORKING CAPITAL:
Months Values % Margin Bank
Consumptions Amount Finance
Consumables 1.50 0.09 25% 0.02 0.07
Power 2.00 0.20 25% 0.05 0.15
Wages & salaries 1.00 1.60 25% 0.40 1.20
Debtors 1.00 2.64 10% 0.26 2.38
Expenses 1.00 0.50 100% 0.50 0.00
5.03 1.23 3.80
Say Rs.3.80
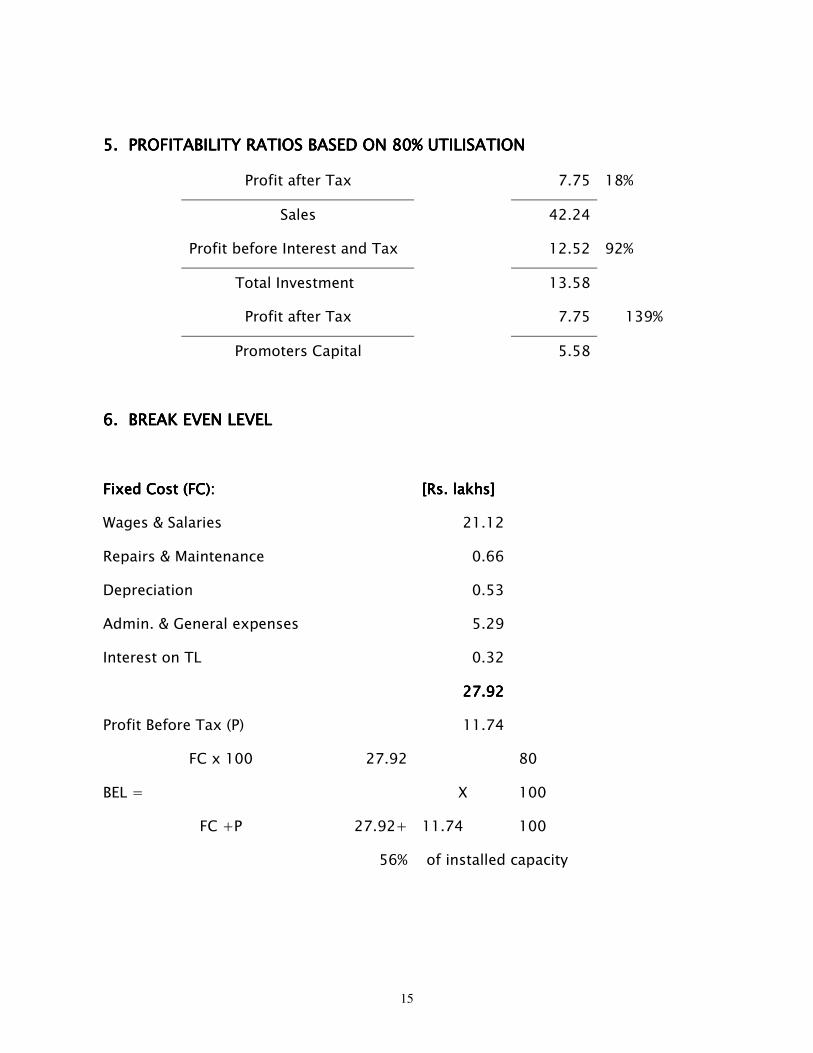
15
5. PROFITABILITY RATIOS BASED ON 80% UTILISATION5. PROFITABILITY RATIOS BASED ON 80% UTILISATION5. PROFITABILITY RATIOS BASED ON 80% UTILISATION5. PROFITABILITY RATIOS BASED ON 80% UTILISATION
Profit after Tax 7.75 18%
Sales 42.24
Profit before Interest and Tax 12.52 92%
Total Investment 13.58
Profit after Tax 7.75 139%
Promoters Capital 5.58
6. BREAK EVEN LEVEL6. BREAK EVEN LEVEL6. BREAK EVEN LEVEL6. BREAK EVEN LEVEL
Fixed Cost (FC):Fixed Cost (FC):Fixed Cost (FC):Fixed Cost (FC): [Rs. lakhs][Rs. lakhs][Rs. lakhs][Rs. lakhs]
Wages & Salaries 21.12
Repairs & Maintenance 0.66
Depreciation 0.53
Admin. & General expenses 5.29
Interest on TL 0.32
27.9227.9227.9227.92
Profit Before Tax (P) 11.74
FC x 100 27.92 80
BEL = X 100
FC +P 27.92+ 11.74 100
56% of installed capacity
1
DTP DTP DTP DTP ((((DDDDESKTOP ESKTOP ESKTOP ESKTOP PUBLISHING)PUBLISHING)PUBLISHING)PUBLISHING)
A.A.A.A. INTRODUCTIONINTRODUCTIONINTRODUCTIONINTRODUCTION
Printing as an art of graphic communication has undergone various changes over the
years. With the emergence of computer and other micro processor based systems as
one of the most important aid for usage in printing, the quality and output of printing
have both greatly improved and have also resulted in faster and higher output. The
composing methods have been made fool-proof and fast printing at cheaper cost has
been made possible. The manual composing has become out-dated and replaced by
the electronic programme based composing and final printing has been made possible.
Vrious offset printing machines have been developed. They have the capability to take
large number of impressions without involving manual composing and avoiding plate
making a basic requirement in normal offset press. Desk-Top publishing system have
many advantages over the normal photo type setting and other conventional type
setting. DTP jobs are used by regular printers, screen printers and other book
publishers.
B.B.B.B. SERVICE USAGE & SPECIFICATIONS.SERVICE USAGE & SPECIFICATIONS.SERVICE USAGE & SPECIFICATIONS.SERVICE USAGE & SPECIFICATIONS.
Desk Top Publishing is a miniature fast, sophisticated and high-tech printing unit. It is
useful for printing of:
1. Books and publications
2. Magazines
3. Newsletters
4. Pamphlets
5. Advertisement layouts
6. Balance sheets
2
7. Screen printing jobs of various types etc.
It saves the time consuming and labour oriented processing work of the conventional
type setting. The facility of getting output in any specific type style with graphics is a
unique feature of the DTP which employs high technology.
C.C.C.C. MARKET POTENTIALMARKET POTENTIALMARKET POTENTIALMARKET POTENTIAL
The DTP is mainly catering to demand for printed materials in the country. It is
increasing in line with the improvement in general literacy, education and standard of
living of the people. It is used for Text book composing. The literacy rate which was
34.5% in 1971 increased to 65.4% in 2001-02. Similarly the number of enrollment in
schools which was 115.5 million children in 1980-81 grew to 180.4 million in 2001-
02. The number of educational colleges too increased from 4700 in 1981 to 10701 in
2001-02
The consumption of printed material is therefore increasing. World demand for paper
has doubled in the last 20 years and it is expected to double again by the year 2010.
Per capita consumption of paper & paper board in India at 5 Kg is very low compared
to other developing countries like China (17.2 Kg), Brazil (28 Kg). Therefore, despite
the threat of paperless transaction, scope for paper demand appears to be bright. In
developed nations it is as high as 152 Kgs per annum.
The challenge for the Indian paper industry to meet the ever-increasing demand of
paper, board and newsprint is getting crippled due to shortage of fibres in the country.
The future demand of paper is expected to grow from 5.6 MT at present TO 9.5 MT in
2010 and 13 MT in 2015. Demand for cream wove paper and Map litho paper is
expected to increase by 7-8%. Demand for different kinds of coated paper has
3
increased by 8% in 2002; duplex board has recorded increase by 6.5%; kraft paper has
registered a 6% rise in demand and newsprint an impressive 10%.
Current world production of paper is of the order of 283 million tonnes. The per capita
consumption of paper is 45 kg. Developing countries average at 12 kg per annum and
developed countries at 152 kg per annum.
Paper is an eco-friendly product. It is made from natural raw materials and as an end
product, paper is bio-degradable. Paper has no real competing product. Plastic which
was rated as a substitute for paper has lost the race, being non bio-degradable.
Electronic media, which was considered a threat to the growth of the print media, has
not dampened the growth of paper usage by the print media. Thus there seems to be
no barrier for growth of the paper industry. Among the many regions of the world, Asia
is expected to record the highest rate of growth.
There are certain products for which market demand has always been increasing. Paper
bag is also one of such products. The consumption of paper boards used in packaging
industry has been increasing. The printing and packaging advertisements have been
showing remarkable increase. DTP is mainly used for these purposes.
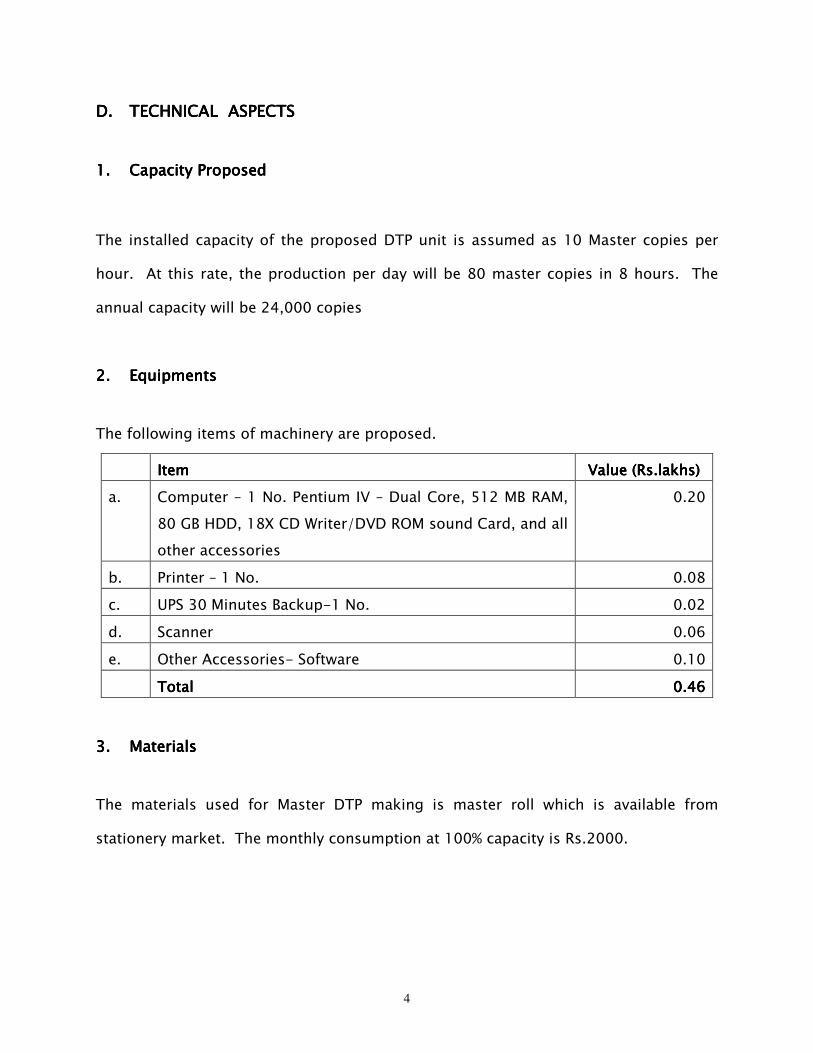
4
D.D.D.D. TECHNICAL ASPECTSTECHNICAL ASPECTSTECHNICAL ASPECTSTECHNICAL ASPECTS
1.1.1.1. Capacity ProposedCapacity ProposedCapacity ProposedCapacity Proposed
The installed capacity of the proposed DTP unit is assumed as 10 Master copies per
hour. At this rate, the production per day will be 80 master copies in 8 hours. The
annual capacity will be 24,000 copies
2.2.2.2. EquipmentsEquipmentsEquipmentsEquipments
The following items of machinery are proposed.
ItemItemItemItem Value (Rs.lakhs)Value (Rs.lakhs)Value (Rs.lakhs)Value (Rs.lakhs)
a. Computer – 1 No. Pentium IV – Dual Core, 512 MB RAM,
80 GB HDD, 18X CD Writer/DVD ROM sound Card, and all
other accessories
0.20
b. Printer – 1 No. 0.08
c. UPS 30 Minutes Backup-1 No. 0.02
d. Scanner 0.06
e. Other Accessories- Software 0.10
TotalTotalTotalTotal 0.0.0.0.46464646
3.3.3.3. MaterialsMaterialsMaterialsMaterials
The materials used for Master DTP making is master roll which is available from
stationery market. The monthly consumption at 100% capacity is Rs.2000.
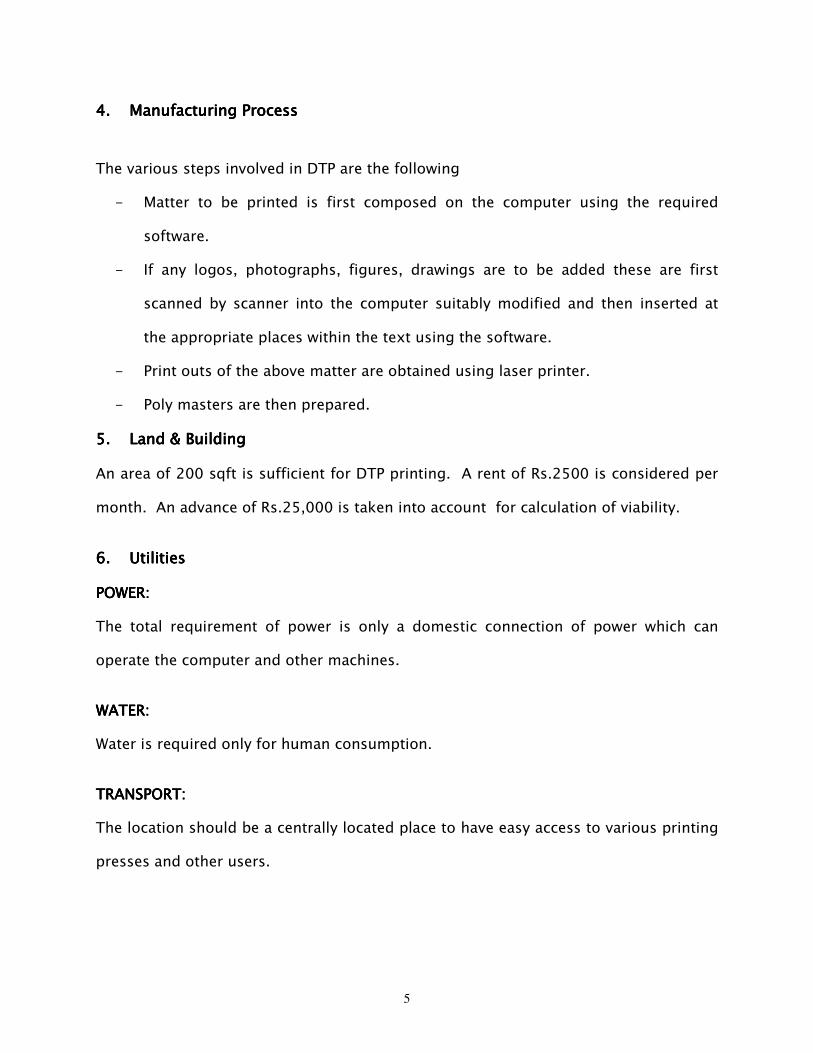
5
4.4.4.4. Manufacturing ProcessManufacturing ProcessManufacturing ProcessManufacturing Process
The various steps involved in DTP are the following
- Matter to be printed is first composed on the computer using the required
software.
- If any logos, photographs, figures, drawings are to be added these are first
scanned by scanner into the computer suitably modified and then inserted at
the appropriate places within the text using the software.
- Print outs of the above matter are obtained using laser printer.
- Poly masters are then prepared.
5.5.5.5. Land & BuildingLand & BuildingLand & BuildingLand & Building
An area of 200 sqft is sufficient for DTP printing. A rent of Rs.2500 is considered per
month. An advance of Rs.25,000 is taken into account for calculation of viability.
6.6.6.6. UtilitiesUtilitiesUtilitiesUtilities
POWER: POWER: POWER: POWER:
The total requirement of power is only a domestic connection of power which can
operate the computer and other machines.
WATER:WATER:WATER:WATER:
Water is required only for human consumption.
TRANSPORT:TRANSPORT:TRANSPORT:TRANSPORT:
The location should be a centrally located place to have easy access to various printing
presses and other users.
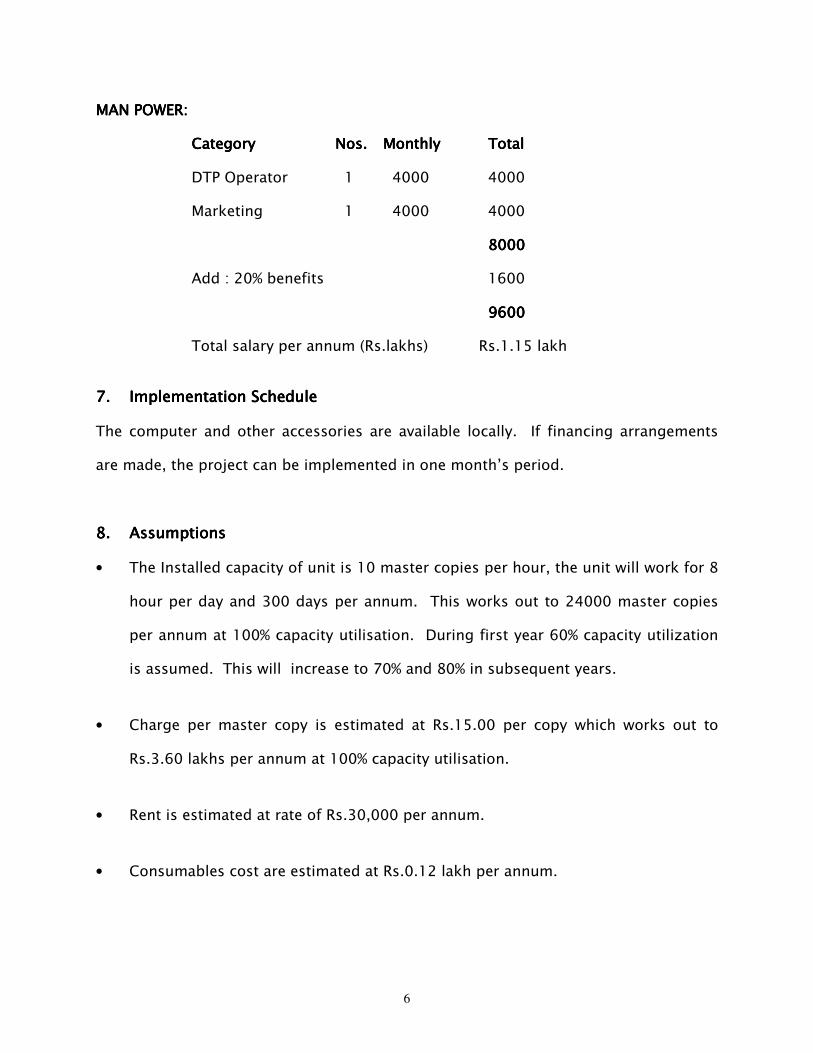
6
MAN POWER:MAN POWER:MAN POWER:MAN POWER:
CategoryCategoryCategoryCategory Nos.Nos.Nos.Nos. MonthlyMonthlyMonthlyMonthly Total Total Total Total
DTP Operator 1 4000 4000
Marketing 1 4000 4000
8888000000000000
Add : 20% benefits 1600
9600960096009600
Total salary per annum (Rs.lakhs) Rs.1.15 lakh
7.7.7.7. Implementation ScheduleImplementation ScheduleImplementation ScheduleImplementation Schedule
The computer and other accessories are available locally. If financing arrangements
are made, the project can be implemented in one month’s period.
8.8.8.8. Assumptions Assumptions Assumptions Assumptions
• The Installed capacity of unit is 10 master copies per hour, the unit will work for 8
hour per day and 300 days per annum. This works out to 24000 master copies
per annum at 100% capacity utilisation. During first year 60% capacity utilization
is assumed. This will increase to 70% and 80% in subsequent years.
• Charge per master copy is estimated at Rs.15.00 per copy which works out to
Rs.3.60 lakhs per annum at 100% capacity utilisation.
• Rent is estimated at rate of Rs.30,000 per annum.
• Consumables cost are estimated at Rs.0.12 lakh per annum.
7
• Power charge is estimated at the current rate which works out to Rs 0.30 lakh per
annum
• Wages & Salary is estimated at Rs.1.15 lakhs per annum.
• Repairs & Maintenance expense is estimated at Rs.6,000 per annum.
• Depreciation is calculated on WDV method
• Administrative & General expense is assumed Rs.24,000 per annum.
• Interest on Term Loan borrowing is estimated at 12%.
LIST OF LIST OF LIST OF LIST OF COMPUTER AND COMPUTER AND COMPUTER AND COMPUTER AND OTHEROTHEROTHEROTHER ACCESSORIES ACCESSORIES ACCESSORIES ACCESSORIES SUPPLIERSSUPPLIERSSUPPLIERSSUPPLIERS
1. Wipro Infotech Ltd., No.85, TTK Road, Chennai 600 018.
2. CCS Infotech Ltd., III Floor, No.18-A, Periyar Road, Chennai 600 0017.
COST OF PROJECT AND MEANS OF FINANCE COST OF PROJECT AND MEANS OF FINANCE COST OF PROJECT AND MEANS OF FINANCE COST OF PROJECT AND MEANS OF FINANCE
1. COST OF PROJECT1. COST OF PROJECT1. COST OF PROJECT1. COST OF PROJECT [Rs.lakhs][Rs.lakhs][Rs.lakhs][Rs.lakhs]
Building (Advance) 0.25
Equipments 0.46
Other Misc. assets 0.20
Pre-Operative expenses 0.20
Working Expenses 0.10
Total Total Total Total 1.211.211.211.21
2. MEANS OF FINANCE2. MEANS OF FINANCE2. MEANS OF FINANCE2. MEANS OF FINANCE
Capital 0.91
Term Loan 0.30
Total Total Total Total 1.211.211.211.21
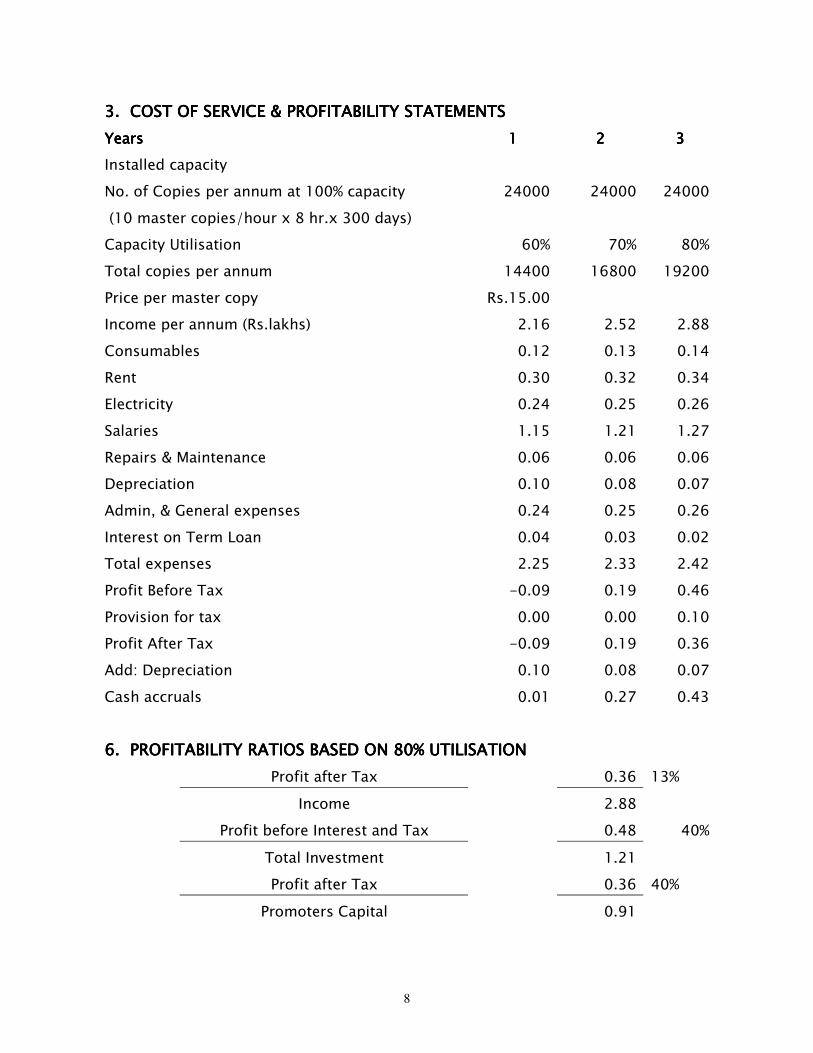
8
3. COST OF SERVICE & PROFITABILITY STATEMENTS3. COST OF SERVICE & PROFITABILITY STATEMENTS3. COST OF SERVICE & PROFITABILITY STATEMENTS3. COST OF SERVICE & PROFITABILITY STATEMENTS
YearsYearsYearsYears 1111 2222 3333
Installed capacity
No. of Copies per annum at 100% capacity 24000 24000 24000
(10 master copies/hour x 8 hr.x 300 days)
Capacity Utilisation 60% 70% 80%
Total copies per annum 14400 16800 19200
Price per master copy Rs.15.00
Income per annum (Rs.lakhs) 2.16 2.52 2.88
Consumables 0.12 0.13 0.14
Rent 0.30 0.32 0.34
Electricity 0.24 0.25 0.26
Salaries 1.15 1.21 1.27
Repairs & Maintenance 0.06 0.06 0.06
Depreciation 0.10 0.08 0.07
Admin, & General expenses 0.24 0.25 0.26
Interest on Term Loan 0.04 0.03 0.02
Total expenses 2.25 2.33 2.42
Profit Before Tax -0.09 0.19 0.46
Provision for tax 0.00 0.00 0.10
Profit After Tax -0.09 0.19 0.36
Add: Depreciation 0.10 0.08 0.07
Cash accruals 0.01 0.27 0.43
6. PROFITABILITY RATIOS BASED ON 80% UTILISATION6. PROFITABILITY RATIOS BASED ON 80% UTILISATION6. PROFITABILITY RATIOS BASED ON 80% UTILISATION6. PROFITABILITY RATIOS BASED ON 80% UTILISATION
Profit after Tax 0.36 13%
Income 2.88
Profit before Interest and Tax 0.48 40%
Total Investment 1.21
Profit after Tax 0.36 40%
Promoters Capital 0.91
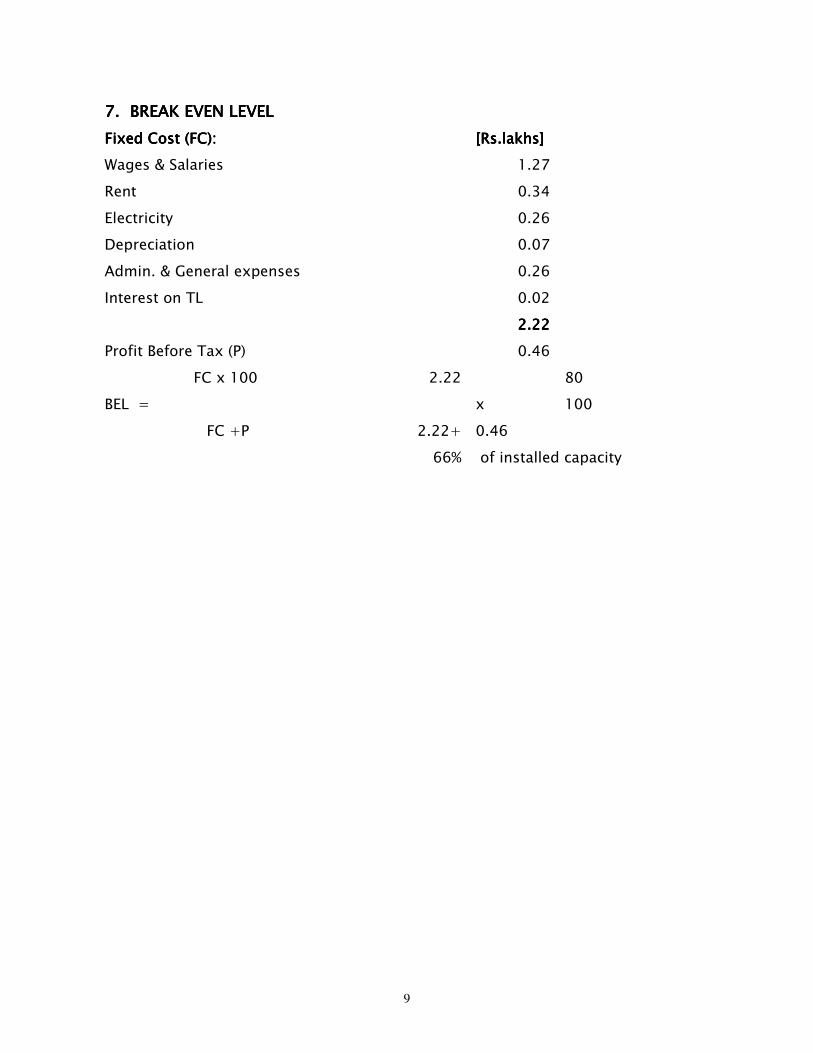
9
7. BREAK EVEN LEVEL7. BREAK EVEN LEVEL7. BREAK EVEN LEVEL7. BREAK EVEN LEVEL
Fixed Cost (FC):Fixed Cost (FC):Fixed Cost (FC):Fixed Cost (FC): [Rs.lakhs][Rs.lakhs][Rs.lakhs][Rs.lakhs]
Wages & Salaries 1.27
Rent 0.34
Electricity 0.26
Depreciation 0.07
Admin. & General expenses 0.26
Interest on TL 0.02
2.222.222.222.22
Profit Before Tax (P) 0.46
FC x 100 2.22 80
BEL = x 100
FC +P 2.22+ 0.46
66% of installed capacity
INTERNET BOOTHINTERNET BOOTHINTERNET BOOTHINTERNET BOOTH
A.A.A.A. INTRODUCTIONINTRODUCTIONINTRODUCTIONINTRODUCTION
The Internet is a global electronic community of over several thousand inter connected
computer networks. Over 50 million people are linked together, computing. This has
been aptly termed by Mr. Algore former Vice President of U.S. as the Information Super
Highway.
The internet originated in 1969 in the hands of U.S. military as a doomsday
communication system impervious to nuclear war. By the late 1980’s it had become an
important peoples’ computer network for a variety of academic researchers from
English professors to Physicists and had crossed the periphery academic institutions
and the border of U.S. Today the internet has users in more than 50 countries. It is
continuing to expand rapidly, with thousands of systems adopting internet standards
every month. In 1993, when commercial providers were first permitted to sell internet
connections to individuals, millions of new users came on within months and a new era
of computer communications began.
From a small net work set up by the U.S. Defence department, the Internet has grown
into a truly international super network. The internet has added a new dimension to
our existence by placing within our easy reach a wide range of information.
The internet offers a wealth of business opportunities. It serves as an advertising
media for business community for offering their services to customers. For up-to-
date information and assistance to business, stock market, education, medical
advances etc., Internet is undoubtedly an invaluable resource. Also the internet is
invaluable resource for communication and sharing information across any
organisation.
The internet is a boon to home too. Most networks on the internet make files available
on data base for easy access of those on networks for which several Internet Service
Providers provide connections to paid members for a wide range of services –
information / programme downloads; online conferencing; e-mails; online booking for
travel and entertainment to mention a few. They also provide information to specific
users’ groups, such as sports , musicians, help from expert group, market or sell make
friends etc.
B.B.B.B. SERVICE USAGE & SPECIFICATIONS.SERVICE USAGE & SPECIFICATIONS.SERVICE USAGE & SPECIFICATIONS.SERVICE USAGE & SPECIFICATIONS.
Internet Internet Internet Internet aaaand its usend its usend its usend its use::::
• Electronic Mail (e-mail): Sending and receiving communications through
computer network
• Information sourcing: Electronic Commerce - Commercial dealings through
electronic media, Selling Business information.
• Data Transfer
The customer can be a:The customer can be a:The customer can be a:The customer can be a:
• Student - seeking to go abroad for his/her higher studies would like to gather
information about Foreign Universities
• Doctor – needing to update his/her professional knowledge, access medical
journals, consult with experts around the world and any information related to
Health and Medicine.
• Computer professionals – to update his/her knowledge in the ever changing
Information Technology (IT) field - download software, IT news, knowledge
bases, post queries etc.
• Lawyers – to know the details of the latest case laws etc.
• House wife – wishing to know about the new recipes
The amazing assemblage of material - from information on trade and commerce
science and technology, and whatever else from electronic books to catalogs to free
software, - exists in one file or another, in the FTP (File Transfer Protocol) and WWW
(World Wide Web) servers or machines somewhere out there on the Internet.
Internet is undoubtedly a Information Super Highway.
C.C.C.C. MARKET POTENTIALMARKET POTENTIALMARKET POTENTIALMARKET POTENTIAL
Indian internet market space has been witnessing a phenomenal growth since
November 1998, when the new internet policy opened the sector for private internet
service providers. Currently 303 ISPS have licences to offer their services and 43 ISPS
are in various stages of operation.
According to a study by Gartner group, India had recorded the highest rate in 1999 in
the Asia-Pacific region for Net user growth. By end June 2000 India had 12 million net
subscribers as against 0.17 million in 1998.
The Latent demand for internet in India is huge. According to a study by NASSCOM the
internet users were as follows.
Years Years Years Years IIIInternet subscribersnternet subscribersnternet subscribersnternet subscribers Internet users Internet users Internet users Internet users
March 2001 1.6 Million 5 million
March 2002 4.0 “ 10 “
March 2003 8.0 “ 18 “
March 2007 9.27 “ 31.30
Department of Telecommunication (DoT) had set a goal of 40 million internet
subscribers through ‘various technologies’ by 2010 which has been met in 2007 itself !
Falling price of PC’s, adoption of unlimited internet access model (a fixed fee for a
period during which unlimited access is provided) and other developments will
contribute to stimulating growth of internet subscribers.
D.D.D.D. TECHNICAL ASPECTSTECHNICAL ASPECTSTECHNICAL ASPECTSTECHNICAL ASPECTS
1.1.1.1. Capacity ProposedCapacity ProposedCapacity ProposedCapacity Proposed
The Internet Booth proposed will have one server and 10 systems. The seating
capacity will be 10 seats. The booth will work for 18 hours per day from 6 A.M. to 12
night. There will be 180 seat/hours per day. The hourly rate assumed at Rs.15.00.
The annual income at 100% utilisation will be Rs.8.10 lakhs for 300 days. The viability
calculation in this project is based on Internet connection through Dishnet DSL plan
which has a faster speed.
2.2.2.2. EquipmentsEquipmentsEquipmentsEquipments
The following items of machinery are proposed.
ItemItemItemItem Value (Rs.lakhs)Value (Rs.lakhs)Value (Rs.lakhs)Value (Rs.lakhs)
1. Computer systems. (10 systems) 2.00
2. Furniture & Fittings 2.00
3. UPS -10 nos. 0.20
4. Air Conditioner – 3Nos. 0.60
5. Deposit for VSNL 0.10
TotalTotalTotalTotal 4444....99990000
3.3.3.3. MaterialsMaterialsMaterialsMaterials
There is no raw material for operating internet booth. Consumables such as printing
stationery materials, computer printer and ribbons can be made available locally.
4.4.4.4. BuildingBuildingBuildingBuilding
The total area required to start a small internet boot is 1000 sqft. This can be
arranged on rental basis. A rent of Rs.8000 is considered per month. An advance of
Rs.80,000 is taken into account for calculation of viability.
5.5.5.5. UtilitiesUtilitiesUtilitiesUtilities
POWER: POWER: POWER: POWER:
The power requirement is ordinary three phase connection for operating computer and
air conditioners.
WATER:WATER:WATER:WATER:
Water is required only for human consumption .
TRANSPORT:TRANSPORT:TRANSPORT:TRANSPORT:
The site selected for internet booth should be easily accessible to common public
MAN POWERMAN POWERMAN POWERMAN POWER:
The internet booth proposes to employ the following persons.
CategoryCategoryCategoryCategory Nos.Nos.Nos.Nos. MonthlyMonthlyMonthlyMonthly Total Total Total Total
Assistants 2 3000 6000
Manager 1 4000 4000
10101010000000000000
Add : 20% benefits 2000
12001200120012000000
Total salary per annum (Rs.lakhs) Rs.1.44 lakh
6.6.6.6. Implementation ScheduleImplementation ScheduleImplementation ScheduleImplementation Schedule
As the equipments are available easily and if financing arrangements are made, the
project can be implemented in a month’s time.
7.7.7.7. Assumptions Assumptions Assumptions Assumptions
• The Seat/hour is assumed at 54000 seat/hours per annum at 100% capacity
utilisation (for 10 machines). During first year 60% capacity utilisatised. This will
be increase to 70% and 80% in subsequent years.
• Charge per Seat/Hour is estimated at Rs.16.00 per hour, this works out to Rs.8.10
lakhs per annum at 100% capacity utilisation.
• Rent is estimated at rate of Rs.96,000 per annum.
• Internet Monthly charge is estimated at Rs.12,000 (Rs.1.20 lakhs per annum).
There is no separate Telephone charge.
• Power charge is estimated at the current rate of Rs.0.36 lakh per annum at 60%
utilization.
• Wages & Salary is estimated at Rs.0.72 lakh per annum.
• Maintenance expenses are estimated at Rs.12,000 per annum.
• Business promotional expense such as advertising is estimated at Rs.12,000 per
annum.
• Depreciation is calculated on WDV method at 60%
• Administrative & General expense is Rs.0.24 lakh per annum.
• Interest on Term Loan borrowing is estimated at 12%.
LIST OF SUPPLIERSLIST OF SUPPLIERSLIST OF SUPPLIERSLIST OF SUPPLIERS
1. Videsh Sanchar Nigam Ltd., No.5, Swamy Sivananda Salai, Chennai 600 002.
2. BSNL Chennai
3. Siby Chennai
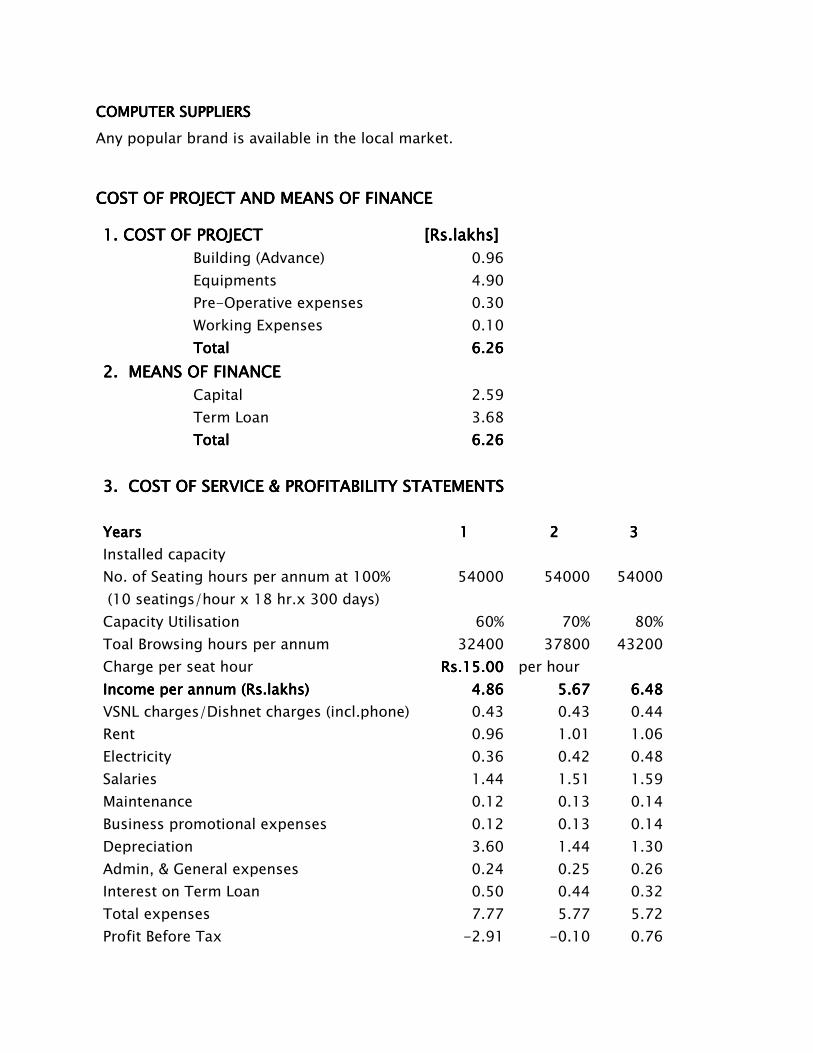
COMPUTECOMPUTECOMPUTECOMPUTER SUPPLIERSR SUPPLIERSR SUPPLIERSR SUPPLIERS
Any popular brand is available in the local market.
COST OF PROJECT AND MEANS OF FINANCE COST OF PROJECT AND MEANS OF FINANCE COST OF PROJECT AND MEANS OF FINANCE COST OF PROJECT AND MEANS OF FINANCE
1. COST OF PROJECT1. COST OF PROJECT1. COST OF PROJECT1. COST OF PROJECT [Rs.lakhs][Rs.lakhs][Rs.lakhs][Rs.lakhs]
Building (Advance) 0.96
Equipments 4.90
Pre-Operative expenses 0.30
Working Expenses 0.10
Total Total Total Total 6666.26.26.26.26
2. MEANS OF FINANCE2. MEANS OF FINANCE2. MEANS OF FINANCE2. MEANS OF FINANCE
Capital 2.59
Term Loan 3.68
Total Total Total Total 6.266.266.266.26
3. COST OF SERVICE & PROFITABILITY STATEMENTS3. COST OF SERVICE & PROFITABILITY STATEMENTS3. COST OF SERVICE & PROFITABILITY STATEMENTS3. COST OF SERVICE & PROFITABILITY STATEMENTS
YearsYearsYearsYears 1111 2222 3333
Installed capacity
No. of Seating hours per annum at 100% 54000 54000 54000
(10 seatings/hour x 18 hr.x 300 days)
Capacity Utilisation 60% 70% 80%
Toal Browsing hours per annum 32400 37800 43200
Charge per seat hour Rs.15.00Rs.15.00Rs.15.00Rs.15.00 per hour
Income per annum (Rs.lakhs)Income per annum (Rs.lakhs)Income per annum (Rs.lakhs)Income per annum (Rs.lakhs) 4.864.864.864.86 5.675.675.675.67 6.486.486.486.48
VSNL charges/Dishnet charges (incl.phone) 0.43 0.43 0.44
Rent 0.96 1.01 1.06
Electricity 0.36 0.42 0.48
Salaries 1.44 1.51 1.59
Maintenance 0.12 0.13 0.14
Business promotional expenses 0.12 0.13 0.14
Depreciation 3.60 1.44 1.30
Admin, & General expenses 0.24 0.25 0.26
Interest on Term Loan 0.50 0.44 0.32
Total expenses 7.77 5.77 5.72
Profit Before Tax -2.91 -0.10 0.76
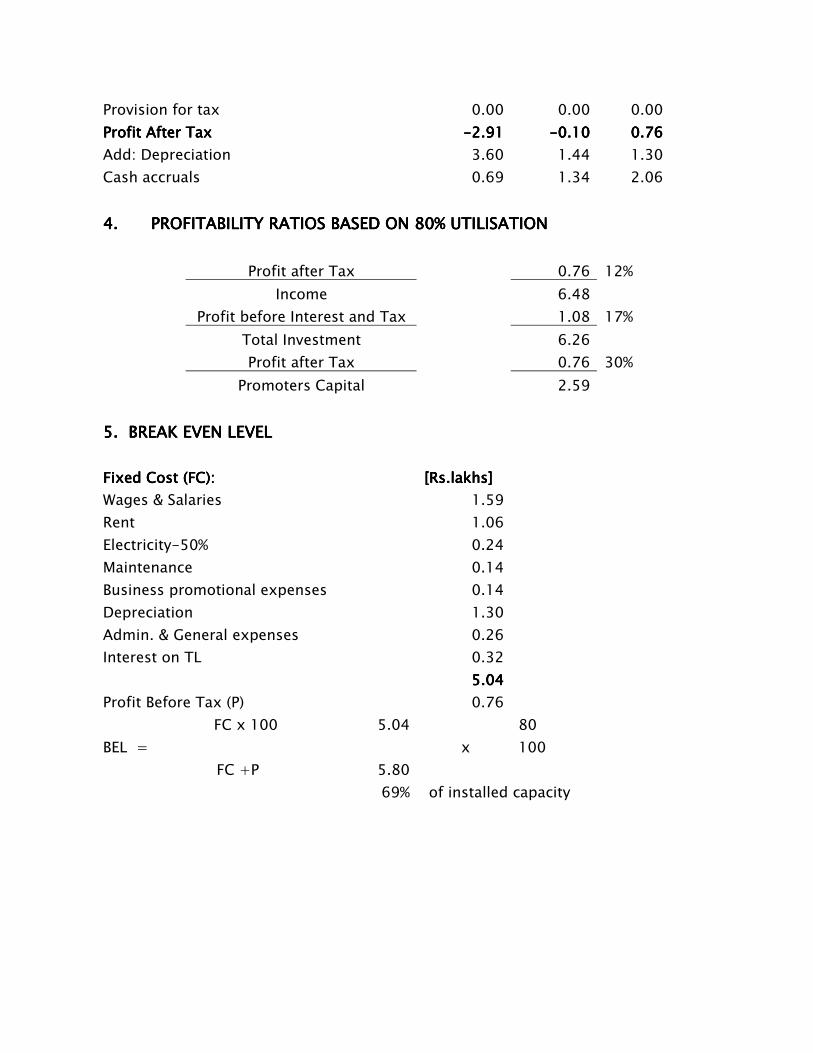
Provision for tax 0.00 0.00 0.00
Profit After TaxProfit After TaxProfit After TaxProfit After Tax ----2.912.912.912.91 ----0.100.100.100.10 0.760.760.760.76
Add: Depreciation 3.60 1.44 1.30
Cash accruals 0.69 1.34 2.06
4.4.4.4. PROFITABIPROFITABIPROFITABIPROFITABILITY RATIOS BASED ON 80% UTILISATIONLITY RATIOS BASED ON 80% UTILISATIONLITY RATIOS BASED ON 80% UTILISATIONLITY RATIOS BASED ON 80% UTILISATION
Profit after Tax 0.76 12%
Income 6.48
Profit before Interest and Tax 1.08 17%
Total Investment 6.26
Profit after Tax 0.76 30%
Promoters Capital 2.59
5. BREAK EVEN LEVEL5. BREAK EVEN LEVEL5. BREAK EVEN LEVEL5. BREAK EVEN LEVEL
Fixed Cost Fixed Cost Fixed Cost Fixed Cost (FC):(FC):(FC):(FC): [Rs.lakhs][Rs.lakhs][Rs.lakhs][Rs.lakhs]
Wages & Salaries 1.59
Rent 1.06
Electricity-50% 0.24
Maintenance 0.14
Business promotional expenses 0.14
Depreciation 1.30
Admin. & General expenses 0.26
Interest on TL 0.32
5.045.045.045.04
Profit Before Tax (P) 0.76
FC x 100 5.04 80
BEL = x 100
FC +P 5.80
69% of installed capacity