Business Plan - The Wall Street...
54
myCFO Business Plan January 5, 2000 STARS0031068
-
Upload
trinhquynh -
Category
Documents
-
view
217 -
download
1
Transcript of Business Plan - The Wall Street...

myCFO
Business Plan
January 5, 2000
STARS0031068
Proprietary & Confidential
I. EXECUTIVE SUMMARY
myCFO is a unique professional financial services firm focused on providingcomprehensive, tailored financial solutions for individuals in varying stages of wealthaccumulation.
While myCFO’s current focus is dedicated to the $5 million and above high net worth(HNW) market in the United States, the company will also extend its services in the near term serve other markets both internationally and in the U.S.
Primary Market: U.S. high net worth households with $5 million and above
HN households with $5 million or more in net worth spend an average of $145,000 peryear per household on financial services, and comprise the most demanding and financiallycomplex market for myCFO. Typically, these households use a variety of advisors for taxplanning, investment planning, and wealth management. Additionally, these households alsoemploy personal staffs, which might include bookkeepers, drivers, nannies or pilots, all of whomneed to be managed. As a result, HNW individuals face a complicated, time intensiveintegration process to manage their total financial situation, and ultimately are liable if anythinggoes wrong.
myCFO currently provides an unsurpassed service offering to this segment by combiningpersonalized financial counseling with state-of-the-art, Internet technology (the Online ServiceOffering). Each client has a single point of contact with a Client Service Director who providesa core offering of tax services, including individual tax consulting, tax planning, compliance andaccounting services. In addition, the Client Service Director provides a single point of contactfor a full suite of specialty services, which are provided through Specialty Directors with in-depth knowledge on specific areas. Through the Online Service Offering, the client’s entire teamof advisors has unprecedented access to the client’s real time financial position, withsupplemental accounting reports and information, freeing up more time to dedicate to financialand tax planning. Additionally, myCFO’s advanced bill payment services are designed formultiple users, client entities and accounts, and are integrated with tax classification andpreparation, which significantly reduces the administrative burden at "tax time."
Other Markets
1. Interndtional. As attractive as the U.S. market for HNW individuals is, it representsless than 30% of wealth worldwide. Additionally, the international markets are experiencing adramatic increase in the number of newly wealthy individuals. For example in Europe, onlyabout 1/3 of the total wealth market of $142 billion is inherited. The rest was generated throughInitial Public Offerings (40%), sales of private businesses (10%), and high annual incomes of least $500 thousand per year (15%) (VIP Forum 1996). myCFO sees an opportunity to providethe rest of the world with the same leading edge services it provides in the U.S.
2. Mass Market of Affluent Individuals (MMAD There are 6 million households with anet worth of $1-$5 million (including all assets except personal residence), growing at 2’0%annually. There are an additional 35 million "emerging affluent" households with a net ’,worth ofbetween $100 thousand and $1 million. The service market that provides tax planning and
myCFO Business Plan 2 1/5/00
STARS0031069

Proprietary & Confidential
preparation services to these "emerging affluent" is fragmented, and lacks true market leaders.Generally, individuals in these households either end up being very involved in the preparationof their taxes, or they delegate the process to the same accountant they had before they werewealthy, myCFO sees a significant opportunity to serve the unmet needs in this market. Forhouseholds with $1-$5 million, my CFO will provide the Online Service Offering and a ClientService professional to prepare tax returns, handle estate planning and respond to specificquestions on topics such as establishing trusts for multiple entities or defining a residencestrategy that minimizes local taxes. For households with $100 thousand to $1 million, myCFOwill offer an online subscription service, which will provide even the most purely self-reliantclient with self-service tax preparation products, advanced bill payment services linked to taxpreparation, and access to expert advisors through online Q&A forums and chat rooms.Additionally, these clients will have the option to select a client service package to receivepersonal myCFO advisory services.
myCFO Strategy
There are four aspects of myCFO’s strategy that make it an unparalleled offering:
1. Comprehensive approach, managing the complete financial life of myCFO clients.
2. World-classfinancial advisors, including many of the best HNW tax and accountingprofessionals in the country, most being seasoned partners from the Big 5 professional servicesfirms.
3. Unbiased advice, giving clients best-of-breed, independent solutions. From afoundation based on individual tax and accounting, myCFO helps clients by providing the bestsolutions across a variety of needs, including:
o. Estate and Trust Planning, Management and Advisory Services¯ Philanthropy Planning, Management and Advisory Services¯ Tax and Investment Packaged Solutions¯ Investment Planning, Management and Advisory Services¯ Insurance Planning, Management and Advisory Services
4. Online Service Offering, a web-enabled, online consolidation of all financial activitiesacross institutions, including a client’s assets, liabilities, income, expenses and taxes, myCFOautomates the process of accounting, bookkeeping, bill payment and taxes, thereby eliminatingpaperwork, saving time, and providing unsurpassed accuracy and quality for its clients.
II. MARKET SIZE AND GROWTH
myCFO’s client strategy is to provide a total financial solution for the following markets:
¯ HNW households, usually with a net worth between $5 million and $1+ billion¯ The MMAI, usually with a net worth between $1 million and $5 million¯ The emerging MMAI, usually with a net worth between $I00 thousand and $1
million
myCFO Business Plan 3 1/5/00
STARS0031070

Proprietary & Confidential
Current Market Size
Top 1%
Top 2-10%
Rest
¯ v/^
9%
90°1o
49%
34%
17%
% U.S. Households % U.S. Wealth
The HNW market is significantly large and growing. Roughly 1% of all householdscontrol nearly half of the wealth in the U.S., and 10% of the country controls over 80%.According to the Spectrem Group’s 1998 survey, and confirmed by PSI, Cerulli and theAdvisory Board, over 400,000 households have investible assets of over $5 million, and 3,000households have over $100 million in net worth. Between 1998 and 2000, approximately 65,000new households are expected to reach the $5 million and above net worth level (based onestimates from PSI and the Advisory Board).
ra6MHouseholdsBetween $1-4.9M
¯ 307KHouseholdsBetween $5-9.9M
I:]110KHouseholdsover $10M
In the MMAI market, nearly 7 million U.S. households have over $1 million in investibleassets (including 401K and all assets, excluding personal residence), and according to Spectrem,this population is growing by 26.4% annually. By focusing at the high end of the market,myCFO has the opportunity to represent the vast majority of all wealth in the U.S., whilesimultaneously reaching an underserved market.
According to data from Federal Reserve Board’s Survey of Consumer Finance andSpectrem, there also exist approximately 35 million households with a net worth between $100
myCFO Business Plan 4 1/5/00
STARS0031071

Proprietary & Confiden!ial
thousand and $1 million. And, according to PSI and the Advisory Board, the number of affluentAmerican households is expected to grow by 25% between 1998 and 2000.
The Spectrem Group also projects that HN households spend over $195 billion onfinancial services each year. Within this population, households with $5+ million in investibleassets (excluding 401K and personal residences) each spend about $145 thousand per year financial services, while households with $1+ million in investible assets (excluding personalresidences) each spend roughly $33 thousand per year.
Market GrowthProjected Population Growth by Net Worth
(1992-2000E CAGR)
17%
11%
1%
US Population Net Worth Net Worth$500K+ $1MM+
myCFO is positioned to serve a rapidly growing client base. The U.S. is in the midst ofthe longest, largest bull market in history. In 1998 alone, $2 trillion was generated intransactions, such as IPOs and M&As. From November 1994 to November 1999, the value ofthe U.S. markets has increased by $10 trillion, with approximately 40% of this wealth held byindividual investors (CNNfn December 1999). The number of millionaires has more thandoubled since the start of the 1990s, reaching 7.9 million in 1998 (Spectrem Group 1999).
Going forward, the number of millionaires is expected to increase 400%, from 5 millionto 20 million between 1998 and 2008 (Forbes 1999).
An enormous amount of wealth will transfer between U.S. generations in the near future,including approximately $15 trillion that will change hands over the next ten years. According
Number of Households Value of Expectedwith Final Estates Wealth Transfer
1998 - 201725.8 million $11.6 trillion
20 Years
1998 - 205287.8 million $40.6 trillion
55 Years
myCFO Business Plan 5 1/5/00
STARS0031072

Proprietary & Confidential
to Havens and Schervish (10/19/99) of Boston College’s Social Welfare Research Institute,"over the 55 year period from 1998 to 2052, the wealth transfer will be $41 trillion, and may wellreach double or triple that amount."
III. THE DIFFERENT NEEDS OF THE "EMERGING WEALTHY"
The needs of the "emerging wealthy" are very different from those of the wealthy beforethem. While "old money" tends to use a single, expensive, labor-intensive general serviceprovider, the newly wealthy are more financially complex, are younger and more active, andexpect the best from technology. As these trends continue to define the HNW and MMAImarkets, myCFO will emerge as the leading financial firm to serve their needs.
1. Increasing complexity. The emerging wealthy are more demanding, making andspending more money than ever before, and creating an unprecedented level of complexity intheir financial lives. They may have a second house, a boat, an airplane, or a vineyard, inaddition to their primary residence. Each of these entities has cash flow, control and taxrequirements. In addition, they likely have accounts with a variety of financial serviceinstitutions. According to Money magazine, even the average American now uses 15 bankingand investment "products"--checking, credit cards, mortgage, mutual funds, life insuranceetc.--from five different providers, resulting in a highly time-intensive task to manage theirfinancial affairs.
SingleProvider
ActiveMana, ement
@MultipleBest-in-ClassProviders
PassiveDelegation
Implications
eIncreasing complexity offinancial dealings
OIncreasing amount of time& money spent onmanagement
Olncreasing demand fortechnology
Due to this level of complexity in their financial lives, these individuals spend aninordinate amount of time on administrative tasks, such as aggregating financial statements,gathering information for their accountant to prepare tax filings, monitoring the activities andperformance of their financial service providers and personal staff, and researching new advisorsfor trust planning, mortgage lending advice, insurance, etc. They are also very concerned aboutwhether they’re getting the best advice given their changing needs. Yet they have no place toturn for sophisticated and unbiased evaluations and mentorship. And most do not have asingle,trusted advisor looking at the big picture and helping to evaluate and coordinate services acrossall aspects of their financial lives. They need someone to bring together such disparate issues astax planning, investments, management of options, buying a primary or vacation home and
myCFO Business Plan 6 1/5/00
STARS0031073

Proprietary & Confidential
securing the financing, LLC strategies, gifting to family members, charitable trusts and’ wealthtransfer.
In the end, many of these emerging wealthy find that their new wealth creates more of achallenge than they expected, and that they spend many precious hours of their free timestruggling with the demanding task of managing their financial picture. For these individuals,there is no current solution that truly liberates them from the burden of managing their wealth.
2. Younger, more actively involved clients. More than half the individuals worth $5million or more are 55 years of age or younger, according to the VIP Forum. These youngerHNW individuals are much more actively involved in managing their financial picture and,according to Bernstein Research, tend to employ almost twice as many advisors as theircounterparts, age 60 and above. According to analysts, including Forrester Research, only about20% of American investors depend solely on an advisor for all of their financial needs. The restwant more control, either through a combination of advisors and online services or through apurely online solution in which they conduct all transactions themselves. This trend indicatesdemand for solutions that bring together "best-of-breed" solutions, offering clients anopportunity for greater involvement in managing their financial picture.
3. Increasing use of the Internet. Over the past five years, the world has seen anexplosive growth of communication and transactions over the Internet. Looking ahead,International Data Corporation estimates that by the end of 2002 there will be 400 million peopleusing the Internet worldwide, up from 142 million at the end of 1998. During this same period,worldwide commerce over the Internet will increase to $734 billion in 2002, from $50 billion in1998.
Some of the key factors driving this growth include ease of access, anonymity, essentiallyfree information and data exchange, limitless geographic boundaries, and greater convenienceand privacy. And, as the technology adoption rate continues, companies have begun offeringmore complex products and services online. For example, the first online financial serviceofferings included simple electronic banking transactions and inquiry. Today, one can purchaseand trade stocks and mutual funds, get pre-approved and arrange for a mortgage loan, and shopand compare insurance products across providers.
IV. THE mvCFO SOLUTION
myCFO provides a comprehensive solution that links together all of the financial servicesthat the HNW individual and MMAI require. By leveraging the trusted, unbiased position of atax advisory professional, myCFO can provide top quality advice across a variety of financialservices needs. By combining extensive expertise and unsurpassed client service with the powerof the its Online Service Offering, myCFO enables each client to benefit from a personalrelationship with the best professional advisors while gaining unparalleled online access to theircomplete, real-time financial information.
The web-enabled Online Service Offering provides a cutting-edge, integrated sei-vicemodel that includes:
¯ Immediate access at all times to secure data on myCFO clients’ total financial situationI
myCFO Business Plan 7 1/5/00
STARS0031074
Proprietary & Confidential
¯ Online access for myCFO clients’ entire team of financial and legal advisors
¯ Unique, comprehensive reports on myCFO clients’ financial position
¯ Single point of access for news and information pertaining to myCFO clients’ specificportfolio of broad financial holdings and tax situation
The Online Service Offering enables enhanced communication and tighter integrationacross all aspects of myCFO clients’ financial lives, providing the support necessary to makeimportant financial decisions more efficiently and intelligently.
Phase 1: Provide full myCFO services to HNW households ($5 million - $1+ billion)
myCFO’s highest level of service consists of three components:
World-class HNW individual tax and accounting services
As a first step in providing a total financial solution for HN households, myCFO hasdeveloped a leading tax and accounting professional services practice for HNW individuals. Thestrategy to lead with tax services as the cornerstone is based on the fact that these advisorsachieve the most intimate and trusted relationships with the HNW clients, and are most naturallyat the center of long range financial planning. These "Client Service Directors" work with theirclients to define financial objectives, and then collaborate with the client and the client’s otheradvisors to execute a plan which best achieves these goals.
myCFO is quickly attracting many of the most experienced and successful tax experts,each with 10-30 years of experience in the private client groups of the Big 5 professionalservices firms, HNW boutique firms and HNW law firms. Each Client Service Director isdeveloping his or her own practice, serving HNW clients from myCFO regional offices acrossthe country. Currently, myCFO expects to have I0 offices in the U.S. by the end of 2000.
myCFO believes most people have underestimated the significant impact that highquality tax services can have in protecting and building one’s asset base. For example, a recentstudy of the affluent by U.S. Trust indicates that "most affluent Americans underestimated therate at which their estate will be taxes, citing an average of 24%, while in reality, the range ismore likely 37-55%."
Specialty services
The second step in providing a total financial solution for HNW households is to offercomprehensive financial management services based on an integrated, 360-degree view of eachclient’s financial landscape. A dedicated Client Service Director manages the client relationshipand the client’s overall financial picture, and as appropriate, brings in Specialty Directors withdeep subject matter expertise in the following areas:
¯ Estate & Trust Planning, Management and Advisory Services;¯ Tax and Investment Packaged Solutions;
¯ Philanthropy Planning, Management and Advisory Services;
myCFO Business Plan 8 1/5/00
STARS0031075

Proprietary & Confidential
¯ Investment Planning, Management and Advisory Services; and
¯ Insurance Planning, Management and Advisory Services
Online Service Offering
The final step of myCFO’s total financial solution for HN households is to provide theclient’s full financial picture online. Clients and their advisors will have confidential and secureaccess to the clients’ entire financial information for all client entities. Monthly reports will beavailable by the end of Q1, 2000 and daily reports will be delivered during Q2/3, 2000. Onlineservices will include:
Financial Summary Home Page¯ Balance sheet, including status of all assets, liabilities and investments, whether held
personally, through trusts, or through a separate legal entity¯ Cash flow statements for personal income generating assets and entity related items¯ Income statements, both personal and for each legal entity, trust, estate, etc.
Financial Center¯ Expense management, including bill payment with advanced approval rules and
classification of each bill to the applicable entity/category
¯ Investment management to track all investments
Tax Center¯ Summary of the clients’ tax situation and applicable liabilities
¯ Tax planning module¯ Integration with tax compliance software
Message Center
¯ Confidential communication between client and multiple advisors
¯ Proactive notification of financial matters needing client attention
News and Information¯ Breakiiag financial and business news¯ Stock quotes, charts and company information¯ Information and commentary from financial experts on related topics
¯ Financial news, commentary and information on key topics for myCFO’s suite ofservices
Safety Deposit Box Center¯ Estate plan documents
¯ Wills
¯ Trust documents
myCFO Business Plan 9 1/5/00
STARS0031076

Proprietary & Confidential
¯ Insurance plan documents
Transactions Beyond 2000
¯ Transactions via financial institutions
¯ myCFO marketplace--aggregated financial and non-financial products that meetmyCFO standards for quality, performance and service
Pricing
Pricing for myCFO services depends on the nature of the service. For HN households,myCFO charges a retainer fee based on the client’s financial complexity and assets in exchangefor the core services of basic tax planning, accounting and compliance services, and for theOnline Service Offering. Such fees generally start at $25,000 per year.
Specialty Services are priced depending on the type of service rendered, and are generallycalculated using a basis point of assets or expected time requirement approach.
Phase 2: Extend the myCFO solution internationally
myCFO will be able to replicate its core services and suite of specialty servicesinternationally by coupling myCFO’s proprietary learning, expertise and technology with localknowledge and relationships through strategic partnerships at the country level, myCFO iscurrently evaluating the opportunity in specific countries and the optimal approach for globalimplementation.
The international market represents a large opportunity for myCFO, as 70% of theworld’s wealth lies outside the U.S.
1996 Worldwide HNW Market = $17-20 trillion
Europe/Middle East
Latin America
U.S.
Asia
myCFO Business Plan 10 1/5/00
STARS0031077

Proprietary & Confidential
Phase 3: Extend the myCFO solution to include new markets and new service offerings
myCFO sees limitless potential to further extend the myCFO solution, both bybroadening the range of affluent individuals served, and by offering additional value-addedservices, such as concierge advisory services, to the current client base.
Opportunity to serve the Mass Market of Affluent Individuals
There is a large population of affluent households with less than $5 million in net worthwhose needs are largely underserved. This population is growing quickly, at a projected 8%annual growth rate versus a 1% rate for the aggregate U.S. population growth. According toSpectrem, these millionaires with less than $5 million in assets are spending $142 billionannually on financial services.
These clients have less complex financial holdings than HNW households and do notrequire the entire breadth or depth of myCFO services. The profile of this group is also verydiverse, with varying risk profiles, involvement in financial research and decision-making,willingness to use and pay for full service advisors, and comfort level with the Internet andtechnology.
myCFO plans to approach this expansion in two steps. First, myCFO will target the 6million households with $1-$5 million in net worth, who tend to be technologically oriented andwho welcome advice, but are also more hands-on in managing financial affairs. Second, myCFOwill address the needs of the future millionaires, the 35 million households with $0.1-$1 millionin net worth, who can be served primarily through the Online Service Offering at a much lowerCOSt.
1. Service offering for the $1-$5 million market. Within the $1-$5 million tier of wealth,clients maintain a high level of involvement in financial decision-making, with less interest inpaying for the highest-end services (i.e., would fly first class, but less likely to charter a jet). address the needs of this market, myCFO will present a special option, with a clearly definedprofessional service offering supplemented with the complete Online Services Offering.
Clients will have online access to information and standardized advice, with limited callcenter support for more personal advice. Twice a year, a dedicated Client Services Professionalwill meet with the client, once to develop a financial plan and a second time to review their taxpreparation. Additional services will be available through the pool of expert myCFO SpecialtyDirectors, offering planning and advice across all five specialty service areas, including estateand trust advisory, tax and investment packaged solutions, philanthropy, investment planning,and insurance advisory.
Fees for this service would range from $250-$5000 per year, and average $150 a monthper household.
2. Service offering for the $0.1-$1 million market and the self-directed affluent investor.Clients with lower levels of wealth are more likely than their higher net worth counterparts tomanage their own financial situation and prepare their own taxes. However, householdsreaching $0.1-$1 million in net worth begin to experience a level of financial complexity that
myCFO Business Plan 11 1/5/00
STARS0031078

Proprietary & Confidential
would best be managed by an experienced financial manager and high-caliber CPA. At the sametime, these clients are not used to paying high premiums for these types of services.
To meet the needs of this broader market, myCFO will provide a standardized, highquality offering that leverages its learning and experience, delivered primarily through theOnline Services Offering. myCFO revenues will come primarily from subscription fees andonline advertising to this market. Those clients seeking more personalized, "high touch"services will have access to a range of individual fee for service options. And, as clientsaccumulate greater wealth and become part of the MMAI with $1-$5 million, myCFO will tailorthis offering more personally to better meet their needs.
By providing a menu of membership options, myCFO clients may select the services theywant, at the prices they are willing to pay. Basic service includes the Online Service Offering, aswell as news and information, stock quotes and charts, reference and tools, expert proprietarycommentary, and community services, such as chat rooms and Q&A. The unique value of thisservice lies in the targeted advice and information provided by myCFO’s team of financialexperts.
Subscription fees for the basic service would average $17.50 per client per month,including advertising fees. Additionally, members will have the option to work directly withmyCFO Client Service Consultants, both specialists and generalists through myCFO call centersand regional offices.
Opportunity to broaden the range of client services to include concierge advisory services
In addition to providing these individuals with financial services, myCFO recognizes thedemand for a broad range of services traditionally provided only through a family office.According to Financial Planning Magazine (01/00), "Advisers need to differentiate themselves,yet investing has become commoditized as clients have become familiar with the process of assetallocation and mutual fund selection. For advisers who want to add value, one approach is toserve as a wealth manager, offering a family office for clients." And Wired Magazine writes(September 1999) that the first thing the rich of today do is "hire Jeeves...Time is their primescarcity; so as wealth becomes more common, time will be purchased by hiring personalservices."
myCFO sees a broad opportunity to offer these types of services, such as:
¯ Asset purchasing: Managing the whole process and related research with respect tolarge purchases, such as an airplane, a Picasso, or a home in Kona. myCFO wouldhandle the research, negotiation, financing, management of legal issues,shipping/moving and insurance; everything except the actual decision of which home,painting or airplane to buy
¯ Education: Offering seminars on philanthropy, wealth transfer or economic trends.Also, wealth training for younger generations
myCFO Business Plan 12 1/5/00
STARS0031079

Proprietary & Confidential
¯ Project management: Helping clients with special projects, such as determining thebest country in which to expatriate, building a philanthropic program or organizing afund raiser on behalf of the client
¯ Staff management: Hiring, conducting background checks, and managing personalstaff, such as pilots, maids, nannies, drivers and bodyguards
¯ Vacation and travel management: Chartering private planes, managing security,privacy and home rental in foreign countries
V. COMPETITION
There are several categories of competitors vying for a share of client wallet in the HNWand MMAI space, myCFO believes that its primary focus on tax, accounting, bookkeeping andbill payment for financially complex individuals, combining the best of client services andtechnology makes it unique in the marketplace. However, several players serve the same market,with varying degrees of success.
"Big 5" Professional Services Firms: Most of the Big 5 firms have Personal FinancialPlanning service lines. However, the primary focus for these firms is their corporate services,and not their individual planning services. In addition, the Big 5 are subject to significant SECand internal accounting and auditing function restrictions that severely limit certain serviceofferings that are critical to a total financial solution for both the HNW individuals and MMAI.Furthermore, because of their highly labor-intensive business models, substantial investmentswould be required to develop the technological infrastructure necessary to compete with the levelof service and speed of delivery offered by the myCFO solution. To develop and implement thistype of service, these firms would have to recruit a new pool of talent and make a significantfinancial investment.
Family Offices: There are currently 3,500 family offices located in the U.S., typicallystaffed with a CPA, a few bookkeepers and an administrator, and serving the very high end ofthe HNW market. Services not only include financially-oriented advisory services, but alsohighly personal services, such as coordination of in-home staff, family education and travel.These offices, while providing a high level of service and personalization, tend to be quite costly($1+ million per year to run). Also, over time, it is difficult for the staff to stay on the cuttingedge of financial and tax management. Without sophisticated software to help integrate all of theclient’s complex financial dealings, the home office staff spends significant time on coordinationand administration, instead of on value-added activities, and the clients spend more timemonitoring staff reliability and performance. These offices put the family in the position of"boss" rather than "client," requiring the family to hire and manage the family office staff evenas the staff manages the rest of the family’s employees.
Online Service Providers: myCFO will compete with several alternative providers toserve the MMAI market and potentially the HNW market as well. Currently, most of thesecompanies focus on a narrowly defined need, such as information for research or cashtransactions. If these competitors continue to add more self-service offerings and/or tailored
myCFO Business Plan 13 1/5/00
STARS0031080

Proprietary & Confidential
advice, they may become a stronger presence in myCFO’s target market. These providersinclude:
¯ Online banking services, including traditional banks and Internet banks;
¯ Online news and information sites offering finance, business and investing content,including portals, traditional publishers and proprietary news and commentary sites;
¯ Online news and information sites offering tax information and advice, also includingthe basic tax information found on free general information sites;
¯ Companies providing tax preparation tools, including software packages, onlineaccess to tax software available through several website links; and tax estimator toolsavailable on many personal finance websites; and
¯ Online matching services to connect individuals with the appropriate financial or taxadvisor for their particular needs
The key difference between myCFO’s offering and these offerings is that myCFOcombines technological innovation with world-class professional services.
Investment Firms: Certain investment firms provide professional client services for theirHNW client base. However, myCFO views these services as a powerful complement to its ownservice offering. These firms provide high quality investment management with a corecompetency in maximizing return on invested assets, myCFO leverages this capability byrecommending best-in-class investment firms to its clients as an integral part of myCFO’sinvestment planning services. Furthermore, myCFO differentiates itself from investment firmsby providing the entire breadth of specialty services for the HNW, by being independent andunbiased, by providing a high level of expertise, and by offering myCFO’s truly unique andhighly value-added Online Service Offering.
VI. MANAGEMENT
Art Shaw is myCFO’s President and Chief Executive Officer. Prior to joining myCFO, his tenureat Charles Schwab & Co. included roles as Senior Vice President for electronic brokerage, andSenior Vice President for business strategy. Mr. Shaw built and led Schwab’s online investingproducts and services, as well as launching www.schwab.com, leading to Schwab’s recognitionas the leader in online brokerage services. Mr. Shaw also served as general manager of Schwabclassic and technology solutions. His experience also includes positions with McKinsey & Co.,the worldwide consulting firm; the National Economic and Social Development Board inThailand; and Chase Manhattan Bank in New York. Mr. Shaw holds an AB in MathematicalEconomics from Brown University and an MBA from Stanford University.
Frank Tirelli is myCFO’s Chief Operating Officer, professional services. Prior to joiningmyCFO, Mr. Tirelli spent more than two decades with Deloitte & Touche LLP, most recently asRegional Managing Partner for Deloitte’s West Region. In this capacity, he supervised more thanfour thousand client service professionals and over $650 million in client billings. Mr. Tirelliserved on Deloitte’s Management Committee and was a member of Deloitte’s Board ofDirectors. Mr. Tirelli is a member of the American Institute of Certified Public Accountants, the
myCFO Business Plan 14 1/5/00
STARS0031081

Proprietary & Confiden!ial
Connecticut Society of Certified Public Accountants, and the California Society of CeriifiedPublic Accountants. He holds a BS in Business Administration from Boston College arid anMBA from Babson College.
Harvey Armstrong is myCFO’s co-founder and the Managing Director of myCFO’s SiliconValley Client Service Practice. Prior to joining myCFO, he was a Tax Partner at KPMG’s SiliconValley personal financial planning practice. His clients represent a broad spectrum drawn fromthe technology industry, professional services, real estate development and construction,mortgage banking and insurance brokerage industries. For over thirty (30) years, Mr. Armstronghas provided his clients with a full range of financial services, including family and assetprotection planning. He is a member of the American Institute of Certified Public Accountantsand the California Society of Certified Public Accountants. Mr. Armstrong holds a BS and anMS in accounting from San Jose State University.
Ed Sesek is myCFO’s Vice President of engineering. Prior to joining myCFO, he was the VP ofengineering at Actuate Software Corp., a maker of enterprise reporting software. Mr. Sesek hasheld a variety of engineering management and software development positions at both SiliconGraphics and Hewlett Packard. At SGI, he directed the development of the WebFORCE andMediaBase server products. He also was instrumental in leading the development anddeployment of the Time Warner Full Service Network. He holds BS and MS degrees inComputer Engineering from the University of Michigan.
Andy Palay is myCFO’s Chief Architect. Prior to joining myCFO, he served as chief scientist atSilicon Graphics, where he worked on operating systems, compilers, development tools, userenvironments, and the Internet. Previously, he led the user environment team for the AndrewProject, a joint Carnegie Mellon University-IBM project to build a new campus computingenvironment. He also helped design HITECH, the first chess computer to achieve a SeniorMaster Chess rating. Mr. Palay holds a BS in Computer Science and Math from the University ofWisconsin and a PhD in Computer Science from Carnegie Mellon University.
Vl. BOARD OF DIRECTORS
James Barksdale is the Managing Partner at The Barksdale Group, a full service investment andadvisory firm committed exclusively to growing leading Internet software and services start-ups.Jim is the former President and CEO of Netscape Communications Corporations. His previousexperience includes CEO of AT&T Wireless Services and Executive Vice President and ChiefOperating Officer with Federal Express Corporation. In addition to myCFO, Barksdale serves onthe boards of America Online, FDX Corporation, Homegrocer, Sun Microsystems, Inc.,Respond.corn, Robert Mondavi Corporation, Liberate Technologies, and 3Com Corporation.
John Chambers is the CEO of Cisco Systems, a principal provider of networking solutions forthe Internet. He serves as an advisor on presidential candidate George W. Bush’s Board ofTechnology and on the Boards of Directors of Clarify, Inc. and Arbor Software. Mr. Chambersholds a BA, a BS, and a JD from West Virginia University, as well as an MBA from IndianaUniversity.
myCFO Business Plan 15 1/5/00
STARS0031082

Proprietary & Confidential
Jim Clark is the founder and Chairman of the Board of myCFO. Previously, he founded, SiliconGraphics, Inc., Netscape Communications Corp., and the Healtheon Corporation. He is theauthor of Netscape Time: the Making of the Billion-Dollar Start-Up that Took on Microsoft,which chronicles the rise of the Intemet and Netscape’s role in the changing face of business andcommunications. In addition to myCFO, Mr. Clark currently serves on the Board of Directors ofHealtheon. He holds a BS and an MS in Physics from the University of New Orleans and a PhDin Computer Science from the University of Utah.
John Doerr is a partner at Kleiner Perkins Caufield & Byers, a top-ranked venture capital firm,where he has sponsored investments in such companies as Compaq, Cypress, Intuit,Macromedia, Lotus, Sun Microsystems, and Symantec. Prior to joining Kleiner Perkins, Mr.Doerr founded and acted as CEO of Silicon Compilers. In addition to myCFO, Mr. Doerrcurrently serves on the Boards of Directors of Intuit, Macromedia, Epicor, Homestore.com, SunMicrosystems, Academic Systems, the Lightspan Partnership, and Amazon.com. He holds a BAand MA in Electrical Engineering from Rice University and an MBA from the Harvard GraduateSchool of Business Administration.
Tom Jermoluk is the Chairman and CEO of Excite@Home, a global media company and leadingprovider of broadband Web services and open Intemet access via the cable infrastructure. Priorto joining Excite@Home, he served as president and CO0 of Silicon Graphics, Inc, and as aproject manager at Hewlett Packard and Bell Laboratories. In addition to myCFO, Mr. Jermolukcurrently serves on the Boards of Directors of Forte Software, Inc. and the HealtheonCorporation. He holds a BS and a MS in computer science from Virginia Tech.
Art Shaw is myCFO’s President and Chief Executive Officer. (For more detail, see"management" section above)
Legal Counsel: Larry Sonsini is a partner and chairman of the executive committee for WilsonSonsini Goodrich & Rosati, a leader in technology- and Internet-related law services. Mr.Sonsini specializes in corporate law, securities, and mergers and acquisitions. His clients includeApple Computers, Goldman Sachs, Hewlett-Packard, Morgan Stanley, NetscapeCommunications, Packard Bell, Silicon Graphics, Inc., and Sun Microsystems. In addition tomyCFO, Mr. Sonsini currently serves on the Boards of Directors of Novell, Inc., LatticeSemiconductor Corporation, PIXAR Inc., and the Haas School of Business at the University ofCalifornia, Berkeley. Mr. Sonsini holds an AB from the University of California, Berkeley andan LLB from Boalt Hall School of Law at the University of California, Berkeley.
VII. EMPLOYEES
As of December 31, 1999, myCFO employed 101 full-time employees, of which 32 arein tax and accounting, 47 are in engineering, and the rest are in marketing, finance, operations,HR and administration.
myCFO Business Plan 16 1/5/00
STAR~S0031083

A .nnua~Pr~ection s¯ Operating Cash Flow¯ Balance Sheets
STARS0031084

,~evenueGeneral Director ServicesSpecialty Director ServicesOnline Services
Total Revenue% Increase
Less Direct & Indirect CostsContribution from Business Units
% of Revenue
mvCFOPro Forrna income Statements
csooo)
1999 2001) 2001 2002 2003 2004
$ 32,690 $ 132,974 $ 276,704 $ 410,576 $ 538,432
6,744 21,832 38,774 49,372 58,837- 18,150 90,750 254,100
1,700 39,434 154,806 333,628 550,698 851.369+2220% +293% +116% +65% +55%
2.100 63,625 152.812 246.713 354.961 500.151
(400) (24,191) 1,994 86,915 195.737 351.218-24% ~1% 1% 26% 36% 41%
Overhead:R&D / Engineering
Marketing
% of Revenue
% of Revenue
General & Administrative% of Revenue
Total Overhead Expenses
Operating Income (loss)% of Revenue
2,744 15,204 22,174 46,112 61,128 94,503161% 39% 14% 14% 11% 11%
565 1,956 2,980 13,922 22,980 35,52733% 5% 2% 4% 4% 4%
1,370 8,898 13,861 19,066 34,720 53,67781% 23% 9% 6% 6% 6%
4,679 26,058 39,015 79,100 118,828 183,707
(5,079) (50,249) (37,021) 7,815 76,909 167,512-299% -127% -24% 2% 14% 20%
Pretax Income (loss)Income Tax ProvisionNet Income (loss)
% of Revenue
(5,079) (50,249) (37,021) 7,815 76,909 167,512- - (63,955)
(5,079) (50,249) (37,021) 7,815 76,909 103,557-299% -127% -24% 2% 14% 12%
JCAPITALEXPENDITURES: 4,100 10,211 11,946 13,977 21,623 23,213 j
J HEAD COUNT at Year-end 101 736 1,332 1,899 2,489 3,096I
ConfidentialDecember 1999
STARSO031085

Operating Cash Flow SummaryPro Forma ($000)
RevenueNet Income (Loss)Depreciation
(Increase) in noncash Working Capital
199.._.99 2000 200.__.! 200_..._22 200--3 2004 2005 200__6 200___77 2008 200__9 Terminal
(5,079) (50,249) (37,021) 7.815 76,909 103,557 125,634 157,043 196.304 245,380 308,725 $ 6,134,500~66 2,783 5,404 8,500 12,699 16,466 20,583 25,729 32,161 40,201 50,251 $ 1,005,020
(1,166) (4,861) (5,537) (4,450) (9,771) (13,795) (17,244) (21,555) (26,944) (33,680) (42,100) $ 181,103
Net Operating Cash flow (5,879~. (52,3261 (37,!.54_) 11,865 79,837 106,228
20% $1,027,307Net present value of cash flow @
128r973
I
161,217 20!,521 251,901’ 314#76 7w320,623
The above summary shows projected Cash Flow from Operations.Capital expenditures and operating deficits are assumed to be funded with capital infusion.
ConfldenUal Decembp.r 1.q99
STARS0031086
myCFOPro Forma Balance Sheets
Dec-99 Dec-00 Dec-01 Dec-02 Dec-03 Dec-04
ASSETSCurrent AssetsCash & Equivalents
Restricted CashAccounts ReceivableDeposits & other current assets
Total Current Assets
Fixed AssetsLess Accumulated Depreciation
7,035 19,163 (27,936) (30,379) 27,979 111,894
428 2,498 3,418750 7,193 19,093 33,876 49,698 69,594645 705 765 825 885 945
8,858 29,559 14,660)
4,100 14,311 26,257I3661 (3,149) 18,5531
3,734 11,161 17,704
4,322 78,562 182,433
40,234 61,858 85,070(17,223) (30,466) (46,932)
23,011 31,391 38,138
OtherLongtermassets
TOTAL ASSETS
LIABILITIES & EQUITY
Current LiabilitiesLine of Credit~.ccounts Payable & accrued expensesOrepaid RevenueCurrent Portion of LTDOther current liabilities
Total Current Liabilities
Long Term Debt, less current portion
TOTAL LIABILITIES
Paid-in CapitalRetained Eamings (Deficit)
TOTAL EQUITY
TOTAL LIABILITIES ~, EQUITY
2,600 2,700 2,700 2,700 2,700 2,700
15,192 43,421 15,743 30,033 112,653 223,271
150 370 590 810 1,020 1,280200 3,597 9,547 16,213 21,919 27,424235 235 1,200 1,100 1,200 1,50072 168 376 564 660 756
657 4,370 11,713 18,687 24,799 30,960
235 2,000 1,500 1,100 2,000
892 4,370 13,713 20,187 25,899 32,960
20,750 95,750 95,750 95,750 95,750 95,750
(6,450) (56.699) (93,719) (85,9041 (8,995) 94,56114,300 39,051 2,031 9,846 86,755 190,311
15,192 43,421 15,743 30,033 112,653 223.271
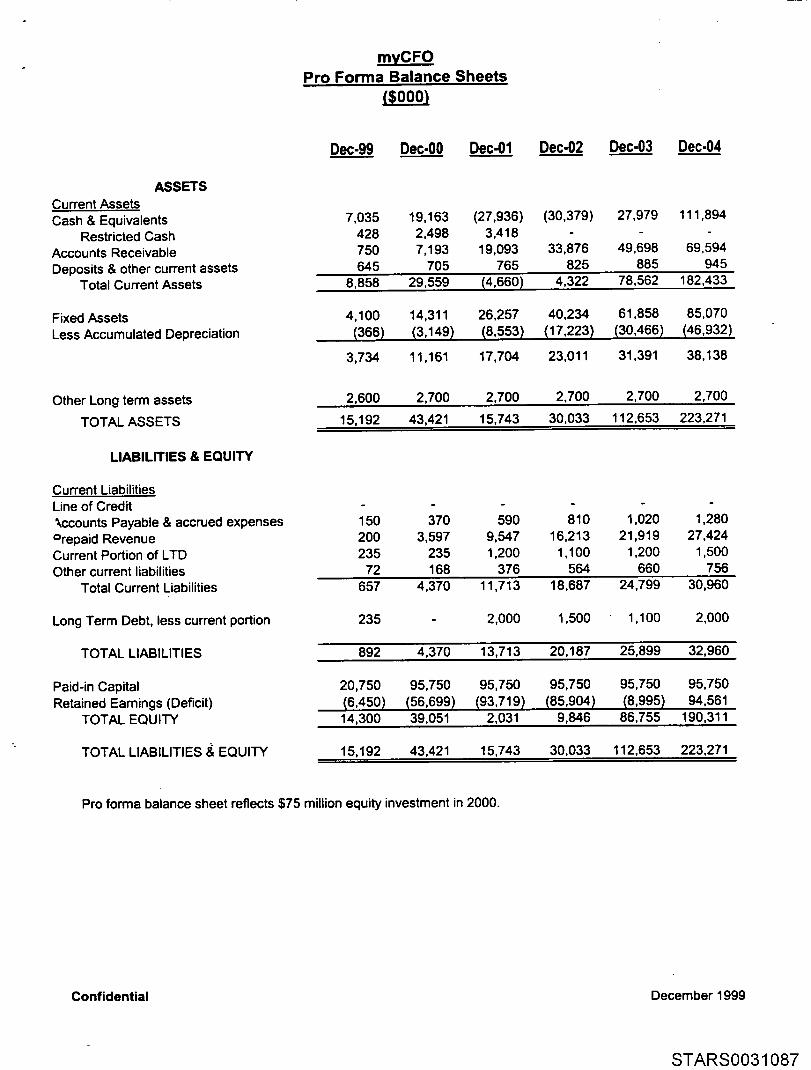
Pro forma balance sheet reflects $75 million equity investment in 2000.
Confidential December 1999
STARS0031087
"Typical ’ Office
Profit Contribution at Maturity
STARSO031088

REVENUETraditional Service RevenueSpecialty Revenue from Specialty Director ClientsSpecialty revenue I CSD clients unsharedSpecialty revenue I CS clients I Shared
EXPENSESDirect Compensation: General Salary
Director 300,000Sr. Manager 150,000Manager 100,000Senior 75,000Staff I Para 50,000Admin 40,000
Incentive compensationTraditional ServicesSpecialty ServicesInvestment Services, current clients
TEAM DIRECT COMPENSATION
Office staffNew client coordinatorOffice ManagerReceptionist
Managing CSD DirectorTotal
2,500,000
1.500,0004~000,000
# Staff1 375,0002 300.0002 200,0002 150,0001 50,0001 4O,000
9.0 1,115,000 28%
10% 250,0005% 75,0005% 16,667
341,667 9%
1,456,667 36.4% i~
TOTAL DIRECT COMPENSATION 1,456,667
Employee taxes and benefitsPayroll Taxes 7.5% of comp 109,250Insurance 3,000 per yr per staff 27,000Training 10,000 ($5k non-profsnl) 85,000
Rent $5x 12x250’ per person
Recruiting fees Treat as one time start-up expense
Other direct costs 15.0% ofcompAccounting Services 10.0% ofrevenuePFS Overhead (COO, division finance & admin, etc.)
221,250
135,000
218,500400,00025,000
Total Direct Expenses 2r456r417
Confidential
Contribution I r543r583
¯ ,’OTypical Office Contribution
61%
39%
CS Director 5Tota__~l
2,500,000
1,500,0004,000,000
# Staff1 300,0002 300,0002 200,0002 150,0001 50,0001 40~00
9.0 1.040,000
10% 250,0005% 75,0005% 16,667
341,667
26%
9%
1,381,667 34.5%
1,381,667
103,62527,00085,000
215,625
135,000
207,250400,00025,000
2,364r542
I r635~458
59%
41%
Specialty DirectorTotal
3,000,000
9,000,0003,000~000
# Staff2 600,0001 150,0001 100,0001 75,000
0.5 25,0001 40,000
6.5 990,000 33%
10% 300,0005% 450,000
750,000 25%
1,740,000 58.0%
1,740,000
130,50019,50060,000
210,000
97,500
261,000300,00025,000
2,633,500
368r500
’!88% il
12% ~,~!
TOTAL OFFICETotal
15,000,0003,000,O00
9,000,000 9,000,00027,000,000
# Staff8 2,400,000
13 1,950,00013 1,300.00013 975,0007 325,0007 280,000
Teams7
60.5 7,230,000 27%
1,800,000900,000100,000
2,800,000 10%
10,030,000 37.1%
1 50,0001 50,0001 40,000
140,000
10,170,000 37.7%
762,750190,500585,000
2.8%0.7%2.2%
1,538,250 5.7%
952,500 3.5%
1,525,500 5.7%’,̄ j
2.700.000 1o.oo/o!;::175.000 0.6%~ " "
;: ...
17,061,250 63%
9r938,750 37%
December 1999
STARS0031089

Annual ProJectionsIncome StatementsOperating Cash FlowBalance Sheets
STARS0031090

.~evenueGeneral Director ServicesSpecialty Director ServicesOnline Services
Total Revenue% Increase
Less Direct & Indirect CostsContribution from Business Units
% of Revenue
myCFOPro Forma Income Statements
199....__99 2000 200’1 2002 200:3 2004
$ 32,690 $ 132,974 $ 276,704 $ 410,576 $ 538,432
6,744 21,832 38,774 49,372 58,83718,150 90,750 254.100
1,700 39,434 154,806 333,628 550,698 851,369+2220% +293% +116% +65% +55%
2.100 63,625 152,812 246,713 354,961 500,151
(400) (24,191) 1,994 86,915 195,737 351,218-24% ~1% 1% 26% 36% 41%
Overhead:R&D / Engineering
Marketing
% of Revenue
% of Revenue
General & Administrative% of Revenue
Total Overhead Expenses
Operating Income (loss)% of Revenue
2,744 15,204 22,174 46,112 61,128 94,503161% 39% 14% 14% 11% 11%
565 1,956 2,980 13,922 22,980 35,52733% 5% 2% 4% 4% 4%
1,370 8,898 13,861 19,066 34,720 53,67781% 23% 9% 6% 6% 6%
4,679 26,058 39,015 79,100 118,828 183,707
(5,079) (50,249) (37,021) 7,815 76,909 167,512-299% -127% -24% 2% 14% 20%
Pretax Income (loss)Income Tax ProvisionNet Income (loss)
% of Re~n~
(5,079) (50,249) (37,021) 7,815 76,909 167,512- - (63,955)
(5,079) (50,249) (37,021) 7,815 76,909 103,557-299% -127% -24% 2% 14% 12%
CAPITAL EXPENDITURES: 4,100 10,211 11,946 13,977 21,623 23,213 I
HEAD COUNT at Year-end 101 736 1,332 1,899 2,489 3,096
ConfidentialDecember 1999
STARSO031091

Operating Cash Flow SummaryPro Forma ($000)
RevenueNet Income (Loss)Depreciation
(Increase) in noncash Working Capital
199.~.99 2000 200’1 ..200.__.22 2003 2004 200_..55 200._..66 200_!7 2008 2009 Terminal
(5.079) (50,249) (37,021) 7,815 76,909 103.557 125,634 157,043 196,304 245,380 306,725 $ 6.134,500~66 2,783 5,404 8,500 12,699 16,466 20,583 25,729 32,161 40,201 50,251 $ 1,005,020
(1,166) (4,861) (5,537) (4,450) (9,771) (13,795) (17,244) (21,555) (26,944) (33,680) (42,100) $ 181,103
Net Operating Cash flow (5,879) 152,326) (37,154) 11,865 79,837 1061228 1281973
1611217’ 201,521251,901" 314,876 71320r623
INet present value of cash flow @ 20% $ 1,027,307 I
The above summary shows projected Cash Flow from Operations.Capital expenditures and operating deficits are assumed to be funded with capital infusion.
ConfldenUalDecember 1999
STARS0031092

myCFOPro Forma Balance Sheets
Dec-99 Dec-00 Dec-01 Dec-02 Dec-03 Dec-04
ASSETSCurrent AssetsCash & Equivalents
Restricted CashAccounts ReceivableDeposits & other current assets
Total Current Assets
Fixed AssetsLess Accumulated Depreciation
7,035 19,163 (27,936) (30,379) 27,979 111,894428 2,498 3,418750 7,193 19,093 33,876 49,698 69,594645 705 765 825 885 945
8,858 29,559 /4,6601 4,322 78,562 182,433
4,100 14,311 26,257 40,234 61,858 85,070
(366) (3,149) (8,553) (17,223) (30,466) (46,932)
3,734 11,161 17,704 23,011 31,391 38,138
Other Long term assets
TOTAL ASSETS
LIABILITIES & EQUITY
Current LiabilitiesLine of Credit~.ccounts Payable & accrued expenses"~repaid Revenue..;urrent Portion of LTDOther current liabilities
Total Current Liabilities
Long Term Debt, less current portion
TOTAL LIABILITIES
Paid-in CapitalRetained Earnings (Deficit)
TOTAL EQUITY
TOTAL LIABILITIES ~ EQUITY
2,600 2,700 2,700 2,700 2,700 2,700
15,192 43,421 15,743 30,033 112,653 223,271
150 370 590 810 1,020 1,280200 3,597 9,547 16,213 21,919 27,424235 235 1,200 1,100 1,200 1,50072 168 376 564 660 756
657 4,370 11,713 18,687 24,799 30,960
235 - 2,000 1,500 1,100 2,000
892 4,370 13,713 20,187 25,899 32,960
20,750 95,750. 95,750 95,750 95,750 95,750(6,450) (56.699) (93,719) (85,904) (8,995) 94.56114,300 39,051 2,031 9,846 86,755 190,311
15,192 43.421 15,743 30,033 112,653 223.271
Pro forma balance sheet reflects $75 million equity investment in 2000.
Confidential December 1999
STARS0031093

Annual ProJectionsIncome StatementsOperating Cash FlowBalance Sheets
STARS0031094

RevenueGeneral Director ServicesSpecialty Director ServicesOnline Services
Total Revenue% Increase
Less Direct & Indirect CostsContribution from Business Units
% of Revenue
myCFOPro Forma Income Statements
1999 200_.__00 2001 200.__22 200:3 20O4
$ 32,690 $ 132,974 $ 276,704 $ 410,576 $ 538,4326,744 21,832 38,774 49,372 58.837
- 18,150 90,750 254,100
1,700 39,434 154,806 333,628 550,698 851,369+2220% +293% +116% +65% +55%
2,100 63,625 152,812 246,713 354,961 500,151
(400) (24,191) 1,994 86,915 195,737 351,218-24% -61% 1% 26% 36% 41%
Overhead:R&D / Engineering 2,744 15,204 22,174 46,112 61,128 94,503
% of Revenue 161% 39% 14% 14% 11% 11%
Marketing 565 1,956 2,980 13,922 22,980 35,527% of Revenue 33% 5% 2% 4% 4% 4%
General & Administrative 1,370 8,898 13,861 19,066 34,720 53,677% of Revenue 81% 23% 9% 6% 6% 6%
Total Overhead Expenses 4,679 26,058 39,015 79,1 O0 118,828 183,707
Operating Income (loss)% of Revenue
(5,079) (50,249) (37,021) 7,815 76,909 167,512-299% -127% -24% 2% 14% 20%
Pretax Income (loss)Income Tax ProvisionNet Income (loss)
% of Revenue
(5,079) (50,249) (37,021) 7,815 76,909 167,512- - - (63,955)
(5,079) (50,249) (37,021) 7,815 76,909 103,557-299% -127% -24% 2% 14% 12%
ICAPITALEXPENDITURES: 4,100 10,211 11,946 13,977 21,623 23,213 ]
I HEAD COUNT at Year-end 101 736 1,332 1,899 2,489 3,096I
ConfidenUalDecember 1999
STARSO031095

mvCFOOperating Cash Flow Summary
Pro Forma (~;000)
RevenueNet Income (Loss)Depreciation
(Increase) in noncash Working Capital
1999 2000 2001 2002 2003 200._._44 2005 2006 200--7 200..._88 200_._.99 Terminal
(5,079) (50,249) (37,021) 7,815 76,909 103,557 125,634 157,043 196,304 245,380 306,725 $ 6,134,500366 2,783 5,404 8,500 12,699 16,466 20,583 25,729 32,161 40,201 50,251 $ 1,005,020
(1,166) (4,861) (5,537) (4,450) (9,771) (13,795) (17,244) (21,555) (26,944) (33,680) (42,100) $ 181,103
Net Operating Cash flow (5,879) (52,326) (37,154) 11,865 79w837 106r228
INet present value of cash flow @ 20% $1,027,307
128,973
I
161r217 201,521 251r901 314v876 7r3201623
The above summery shows projected Cash Flow from Operations.Capital expenditures and operating deficits are assumed to be funded with capital infusion.
ConfldenUalDecember 1999
STARS0031096

myCFOPro Forma Balance Sheets
Dec-99 Dec-00 Dec-01 Dec-02 Dec-03 Dec.04
ASSETSCurrent AssetsCash & Equivalents
Restricted CashAccounts ReceivableDeposits & other current assets
Total Current Assets
Fixed AssetsLess Accumulated Depreciation
7,035 19,163 (27,936) (30,379) 27,979 111,894428 2,498 3,418 - -750 7,193 19,093 33,876 49,698 69,594645 705 765 825 885 945
8,858 29,559 14,660) 4,322 78,562 182,433
4,100 14,311 26,257 40,234 61,858 85,070(366) (3,149) (8,553) (17,223) (30,466) (46,932)
3,734 11,161 17,704 23,011 31,391 38,138
OtherLongterm assets
TOTAL ASSETS
LIABILITIES & EQUITY
Current LiabilitiesLine of CreditAccounts Payable & accrued expensesPrepaid RevenueCurrent Portion of LTDOther current liabilities
Total Current Liabilities
Long Term Debt, less current portion
TOTAL LIABILITIES
Paid-in CapitalRetained Earnings (Deficit)
TOTAL EQUITY
TOTAL LIABILITIES 8, EQUITY
2,600 2,700 2,700 2,700 2,700 2,700
15,192 43,421 15,743 30,033 112,653 223,271
150 370 590 810 1,020 1,280200 3,597 9,547 16,213 21,919 27,424235 235 1,200 1,100 1,200 1,50072 168 376 564 660 756
657 4,370 11,713 18,687 24,799 30,960
235 2,000 1,500 1,100 2,000
892 4,370 13,713 20,187 25,899 32,960
20,750 95.750 95,750 95,760 95,750 95,75016,4501 (56,6991 (93,7191 (85,9041 (8,9951 94,56114,300 39,051 2,031 9,846 86,755 190,311
15,192 43,421 15,743 30,033 112,653 223,271
Pro forma balance sheet reflects $75 million equity investment in 2000.
Confidential December 1999
STARS0031097

DirectorsBy Office and Type
STARS0031098

SO and CSO rofl-in by location and ctassS"¢alion (i.e. SO, CSD)SO = number of teams (w(th eac~ team having two d~ectors)
mvCFOProfessional S#rvlces
Number of Dlrector~ by Office and TVDe
Pro F~rma 2000-2004
Fairfield/ Philan- J Olhm N~99E.~;esMV SF LA 0(3 Seatue Allanta Boston Dallas Austin Westchstr DCNa I:~ INV INS E&T thto~ NY Chicago Houston SoFia A B C 0 E
111/00 4 1 2 12/I/00 4 I 4 I I3/2/00 5 3 4 3 1411/00 r. 3 5 3 1 I 15/1/00 5 3 5 5 3 I 16/1/00 6 4 6 5 3 2 2711100 (; 4 6 7 3 2 2
6/I/00 h 4 7 7 4 3 30/1/00 8 6 7 7 4 :~ ".1
16/1/00 n 5 7 7 4 4 41111/00 9 5 7 7 4 4 412/I/00 9 5 7 7 4 4 4
111/01 0 5 7 7 4 4 4211/01 9 5 7 7 4 4 43/1/01 n 5 7 7 4 4 4
3 I3 2 1 13 2 1 1
1 I 1 I 3 2 1 11 I I 1 3 2 I 21 I 2 1 3 3 1 22 2 2 2 3 3 2 22 ./- 3 2 3 3 2 23 3 3 3 3 3 2 23 ’4 4 3 3 3 2 23 .4 4 3 3 3 2 24 4 4 4 3 3 2 24 4 4 4 4 3 2 24 .~ 4 5 4 3 2 24 4 ..1 5 4 3 2 2
411/01 n 5 T 7 4 4 4 4 4 45/1/01 10 6 8 6 4 5 8 5 5 56/I/01 tl) () 0 0 4 F, 5 5 5 5711/01 IH ~; 0 8 4 5 5 5 5 5
6/I/01 12 G 0 0 4 5 5 5 F. 59/1/01 12 6 0 0 4 r, 5 5 5, 5
1011/01 12 7 10 c~ 5 5 5 5 5 51111/01 12 7 tO c,~ 5 F, 5 5 F, 5
1211/01 12 7 tO ~ 5 £. 5 5 5 5111/02 12 7 10 c.t 5 ~’, 5 5 5 52/1/02 12 7 10 r~ 5 ~’. 5 5 5 53/I/02 IP 7 10 c.~ 5 5 5 5 ~, 5411/02 1_’ 7 tO 9 5 5 5 5 5 5
5/I/02 12 6 11 9 5 5 5 5 c, 56/I/02 12 H t I ’[~ 5 ~’. 5 5 5 5711/02 17. R 11 !~ 5 5 5 5 5 58/1/02 1.) 8 11 ’., 5 5 5 5 5 5
0/I/02 1 .>- 8 11 r~ 5 r. 5 5 t~ 51011/02 1:’~ g 11 .’:~ G I, 1; 6 I: (;1111/02 1:’t 9 11 r.~ G I; 6 {J i; fi1211/02 13 9 11 10 G I, G G i; h
111/03 14 !1 11 It) 6 I; 6 6 t; t’;
2/1/03 14 0 11 I(5 G h G G t; (;
3/1/03 14 9 11 I(I {~ I, 6 5 f; l;411/03 14 9 11 10 G I, 6 6 (;
5/I/03 15 9 11 t 1 G i’; 6 6 I; ,;
6/I/03 15 g 11 II (j I, 6 6 l; t]711/03 15 9 t 1 I 1 t; ~, 6 6 t.; G6/1/03 15 !I 11 tl 6 *.~ 6 6 1; 4;0/I/03 15 9 11 I1 G I, 6 6 t; t]
1011/03 It’. ’:’, 11 I 1 t.~ I, 6 6 (; t~
1111/03 15 !~ 11 11 G I’; 6 G t’; t~
1211/03 15 10 12 12 7 ; 7 7 7 7111/04 15 10 12 I~ 7 7 7 7 7 7
2/1~’04 15 10 12 I:! 7 7 7 7 7 73/1/04 1/: 11) 12 t2 7 7 7 7 7 7411/04 15 10 72 12 7 7 7 7 7 7
5/1/04 15 10 12 12 7 7 7 7 7 78/I/04 15 11) 12 I-~ 7 7 7 7 7 7711/04 15 10 12 I-~ 7 7 7 7 7 7
5 4 3 2 26 4 3 2 2 2 2 26 4 3 2 2 2 2 20 4 3 2 2 4 4 36 4 4 3 2 4 4 36 4 4 3 2 6 5 46 4 4 3 2 6 G 5 4
6 4 4 3 2 8 6 6 46 4 4 3 2 9 6 5 46 4 4 3 2 ~ G 6 46 4 4 3 2 !J G 5 46 4 4 3 2 ~ 6 5 46 4 4 3 2 3 9 6 5 4
6 4 4 3 2 3 10 7 5 46 4 4 3 2 3 ~0 7 5 46 4 4 3 2 3 12 7 6 66 4 4 3 2 3 ~2 7 6 56 4 4 3 2 3 12 8 7 86 4 4 3 2 3 12 8 7 G
6 4 4 3 2 3 12 6 7 G8 5 8 3 3 3 14 6 8 66 5 5 3 3 3 ~4 8 0 6 1
6 5 5 3 3 3 t 4 8 8 I,~ Z6 5 5 3 3 3 14 B 6 6 36 5 5 3 3 3 74 0 II G 4 1
6 5 5 3 3 3 ~ 4 8 0 G .5 26 5 6 3 3 3 14 8 6 G 6 3
6 6 6 3 3 3 14 8 I] 4; 7 4 I
6 6 6 3 3 3 ~4 8 8 t; 7 5 26 6 6 3 3 3 ~4 8 8 ~ 7 6 :~
6 0 6 3 3 3 14 6 I1 I.~ 7 7 4 1
6 6 6 3 3 3 ~4 B 8 ,; 7 7 n 26 7 7 3 3 3 15 9 9 6 7 7 t.; 36 7 7 3 3 3 ~.r) !) ~,# 7 7 7 4 1
6 7 7 3 3 3 I,-) 9 .q 7 7 7 5 2
6 7 7 3 3 3 15 9 [~ 7 7 7 6 36 7 7 3 3 3 ~5 g ’.* 7 7 7 7 4
li 7 7 3 3 3 15 g ~.~ 7 7 7 7 5
6 7 7 3 3 3 15 .~) r# 7 7 7 7 t}
6 7 7 3 3 3 15 9 ~ 7 7 7 7 7
6/I/O4 1~’. 10 12 12 7 7 7 7 7 7 6 7 7 3 3 3 15 9 ~ 7 7 7 7 7 5;
0/1/04 15 10 12 12 7 7 7 7 7 7 6 7 7 3 3 3 15 9 ~.~ 7 7 7 7 7 i’,:
TotalDirectors GDs SDs GDs SDs lADs
12 8 418 II 724 16 831 23 636 27 g
43 33 1049 38 1154 43 1160 48 1164 53 1164 53 1168 56 12:69 5~ 1370 57 1370 57 1370 57 1388 75 1388 75 1396 82 13100 84 16106 00 16111 95 16113 97 16114 98 18114 08 10114 98 16114 08 16114 08 16118 102 16116 102 16122 106 16122 100 16125 109 16133 117 16
133 117 16140 121 16142 123 19143 124 19144 125 19148 127 1g150 131 I~153 133 2C157 136 21159 138 21161 140 21164 143 21166 145 21182 159 23185 162 23187 164 23189 160 23182 169 23194 171 23196 173 23198 175 23199 176 23200 177 23
R]?’;:=00 ._~ rr~.’~l
8 311 516 623 627 733 738 843 840 8
53 853 850 956 1057 1057 10 3t
57 10 375 10 375 1082 1084 1200 1295 1297 1208 1208 1208 1208 1208 12102 12102 12106 12108 12109 12117 12117 12121 14123 14124 14125 14127 14131 14133 14136 15138 15140 15143 15145 15159 16162 16164 16166 16169 16171 16
Hgad Count OffiEll
l I ~:,,’nl d IJTeamslOfr, ce Staff ITo~a I
41 12 3 56 465 15 3 83 594 15 3 112 5126 33 3 162 11162 33 3 198 11193 33 3 229 I1232 33 4 268 11266 33 4 302 11208 33 4 335 11328 33 4 385 11349 33 4 380 11353 33 4 300 11374 33 5 412 11388 33 5 426 11406 33 5 444 11422 33 5 460 11459 45 5 509 15
3 552 45 6 682 153 578 45 S 628 154 831 45 5 681 154 672 45 5 722 154 720 45 6 770 154 756 45 5 806 154 766 45 5 816 154 781 45 6 832 154 785 45 6 836 154 792 45 6 843 164 797 45 6 848 154 807 45 6 858 154 880 45 6 031 164 80O 45 6 941 154 932 45 6 993 154 950 45 6 1001 154 993 45 6 1044 154 1045 45 0 109(3 155 1057 45 0 1108 155 1093 48 7 1148 16§ 1104 48 7 1159 165 1110 48 7 1165 185 1116 61 7 1174 175 1129 51 7 1187 17E 1175 51 7 1233 17E 1191 54 7 1252 166 1227 54 7 1288 190’ 1241 54 7 1302 186 1267 57 7 1331 196 1309 57 7 1373 197 1336 57 7 1400 197 1424 60 8 1492 207 1444 60 8 1512 207 1458 60 6 1526 207 1473 63 8 1544 217 1493 63 8 1564 21
173 16 7 1518 63 8 1589 21B16 71 1537 63 6 1600 21175 l176 16 71 1.~0 63 8 1631 21
.7 16 71 1570 63 6 1641 21¯ "l~’~’le~l~mt 7.~e~.: .....
~!e~ 271887
,;tn :’.:10,.~-,’.t1". ’1(10t ":’~83’ 9 t072 2t
Confldent~l
STARS0031099

"Typical" Office
Profit Contribution at Maturity
STARS0031100

REVENUETraditional Service RevenueSpecialty Revenue from Specialty Director ClientsSpecialty revenue I CSD clients unsharedSpecialty revenue / CS clients / Shared
EXPENSESDirect Compensation: General Salary
Director 300,000Sr. Manager 150,000Manager 100,000Senior 75,000Staff I Para 50,000Admin 40,000
Incentive compensationTraditional ServicesSpecialty ServicesInvestment Services, current clients
TEAM DIRECT COMPENSATION
Office staffNew client coordinatorOffice ManagerReceptionist
Managing CSD DirectorTota.~l
2,500,000
1,500,0004w000~000
# Staff1 375,0002 300,0002 200,0002 150,0001 50,0001 4O,0O0
9.0 1,115,000 28%
10% 250,0005% 75,0005% 16,667
341,667
1,456,667
TOTAL DIRECT COMPENSATION 1,456,667
Employee taxes and benefitsPayroll Taxes 7.5% of comp 109,250Insurance 3,000 per yr per staff 27,000Training 10,000 ($5k non-profsnl) 85,000
Rent $5x 12x250’ per person
Recruiting fees Treat as one time start-up expense
Other direct costs 15.0% ofcompAccounting Services 10.0% ofrevenuePFS Overhead (CO0, division finance & admin, etc.)
221,250
135,000
218,500400,00025,000
Total Direct Expenses 2,456r417
Confidential
Contribution 1,543f583
._~ ,’0Typical Office Contribution
9%
36.4%
61%
39%
CS Director 5Total
2,500,000
1,500,0004,000,000
# Staff1 300,0002 300,0002 200,0002 150,0001 50,0001 40~00
9.0 1,040.000
10% 250,0005% 75,0005% 16,667
341,667
1,381,667
1,381,667
103,62527,00085,000
215,625
135,000
207,250400,00025,000
2,364,542
1 fl35,458
26%
9%
34.5%
59%
41%
Specialty DirectorTotal
3,000,000
9,000,0003,000,000
# Staff2 600,0001 150,0001 100,0001 75,000
0.5 25,0001 40,000
6.5 990,000 33%
10% 300,0005% 450,000
750,000 25%
1,740,000 58.0%
1,740,000
130,50019,50060,000
210,000
97,500
261,000300,00025,000
2,633,500
366,500
TOTAL OFFICETotal
15,000,0003,000,000
9,000,000 9,000,00027r00Of100
# Staff8 2,400,000
13 1,950,00013 1,300,00013 975,000
7 325,0007 280,000
Teams7
60.5 7,230,000 27%
1,800,000900,000100,000
2,800,000 10%
10,030,000 37.1%
1 50,0001 50,0001 40,000
140,00010,170,000 37.7%
762,750190,500585,000
2.8%0.7%2.2%
1,538,250 5.7%
952,500 3.5%
1,525,500 5.7% ’," "L: ;
2,700,000 10.0% i:.’175,000 0.6% i"
17,061,250 63%
9,938,750 37%
December 1999
STARS0031101

Assumptions
PFS Teams,Revenue and Staffing
STARS0031102
myCFO
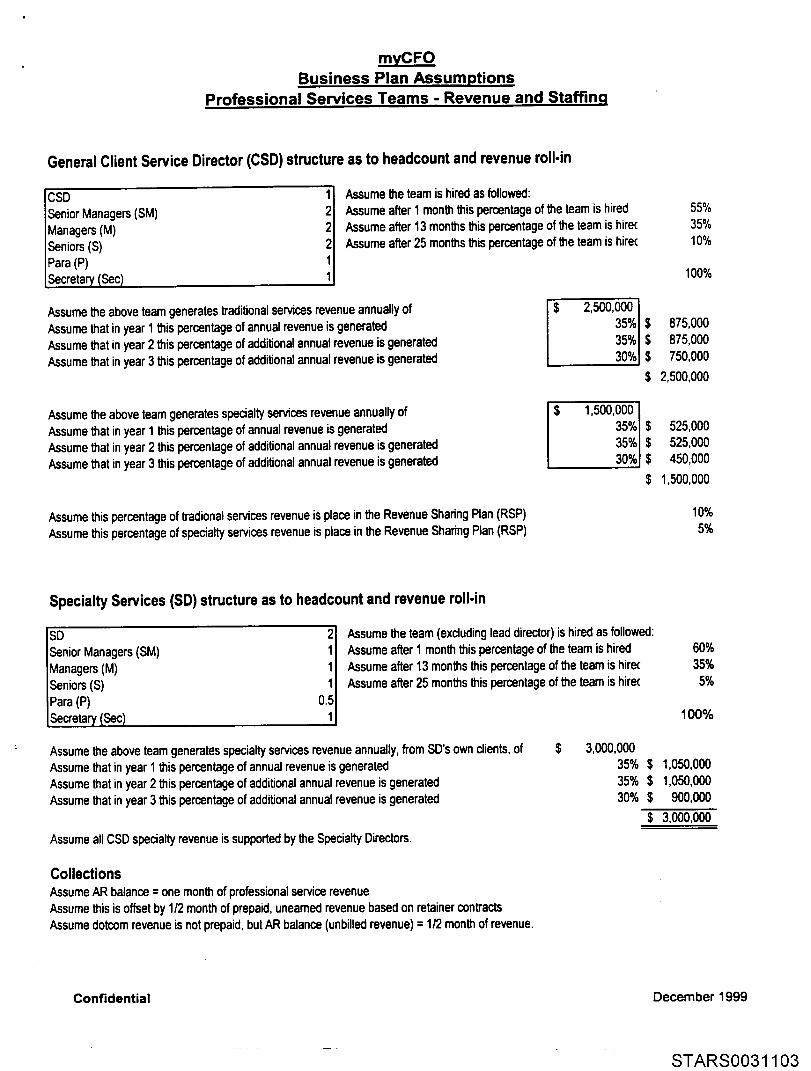
Business Plan AssumptionsProfessional Services Teams - Revenue and Staffinq
General Client Service Director (CSD) structure as to headcount and revenue roll-in
CSDSenior Managers (SM)Managers (M)Seniors (S)Para (P)~ecretan/(Sec)
Assume the team is hired as followed:Assume after 1 month this percentage of the team is hiredAssume after 13 months this percentage of the team is hire(Assume after 25 months this percentage of the team is hire(
Assume the above team generates traditional services revenue annually ofAssume that in year 1 this percentage of annual revenue is generatedAssume that in year 2 this percentage of additional annual revenue is generatedAssume that in year 3 this percentage of additional annual revenue is generated
2,500,000 ]35%I $35%I $30%I $
$
Assume the above team generates specialty services revenue annually ofAssume that in year 1 this percentage of annual revenue is generatedAssume that in year 2 this percentage of additional annual revenue is generatedAssume that in year 3 this percentage of additional annual revenue is generated
1,500,000 ]35%I $35%I S3o%I $
Assume this percentage of b’adional services revenue is place in the Revenue Sharing Plan (RSP)Assume this percentage of specialty services revenue is place in the Revenue Sharing Plan (RSP)
55%35%10%
100%
875,000875,000750,000
2,500,000
525,000525,000450,000
1,500,000
10%5%
Specialty Services (SD) structure as to headcount and revenue roll-in
SD 2Senior Managers (SM) 1Managers (M) 1Seniors (S) 1Para (P) 05Secretary (Sec) 1
Assume the team (excluding lead director) is hired as followed:Assume after 1 month this percentage of the team is hiredAssume after 13 months this percentage of the team is hire(Assume after 25 months this percentage of the team is hire(
60%35%5%
100%
Assume the above team generates specialty services revenue annually, from SD’s own clients, ofAssume that in year 1 this percentage of annual revenue is generatedAssume that in year 2 this percentage of additional annual revenue is generatedAssume that in year 3 this percentage of additional annual revenue is generated
Assume all CSD specialty revenue is supported by the Specialty Directors
3,000,00035%$35%$30%$
$
1,050,0001,050,000900,000
3,000,000
CollectionsAssume AR balance = one month of professional service revenueAssume this is offset by 1/2 month of prepaid, unearned revenue based on retainer contactsAssume dotcom revenue is not prepaid, but AR balance (unbilled revenue) = 1/2 month of revenue
Confidential December 1999
STARS0031 103

Client Serwce Director
Revenue Ramp-up
STARS0031104

myCFO Professional ServicesClient Service Director Revenue
Rampup from Date of Hire
Client Service Director Revenue Rampup
Traditional RevenueAnnual rev. at maturity $ 2,500.000 Total Monthly
Rev. Increase per Year Rev/YearYear1 35% $ 875,000 $ 875,000 $ 72,917Year2 35% $ 875,000 $ 1,750,000 $ 145,833Year3 30% $ 750,000 $ 2,500,000 $ 208,333
Specialty Products$ 1,500,000 Total Monthly
Rev. Increase per Year Re/Hear Averaqe
35% $ 525,000 $ 525,000 $ 43,75035% $ 525,000 $ 1,050,000$ 87,50030% $ 450.000 $ 1,500.000$125,000
Month12
(0.5) 3 36,458(0.4) 4 43,750(0.3) 5 51,042(0.2) 6 58,333(0.1) 7 65,625
6 72,9179 72,917
0,1 10 80,208O.2 11 87,500O.3 12 94,7920.4 13 102,0830.5 14 109,375(0.3) 15 123,958(0.3) 16 123,958(0.2) 17 131.250(0.2) 18 131,250(0.1) 19 138,542(0.1) 20 138,542
21 145,8330.1 22 153,1250.1 23 153,1250.2 24 160,4170.3 25 167,7080.5 26 182,292(0.7) 27 208,333(0.6) 28 208,333(0.5) 29 208,333(0.4) 30 208,333(0.3) 31 208,333(0.2) 32 208,333(0.1) 33 208,333
34 208,3330.3 35 208,3330.6 36 208,3330.9 37 208,3331.o 38 208,333
39 208,33340 208,33341 208,33342 208,33343 208,33344 208,333
TradlUonal Specialty TotalRevenue Revenue Revenue
21,87526.25030.62535,00039,37543,75043,75048,12552,50056,87561,25065,62574,37574,37578,75078,75083,12583,12587,50091,87591,87596,250
100,625109,375125,000125,000125,000125,000125 O00125,000125000125 000125 DO0125 000125 000125 DO0125 000125 000125 D00125 000125 O00125 000
58,33370,0O081,66793,333
105,000116,667116,667128,333140,000151,667163,333175,000 1,400,000198,333198,333210,000210,000221,667221,667233,333245,000245,000256,667268,333291,667 2,800,000333,333333,333333,333333,333333,333333,333333,333333;333333,333333,333333,333333,333 4,000,000333,333333,333333,333333,333333,333333,333
¯ -e-- TOTAL RevenueSpeaatty Revenue
¯ -.B- Traditional Revenue
TotalRevHear
$ 1.400,000$ 2.800,000$ 4,000,000
~7 40 43
Confidential December 1999
STARS0031105

Specialty Director
Revenue Ramp-upFrom Specialty Director Only Clients
STARS0031 i O6

Specialty Director Revenue Rampup
myCFO Professional ServicesSpecialty Director RevenueRampup from Date of Him
Annual rev. at maturity
Year 1Year 2Year 3
SD’s Client Base$ 3,000,000 Total Monthly
Rev. increase per Year Rev/Year A~ra~e
35% $ 1,050,000 $ 1,000,000$ 87,50035% $ 1,050,000 $ 2,100,000$ 175,00030% $ 900,000 $ 3,000.000 $ 250.000
TotalRev/Year
$ 1,050.000$ 2.100,000$ 3,000,000
Month12
(0.5) 3(0.4) 4(0.3) 5(012) 6(0.1) 7
89
0.1 100.2 110,3 120.4 130.5 14(0.3) 15(0.3) 16(0.2) 17(0.2) 18(0.1) 19(o.1) 20
210.1 220.1 230.2 240.3 250.5 26(0.7) 27(0.6) 28(0.5) 29(0.4) 30(0.3) 31(0.2) 32(0.1) 33
34
0.3 350.6 36
0.9 371.0 38
394041424344
SD Client Shared, TotalRevenue Incremental Revenue
43,75052,50061,25070,00078,75087,50087,50096,250
105,000113,750122,500131,250148,750148,750157,500157,500166,250166,250175,000163,750183,750192,500201,250218,750250,000250,000250,000250,000250,000250,000250,000250,000250,000250,000250,000250,000250,000250,000250,000250,000250,000250,000
43,75052,50061,25070,00078,75087,50087,50096,250
105,000113,750122,500131,250148,750148,750157,500157,500166,250166,250175,000183,750163,750192,500201,250218,750250,000250,000250,000250,000250,000250,000250,000250,000250,000250,000250.000250,000250.000250.000250,000250,000250,000250,000
1.050,000
2,100,000
3,000,000
300,000
2,50.000
200,000
£¢=oL~O.OOOb
100.000
50.000
-̄,e-- TOTAL Revenue
7 10 13 ~ SD Client RevenueShared Revenue - Incremental
Confidential December 1999
STARS0031107

Director Team
Headcount & Salary Ramp-up
STARS0031108

myCFO Professional ServicesTeam Headcount and Compensation Cost by Month
Rampup from Date of Director Hire
IGeneral Director Teams
I$ 74O.0OO --
I Team Salary per YearYear 1 I 55% $ 407,000
Year 2 1 35% $ 259.000Year 3 1 10% $ 74,000
Totg MontlllySaWear Ave~e
$ 407,000 $ 33.917
$ 666.000 $ 55.500$ 740,000 $ 61,667
Specialty Director Teams
I$ 690,000 -- Total Mon~ly
Salary increase per Yr SaWear Averse I
60% $ 414,000 $ 414,000 $ 34,500I35% $ 241,500 $ 655,500 S 54,625I5% $ 34,500 $ 690.000 $ 57,500]
m Team sa~-ies above include aJl team members except lead d~ector for each tearn
TEAM SALARIES As % of revenue TEAM HEADCOUNTSD (SO-onl~
Month CSD SD CSO
1 25.000 25,000 #DIV/O!
2 58,917 59,500 #DIV/0!
3 58.917 59,500 101%
4 58.917 59.500 84%
5 58.917 59,500 72%
6 58,917 59,500 63%
7 58,917 59,500 56%
8 58,917 59.500 51%
9 58.917 59.500 51%
10 58,917 59.500 46%
11 58,917 59.500 42%
12 58,917 59,500 39%
13 58,917 59,500 35%
14 80,500 79,625 46%
15 80.500 79,625 41%
16 80.500 79,625 41%
17 80,500 79,625 38%18 80,500 79,625 38%
19 80,500 79,625 36%20 80,500 79,625 36%21 80,500 79,625 35%22 80,500 79,625 33%23 80,500 79,625 33%24 80.500 79,625 31%25 80,500 79,625 30%
26 86.667 82,500 30%27 86.667 82.500 26%
28 86,667 82,500 26%
29 86,667 82.500 26%
30 86.667 82.500 26%
31 86.667 82.500 26%
32 86,667 82,500 26%
33 86,667 82,500 26%34 86,667 82.500 26%35 86,667 82,500 26%36 86,667 82,500 26%37 86.667 82,500 26%38 86.667 82.500 26%39 86,667 82.500 26%40 86.667 82,500 26%41 86.667 82.500 26%42 86.667 82.500 26%
roy)
#DIV/0! 1#DIV/0! 5136% 5113% 5
97% 5
85% 576% 568% 568% 562% 557% 552% 549% 561% 854% 854% 851% 851% 848% 848% 846% 843% 843%41%4O%
38%33%33%33%33%33%33%
33%33%33%33%33%33%33%33%33%33%
CSD Teams SO Teams
144444444444
4666666666
8 68 68 6
9 7
9 7
9 7
9 7
9 79 79 79 79 7
9 7
9 7
9 7
9 7
9 79 79 79 7
Confidential December 1999
STARS0031109

"Typical" Office
Profit Contribution at Maturity
STARS0031110

Managing CSD DirectorTotal
.REVENUETraditional Service Revenue 2,500,000Specialty Revenue from Specially Director ClientsSpecialty revenue / CSD clients unsharedSpecialty revenue / CS clients I Shared 1,500,000
4rO00,O00EXPENSESDirect Compensation: General Salary # Staff
Director 300,000 1 375,000Sr. Manager 150,000 2 300,000Manager 100,000 2 200,000Senior 75,000 2 150,000Staff / Para 50,000 1 50,000Admin 40,000 1 40.000
Incentive compensationTraditional ServicesSpecialty ServicesInvestment Services, current clients
TEAM DIRECT COMPENSATION
Office staffNew client coordinatorOffice ManagerReceptionist
9.0 1,115,000 28%
10% 250,0005% 75,0005% 16,667
341,667 9%
1,456,667 36.4%
TOTAL DIRECT COMPENSATION 1,456,667
Employee taxes and benefitsPayroll Taxes 7.5% of comp 109,250Insurance 3,000 per yr per staff 27,000Training 10,000 ($5k non-profsnl) 85,000
Rent $5x 12x250’ per person
Recruitlng fees Treat as one time start-up expense
Olher direct costs 15.0% ofcompAccounting Services I0.0% of revenuePFS Overhead (CO0, division finance & admin, etc.)
221,250
135,000
218,500400,00025,000
Total Direct Expenses 2v456r417
Confidential
Contribution 1r543r583
61%
39%
mvCFOTypical Office Contribution
CS Director 5Total
2,500,000
1,500,0004r000,000
# Staff1 300,0002 300,0002 200,0002 150,0001 50.0001 4O,000
9.0 1,040,000
10% 250,0005% 75,0005% 16,667
341,667
1,381,667
9%
34.5%
1,381,667
103.62527,00085,000
215,625
135,000
207,250400,00025,000
2,364t542 59%
I r635r458 41% !
Specialty DirectorTotal
3,000,000
9,000,0003rOOOrO00
S~ff2 600,0001 150,0001 100,0001 75,000
0.5 25,0001 40,000
6.5 990,000 33%
10% 300.0005% 450,000
750,000 25%
1,740,000 58.0%
1,740,000
130,50019,50060,000
210,000
97.500
261,000300,00025,000
2~633,500
366,500
88%
12"/. ~i
TOTAL OFFICETotal
15,000,0003.000.000
9.000,000 9,000,00027,000~000
# Staff8 2,400,000
13 1,950,00013 1,300,00013 975,0007 325,0007 280,OOO
Teams7
60.5 7,230,000 27%
1,800,000900,000100,000
2,800,000 10%
10,030,000 37.1%
1 50,0001 50.0001 40,000
140,000
10,170,000 37.7%
762.750190,500585,000 2.2%
1,538,250 5.7%
952,500 3.5%
1,525.500 5.7% ..:2,700,000 10.0% i’:
175.000 0.6%.e ’:=-
17,061,250 63%
9,938,750 37%
i
December 1999
STARS0031111

Online Services2002 - 2004
¯ Revenue and Market PenetrationAssumptions
¯ Monthly Revenue Ramp-up
STARS0031112

myCFOOnline Services Revenue
~;1-~;5 million ~;.1-,~1 million TOTAL
Population, # of householdsMarket penetration in 3 years(year 5 after starting in yr 3)
Customers, end of period
6,000,000 35,000,000
2.00% 2.00%
120,000 700,000 820,000
Assume 0.25% market penetration at end of yr 1, 1.0% at end of yr 2, 2.5% at end of yr 3, thenrevenue grows at 1% per month
Monthly revenue per customer $ 150 $ 17.50 $ 37
Total Monthlyrevenue $ 18,000,000 $ 12,250,000 $ 30,250,000
Run rate end of year 1
Run rate end of year 2
Run rate end of },ear 3
Berlin January 2002
1,800,000 1,225,000
7,200,000 4,900,000
18,000,000 12,250,000
Revenue by Month
~;1-,~5 million ~;.1~1 million TOTAL
Month 1Month 2Month 3Month 4
Month 5Month 6Month 7Month 8Month 9
Month 10Month 11Month 12Month 13
Month 14Month 15Month 16
Month 17Month 18Month 19Month 20
Month 21Month 22Month 23Month 24
$$$$$$$$$$$$
75,000225 000375 000
525 000675 000825 000975 000
1,125,0001,275,000
1,425,0001,575,0001,725,000
$ 51,042 $ 126,042
$ 153,125 $ 378,125
$ 255,208 $ 630,208$ 357,292 $ 882,292$ 459,375 $ 1,134,375
$ 561,458 $ 1,386,458
$ 663,542 $ 1,638,542$ 765,625 $ 1,890,625$ 867,708 $ 2,142,708
$ 969,792 $ 2,394,792$ 1,071,875 $ 2,646,875
$ 1,173,958 $ 2,898,958$ 18,150,000
$$$$$$$$$$$$
2,025,0002,475,000
2,925,0003,375,000
3,825,0004,275,000
4,725,0005,175,000
5,625,0006,075,0006,525,0006,975,000
$ 1,378,125 $ 3,403,125$ 1,684,375 $ 4,159,375
$ 1,990,625 $ 4,915,625
$ 2,296,875 $ 5,671,875$ 2,603,125 $ 6,428,125
$ 2,909,375 $ 7,184,375
$ 3,215,625 $ 7,940,625$ 3,521,875 $ 8,696,875
$ 3,828,125 $ 9,453,125
$ 4,134,375 $ 10,209,375$ 4,440,625 $ 10,965,625$ 4,746,875 $ 11,721,875
+400%$ 90,750,000
Confidential December 1999
STARS0031113

myCFOOnline Services Revenue
Month
Month
Month
Month
Month
Month
Month
Month
Month
Month
Month
Month
Month
Month
Month
Month
Month
Month
Month
Month
Month
Month
Month
Month
Month
Month
Month
Month
Month
Month
Month
Month
Month
Month
Month
Month
25
26
27
28
29
30
31
32
33
34
35
36
37
38
39
40
41
42
43
44
45
46
47
48
49
50
51
52
53
54
55
56
57
58
59
60
~;1~5 million
$ 7,650,000
$ 8,550,000
$ 9,450,000
$ 10,350,000
$ 11,250,000
$ 12,150,000
$ 13,050,000
$ 13.950,000
$ 14,850,000
$ 15,750,000
$ 16,650,000
$ 17,550,000
~.1~1 million TOTAL
$ 5,206,250 $ 12,856,250
$ 5,818,750 $ 14,368,750
$ 6.431,250 $ 15,881.250
$ 7,043,750 $ 17,393,750
$ 7,656,250 $ 18,906,250
$ 8,268,750 $ 20,418,750
$ 8,881,250 $ 21,931,250
$ 9,493,750 $ 23,443,750
$ 10,106,250 $ 24,956,250
$ 10,718,750 $ 26,468,750
$ 11,331,250 $ 27,981,250
$ 11,943,750 $ 29,493,750
+ 180%
$ 254,100.000
$ 18,000,000 $ 12,250,000
$ 18,180,000 $ 12,372,500
$ 18,361,800 $ 12,496,225
$ 18,545,418 $ 12,621,187
$ 18,730,872 $ 12,747,399
$ 18.918,181 $ 12,874,873
$ 19,107,363 $ 13,003,622
$ 19,298,436 $ 13,133,658
$ 19,491,421 $ 13,264,995
$ 19,686,335 $ 13,397,645
$ 19,883,198 $ 13,531,621
$ 20,082,030 $ 13,666,937
$ 30,250,000
$ 30,552,500
$ 30,858,025
$ 31,166,605
$ 31,478,271
$ 31,793,054
$ 32,110,985
$ 32,432,094
$ 32,756,415
$ 33,083,979
$ 33,414,819
$ 33,748.967
+51%
$ 383,645,716
$ 20,282,851 $ 13,803,607
$ 20,485,679 $ 13,941,643
$ 20,690,536 $ 14,081,059
$ 20,897,441 $ 14.221.870
$ 21,106,416 $ 14,364,088
$ 21,317,480 $ 14,507,729
$ 21,530,655 $ 14,652,807
$ 21,745,961 $ 14,799,335
$ 21,963,421 $ 14,947,328
$ 22,183,055 $ 15,096,801
$ 22,404,885 $ 15,247,769
$ 22.628.934 $ 15,400,247
$ 34,086.457
$ 34,427,322
$ 34,771,595
$ 35,119,311
$ 35,470,504
$ 35,825,209
$ 36,183,461
$ 36,545,296
$ 36,910,749
$ 37,279,856
$ 37,652,655
$ 38,029.181
+13%
$ 432.301.596
Confidential December 1999
STARS0031114

Online ServicesContribution Margin
STARSO031115

mvCFOOnline Business
Pro Forma Contribution 2002-2004
Online REVENUE ($000)
Direct Costs
Salary Expense °
OccupancyOther expenses - load factorDepreciation
30% of revenue
33% of compens
2002 2003 2004
$ 18,150 $ 90,750 $ 254,100
$ 5,445 $ 27,225 $ 76,230
$ 3,429$ 9,446$ 18,017$ 1,052$ 2,141$ 3°202$ 1,132$ 3,117$ 5,946$ 170$ 544$ 1,185
Incremental Expenses ($000)
Pretax profit contribution
" Year-end Headcount
$ 11,228 $ 42,473 $ 104,579
$ 6,922 $ 48,277 $ 149,52138% 53% 58.8%
103 236 424
Confidential December 1999
STARS0031116

MEMORANDUM OF TERMSFOR PRIVATE PLACEMENT OF
SERIES B PREFERRED STOCK OFmyCFO, INC.
February 2, 2000
This memorandum summarizes the principal terms of the Series B Preferred Stock financingof myCFO, Inc. (the "Preferred Stock Financing").
Offering Terms:
Issuer: myCFO, Inc., a Delaware corporation (the"Company").
Securities to be Issued: Series B Preferred Stock (the "Preferred Stock").
Aggregate Proceeds: Approximately $50 million
Valuation: "Pre-money" valuation of $500 million (or $5.52 pershare post split)
Expected Initial Closing Date: February__,2000
In vestors: Subject to compliance with federal and state securitieslaws, the Company anticipates raising this round ofcapital from a small group of top tier investmentinstitutions that will be the Company’s first formalalliances. Such alliances contemplate working closelytogether to serve the best interests of our clients,employees and businesses and establishing links toprovide integrated electronic information. The term ofthese relationships shall be at least 5 years, throughwhich the investors will maintain a significant stake inthe Company and will not invest in a competitor of theCompany. Existing investors have participation rightsbut will accommodate the needs of new investors.
Terms of the Series B Preferred Stock
Dividends: Annual $0.55 per share dividends, payable when and ifdeclared by the Board of Directors. Dividends are notcumulative. No dividends shall be paid to the CommonStock until all dividends for such year have been
STARS0031117

What we doAt myCFO, our expert advisors and cutting-edge technology combine to bring the bestand most comprehensive wealth services. These personalized services put you in controlof all your financial affairs - leaving you free to focus on what you enjoy most in life.And, myCFO only provides wealth services, so our strategies are completely unbiasedand in your best interest.
The personal touchYour personal myCFO Client Service Director will work closely with you to understandyour background, your concerns and your goals. Our Client Service Directors, all withmore than a decade of expertise, have a wide range of wealth management backgrounds.Our Professional Services offering includes secure transfer of wealth to loved ones tosmart ways to minimize your taxes.
The high tech powerThrough the power of the Internet, myCFO is pioneering new On-Line Services that areboth secure and in real time. Today, you can view customizable expense reports and paybills with our new Expense Manger. And our Investment Center, a great way to see asnapshot of your complete financial picture, will be available soon.
What we doBy combining expert advisory services and cutting-edge technology, myCFO delivers thebest and most comprehensive wealth services. These personalized services put you incontrol of all your financial affairs - leaving you free to focus on what you enjoy most inlife. Because myCFO only provides wealth services, our strategies are completelyunbiased and always in your best interest.
Personalized servicesYour personal myCFO client service director will work closely with you to understandyour background, your concerns, and your financial goals. Our advisors, each with morethan a decade of experience, specialize in a wide range of wealth management fields. Theprofessional services they offer range from strategic tax preparation to long-terminvestment planning.
Innovative technologyBy harnessing the power of the lnternet, myCFO has developed secure, real-time onlineservices. Today, our clients can pay bills and view customizable expense reports usingour Expense Manger. Our Investment Center, which will provide clients instant access totheir wealth across multiple institutions and investments, will be available soon.
STARS0031118

0
Liquidation Preference:
Conversion:
Antidilution Adjustments:
Voting Rights:
declared and paid on the Preferred Stock, and then suchdividends on the Common Stock shall not exceed thedividends on the Preferred Stock unless the amount isalso paid to the Preferred Stock on an as-convertedbasis.
Equal ranking with the Series A except that the Series Bwould have a proportionately higher dollar valueliquidation preference based upon its higher share price.In the event of any liquidation or winding up of theCompany (including a merger, reorganization or othertransaction in which more than 50% of the outstandingsecurities of the Company are transferred), the holdersof the Preferred Stock shall be entitled to receive inpreference to the holders of the Common Stock, anamount equal to the sum of (a)the original purchaseprice plus (b) all declared but unpaid dividends on suchshares. The balance of the proceeds shall be paid to theholders of the Common Stock.
Convertible into one (1) share of Common Stock(subject to antidilution adjustment) at any time at theoption of the holder. Automatically converts intoCommon Stock upon (i)the consummation of underwritten public offering with aggregate proceeds inexcess of $10,000,000 at a price per share greater than$6.00 per share (as adjusted for stock splits, stockdividends, recapitalizations and the like) or (ii) the voteof a majority of the then-outstanding shares of PreferredStock, voting as a single class.
Conversion ratio adjusted on a weighted average basisin the event of an issuance below the Preferred Stockprice. The issuance to the following will be excludedfrom the conversion ratio adjustment: (i) officers,directors and employees or consultants of the Companyand (ii) to persons or entities in connection withequipment financing, sponsored research, collaboration,technology licensing, development agreement or anyother strategic partnerships or mergers or acquisitionsapproved by the Board of Directors. Proportionaladjustments for stock splits and stock dividends.
Votes on an as-converted basis, but also has class voteas provided by law and on (i) the creation of any senioror pari passu security, (ii)any change to the rights,
-2-
STARS0031119

preferences and privileges of the Preferred Stock,(iii) any transaction in which control of the Company transferred, (iv) increase or decrease the total number authorized Preferred Stock, and (v) declare or pay anydividend.
Terms of PreferredStock Purchase Agreement
Representations and Warranties:
Terms of StockholderRights Agreement
Registration Rights:
Standard representations and warranties by theCompany.
(a) Beginning six (6) months after the Company’sfirst registered public offering of its stock, one (1)demand registration upon the initiation by holders of atleast 50% of the Preferred Stock for aggregate proceedsin excess of $10,000,000. Registration expenses paidby Company.
(b) Unlimited piggyback registration rights subjectto pro rata cutback at the underwriter’s discretion.Registration expenses paid by Company.
(c) Two (2) S-3 Registrations of at least$1,000,000, each upon initiation by holders ofRegistrable Securities equal or convertible in theaggregate to at least 2% of the outstanding CommonStock. Notwithstanding the foregoing, the Companyshall not be required to effect more than one S-3registration in any twelve (12) month period.Registration expenses paid by Company.
After the Closing Date, the Company shall not grantregistration rights unless (i) such new registration rightsare on a pari passu basis with those rights grantedhereunder or (ii) such new registration rights aresubordinate to the registration rights granted hereunder.
Registration rights terminate at such time as a publicmarket for the Company’s common stock exists and all
-3-
STARS0031120

J
Right of First Offer:
Founders’ Restrictions on Transfer:
Co-Sale Right:
Advisory Committee:
Other Matters
Closing Conditions:
Publicity
Legal CounselCounsel to the Company:
Registrable Securities held by such holder may be soldwithin a three (3) month period pursuant to Rule 144.
Each Investor purchasing in this round shall have aright, based on its ownership of Preferred Stock, toparticipate in subsequent equity financings of theCompany to maintain such Investor’s percentageownership of Preferred Stock of the Company on afully diluted basis (subject to customary exclusions).
The holders of Preferred Stock will have a right of firstrefusal and, if such right is declined, a right toparticipate pro rata in transfers by the Founders forvalue (subject to customary exclusions). Such rightshall terminate on the IPO.
Each Investor purchasing in this round shall have aright, based on its ownership of Preferred Stock, toparticipate in any sales of stock by the Founders(subject to customary exclusions). Such right shallterminate on an IPO.
Upon the closing of the Preferred Stock Financing, theinvestor will have the right to participate on theAdvisory Committee which would interact with theBoard of Directors, management and its advisors.
Closing subject to negotiation of definitive legaldocuments and completion of legal and financial duediligence by Investors.
All parties would have the right to publicize the fact ofthe investment.
Wilson Sonsini Goodrich & Rosati650 Page Mill RoadPalo Alto, California 94304-1050Phone: 650-493-9300Fax: 650-493-6811Attn: LarryW. Sonsini, Esq.
John T. Sheridan, Esq.
-4-
STARS0031121