Business Plan Poultry Slaughterhouse -...
24
Business Plan Poultry Slaughterhouse Wilson Fyffe 25 November 2015 This document has been anonymised for general publication and updated to include recent developments in risk management.
-
Upload
nguyenngoc -
Category
Documents
-
view
218 -
download
5
Transcript of Business Plan Poultry Slaughterhouse -...

Business Plan
Poultry Slaughterhouse
Wilson Fyffe
25 November 2015
This document has been anonymised for general publication and updated to include recent developments in risk management.
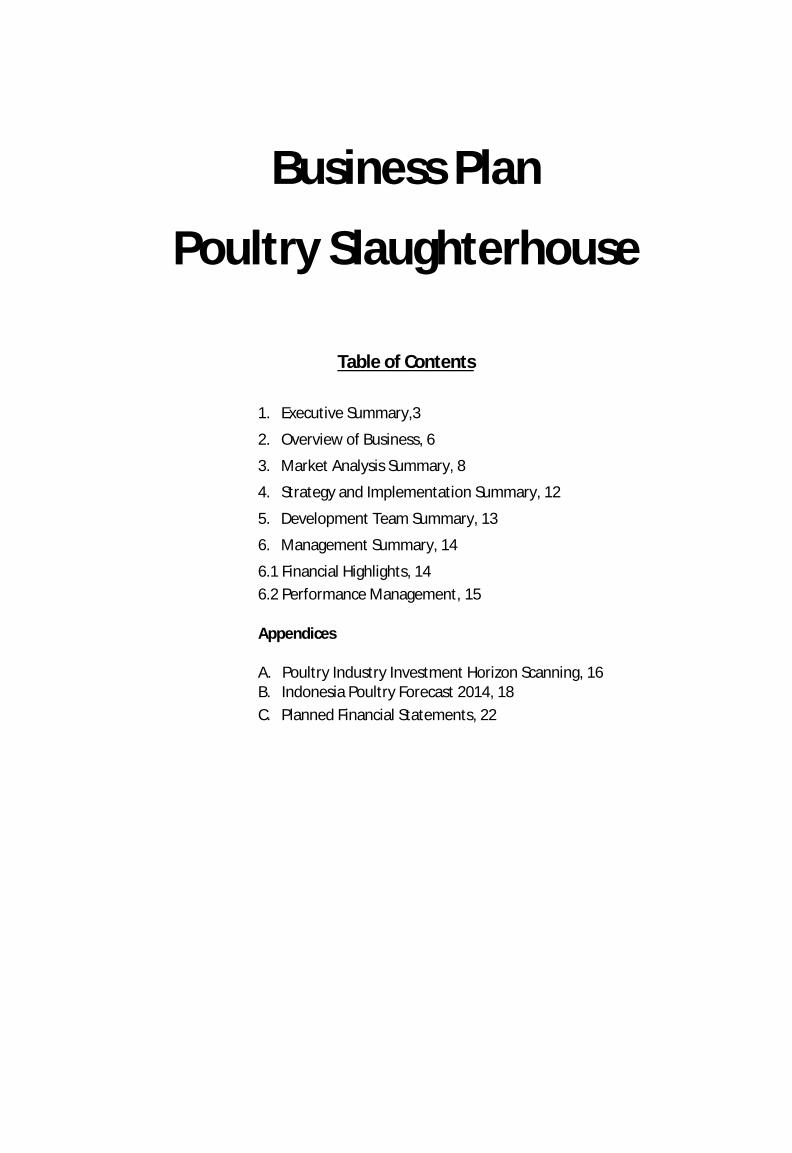
Business Plan
Poultry Slaughterhouse
Table of Contents
1. Executive Summary,3
2. Overview of Business, 6
3. Market Analysis Summary, 8
4. Strategy and Implementation Summary, 12
5. Development Team Summary, 13
6. Management Summary, 14
6.1 Financial Highlights, 146.2 Performance Management, 15
Appendices
A. Poultry Industry Investment Horizon Scanning, 16B. Indonesia Poultry Forecast 2014, 18C. Planned Financial Statements, 22

1. Executive Summary
Purpose:
The purpose of the project is to prepare a business plan for the establishment of a poultry slaughterhouse, for presentation to the banks for provision of loan funds.
The poultry slaughterhouse is part of an overall suite of business units in the integrated poultry industry, which covers: day-old-chicks, layer hens, broiler growing, poultry slaughter & dressing, poultry feed mills and specialist poultry restaurants.
1.1 Growth Statement
The integrated poultry industry is a mature industry internationally. However, in Indonesia, the tradition has been for the chicken slaughtering process to be done in ‘wet markets’. Health regulations are forcing change in these areas and customer preferences are for chicken meat products to be sourced from certified slaughterhouses. The poultry slaughterhouse industry, in Indonesia, can thus be classified as in a high stage of growth.
1.2 Mission Statement
The mission of [client’s] slaughterhouse SBU is:
“To improve the quality of life of our community by the reliable, long-term provision of hygienically packed chicken meat products to the marketplace.”
1.3 Objectives
The objective of [client]’s poultry slaughterhouse SBU is to reach a combined processing rate of 4800birds per hour by December 2020.
1.4 Keys to Success
The keys to success of the operation include:
∑ Efficient coordination of broiler grower’s output to maintain steady supply∑ Efficient scheduling of truck transportation from the farm gates to the poultry
slaughterhouse, particularly during the wet season∑ Adequate supply of trained operations personnel∑ Effective plant maintenance to ensure a high level of uptime∑ Reliable backup generators in case of electricity supply failure
1.5 Company Ownership
[Client] company is 100% owned by the [AAA] family members.

1.6 Company Locations & Facilities
The client’s poultry slaughterhouse facilities will be located at a combination of locations in accordance with government guidelines:
New poultry slaughterhouses for Jakarta
There are signs that Indonesia is taking seriously the growing demand for food and the need to raise food safety standards. Last week, reports Jakarta Post, the capital city’s administration announced plans to concentrate poultry slaughtering at just five new locations. City governor, Basuki “Ahok” Tjahaja Purnama, said the new facilities will be equipped with modern technology in order to raise the hygiene standards of chicken meat distributed in the city.
Jakarta Fisheries, Agriculture and Food Security Agency head, Darjamuni Taseda, added that the new slaughterhouses will make it easier for his agency’s employees to control the quality of chicken meat sent to the city’s markets.
Source: http://www.wattagnet.com/articles/24986-indonesian-poultry-meat-demand-increases-forecast: 17 November 2015
The headquarters will be in Jakarta.
Financial Summary
1.7 Capital Expenditure Required:
The investment in capital equipment and supporting working capital is as shown in Table 1. below:
Table 1 – Capital Expenditure Required2017 2018 2019 2020 2021 Total
30 Jun 30 Jun 30 Jun 30 Jun 30 Jun
Total InvestmentsUSD 000's 3,435 3,778 4,156 4,572 5,029 20,971
1.8 Bank Loan Funds Required:
The bank loan funds required, net of repayments, are as per Table 2 below:
Table 2 – Bank Loan Funds Required2017 2018 2019 2020 2021 Total
30 Jun 30 Jun 30 Jun 30 Jun 30 Jun
Long Term DebtUSD 000's 746 821 903 993 1,093 4,556
1.9 Bank Interest Rates Assumed:
The bank interest rates assumed are as per Table 3 below:
Table 3 – Bank Interest Rates Assumed
2017 2018 2019 2020 2021
30 Jun 30 Jun 30 Jun 30 Jun 30 Jun
Interest Expense % of Average Borrowings 4.0% 5.0% 6.0% 6.0% 6.0%
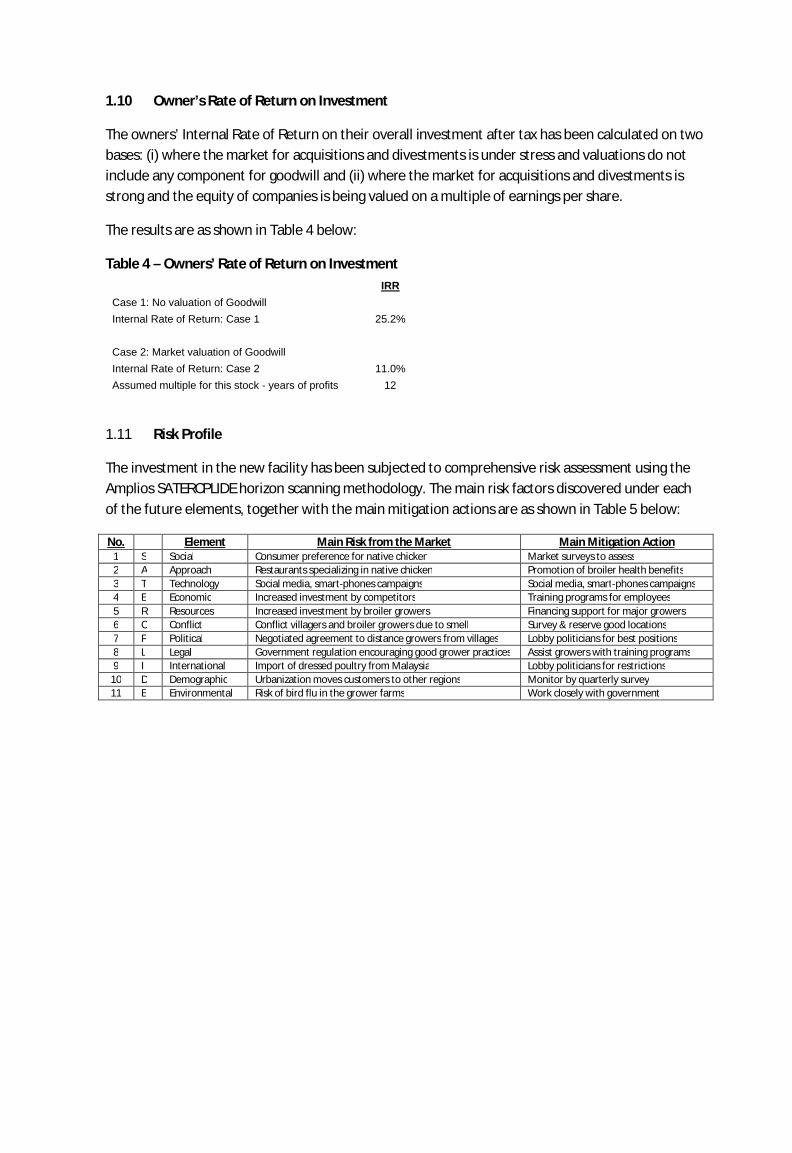
1.10 Owner’s Rate of Return on Investment
The owners’ Internal Rate of Return on their overall investment after tax has been calculated on two bases: (i) where the market for acquisitions and divestments is under stress and valuations do not include any component for goodwill and (ii) where the market for acquisitions and divestments is strong and the equity of companies is being valued on a multiple of earnings per share.
The results are as shown in Table 4 below:
Table 4 – Owners’ Rate of Return on InvestmentIRR
Case 1: No valuation of Goodwill
Internal Rate of Return: Case 1 25.2%
Case 2: Market valuation of Goodwill
Internal Rate of Return: Case 2 11.0%
Assumed multiple for this stock - years of profits 12
1.11 Risk Profile
The investment in the new facility has been subjected to comprehensive risk assessment using the Amplios SATERCPLIDE horizon scanning methodology. The main risk factors discovered under each of the future elements, together with the main mitigation actions are as shown in Table 5 below:
No. Element Main Risk from the Market Main Mitigation Action1 S Social Consumer preference for native chicken Market surveys to assess2 A Approach Restaurants specializing in native chicken Promotion of broiler health benefits3 T Technology Social media, smart-phones campaigns Social media, smart-phones campaigns4 E Economic Increased investment by competitors Training programs for employees5 R Resources Increased investment by broiler growers Financing support for major growers6 C Conflict Conflict villagers and broiler growers due to smell Survey & reserve good locations7 P Political Negotiated agreement to distance growers from villages Lobby politicians for best positions8 L Legal Government regulation encouraging good grower practices Assist growers with training programs9 I International Import of dressed poultry from Malaysia Lobby politicians for restrictions
10 D Demographic Urbanization moves customers to other regions Monitor by quarterly survey11 E Environmental Risk of bird flu in the grower farms Work closely with government
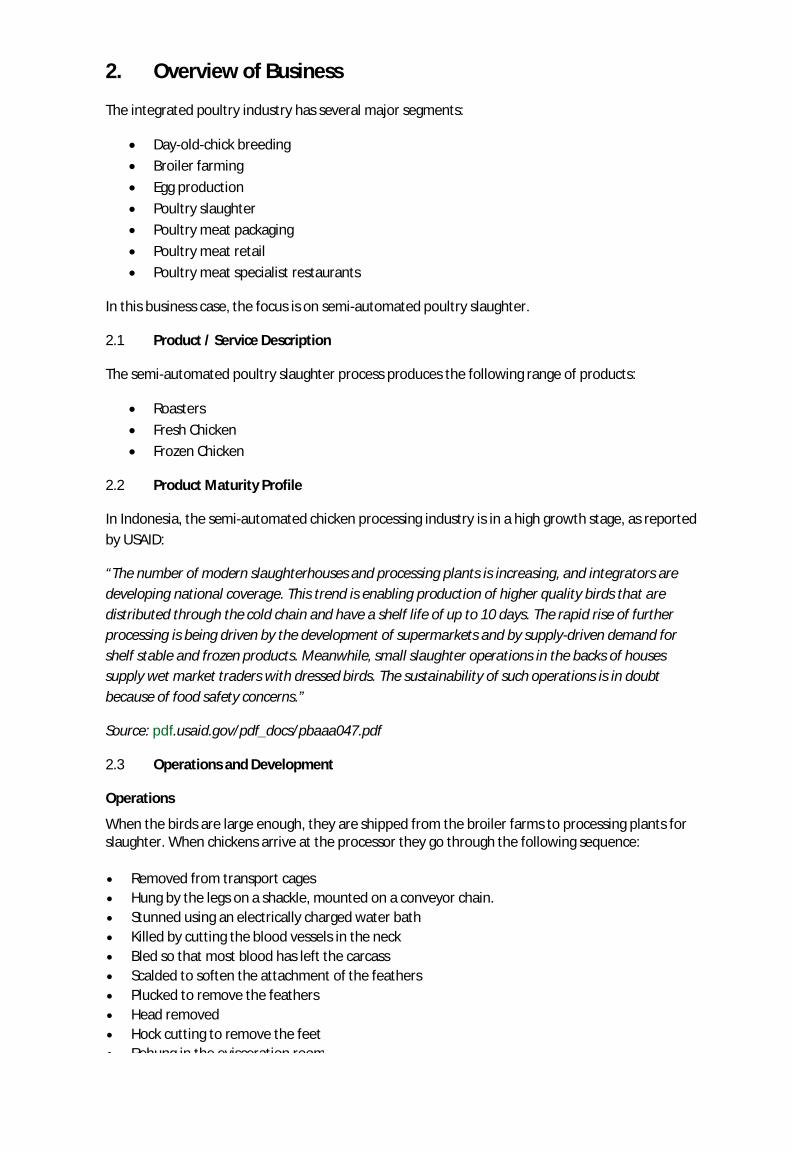
2. Overview of Business
The integrated poultry industry has several major segments:
∑ Day-old-chick breeding∑ Broiler farming∑ Egg production∑ Poultry slaughter∑ Poultry meat packaging∑ Poultry meat retail∑ Poultry meat specialist restaurants
In this business case, the focus is on semi-automated poultry slaughter.
2.1 Product / Service Description
The semi-automated poultry slaughter process produces the following range of products:
∑ Roasters∑ Fresh Chicken∑ Frozen Chicken
2.2 Product Maturity Profile
In Indonesia, the semi-automated chicken processing industry is in a high growth stage, as reported by USAID:
“The number of modern slaughterhouses and processing plants is increasing, and integrators are developing national coverage. This trend is enabling production of higher quality birds that are distributed through the cold chain and have a shelf life of up to 10 days. The rapid rise of further processing is being driven by the development of supermarkets and by supply-driven demand for shelf stable and frozen products. Meanwhile, small slaughter operations in the backs of houses supply wet market traders with dressed birds. The sustainability of such operations is in doubt because of food safety concerns.”
Source: pdf.usaid.gov/pdf_docs/pbaaa047.pdf
2.3 Operations and Development
Operations
When the birds are large enough, they are shipped from the broiler farms to processing plants for slaughter. When chickens arrive at the processor they go through the following sequence:
∑ Removed from transport cages∑ Hung by the legs on a shackle, mounted on a conveyor chain.∑ Stunned using an electrically charged water bath∑ Killed by cutting the blood vessels in the neck∑ Bled so that most blood has left the carcass∑ Scalded to soften the attachment of the feathers∑ Plucked to remove the feathers∑ Head removed∑ Hock cutting to remove the feet∑ Rehung in the evisceration room
∑ Gutted or eviscerated to remove the internal organs∑ Washed to remove blood and soiling from the carcass∑ Chilled to prevent bacterial spoiling (They go through a chiller which takes approximately 2
hours to go through. The chiller generally holds thousands of gallons of water kept below 40 degrees Fahrenheit.)
∑ Drained to allow excess water to drip off the carcass∑ Weighing∑ Cut selection to divide the carcass into desired portion (breast, drumsticks etc.)∑ Packed (for example in plastic bags) to protect carcasses or cuts∑ Chilled or frozen for preservation
The proposed facilities will be constructed to allow increases in production rates sufficient to meet this business plan.
2.4 Future Services
The poultry industry is experiencing strong growth worldwide. This is due to many factors, some of the most important being:
∑ Rising standards of living∑ Rising need for protein in diets∑ Economic utilization of land and other resources∑ Acceptability to most religious groups
A wide range of future services are envisioned, partly to cater to the requirements of religious groups.

3. Market Analysis Summary
The Marketing Plan has been developed within guidelines as follows:
∑ Taking account of the customers, competitors, risk and opportunity factors;∑ Definition the resources required to address the risks and opportunities;∑ Evaluation products’ fit with customer needs;∑ Evaluation of options for PR, advertising, direct mail campaigns;∑ Integration of marketing plans with long term (3-5 years) financial plans;∑ Establishment of a scorecard system for monitoring progress of strategy implementation.
3.1 Target Customers
Jabotabek, which is the greater Jakarta area, is comprised of the Metropolitan area ofJakarta, Bogor, Depok,Tangerang, and Bekasi cities and regencies in West Java, Indonesia. The population, in accordance with the 2010 Census, was 28 million persons.
The target market for this SBU is the prospering middle class (refer to Appendix A).
3.2 Market Segmentation
The market for chicken meat is segmented by product category as follows:
Ambient MeatChilled Raw Packaged Meat - ProcessedChilled Raw Packaged Meat - Whole CutsCooked Meats - CounterCooked Meats - PackagedFresh Meat (Counter)Frozen Meat
These products are supplied to the major retail outlets and exporters.
3.3 Market Needs
Function & Quality
The company’s products need to be prepared and packaged to government regulation standards.
Price
Although the market is in a high growth stage, it is still, due to the generally low income levels in Indonesia, very price competitive.
Convenience
The most important convenience issue is the company’s ability to deliver product to the wholesaler and retailer depots in accordance with agreed schedules. The key element here is the chiller / freezer capacity of the depot.
3.4 Market Trends
The most important market trend is the movement away from the traditional native chicken (“Ayam Kampung”), which is smaller but viewed as tastier, to the broiler chickens.
3.5 Market Growth
For the period 2009 to 2050, among the biggest projected increases in the value of food group demand are poultry meat, beef and sheep and goat meat, all expected to rise by a factor of 14. Dairy products are not far behind – estimated to be up tenfold. For all these commodities, the starting point is low compared to other Asian countries but by the end of the period, the value of Indonesia’s poultry meat and beef demand is valued at well over US$30 billion and dairy at approaching US$10 billion.
Source: http://www.wattagnet.com/articles/24986-indonesian-poultry-meat-demand-increases-forecast
3.6 Industry Analysis
The main stakeholders in the poultry industry in Indonesia are:
The IntegratorsFeed MillsParent Stock Breeding FarmsBroiler FarmersVillage Poultry FarmersContractorsMarket TradersProcessorsRetailersAnimal Health CompaniesEquipment SuppliersConsumersGovernment of Indonesia
3.7 Competitive Comparison
The main competitors in the poultry processing industry in Indonesia are:
∑ Charoen Pokphand Indonesia∑ Japfa Comfeed
Charoen Pokphand Indonesia (CPI) has approximately 12 feed mills across Indonesia with 4.5MMT capacity and a 33 percent market share in poultry feed. Mills include Banten, two in East Java, Medan (N Sumatra), Semarang (Central Java), Lampung, and one being built in West Java. CPI has Cobb 500 and Ross 308 broiler PS and Isa Brown layer PS. PS operations have been extended to East Nusa Tenggara and Papua. CPI has at least five broiler processing plants (two in Banten, Medan, Sidoarjo and Surubaya; owns its own broiler farms; and uses contract broiler growing for most of its live bird supply. It is a market leader of further processed products (Golden Fiesta, Fiesta, Champ and Okay brands) with processed chicken sales in 2011 up 19 percent from 2010. In 2011 feed produced 77 percent of sales revenue, DOCs 13 percent, and processed chicken 9 percent.
Source: US AID POULTRY
JAPFA COMFEED INDOMISIA (JCI) has 11 feed mills across Indonesia (Medan, Padang, Lampung, Bati-Bati, Makassar, Tangerang, Cirebon, Sragen, Sidoarjo, Surabaya, Banyuwangi) with a market share

PS and Lohmann Brown layer PS. It has seven broiler slaughterhouses (in Pekanbaru, Banjarbaru, Lampung, Bogor, Pabelan, Grobogan and Bali through Ciomas Adisatwa) and increased processed chicken sales by 56 percent in 2011. It has a significant market share in frozen and shelf stable processed products through So Good Foods. It has corn driers in Pare Pare and Lampung and its bag making operation in East Java produces 5,700 MT of polypropylene bags.
Source: US AID POULTRY
3.8 Competition & Buying Patterns
An indication of customer buying patterns is shown in the graphics below:

Source: IE Singapore, Statistics from Euromonitor
3.9 Competition SWOT Analysis
A summary of the main strengths, weaknesses, opportunities & threats to be considered by [ClientCompany] in competing against the major players CPI and JCI is shown in the table below:
Competitor Strengths Weaknesses Opportunities ThreatsCPI Established
international brandNeed to upgrade old facilities
Urbanization shopping
Avian flu
JCI Established local brand
Need to upgrade old facilities
Urbanization shopping
Avian flu

12
4. Strategy and Implementation Summary
4.1 Competitive Edge
The client company’s competitive edge is that its products are from facilities with the latest technology.
4.2 Strengths, Weaknesses, Threats, and Opportunities
A summary for the client company is as follows:
Strengths: Management team has long term experience in the integrated poultry Industry; facilities will be latest technology from Europe
Weaknesses: New brand has low recognition;
Opportunities: Catering to the halal meat market; catering to the new urban developments
Threats: Price wars from the existing competitors;
4.3 Marketing Strategy
The marketing strategy for client company should be to win market share by direct aggressive competition with CPI, JCI and the major imported brands.
4.4 Social Media Strategy
The client company will follow current best practice in social media communication for marketing to the outlets, supporting growers and supporting suppliers. In particular, video advertising via Youtube and similar facilities will play an important role.
4.5 Product / Service Development Roadmap
The client company’s product development will focus on an increased range of cuts to cater to the needs of emerging market demographic segments.
13
5. Development Team Summary
5.1 Advisors and Affiliates
The client company’s advisors will include specialists in health regulation and waste treatment.
5.2 Personnel Plan: Initial Rollout
The personnel for the initial operations will be based on the team established during the initial recruitment campaign.
14
6. Management Summary
Management Inputs
To assist with the design of the facilities, management has been engaged to include:
∑ The number of birds to be slaughtered, their type and weight and over what time period∑ The availability of slaughter stock and its seasonality∑ The ownership of the birds at each stage eg: will the abattoir buy the birds from producers,
will it slaughter for producers or wholesalers, will it sell the birds to wholesalers or through its own outlets. These factors influence the carcase identification systems and office requirements
∑ The nature of the product to be prepared (New York Dressed, whole hot poultry carcases, whole chilled carcases, whole frozen carcases, chilled or frozen joints etc)
∑ What parts of the carcase are considered as edible and inedible. Eg: chicken feet, unused in many parts of the world are considered a delicacy in others. This will assist with by -products and effluent plant design
∑ The slaughter system to be considered appropriate e.g. will the birds move along and overhead railway system to the processing machines or will the staff carry the birds to the machines
∑ The level of technology to be employed
6.1 Financial Highlights
Financial Projections
The financial projections have been made over working life of the main assets, typically 5-10 years. The financial statements include:
∑ Cash Flow∑ Trading , Profit & Loss Account∑ Balance Sheet∑ Ratio Analysis
The line items taken into account are such as:
∑ Capital costs:∑ Land∑ Buildings∑ Plant and equipment∑ Installation∑ Contingencies∑ Working capital∑ Operating costs:∑ Personnel∑ Maintenance and spares∑ Water and sewage

15
∑ Electricity∑ Fuel oil∑ Short life operating equipment (2–3 years)∑ Packaging materials∑ Insurance∑ Sundries
The planned financial statements are shown in Appendix C.
6.2 Business Plan Implementation Performance Management
Performance management will be controlled using the Kaplan & Norton Balanced Scorecard methodology. The method encourages management to participate in setting objectives designed to support achievement of the company’s long term goals and compare the targets with actual performance on a monthly basis. Examples of the screens with sample data are shown below:

16
Appendix A
Poultry Industry Investment Horizon Scanning
For this business plan, the Amplios “Rapid Due Diligence” database has been employed. This has the capacity to evaluate investment topics in any combination of industry and location. The database stores future risk and opportunity events gathered from several sources, such as:
∑ Publicly listed company annual reports generally;∑ Host country government plans for the industry;∑ Major military power plans;∑ Public listed company annual reports in the particular industry;∑ Internet search via Google Advanced Search∑ The client’s own experience and research
The method has been run for [client]’s SBU in Indonesia, with results as per the summary table below:
In this matrix are shown the 20 most important future events to be considered by an investor considering a poultry meat processing plant investment in Indonesia. The events have been selected interactively from a candidate list of more than 200 events and can be changed instantly by the client’s management team to form alternative scenarios.
The gold colours indicate events that are outside the control of management, the blue indicates those within management’s control.
The recommendation “Proceed to strategy stage with caution” is automatically displayed (bottom right) if the overall score is positive (green box at top right).
17
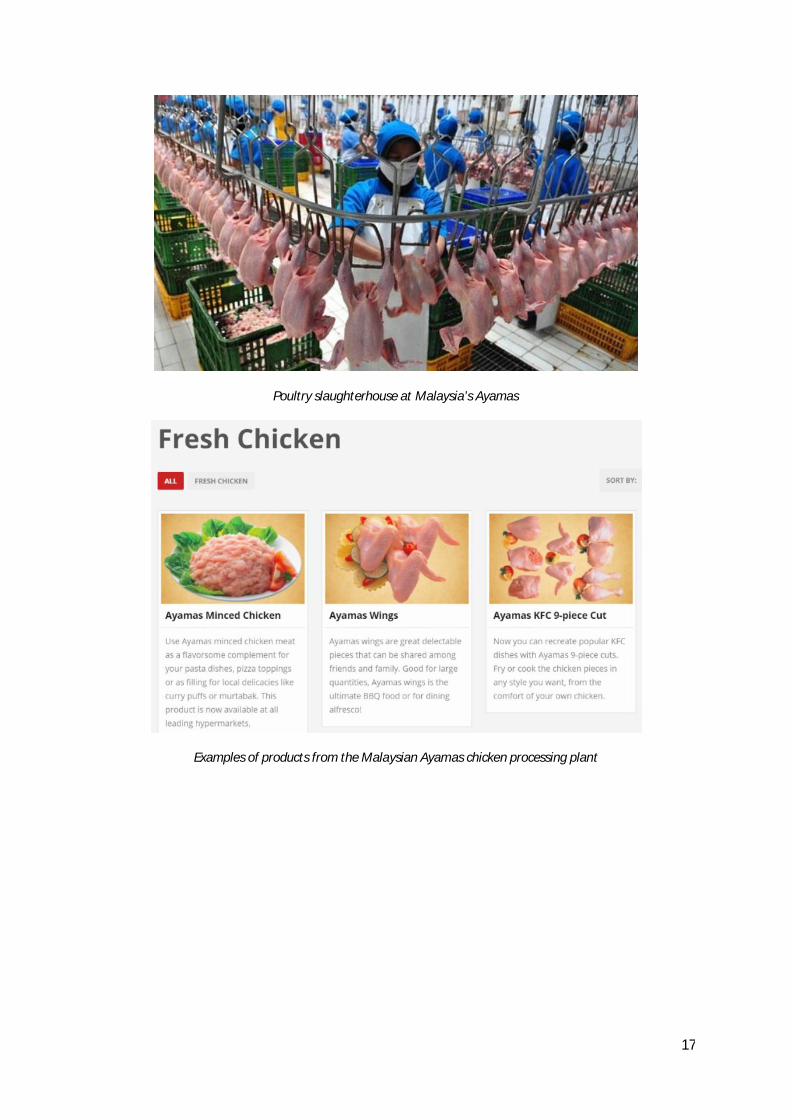
Poultry slaughterhouse at Malaysia’s Ayamas
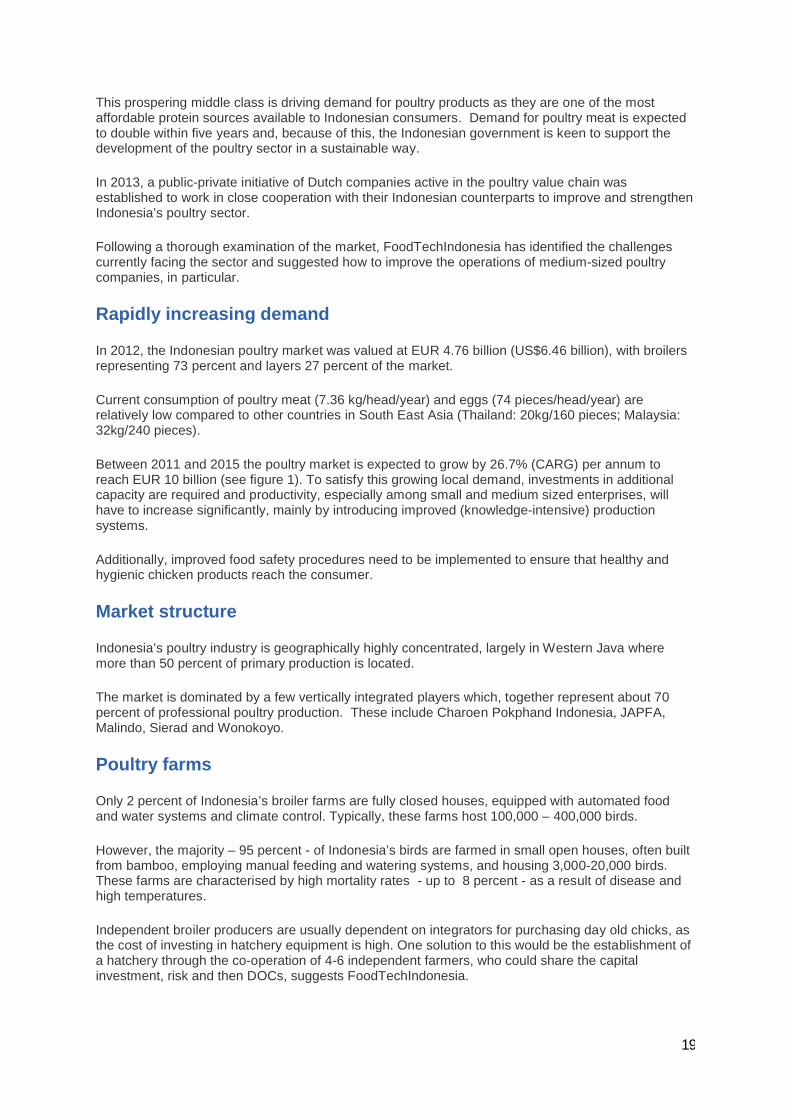
Examples of products from the Malaysian Ayamas chicken processing plant

18
APPENDIX B
INDONESIA POULTRY FORECAST 2014
Meeting the challenge of Indonesia’s growing demand for poultry
Indonesia’s demand for poultry meat is expected to continue growing, primarily driven by the growing purchasing power of the country’s expanding middle class.
Written June 20, 2014
By Matthias Brienen, Bettina Cavenagh, Wouter van Vliet, and Marco Copier
BROILERS & LAYERSEGG PRODUCTIONANTIBIOTIC-FREE MEAT
Indonesia’s poultry producers have hurdles to overcome in order to be part of the growing taste for chicken and eggs in their home market.
Indonesia is the largest country in South East Asia with a relatively young, fast growing and increasingly urban population of almost 250 million. The economy is prospering, and growth over the past decade has averaged in excess of 6 percent per annum. As a result, the middle class has tripled to 150 million over the last five years alone.
19
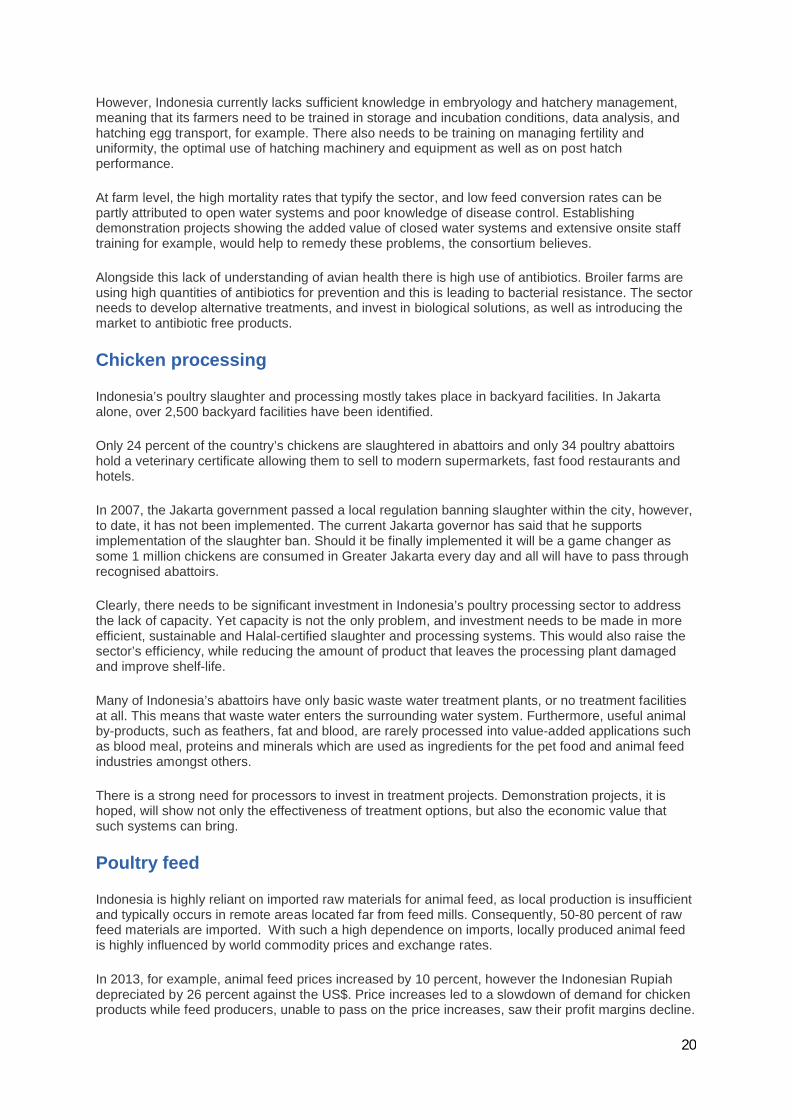
This prospering middle class is driving demand for poultry products as they are one of the most affordable protein sources available to Indonesian consumers. Demand for poultry meat is expected to double within five years and, because of this, the Indonesian government is keen to support the development of the poultry sector in a sustainable way.
In 2013, a public-private initiative of Dutch companies active in the poultry value chain was established to work in close cooperation with their Indonesian counterparts to improve and strengthen Indonesia’s poultry sector.
Following a thorough examination of the market, FoodTechIndonesia has identified the challenges currently facing the sector and suggested how to improve the operations of medium-sized poultry companies, in particular.
Rapidly increasing demand
In 2012, the Indonesian poultry market was valued at EUR 4.76 billion (US$6.46 billion), with broilers representing 73 percent and layers 27 percent of the market.
Current consumption of poultry meat (7.36 kg/head/year) and eggs (74 pieces/head/year) are relatively low compared to other countries in South East Asia (Thailand: 20kg/160 pieces; Malaysia: 32kg/240 pieces).
Between 2011 and 2015 the poultry market is expected to grow by 26.7% (CARG) per annum to reach EUR 10 billion (see figure 1). To satisfy this growing local demand, investments in additional capacity are required and productivity, especially among small and medium sized enterprises, will have to increase significantly, mainly by introducing improved (knowledge-intensive) production systems.
Additionally, improved food safety procedures need to be implemented to ensure that healthy and hygienic chicken products reach the consumer.
Market structure
Indonesia’s poultry industry is geographically highly concentrated, largely in Western Java where more than 50 percent of primary production is located.
The market is dominated by a few vertically integrated players which, together represent about 70 percent of professional poultry production. These include Charoen Pokphand Indonesia, JAPFA, Malindo, Sierad and Wonokoyo.
Poultry farms
Only 2 percent of Indonesia’s broiler farms are fully closed houses, equipped with automated food and water systems and climate control. Typically, these farms host 100,000 – 400,000 birds.
However, the majority – 95 percent - of Indonesia’s birds are farmed in small open houses, often built from bamboo, employing manual feeding and watering systems, and housing 3,000-20,000 birds. These farms are characterised by high mortality rates - up to 8 percent - as a result of disease and high temperatures.
Independent broiler producers are usually dependent on integrators for purchasing day old chicks, as the cost of investing in hatchery equipment is high. One solution to this would be the establishment of a hatchery through the co-operation of 4-6 independent farmers, who could share the capital investment, risk and then DOCs, suggests FoodTechIndonesia.
20
However, Indonesia currently lacks sufficient knowledge in embryology and hatchery management, meaning that its farmers need to be trained in storage and incubation conditions, data analysis, and hatching egg transport, for example. There also needs to be training on managing fertility and uniformity, the optimal use of hatching machinery and equipment as well as on post hatch performance.
At farm level, the high mortality rates that typify the sector, and low feed conversion rates can be partly attributed to open water systems and poor knowledge of disease control. Establishing demonstration projects showing the added value of closed water systems and extensive onsite staff training for example, would help to remedy these problems, the consortium believes.
Alongside this lack of understanding of avian health there is high use of antibiotics. Broiler farms are using high quantities of antibiotics for prevention and this is leading to bacterial resistance. The sector needs to develop alternative treatments, and invest in biological solutions, as well as introducing the market to antibiotic free products.
Chicken processing
Indonesia’s poultry slaughter and processing mostly takes place in backyard facilities. In Jakarta alone, over 2,500 backyard facilities have been identified.
Only 24 percent of the country’s chickens are slaughtered in abattoirs and only 34 poultry abattoirs hold a veterinary certificate allowing them to sell to modern supermarkets, fast food restaurants and hotels.
In 2007, the Jakarta government passed a local regulation banning slaughter within the city, however, to date, it has not been implemented. The current Jakarta governor has said that he supports implementation of the slaughter ban. Should it be finally implemented it will be a game changer as some 1 million chickens are consumed in Greater Jakarta every day and all will have to pass through recognised abattoirs.
Clearly, there needs to be significant investment in Indonesia’s poultry processing sector to address the lack of capacity. Yet capacity is not the only problem, and investment needs to be made in more efficient, sustainable and Halal-certified slaughter and processing systems. This would also raise the sector’s efficiency, while reducing the amount of product that leaves the processing plant damaged and improve shelf-life.
Many of Indonesia’s abattoirs have only basic waste water treatment plants, or no treatment facilities at all. This means that waste water enters the surrounding water system. Furthermore, useful animal by-products, such as feathers, fat and blood, are rarely processed into value-added applications such as blood meal, proteins and minerals which are used as ingredients for the pet food and animal feed industries amongst others.
There is a strong need for processors to invest in treatment projects. Demonstration projects, it is hoped, will show not only the effectiveness of treatment options, but also the economic value that such systems can bring.
Poultry feed
Indonesia is highly reliant on imported raw materials for animal feed, as local production is insufficient and typically occurs in remote areas located far from feed mills. Consequently, 50-80 percent of raw feed materials are imported. With such a high dependence on imports, locally produced animal feed is highly influenced by world commodity prices and exchange rates.
In 2013, for example, animal feed prices increased by 10 percent, however the Indonesian Rupiah depreciated by 26 percent against the US$. Price increases led to a slowdown of demand for chicken products while feed producers, unable to pass on the price increases, saw their profit margins decline.

21
Another difficulty is that the country’s feed mills often rely on outdated and inefficient equipment, often 15-20 years old, and many work in less than optimal ways. These facilities could be better utilised, and a first step would be through the use of audits and process improvements, FoodTechIndonesia says. In particular, operators need to look at feed formulation and composition, raw materials, energy use, water and other inputs, production processes and storage.
Source: http://www.wattagnet.com/articles/19161-meeting-the-challenge-of-indonesia-s-growing-demand-for-poultry
22
Appendix C
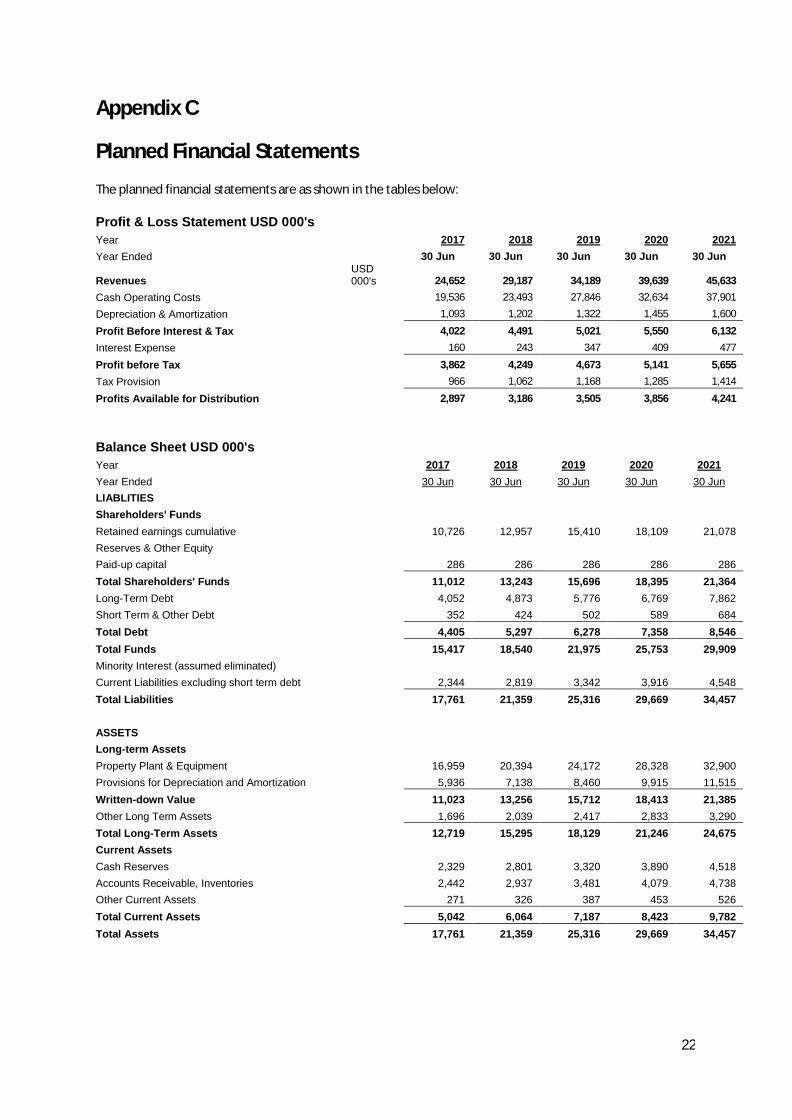
Planned Financial Statements
The planned financial statements are as shown in the tables below:
Profit & Loss Statement USD 000'sYear 2017 2018 2019 2020 2021
Year Ended 30 Jun 30 Jun 30 Jun 30 Jun 30 Jun
RevenuesUSD 000's 24,652 29,187 34,189 39,639 45,633
Cash Operating Costs 19,536 23,493 27,846 32,634 37,901
Depreciation & Amortization 1,093 1,202 1,322 1,455 1,600
Profit Before Interest & Tax 4,022 4,491 5,021 5,550 6,132
Interest Expense 160 243 347 409 477
Profit before Tax 3,862 4,249 4,673 5,141 5,655
Tax Provision 966 1,062 1,168 1,285 1,414
Profits Available for Distribution 2,897 3,186 3,505 3,856 4,241
Balance Sheet USD 000'sYear 2017 2018 2019 2020 2021
Year Ended 30 Jun 30 Jun 30 Jun 30 Jun 30 Jun
LIABLITIES
Shareholders' Funds
Retained earnings cumulative 10,726 12,957 15,410 18,109 21,078
Reserves & Other Equity
Paid-up capital 286 286 286 286 286
Total Shareholders' Funds 11,012 13,243 15,696 18,395 21,364
Long-Term Debt 4,052 4,873 5,776 6,769 7,862
Short Term & Other Debt 352 424 502 589 684
Total Debt 4,405 5,297 6,278 7,358 8,546
Total Funds 15,417 18,540 21,975 25,753 29,909
Minority Interest (assumed eliminated)
Current Liabilities excluding short term debt 2,344 2,819 3,342 3,916 4,548
Total Liabilities 17,761 21,359 25,316 29,669 34,457
ASSETS
Long-term Assets
Property Plant & Equipment 16,959 20,394 24,172 28,328 32,900
Provisions for Depreciation and Amortization 5,936 7,138 8,460 9,915 11,515
Written-down Value 11,023 13,256 15,712 18,413 21,385
Other Long Term Assets 1,696 2,039 2,417 2,833 3,290
Total Long-Term Assets 12,719 15,295 18,129 21,246 24,675
Current Assets
Cash Reserves 2,329 2,801 3,320 3,890 4,518
Accounts Receivable, Inventories 2,442 2,937 3,481 4,079 4,738
Other Current Assets 271 326 387 453 526
Total Current Assets 5,042 6,064 7,187 8,423 9,782
Total Assets 17,761 21,359 25,316 29,669 34,457
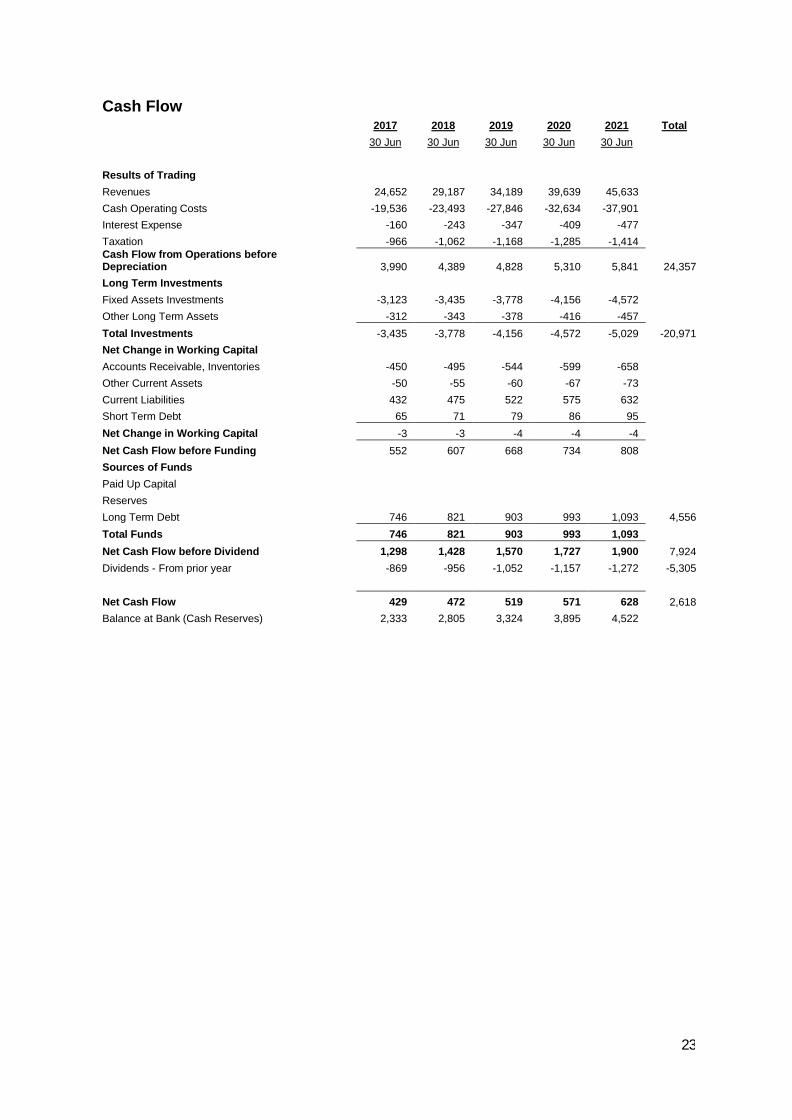
23
Cash Flow2017 2018 2019 2020 2021 Total
30 Jun 30 Jun 30 Jun 30 Jun 30 Jun
Results of Trading
Revenues 24,652 29,187 34,189 39,639 45,633
Cash Operating Costs -19,536 -23,493 -27,846 -32,634 -37,901
Interest Expense -160 -243 -347 -409 -477
Taxation -966 -1,062 -1,168 -1,285 -1,414Cash Flow from Operations before Depreciation 3,990 4,389 4,828 5,310 5,841 24,357
Long Term Investments
Fixed Assets Investments -3,123 -3,435 -3,778 -4,156 -4,572
Other Long Term Assets -312 -343 -378 -416 -457
Total Investments -3,435 -3,778 -4,156 -4,572 -5,029 -20,971
Net Change in Working Capital
Accounts Receivable, Inventories -450 -495 -544 -599 -658
Other Current Assets -50 -55 -60 -67 -73
Current Liabilities 432 475 522 575 632
Short Term Debt 65 71 79 86 95
Net Change in Working Capital -3 -3 -4 -4 -4
Net Cash Flow before Funding 552 607 668 734 808
Sources of Funds
Paid Up Capital
Reserves
Long Term Debt 746 821 903 993 1,093 4,556
Total Funds 746 821 903 993 1,093
Net Cash Flow before Dividend 1,298 1,428 1,570 1,727 1,900 7,924
Dividends - From prior year -869 -956 -1,052 -1,157 -1,272 -5,305
Net Cash Flow 429 472 519 571 628 2,618
Balance at Bank (Cash Reserves) 2,333 2,805 3,324 3,895 4,522
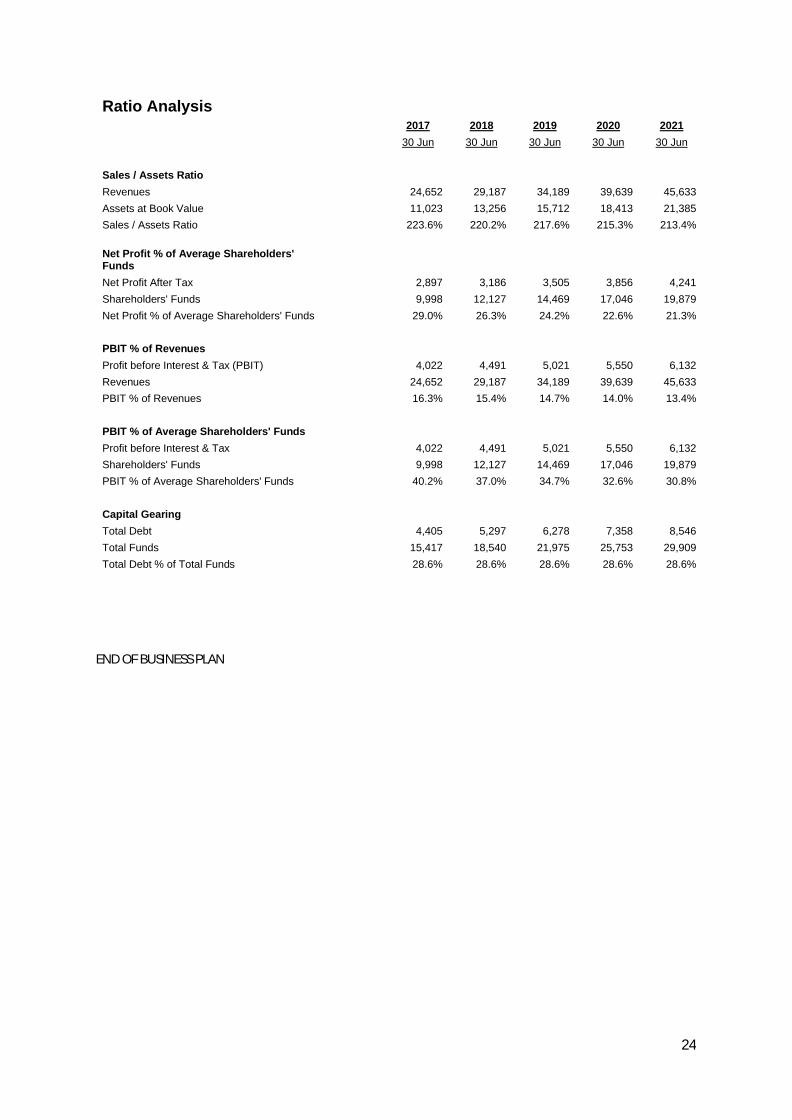
24
Ratio Analysis2017 2018 2019 2020 2021
30 Jun 30 Jun 30 Jun 30 Jun 30 Jun
Sales / Assets Ratio
Revenues 24,652 29,187 34,189 39,639 45,633
Assets at Book Value 11,023 13,256 15,712 18,413 21,385
Sales / Assets Ratio 223.6% 220.2% 217.6% 215.3% 213.4%
Net Profit % of Average Shareholders' Funds
Net Profit After Tax 2,897 3,186 3,505 3,856 4,241
Shareholders' Funds 9,998 12,127 14,469 17,046 19,879
Net Profit % of Average Shareholders' Funds 29.0% 26.3% 24.2% 22.6% 21.3%
PBIT % of Revenues
Profit before Interest & Tax (PBIT) 4,022 4,491 5,021 5,550 6,132
Revenues 24,652 29,187 34,189 39,639 45,633
PBIT % of Revenues 16.3% 15.4% 14.7% 14.0% 13.4%
PBIT % of Average Shareholders' Funds
Profit before Interest & Tax 4,022 4,491 5,021 5,550 6,132
Shareholders' Funds 9,998 12,127 14,469 17,046 19,879
PBIT % of Average Shareholders' Funds 40.2% 37.0% 34.7% 32.6% 30.8%
Capital Gearing
Total Debt 4,405 5,297 6,278 7,358 8,546
Total Funds 15,417 18,540 21,975 25,753 29,909
Total Debt % of Total Funds 28.6% 28.6% 28.6% 28.6% 28.6%
END OF BUSINESS PLAN


![Advanced technologies for poultry slaughterhouse ......According to Chernicharo,[34] mesh screening can remove BOD 5 up to 30% by dissociating solid particles and reduce more than](https://static.fdocuments.in/doc/165x107/608b063b497bcf03436aed3d/advanced-technologies-for-poultry-slaughterhouse-according-to-chernicharo34.jpg)