Business plan and budget - Great Places · Business plan and budget 2016/2017 Great homes. Great...
26
Business plan and budget 2016/2017 Great homes. Great communities. Great people.
Transcript of Business plan and budget - Great Places · Business plan and budget 2016/2017 Great homes. Great...

Business planand budget2016/2017Great homes. Great communities. Great people.

Contents
Restrictions on useThis business plan has been prepared in good faith, responsibility for verifying itscontents lies with the addressee. No liability is accepted for errors or omissions.This document may not be reproduced in whole or in part without the expressauthority of the company.
Executive summary
Regulation and governance
The three-year corporate plan
Financial reporting issues
Assumptions
Group financial performance
Sensitivity analysis
3 - 6
7
8
9
10 - 14
15 - 21
22 - 25
1.
2.
3.
4.
5.
6.
7.

Executive summary
Business plan and budget 2016/2017 | 3
1.
1.1 | 2015/16 has seen Great Places grow to approaching 19,000 homes owned or managed. We expect to generate turnover that will exceed £100M due largely to a bumper year for first tranche sales and market sales through Cube, and we will produce a record surplus before tax of over £12M.
1.2 | The financial strength that has been painstakingly built up over the last few years has been severely tested by a range of Government policies announced over the last 12 months including:
1.2.1 | In the July budget:• Four years of 1% rent reductions
(overturning the CPI+1% formula announced last year), with clear concerns for subsequent periods;
• Continuing welfare reform including a reduction of the benefit cap to £20k outside London;
• Confirmation of the commitment to right to buy (subsequently endorsed by the NHF-brokered voluntary VRTB agreement);
• Introduction of “Pay to stay” (which became voluntary for the RP sector);
1.2.2 | The Office of National Statistics’ (ONS) decision to reclassify the sector as “Public Sector” with subsequent Government commitment to de-regulatory actions in an attempt to reverse the decision.
1.2.3 | November’s Comprehensive Spending Review (CSR) included:• Confirmation of the Government’s
commitment to home ownership, with virtually all public funding directed towards starter homes and shared ownership products and very little funding available for affordable rent products;
• Extension of the Local Housing Allowance (LHA) “cap” to the RP sector, effectively introducing a
further rental constraint, particularly since LHAs are to be frozen for four years. The inclusion of Supported and Sheltered Housing in this regime potentially renders that segment of the Group’s portfolio unviable (this decision remains under review).
• Restrictions on the 5% tolerance applicable to target rents.
1.2.4 | In addition, following the completion of the current 10 year rent formula, we now assume that rents will rise by CPI only rather than continuing the CPI+1% previously assumed. This has a material impact on income from year 10 onwards of the plan.
1.3 | The Great Places response was measured and well thought through, and was clearly laid out in a revised business plan produced in October 2015. This combined changes in assumptions and development aspirations , procurement efficiencies, cost savings and limited staffing reductions. This builds on the solid foundations that are already delivering step change improvement in repairs and asset management, supported housing and business systems. Furthermore “Building Greatness” our business transformation programme will work through every part of the organisation, stripping out duplication, waste and non-value adding activities.
1.4 | Taking account of this environment, the Group is pleased to present a business plan for 2016/17 and beyond that absorbs the adverse factors identified above, yet still maintains the financial strength and long term viability of the Group.
1.5 | The many adverse factors referenced above have all been built into this revised plan, with a single exception. We have excluded the impact of LHAs being rolled out to
Supported, Agency, Elderly and Extracare properties as in reality this would leave little option but to close many of these schemes. We feel this decision will be reversed and this scenario is considered as part of the stress testing programme.
This new and fully updated plan: • Confirms compliance with the Governance and Financial Viability standard • Reflects the resourcing requirements of the Group’s three year Corporate Plan (taking into account changes triggered by the Budget and CSR) • Considers an increasingly complex operating, business, political and economic environment • Adopts a suite of prudent yet realistic assumptions • Demonstrates continuing financial strength whilst achieving steady development-led growth

1.7 | It has been a relatively quiet year for funding activity, with the only notable transaction being the completion of £29.5M (bringing the total to £50M) of new debt from the highly successful Affordable Housing Guarantee Programme Funding (AHGP) at a fixed rate of 2.388%.
This means that the Group remains in a very strong funding position with five years of funding in place through our RBS and Santander long term facilities (total £104M still to be drawn) and £50M of the RBC revolving facility.
1.8 | Financial viability is most clearly demonstrated by achievement of, and ongoing improvement in, the key ratios considered by our investors, funders and credit rating agencies, as well as the rating itself. Success in this area was highlighted by the improvement to the Group’s underlying baseline credit assessment (BCA) from Baa2 to Baa1 in January 2015 and the retention of our Moodys A2 and Fitch A+ ratings in late 2015 (despite the adverse impact of the July budget).
1.8.1 | Graph 1 shows our primary funder’s covenant, interest cover. The graph for the new plan (red line) shows a relatively consistent trend of improvement for the first twenty years, peaking at over 200%, before dipping to below 180% by year 30.
1.8.2 | The current plan trend (red line), compared to that of the black line (the October 2015 plan), is very similar despite having absorbed our revised long term rent assumption of CPI only. Efficiencies in maintenance costs
(recognised by a slightly tighter inflation assumption) largely offset the rent impact.
1.8.3 | Graph 2 shows the second funder’s covenant, gearing. The 2016 proposed plan has a gearing ratio which is very similar to the plan from October 2015 with a steady reduction in the ratio year on year. The covenant sets a maximum of 65%, so again this is never remotely threatened, nor indeed is our 55% golden rule.
Executive summary
Graph 1 | Interest cover ratio
240%
220%
200%
180%
160%
140%
120%
100%Yr1 Yr3 Yr5 Yr7 Yr9 Yr11 Yr13 Yr15 Yr17 Yr19 Yr21 Yr23 Yr25 Yr27 Y29
October 2015 plan March 2016 plan Golden rule
Graph 2 | Gearing
60%
50%
40%
30%
20%
10%
0%Yr1 Yr3 Yr5 Yr7 Yr9 Yr11 Yr13 Yr15 Yr17 Yr19 Yr21 Yr23 Yr25 Yr27 Y29
1.
October 2015 plan March 2016 plan Golden rule
Great homes: Maximising our investment in sustainable homes. Great communities: Building successful, vibrant communities. Great people: Providing outstanding customer service and support. VALUES:
• We are fair, open and accountable
• We know, respect and care about our customers
• We appreciate the effort of everyone who works here
• We promote partnerships, efficiency and value for money
• We passionately embrace creativity, change and innovation
1.6 | The Group’s vision and values, updated in 2014 are:
Business plan and budget 2016/2017 | 4

Executive summary
Graph 3 | Surplus profile
£70,000
£60,000
£50,000
£40,000
£30,000
£20,000
£10,000
£0Yr1 Yr3 Yr5 Yr7 Yr9 Yr11 Yr13 Yr15 Yr17 Yr19 Yr21 Yr23 Yr25 Yr27 Y29
Graph 4 | Operating margin
35%
30%
25%
20%
15%2010/11Actual
2011/12Actual
2012/13Actual
2013/14Actual
2014/15Actual
2015/16Projection
2016/17Budget
1.
October 2015 plan March 2016 plan
Great Places Moodys Peer Group Golden rule
1.8.4 | Graph 3 shows the profile of surplus generated over the life of the plan – again the October plan profile (black line) is shown for comparison and demonstrates that the new plan (red line) matches or slightly betters the October plan for the first 20 years or so, before falling back a little. This shows the impact of the revised long term rent increase assumption falling to CPI not CPI+1%.
1.8.5 | Graph 4 shows that over the last few years Great Places has significantlyimproved its profitability, measured by operating margin, both in real terms and comparatively. The margin has moved from c18% in 2010/11 to almost 35% in 2014/15, moving from a position that was worse than the 40-strong Moodys Peer Group to one that is now significantly ahead of that peer group.
The plan shows that the margin can be maintained at between 34% - 36% for the next twenty years despite the increasing proportion of relatively low margin sales activity (the 2016/17 budget shows first tranche sales achieving an 11% margin and outright sales achieving an 18% margin). Looking ahead, Moody’s also expect to see a slight dip in operating margins as RPs absorb the impact of the rent reduction. The importance of maintaining profitability is demonstrated by the adoption of this measure as one of the four golden rules, with a minimum acceptable level of 28% and a target to move towards 38%.
1.8.6 | Currently the plan shows the margin dropping to around 30% in the last ten years of the plan, absorbing the changed rental assumption described earlier. However the plan does not yet incorporate any efficiencies from business transformation, which we expect to start to crystallise in the next two years, and these will be a key driver of margin growth in due course.
Business plan and budget 2016/2017 | 5

Executive summary
1.
• Our ‘repairs and asset management’ (RAM) distribution centre in Trafford Park was opened
• New printers/photocopiers across the organisation saving £20k per annum
• A new fleet of vans will save £120k per annum
• Extending the use of future kitchen replacements from 15 to 20 years
• Better management of voids and bad debts will save us £300k in 2016/17
• A multitude of procurement efficiencies such as: landscaping /gardening, scaffolding, internal audit, agency staff and energy
• Cube sold 32 units at Great Stone Gardens in Stretford, which generated a £1.7M profit. Half of this was gift-aided back to Great Places to help fund its core charitable activities
• The Great Value Group has established itself in a ‘guardian’ role - tracking and monitoring savings
• The re-procured ‘wide area network’ (WAN), which links data between offices and schemes, now costs c£30k less per annum
• This year we borrowed £29.5M from the European Investment Bank, with a government guarantee. The interest rate was less than 2.4%, saving us £150k per annum
• Renegotiating the rent at the Sheffield office, saving around £15k every year
• Recovering £160k in VAT and a tax repayment of c£20k in Corporation Tax
• Terra Nova still saves us at least £150k of otherwise irrecoverable VAT per annum
Business plan and budget 2016/2017 | 6

Regulation and Governance
2.1 | The Business Plan is one of the primary means of explaining to the regulator how we are meeting the full range of regulatory requirements, and in producing this plan we have carefully considered the Regulatory Framework.
2.2 | This plan helps demonstratehow the Group complies with the HCA Governance and Financial Viability Standard – see 2.5 below. The Group’s VFM self assessment can be found atwww.greatplaces.org.uk.
2.3 | The Group’s Code of Governance was fully updated to reflect the publicationin February 2015 of the new NHF Code of Governance “promoting Board excellence for housing associations” and we can confirm we are fully complaint with that Code. The Group’s G1/V1 rating was re-affirmed in February 2016.
2.4 | The Group’s approach to risk management has been thoroughly updated, taking into account a wide range of expertise and experience, not least from within our Board, our internal auditors, our external auditors, Zurich (our insurers) and many others.
2.
2.5 | Great Places will continue to actively demonstrate to the regulatorthat it meets the Governance and Financial Viability standard because
• This business plan demonstrates ongoing financial strength, incorporating prudent assumptions that have been benchmarked against others in the sector
• The plan incorporates a measured and appropriate response to the July 2015 budget and November 2015 Comprehensive Spending Review proposals. Long term effectiveness will be driven by the Building Greatness business transformation project while efficiencies identified in response to the budget are proactively monitored
• It is a well run business with limited diversification and a simple structure that helps ensure the protection of social housing assets
• It meets all of its funding covenants and is not reliant on sales to achieve this
• It has a comprehensive register of assets and liabilities. This includes title details for the Group’s housing properties and records of other assets. It also includes records of all loans, bonds, leases and other liabilities. The register incorporates information around key contacts, key suppliers and general business continuity. The register has been reviewed by our internal auditors in March 2016 and the limited schedule of suggested enhancements is being implemented
• It reports annually to the Board on the status of all joint ventures and other similar arrangements
• It continues to achieve 100% compliance with the decent homes standard and consistently achieves 100% gas safety compliance
• It charges rent in accordance with the relevant regulations, with a rent plan that considers affordability, sustainability and competition
Business plan and budget 2016/2017 | 7
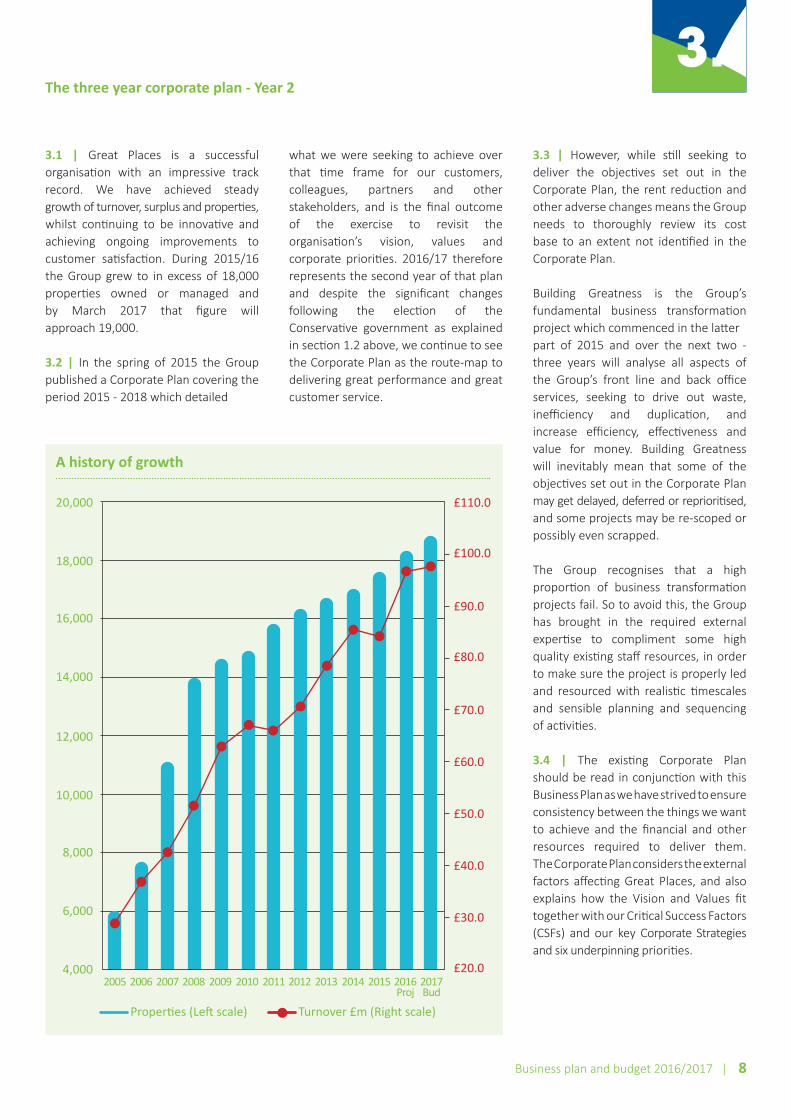
3.1 | Great Places is a successful organisation with an impressive track record. We have achieved steady growth of turnover, surplus and properties, whilst continuing to be innovative and achieving ongoing improvements to customer satisfaction. During 2015/16 the Group grew to in excess of 18,000 properties owned or managed and by March 2017 that figure will approach 19,000.
3.2 | In the spring of 2015 the Group published a Corporate Plan covering the period 2015 - 2018 which detailed
what we were seeking to achieve over that time frame for our customers, colleagues, partners and other stakeholders, and is the final outcome of the exercise to revisit the organisation’s vision, values and corporate priorities. 2016/17 therefore represents the second year of that plan and despite the significant changes following the election of the Conservative government as explained in section 1.2 above, we continue to see the Corporate Plan as the route-map to delivering great performance and great customer service.
3.3 | However, while still seeking to deliver the objectives set out in the Corporate Plan, the rent reduction and other adverse changes means the Group needs to thoroughly review its cost base to an extent not identified in the Corporate Plan.
Building Greatness is the Group’s fundamental business transformation project which commenced in the latter part of 2015 and over the next two - three years will analyse all aspects of the Group’s front line and back office services, seeking to drive out waste, inefficiency and duplication, and increase efficiency, effectiveness and value for money. Building Greatness will inevitably mean that some of the objectives set out in the Corporate Plan may get delayed, deferred or reprioritised, and some projects may be re-scoped or possibly even scrapped.
The Group recognises that a high proportion of business transformation projects fail. So to avoid this, the Group has brought in the required external expertise to compliment some high quality existing staff resources, in order to make sure the project is properly led and resourced with realistic timescales and sensible planning and sequencing of activities.
3.4 | The existing Corporate Plan should be read in conjunction with this Business Plan as we have strived to ensure consistency between the things we want to achieve and the financial and other resources required to deliver them. The Corporate Plan considers the external factors affecting Great Places, and also explains how the Vision and Values fit together with our Critical Success Factors (CSFs) and our key Corporate Strategies and six underpinning priorities.
The three year corporate plan - Year 2
A history of growth
20,000
18,000
16,000
14,000
12,000
10,000
8,000
6,000
4,000
£110.0
£100.0
£90.0
£80.0
£70.0
£60.0
£50.0
£40.0
£30.0
£20.02005 2006 2007 2008 2009 2010 2011 2012 2013 2014 2015 2016
Proj2017Bud
3.
Properties (Left scale) Turnover £m (Right scale)
Business plan and budget 2016/2017 | 8

4.1 | The financial statements produced at the end of the 2015/16 financial year will reflect some of the most significant changes to financial accounting methodologies and reporting in recent years, with the introduction of International Financial Reporting Standards (IFRS) through Financial Reporting Standards 100-105 (FRS 102) and a new Statement of Recommended Practice (SORP).
4.3 | The work undertaken to date has identified relatively few changes to the traditional financial statements, but some of the changes are substantial. There could be significant impact on the key financial covenants (interest cover and gearing) but the changes could be addressed by a small number of simple changes to covenant definitions. Some of the changes will introduce additional volatility to the financial statements.
4.4 | The accountants Smith and Williamson have been engaged by many of the sector funders to identify a consistent and fair approach to determining what covenant changes might be required. Great Places has provided all the required information and is in an advanced position in respect of this process.
4.5 | The financial statements shown in this plan have been produced in a pre-IFRS format to allow consistency with previously produced information. The gearing ratio graphs do make an assumption as to how grant will be treated, while the interest cover graph assumes pension deficit volatility is ignored. Later in the year, following production of the 15/16 financial statements, we will look to update the plan in an IFRS compatible format.
Financial reporting issues
4.
4.2 | The major areas for change include: • Accounting for Grant • Financial Instruments (in particular
the treatment of stand alone derivatives, hedging effectiveness and cancellable instruments)
• Treatment of pension costs in multi-employer schemes, particularly historic deficits
• Investment properties
Business plan and budget 2016/2017 | 9

5.1 | The key business plan assumptions proposed are presented in the table below. For each assumption some analysis and explanation is provided following the table.
Assumptions
5.
Assumptions Budget2016/17
Year 22017/18
Year 32018/19
Year 42019/20
Year 52020/21
Years6-30 Note
Target: Surplus before tax - based on the most recently approved plan
£11.1M £13.7M £11.7M £11.9M £13.7M £15.4M
Interest Cover golden rule Interest cover should not fall below 140% (covenants range from 105% to 120%) 5.2
Interest Cover golden rule - result 147% 156% 157% 162% 158%Peak: 212%Yr 30: 178%
5.2
Gearing golden rule Gearing should not increase above 55% (covenant 65%) 5.2
Gearing goldenn rule - result 43.3% 41.8% 41.6% 41.2% 41.0% Yr 30: 21.8% 5.2
Operating margin golden rule Operating margin before interest to be a minimum of 28% and be targeted to grow towards 38% 5.2
Operating margin golden rule - result 34.4% 34.7% 34.7% 35.8% 35.4%Peak: 35.8%Yr 30: 28.7%
5.2
CPI 0.50% 1.60% 1.80% 2.00% 2.00% 2.00% 5.4.1
RPI 2.00% 2.50% 2.75% 3.00% 3.25% 3.25% 5.4.2
Building inflation
Budgets submitted at
April 2016 prices
RPI+2% RPI+2% RPI+1% RPI+1% RPI+1% 5.7
Land price inflation RPI+2% RPI+2% RPI+1/2% RPI+1/2% RPI+1/2% 5.7
Earnings CPI+1% CPI+1% CPI+1% CPI+1.5% CPI+1.5% 5.5
Repairs & Maintenance inflation RPI+1/4% RPI+1/4% RPI+1/4% RPI+1/4% RPI+1/4% 5.6
Major repairs inflation RPI RPI RPI RPI RPI 5.6
Property price inflation CPI+1% CPI+1% CPI+1% CPI+1% CPI+1% 5.11.6
General needs & supported rents -1.00% -1.00% -1.00% -1.00% See note 5.8
Affordable rent conversions 150 150 0 0 0 0 5.8.1
Supporting people income See note RPI-15% RPI-15% CPI CPI CPI 5.8.2
Shared ownership rent increase RPI RPI RPI RPI RPI RPI 5.8.4
Bad debts See noteRising to
2.25% by end of year
Rising to 2.50% by end
of year
Rising to 2.75% by end
of year
Rising to 3.00% by end
of year3.00% 5.10
Voluntary Sales 60 60 40 40 40 40 5.11.2
New RTBs - 100 100 100 30 30 5.11.1
Major repair expenditure golden ruleThe business plan provisions fully meet the requirements of the stock condition
survey over the life of the plan and all major repairs are funded from operating cash flows.This is proved by review of the consolidated cash flow statement.
5.2
Margin on new short term debt Per existing loans with RBC, RBS and Santander 1.20% 1.20% 1.20% 5.12.4
Proportion of new debt Minimum 75% fixed in line with approved Treasury Strategy 5.12.5
3M LIBOR 0.75% - 1.75% 2.25% 2.75% 3.25% 3.75% 4.25% - 5.00% 5.12.3
30 year gilt rate 3.00% 3.30% 3.80% 4.00% 4.00% 4.00%
Spread on new long term debt 1.40% 1.30% 1.20% 1.20% 1.20% 1.20%
Hence cost of future fixed rate debt 4.40% 4.60% 5.00% 5.20% 5.20%5.20% rising
to 5.75%5.12.8
Interest rates - receivable 0.60% 1.50% 2.25% 3.00% 3.50% 3.50% to 4.50%
Business plan and budget 2016/2017 | 10

5.2 | The idea of adopting some golden rules was considered by Board in November 2014 when the draft business plan assumptions for 2015/16 were being discussed. At that time it was decided not to progress the idea with a desire to retain maximum flexibility underpinning the thinking. The matter arose again during the HCA in depth assessment in May/June 2015, with a clear regulatory view that ‘golden rules’ were a positive enhancement to the business planning and governance regime. Taking this on board, this plan has been developed with four ‘golden rules’ inherent in the thinking – essentially setting some thresholds above or below which the Group will ensure remains throughout its busi-ness plan. The golden rules are set at levels that are more difficult than the equivalent funding covenant, to ensure headroom is maintained at all times. These have been clearly set out in the table above. It is clear that the proposed plan satisfies the ‘golden rules’ throughout.
5.3 | The key business plan assumptions are presented in the table above. These are based on latest market information and projections from a wide range of sources including the Bank of England, the Office of National Statistics (ONS), the Office of Budget Responsibility (OBR), our Treasury Advisors Capita, other advisors including Canaccord, Centrus and Savills and various funders including RBC, RBS and Santander.
5.3.1 | Budgets have been submitted at April 2016 prices using local cost-specific information. The long term assumption for CPI has been retained at 2.0%, in line with the Bank of England target, however for 2016/17, 2017/18 and 2018/19 the figure is lower, as currently and widely predicted, and represents the CPI figure for the previous September, which normally drives the rent increase.
5.3.2 | The long term RPI assumption therefore grows from a low of 2.0% in the budget year, to 3.25% by year five and thereafter, generating a wedge (the difference between RPI and CPI) of 1.25% which is in line with OBR projections.
5.4 | With a salary bill of almost £20m (including Pension and NI contributions),the earnings increase assumption is among the most critical. The figures for the budget year incorporate a 1.0% earnings increase, incorporating an across the Board 0.75% pay rise for April 2016, plus some additional budget to ensure our commitment to salary benchmarking is maintained.
Over the subsequent three years the assumption is that earnings growth can be constrained to CPI+1%, whilst the assumption from year five is CPI+1.50%, which equates to around 3.5% annually– very consistent with longer term ONS, OBR, LGPS and SHPS assumptions. A key challenge will be to control salary costs and to make the predicted move towards a stronger linkage to CPI.
5.5 | The long term assumption for repairs and maintenance inflation is RPI+1/4% and for major repair inflation is RPI only. Some efficiency can be obtained from our in-house team, particularly as the benefits of the distribution centre begin to flow through. Around 40% of repairs and maintenance expenditure relates to staffing costs, which are indexed by the higher earnings inflation assumption and which we can control through pay constraint and driving up productivity.
5.6 | Major repair expenditure will be at a level that fully meets the requirements of the Group’s stock condition survey with additional provision made for ongoing acquisitions. This ensures that our fourth ‘golden rule’ is achieved.
5.7 | Development costs for the next couple of years are firmly established with the 2015-17 and 2015-18 programmes almost entirely on site, so there is very little construction price risk in that period. Subsequently the plan assumes a total scheme cost per unit of £130k, (slightly lower for 106 units). The building inflation assumption is RPI+2% in 2017/18 and 2018/19 and then RPI+1% throughout the rest of the plan. The land cost inflation assumption is also RPI+2% in 2017/18 and 2018/19, but then RPI+1/2% throughout the rest of the plan.
5.8 | In 2014 a 10 year rent settlement was announced, with a basis of CPI+1%, using the CPI figure from the preceding September. After just one year of the new arrangement, the Chancellor announced in the July 2015 budget there would be four years of a 1% rent reduction (note – not CPI-1%) to apply from April 2016 - April 2019 inclusive. This has had a huge affect across the sector and by April 2019 the Group’s rental stream will have been reduced by £10M per annum.
The sudden policy change casts some doubt as to the likely rent increase in April 2020 - April 2024, the remaining five years of the 10 year settlement. This plan assumes that the CPI+1% formula remains, as would seem to be promised by Government, but recognises that this must be a risk and is therefore a key sensitivity. After April 2024, rents are assumed to rise by CPI only. This revised assumption has a significant adverse impact on our plan. Some RPs are no longer assuming that we will see any CPI+1% period again.
Assumptions
5.
Business plan and budget 2016/2017 | 11

5.8.1 | Other rent changes, such as the linkage to Local Housing Allowances (LHA) and the restriction on the +5% tolerance on target rent on relets have been built into future rental assumptions. 150 rent conversions are budgeted in 2016/17 and 2017/18.
5.8.2 | Supported housing rents are subject to the same rent reduction as the general needs stock, although a CPI+1% increase has been permitted in April 2016. Proposals to limit supported rents to LHA levels remain under discussion and would have a devastating impact on the supported housing, agency managed, extra care and sheltered portfolio, possibly leading to the Group having to close many of the schemes. As such this proposal has not been included in the business plan.
5.8.3 | Supporting people income continues to come under huge pressure with Local Authorities making ever deeper cuts in order to balance budgets that have been severely constrained by their Central Government funding settlements. Following the closure of two schemes in Blackpool in 2014, our only scheme in Liverpool closed in early 2016. The budget year income has been built up in scheme by scheme detail. Going forward, we have assumed further very significant reductions in SP income (RPI-15%) in 2017/18 and 2018/19 – extending the reductions for a further year compared to the last business plan.
The impact of these assumptions is that SP income will have reduced from over £4M in 2010/11 to around £1.7M by 2018/19 – in excess of a 70% real reduction. We do assume that costs will reduce as well, though at least a year after the income reductions take place.
5.8.4 | Shared ownership rents increase by the November 2015 RPI figure of 1.10% and are contractually tied to RPI increases in subsequent years.
5.9 | The budget for voids is built up at local level by managers, taking into account the key components of void loss – the number of relets (tenancy turnover) and average relet times – in order to calculate the void loss percentage. Relet numbers and relet times subsequently become key performance targets for the year.
5.10 | Repeating the message from last year, the roll out of welfare reform has been much slower than originally envisaged, and the impact of the bedroom tax and the benefit cap (so far) not yet as great as we expected. At the point of writing this document, GP had only 252 Universal Credit (UC) claimants, which is not material at this stage,
but we do expect this figure to grow exponentially with the first roll out nearing completion. The full impact of welfare reform and UC is still to come, particularly with the further reduction to the benefit cap.
5.10.1 | The level of arrears across the Group is assumed to double over the next four years from c£4M to £8M – so getting to the same outcome, but more slowly than previously assumed. Similarly, bad debts for our existing general needs properties are assumed to rise from under 1% currently to around 3% by year five (so slightly lower than assumed previously). We are not making a statement that we expect arrears and bad debts to rise so significantly, but aim to ensure that our plan shows we are financially strong enough to absorb the worst scenario. We would very much expect to out- perform these levels. An initial increase in arrears need not necessarily result in additional bad debts in the long term, although there is an obvious linkage.
Assumptions
5.
Business plan and budget 2016/2017 | 12

5.11.1 | The introduction of the extended right to buy scheme is the key change in this section of assumptions. There are a large number of unknowns around the scheme and details are only gradually beginning to emerge. Key parameters such as the start date, eligibility criteria and exemptions are yet to be finalised. At the time of writing we have assumed that sales begin from April 2017 (this doesn’t preclude the scheme starting before then, as it will take some months for potential sales to go through the application, verification, offer and mortgage stages). We have assumed that in 2017/18, 2018/19 and 2019/20 there will be 100 RTB sales, before dropping to 30 per annum for the remainder of the plan. These assumptions are key to the overall structure of the plan, having a major impact on cash flow and our commitment to replace the sold properties and a number of sensitivities have been produced to show the impact of differing assumptions here. By contrast, we are expecting only three preserved RTBs to eligible transfer tenants in Knutsford and Sheffield.
5.11.2 | The Group’s Asset Management Strategy and associated programme of disposals continues relatively unchanged: We are targeting 60 disposals per annum in the first two years of the plan and 40 thereafter. The additional 20 for two years ties in with our HCA development contracts. We assume only a £25k per unit surplus on the disposals.
5.11.3 | The Group’s pipeline of shared ownership development means that there will be c120 first tranche sales completing in 2015/16 (compared to 79 budgeted). This is clearly a large step up from recent years (we sold around 50 first tranches in both 2014/15 and 2013/14). The 120 sales are spread across 22 different schemes, spreading the sales risk.
5.11.4 | The Group now has nearly 1,200 existing shared ownership homes, presenting a large pool of potential staircasing sales. Given recent market conditions, the plan assumes only a modest volume of sales annually (25 in GPHA and three in Plumlife). This is a very slight increase on last year’s assumption as we begin to see some limited pick up in the housing market. However, we have also budgeted for 10 repossessions, as in some areas of the North, for some types of property, prices have not yet recovered to their pre 2007 levels. 5.11.5 | The Group also has a portfolio of over 250 “rent to homebuy” properties, which were originally unsold shared ownership units, subsequently let on an affordable rent, on the understanding that they should eventually convert to shared ownership. This remains an untested market, so the plan prudently assumes no sales at all going forward, although realistically we would expect to see sales if there is any sustained pick up in housing activity. This gives the Group over £30m of potential sales income that has been deliberately excluded from the plan.
5.11.6 | Property price inflation has once again been assumed at modest levels – assumed at CPI+1% throughout the plan. The Group does not wish to be in any way financially dependent on sales activity that itself is dependent on significant capital growth.
Sales and disposals assumptions
5.
The increase in shared ownership is down to two main reasons:
Firstly around half of the increase is the result of taking advantage of commercial opportunities as they have arisen during the year, often involving section 106 deals with developers who have seen the outright sales elements of their projects accelerate and need to release their affordable requirements more quickly than had been planned.
Secondly the changed rent regime resulted in a reduction in the financial viability of affordable rent development schemes. Part of Great Places response was to seek ‘tenure flex’ and switch rented properties to shared ownership on several current mixed tenure schemes. In 2015/16 there were around 20 shared ownership first tranche sales that resulted from tenure flex.
In 2016/17 we have budgeted 179 first tranche sales (spread across 20 schemes, of which 48 result from tenure flex) and in 2017/18 there will be 92 sales (28 resulting from Tenure flex). Sales in subsequent years follow the development programme assumptions (see 5.13). Going forward we would also expect these properties to staircase over a 20 year period from the sixth year after initial sale.
Business plan and budget 2016/2017 | 13

5.12.1 | The interest rate assumptions are amongst the most critical in the plan and have an immediate and substantial impact on the Group’s surplus particularly in the early years of the plan.
5.12.2 | We have had seven years of a record low base rate at 0.50%, with three month LIBOR at around 0.59%. Previous business plans have commented that there is almost unanimity amongst forecasters that the next base rate movement will be upward, with only the timing up for debate. However, currently we have some commentators saying that rates might fall, pointing to the five year swap rate having plummeted to sub 1% - levels unseen since May 2013, and the 10 year swap rate is at its historic low level.
The world economy is uncertain, with slowing growth in China and to a lesser extent Brazil, Russia and even South Africa bringing fears of a global slowdown and continuing record low oil prices.
Having announced a June date for the in/out EU referendum, the possibility of Brexit is real. The G20 referred to it as ‘globally significant’ and Moody’s has stated Brexit would likely lead to a prolonged period of uncertainty, which would “negatively affect investment”.
5.12.3 | To ensure prudence, our plan therefore assumes three month LIBOR rising to 1.75% by the end of 2016/17 (with most of the increase coming in the latter part of the year), and then increasing by 0.50% annually then to reach 4.25% by the end of 2021/22. Rates are then assumed to gradually rise to 5.00% by the end of the plan.
5.12.4 | Coupled with these LIBOR rate rises, the plan also assumes that margins on future short/medium term bank debt will be 1.20%, reflecting the continuing gradual easing in the bank funding market.
5.12.5 | The proportion of fixed debt will be maintained at a minimum of 75% fixed in line with the 2015 approved Treasury policy.
5.12.6 | The Group has put in place funding facilities that will last until March 2021. The Group’s long term undrawn facilities include RBS £50M, Santander £55M and a £60M (£50M undrawn) fully secured revolving facility with RBC that does not expire until November 2018. The expiry dates of the RBS and Santander facilities may need to be renegotiated in order to avoid holding excess cash.
5.12.7 | New funding options will be considered during the early part of 2017/18 to give at least a year’s planning headroom and meet liquidity targets. Future funding is most likely to be sourced initially through the capital markets (a ‘tap’ on the bond).
5.12.8 | Beyond year six of the plan, where the funding source is less obvious, the all-in cost of long term future debt is assumed at 5.20% gradually increasing to 5.75%.
5.13.1 | The business plan fully reflects the remaining elements of the HCA allocations for 2016/17 and 2017/18 which will see a further 557 affordable rented and 203 shared ownership properties completed by the end of March 2018.
Looking ahead, the development environment is far less certain. The November 2015 Comprehensive Spending Review reinforced the Government’s commitment to home
ownership with the vast majority of future funding directed towards shared ownership and starter homes, with very little if anything available for rented products. The funding strategy should also be considered in the context of the new right to buy arrangements and a desire to achieve like for like replacement across the group portfolio.
5.13.2 | The Group will deliver a growing outright sales programme and market rent portfolio through Cube.
Interest rates, debt and development assumptions
5.
Business plan and budget 2016/2017 | 14
• An annual programme of 400 homes, comprising 180 shared ownership properties and 120 rented properties with a further 100 for sale through Cube
• The majority (80) of the rented properties will be right to buy replacement homes, funded primarily from RTB receipts, with the remaining 40 funded through s106 arrangements, recycled grant and internal subsidy. These properties will be let at affordable rents
• The majority of the shared ownership properties (150) will be HCA grant funded (grant rate assumed at 20%) with the remaining 30 being RTB replacement or s106 arrangements
• Scheme costs per unit range from £100k (some s106 arrangements) up to £130k for shared ownership homes (overall average = £126k)

6.1 | Achievement of group financial targets and covenants6.1.1 | SurplusThe annual surplus achieved in this plan grows steadily from £11M in 2016/17 to over £60M by the end of the plan, with a trend that is very similar to that achieved in the October 2015 plan.
6.1.2 | Operating marginThe graph to the right shows the historic and projected operating margin for the Group (surplus before interest as a proportion of turnover – effectively a measure of profitability), and comparative data for the 40-strong Moody’s Peer Group.
The margin has moved from c18% in 2010/11 to almost 35% in 2014/15, moving from a position that was worse than the Peer Group, to one that is now significantly ahead of that group.
We are expecting a slight dip over the next couple of years, at least in part due to the increasing proportion of ‘relatively’ low margin sales activity (the 2016/17 budget shows first tranche sales achieving an 11% margin and outright sales achieving an 18% margin). Moody’s also project a slight dip in operating margins as RPs absorb the impact of the rent reduction.
The importance of maintaining profitability is demonstrated by the adoption of this measure as one of the four golden rules, with a minimum acceptable level of 28% and a target to move towards 38%.
6.1.3 | The business plan shows the margin remaining consistently between 34% - 36% for its first 20 years, after which the margin declines to around 30%. This reflects the changed rental assumption described earlier. However, the plan does not yet incorporate any benefits or cost savings from business transformation, which we expect to start to crystallise in the next two years, and these will be a key driver of margin growth in due course.
Group financial performance
6.
Surplus profile
£70,000
£60,000
£50,000
£40,000
£30,000
£20,000
£10,000
£0Yr1 Yr3 Yr5 Yr7 Yr9 Yr11 Yr13 Yr15 Yr17 Yr19 Yr21 Yr23 Yr25 Yr27 Y29
Operating margin
35%
30%
25%
20%
15%2010/11Actual
2011/12Actual
2012/13Actual
2013/14Actual
2014/15Actual
2015/16Projection
2016/17Budget
October 2015 plan March 2016 plan
Great Places Moodys Peer Group Golden rule
Business plan and budget 2016/2017 | 15

6.1.4 | Interest cover
6.1.5 | Surplus and margin are easily understood measures of financial strength, but neither is a financial covenant. The interest cover ratio (ICR) as shown in the graph below is a financial covenant; is an accounting not a cash based measure.
The results shown in graph 1 excludes all property sales surpluses. The red line represents the latest business plan and largely shows a better result compared to the result in the October plan (black line), particularly in the early years where the 140% golden rule is safely achieved, this not having been the case in October. The decline in performance from around year 20 in both the current plan and the October plan is due to the level of major repair investment which grows sharply in the latter part of the plan period.
Graph 2 shows the same red line but also shows interest cover where ‘sales in the ordinary course of business’ are included in the result (blue line). This is the wording of our bank covenant and means that property sales such as voluntary sales and staircasings can be included. First tranche sales and outright sales through Cube are excluded. Right to buy sales would be expected to fall within the ‘ordinary course of business’ definition, but this might be challenged by the banks, given the introduction of the new policy.
Historically, the red and blue lines have not diverged as much as shown in graph 2, but the increased proportion of shared ownership sales in the development programme will inevitably lead to much greater volumes of staircasing in the later years of the plan, hence pushing up the blue line.
Group financial performance
6.
Graph 1 | Interest cover (excluding property sales)
240%
220%
200%
180%
160%
140%
120%
100%Yr1 Yr3 Yr5 Yr7 Yr9 Yr11 Yr13 Yr15 Yr17 Yr19 Yr21 Yr23 Yr25 Yr27 Y29
October 2015 plan March 2016 plan Golden rule
Graph 2 | Interest cover (including sales)
300%
260%
220%
180%
140%
100%Yr1 Yr3 Yr5 Yr7 Yr9 Yr11 Yr13 Yr15 Yr17 Yr19 Yr21 Yr23 Yr25 Yr27 Y29
March 2016 plan Golden rule March 2016 plan inc prop sales
Business plan and budget 2016/2017 | 16

6.1.6 | Gearing6.1.7 | The Group’s other key financial covenant is gearing.
The gearing ratio compares the Group’s debt to the asset base (measured as housing properties at cost) and has a funding covenant maximum of 65%, and a golden rule set at 55%.
Currently gearing is just over 40%. Concerns around gearing stemmed from the fact that grant funding for new development has reduced considerably, and the effective gearing ratio on each new rented development property is over 80%. Continuing rented development at these scales would clearly see the gearing ratio increase.
The latest business plan includes reduced development and a higher proportion of shared ownership within the development programme, so the debt requirement is reduced. The improved operating margin, combined with increased sales receipts (including from right to buy) means the core business generates significant levels of cash which also benefits the gearing ratio. This is discussed further in the cash flow section 6.3 below.
6.1.8 | Security Exhaustion 6.1.9 | The Group’s position in respect of unencumbered assets has long been recognised as a constraint on the business, particularly on the scale of development deliverable. The existing use value and market value subject to tenancy valuation methodologies have meant that in a low grant regime, every new build property built requires two properties of security in order to access the debt required. In addition all work in progress requires securing, and the work in progress itself cannot be used as security (unlike project based development finance).
For reasons very similar to the improving gearing ratio explained at 6.1.7 above (less rented development, more shared ownership, greater sales receipts, increased core business cash generation), the graph now shows an improving trend. Currently the Group has c1200 unencumbered properties,in addition to having £95M of loans
secured but not yet used. As the plan progresses the number of unencumbered assets grows gradually.
The Group also maintains headroom of £60M of loans secured but not yet used throughout the plan (which represents a further c1600 unencumbered assets).
Group financial performance
6.
Number of unencumbered assets
3,000
2,500
2,000
1,500
1,000
500
0Yr1 Yr2 Yr3 Yr4 Yr5 Yr6 Yr7 Yr8 Yr9 Yr10 Yr11 Yr12 Yr13 Yr14 Yr15 Yr16Yr17 Yr18 Yr19
Gearing
60%
50%
40%
30%
20%
10%
0%Yr1 Yr3 Yr5 Yr7 Yr9 Yr11 Yr13 Yr15 Yr17 Yr19 Yr21 Yr23 Yr25 Yr27 Y29
October 2015 plan March 2016 plan Golden rule
Business plan and budget 2016/2017 | 17

6.2 | Consolidated group I&E summary statement
Group financial performance
6.
6.2.1 | The majority of the figures in the summary I&E statement follow sensible year on year trends, the exception perhaps being the Surplus on Other Property Sales which jumps significantly between year 1 and year2 and then drops again in year 5.
The reason for this is the expected initial volume of right to buy sales (100 pa expected in years 2, 3 and 4) which each generate a modest c£80k sales revenue and c£24k surplus, but when scaled up by 100 such sales, does make a material difference to that line.
Year ended 31st March £000’s
2017Yr1
2018Yr2
2019Yr3
2020Yr4
2021Yr5
2026Yr10
2031Yr15
2036Yr20
2041Yr25
2046Yr30
Income From Lettings
Rent Receivable £71,335.3 £74,378.0 £76,313.5 £78,487.2 £81,117.6 £96,489.8 £110,076.1 £125,811.1 £143,341.1 £166,447.0
Service Charge Income £6,538.0 £6,570.7 £6,694.1 £6,851.9 £7,027.0 £7,968.4 £9,029.6 £10,225.4 £11,572.3 £13,088.8
Less Voids -£981.7 -£959.4 -£950.0 -£943.9 -£970.6 -£1,127.7 -£1,159.5 -£1,300.2 -£1,450.2 -£1,639.1
Management Charge Income £629.2 £632.3 £642.5 £654.0 £667.1 £736.5 £813.2 £897.8 £991.3 £1,094.4
Other Revenue Grants £2,354.4 £1,987.1 £1,702.0 £1,732.6 £1,767.3 £1,951.2 £2,154.3 £2,378.5 £2,626.1 £2,899.4
Other Income £4,908.5 £4,946.7 £5,033.9 £5,133.2 £5,254.2 £5,844.2 £6,514.9 £7,266.2 £6,600.8 £7,287.9
Total Rental Turnover £84.743.7 £87,555.5 £89,436.0 £91,915.0 £94,853.5 £111,862.5 £127,428.6 £145,278.8 £163,681.4 £189,178.4
Management Costs £26,137.9 £26,197.0 £25,787.4 £26,137.6 £26,528.1 £31,024.8 £36,260.6 £42,366.3 £48,718.3 £56,988.3
Service Costs £6,685.5 £6,718.9 £6,842.3 £6,997.9 £7,171.0 £8,099.9 £9,144.6 £10,319.0 £11,502.9 £12,971.5
Routine Maintenance £6,910.5 £6,920.5 £6,981.9 £7,123.0 £7,326.0 £8,850.4 £10,688.9 £12,905.9 £15,578.4 £19,180.2
Planned Maintenance £2,341.4 £2,303.1 £2,372.2 £2,449.2 £2,535.0 £3,010.7 £3,575.8 £4,247.0 £5,044.1 £5,990.8
Major Repairs £4,500.0 £5,252.5 £5,992.0 £5,066.4 £5,950.9 £6,724.4 £8,460.0 £7,898.6 £12,488.8 £14,220.7
Bad Debts £816.2 £1,110.5 £1,533.4 £1,867.0 £2,040.8 £2,383.4 £2,676.5 £3,012.9 £3,372.1 £3,820.6
Depreciation of Housing Properties £10,149.4 £10,136.7 £10,426.3 £10,919.1 £11,371.5 £14,150.5 £15,071.9 £18,351.0 £21,359.5 £26,021.5
Other Costs £30.0 £30.2 £30.6 £31.2 £31.8 £35.1 £38.8 £42.8 £47.3 £52.2
Total Operating Costs £57,567.9 £58,669.7 £59,966.1 £60,591.5 £62,955.1 £74,279.2 £85,917.2 £99,143.5 £118,111.4 £139,245.8
Operating Surplus £27,215.8 £28,885.8 £29,469.9 £31,323.5 £31,898.4 £37,583.2 £41,511.4 £46,135.4 £45,569.9 £49,932.6
Surplus on 1st Tranche & Market Sales & Market Rents
£4,765.6 £4,382.2 £4,690.8 £5,182.7 £5,501.4 £5,741.5 £5,478.8 £5,963.3 £6,418.2 £6,281.9
Surplus on Other Property Sales £1,927.0 £4,511.3 £4,179.0 £4,387.3 £2,788.7 £6,846.6 £11,801.6 £18,732.0 £26,936.6 £38,638.7
Surplus Before Interest and Tax £33,908.4 £37,779.3 £38,339.6 £40,893.5 £40,188.5 £50,171.3 £58,791.8 £70,830.6 £78,924.8 £94,852.9
Interest Collected £148.8 £356.0 £648.8 £787.9 £745.4 £800.0 £800.0 £800.0 £800.0 £800.0
Interest Payable -£22,918.4 -£24,222.9 -£24,555.7 -£24,524.9 -£25,190.2 -£26,722.4 -£26,555.4 -£25,414.8 -£26,833.6 -£31,621.2
Surplus Before Tax £11,138.7 £13,912.4 £14,432.7 £17,156.5 £15,743.7 £24,248.9 £33,036.4 £46,215.8 £52,891.2 £64,031.7
Business plan and budget 2016/2017 | 18

6.3 | Consolidated group cash flow
Group financial performance
6.
Year ended 31st March £000’s
2017Yr1
2018Yr2
2019Yr3
2020Yr4
2021Yr5
2026Yr10
2031Yr15
2036Yr20
2041Yr25
2046Yr30
Operating Activities
Rent £70,800.2 £73,156.5 £74,719.5 £76,629.3 £79,971.0 £95,219.7 £108,918.3 £124,683.1 £142,290.2 £165,435.4
Market Rents £647.6 £968.2 £1,372.8 £1,406.2 £1,638.8 £1,861.8 £2,116.4 £2,410.7 £2,739.6 £2,277.5
Other Income £13,013.4 £12,713.3 £12,607.6 £12,843.3 £13,109.4 £14,527.0 £16,101.4 £17,840.4 £18,286.8 £20,189.9
Cash Received From Customers £84,461.2 £86,838.0 £88,699.9 £90,878.8 £94,719.2 £111,608.5 £127,136.1 £144,944.2 £163,316.6 £187,902.8
Major repairs - revenue spend -£4,500.0 -£5,318.8 -£6,183.2 -£5,386.8 -£6,375.6 -£7,635.7 -£9,396.1 -£8,845.9 -£13,444.1 -£15,146.0
Repairs and Maintenance -£5,552.7 -£5,505.0 -£5,482.9 -£5,592.2 -£5,731.4 -£6,807.1 £8,084.7 -£9,602.1 -£11,404.3 -£13,544.7
Service Costs -£6,327.2 -£6,358.9 -£6,460.6 -£6,576.9 -£6,708.5 -£7,406.7 -£8,177.6 -£9,028.7 -£9,968.4 -£11,005.9
Other Costs -£9,638.0 -£8,968.0 -£8,895.2 -£8,826.9 -£8,577.8 -£9,649.8 -£11,357.7 -£13,320.5 £15,382.5 -£18,157.9
Total Cash paid to suppliers -£26,017.9 -£26,150.7 -£27,021.9 -£26,382.8 -£27,393.3 -£31,499.3 -£37,016.1 -£40,806.2 -£50,199.3 -£57,854.5
Total Cash paid to Employees -£20,864.2 -£21,093.6 -£21,147.3 -£21,391.5 -£22,029.4 -£26,032.5 -£30,918.4 -£36,721.4 -£42,911.3 -£50,965.6
Cash from Operating Activities £37,579.1 £39,593.7 £40,530.7 £43,104.5 £45,296.5 £54,076.7 £59,201.6 £64,416.6 £70,205.7 £79,082.7
Interest Received £148.8 £356.0 £648.8 £787.9 £745.4 £800.0 £800.0 £800.0 £800.0 £800.0
Interest Paid -£24,028.3 -£24,287.2 -£24,808.9 -£25,380.0 -£26,070.8 -£28,070.3 -£28,749.4 -£28,447.9 -£30,790.3 -£36,506.3
Net cash from servicing of finance -£23,879.5 -£23,931.2 -£24,160.1 -£24,592.0 -£25,325.5 -£27,270.3 -£27,949.4 -£27,647.9 -£29,990.3 -£35,706.3
Tax payments -£80.7 -£153.1 -£74.1 -£73.8 -£93.1 -£114.5 -£44.3 -£90.0 -£148.7 -£107.5
Cash generated for investment £13,618.9 £15,509.4 £16,296.5 £18,438.7 £19,877.9 £26,691.9 £31,207.9 £39,678.7 £40,066.7 £43,268.9
Investing Activities
GPHA Rented Development -£33,376.8 -£16,906.4 -£20,068.9 -£20,473.4 -£21,024.2 -£19,601.9 -£24,129.2 -£29,688.9 -£36,523.5 -£44,924.5
GPHA Shared Ownership -£17,076.0 -£18,399.9 -£23,672.4 -£24,445.0 -£25,463.5 -£31,230.7 -£38,307.0 -£46,990.3 -£57,646.5 -£70,724.3
Cube outright sales schemes -£6,076.6 -£5,252.5 -£7,115.1 -£7,394.3 -£7,702.9 -£3,150.2 £0 £0 £0 £0
Cube market rent schemes -£4,512.7 -£4,473.9 £0 -£2,732.2 £0 £0 £0 £0 £0 £0
Major repairs - capital spend -£9,311.4 -£7,493.8 -£8,743.0 -£9,127.2 -£10,990.6 -£12,313.3 -£15,952.5 -£19,048.8 -£29,739.5 -£37,370.6
Purchase of other fixed assets -£800.0 -£804.0 -£816.9 -£831.6 -£848.2 -£936.2 -£1,034.0 -£1,141.6 -£1,260.3 -£1,391.7
First Tranche sales income £8,987.6 £5,008.8 £9,134.9 £10,894.2 £11,366.3 £13,811.3 £16,490.7 £19,621.7 £23,348.8 £27,786.2
Income from outright sales schemes £5,556.5 £10,119.8 £7,914.6 £8,243.2 £8,600.8 £5,434.9 £0 £0 £0 £0
Grants £4,920.0 £4,250.3 £3,973.5 £4,129.2 £4,301.3 £5,275.7 £6,471.5 £7,938.8 £9,739.6 £11,949.8
Sales of existing properties £6,525.0 £14,621.4 £13,541.3 £13,693.6 £8,261.4 £18,777.3 £25,989.5 £34,957.4 £44,196.9 £57,900.0
Net cash from investment activities -£45,164.4 -£19,330.2 -£25,852.0 -£28,043.5 -£33,499.6 -£23,933.1 -£30,471.0 -£34,351.7 -£47,884.5 -£56,775.1
Net cash before financing -£31,545.5 -£3,830.8 -£9,555.5 -£9,604.8 -£13,621.7 -£2,758.8 -£736.9 -£5,327.0 -£7,817.8 -£13,506.2
Financing
Existing loan facilities - drawdowns £34,000.0 £10,000.0 £39,904.0 £20,000.0 £12,000.0
Existing loan facilities - repayments -£3,456.2 -£2,716.7 -£19,751.6 -£13,007.5 -£11,777.1 -£15,618.6 -£17,686.2 -£15,877.0 -£21,959.4 -£737.5
New loan facilities - net drawdowns £0 £0 £0 £0 £1,609.7 £12,859.8 £16,949.3 £10,550.0 £29,777.2 £14,243.7
Net cash before financing £30,543.8 £7,283.3 £20,153.3 £6,992.5 £1,832.6 -£2,758.8 -£736.9 -£5,327.0 £7,817.8 £13,506.2
Opening cash £21,343.7 £20,342.0 £23,804.0 £34,401.8 £31,789.3 £20,000.0 £20,000.0 £20,000.0 £20,000.0 £20,000.0
Net cash flow year -£1,001.7 -£3,462.5 -£10,597.8 -£2,612.3 -£11,789.1 £0 £0 £0 £0 £0
Closing cash £20,342.0 £23,804.0 £34,401.8 £31,789.3 £20,000.0 £20,000.0 £20,000.0 £20,000.0 £20,000.0 £20,000.0
Business plan and budget 2016/2017 | 19

Group financial performance
6.
Business plan and budget 2016/2017 | 20
6.3.1 | The cash flow shows how the Group is able to increase the cash generated from operating activities that is able to fund investment activities. It also shows that the cash required for investing activities drops sharply after the budget year, due particularly in years two to four to a large rise in RTB sales income. The result is that the funding requirements also drop sharply.
6.3.2 | The main driver of new loan facilities is actually to allow capital repayments on existing debt, with overall debt levels being relatively flat after the first four years of the plan.
6.3.3 | The cash flow statement also shows that the fourth golden rule, requiring the major repair investment to be fully funded from operating cash flows is achieved – even in year 30 the major repair capital spend of £37M can be met by the £43M cash generated for investment.

6.4 | Consolidated group balance sheet
Group financial performance
6.
Year ended 31st March £000’s
2017Yr1
2018Yr2
2019Yr3
2020Yr4
2021Yr5
2026Yr10
2031Yr15
2036Yr20
2041Yr25
2046Yr30
Housing assets
Housing properties at cost total £1,222,857.8 £1,250,749.5 £1,286,532.3 £1,323,830.2 £1,368,312.0 £1,573,038.1 £1,815,026.6 £2,099,100.5 £2,471,400.2 £2,918,071.2
Social housing grants -£484,709.3 -£488,368.2 -£492,627.2 -£497,075.9 -£502,564.6 -£529,911.1 -£558,831.1 -£594,141.3 -£638,953.6 -£696,038.6
Other capital grants -£64,250.4 -£64,250.4 -£64,250.4 -£64,250.4 -£64,250.4 -£64,250.4 -£64,250.4 -£64,250.4 -£64,250.4 -£64,250.4
Depreciation -£91,761.3 -£101,803.1 -£112,086.6 -£122,807.1 -£134,066.3 -£197,804.8 -£263,979.8 -£330,800.3 -£388,481.9 -£441,639.4
Net book value of housing properties £582,136.8 £596,327.8 £617,568.1 £639,430.7 £667,430.7 £781,071.8 £924,975.3 £1,109,908.5 £1,379,754.3 £1,716,142.8
Other fixed assets tangible total £6,486.4 £6,653.9 £7,053.1 £7,264.2 £7,333.1 £7,328.3 £7,354.7 £7,410.3 £7,498.3 £7,622.0
Other fixed assets investments £21,236.1 £25,710.0 £25,710.0 £28,442.2 £28,442.2 £28,442.2 £28,379.4 £28,379.4 £27,958.7 £27,958.7
Homebuy loan £9,089.8 £9,089.8 £9,089.8 £9,089.8 £9,089.8 £9,089.8 £9,089.8 £9,089.8 £9,089.8 £9,089.8
Homebuy grant -£9,089.8 -£9,089.8 -£9,089.8 -£9,089.8 -£9,089.8 -£9,089.8 -£9,089.8 -£9,089.8 -£9,089.8 -£9,089.8
Total fixed assets £609,859.3 £628,691.7 £650,331.2 £675,403.2 £703,206.0 £816,842.3 £960,709.4 £1,145,698.2 £1,415,211.3 £1,751,723.5
Current assets
Outright sales schemes - WIP £5,913.3 £2,569.2 £2,676.7 £2,769.8 £2,872.6 £0 £0 £0 £0 £0
Shared ownership current assets £5,914.5 £8,372.7 £9,961.7 £10,613.1 £11,288.3 £14,989.5 £19,459.8 £24,913.5 £31,605.5 £39,817.3
Swap collateral £27,140.1 £27,140.1 £27,140.1 £27,140.1 £27,140.1 £27,140.1 £27,140.1 £27,140.1 £27,140.1 £27,140.1
Cash £20,342.0 £23,804.0 £34,401.8 £31,789.3 £20,000.0 £20,000.0 £20,000.0 £20,000.0 £20,000.0 £20,000.0
Other current assets £9,040.4 £9,883.5 £10,726.5 £11,569.5 £11,569.5 £11,874.5 £11,874.5 £11,874.5 £11,874.5 £11,874.5
Current assets total £68,350.3 £71,769.5 £84,906.8 £83,881.8 £72,870.5 £74,004.1 £78,474.4 £83,928.1 £90,620.1 £98,831.9
Current liabilities total £42,123.8 £42,473.5 £42,740.7 £42,740.9 £42,954.6 £46,539.6 £49,236.4 £50,610.1 £50,801.1 £50,801.1
Net current assets excl pension £26,226.5 £29,295.6 £42,166.1 £41,140.9 £29,915.9 £27,464.5 £29,238.0 £33,318.0 £39,819.0 £48,030.8
Total assest less current liabilities £639,085.8 £657,987.3 £692,497.3 £716,544.1 £733,121.9 £844,306.8 £989,947.4 £1,179,016.2 £1,455,030.3 £1,799,754.3
Outstanding loan balance £531,124.5 £538,407.8 £558,561.1 £565,553.5 £567,386.2 £578,309.3 £578,069.5 £558,043.9 £586,844.9 £635,689.0
Loan fees -£6,836.0 -£6,600.3 -£6,364.6 -£6,128.8 -£5,893.1 -£4,714.5 -£3,535.9 -£2,357.2 -£1,178.6 £0
Other long term creditors £5,382.0 £6,005.2 £5,767.6 £5,503.9 £4,362.3 £1,002.5 £1,388.5 £2,337.7 £2,295.3 £291.4
Net assets £106,415.3 £120,174.6 £134,533.2 £151,615.5 £167,266.5 £269,709.5 £414,025.3 £620,991.8 £867,068.7 £1,163,773.9
Revaluation reserve £2,995.2 £2,995.2 £2,995.2 £2,995.2 £2,995.2 £2,995.2 £2,995.2 £2,995.2 £2,995.2 £2,995.2
Designated reserve £153.1 £153.1 £153.1 £153.1 £153.1 £153.1 £153.1 £153.1 £153.1 £153.1
Retained surplus £103,267.0 £117,026.3 £131,384.9 £148,467.6 £164,118.2 £266,561.2 £410,877.0 £617,843.5 £863,920.4 £1,160,625.6
£106,415.3 £120,174.6 £134,533.2 £151,615.9 £167,266.5 £269,709.5 £414,025.3 £620,991.8 £867,068.7 £1,163,773.9
Business plan and budget 2016/2017 | 21
7.1 | Sensitivity analysis has for many years been a key part of the business planning process. It helps identify key risk variables, how each of them impact the Group’s financial strength, to what scale and how quickly. In recent years the analysis has extended to include multi-variant scenarios. Financial strength has been measured in terms of changes to the Interest Cover covenant.
7.2 | The move to incorporate stress testing is a natural further step. Sensitivity analysis focuses on relativelyminor, often incremental and quite foreseeable change. Stress testing takes this much further, considers more extreme situations and combinations of circumstances with a view to establishing ‘what would break the business?’
7.3 | Having established some stress scenarios, the true test is to then identify the remedial actions that the Board would take to ensure that the organisation’s social housing assets are protected. As such stress testing is a means of ensuring good governance. A seperate stree testing document explains the process that the Group has gone through, who has been involved, and what the key results and actions are.
7.4 | The range of sensitivity analysis historically undertaken has been scaled back a little (the sensitivity analysis remains very helpful in establishing the elements of a stress scenario), but a series of stress scenarios are then considered in more depth in a seperate document.
Sensitivity analysis and stress testing
7.
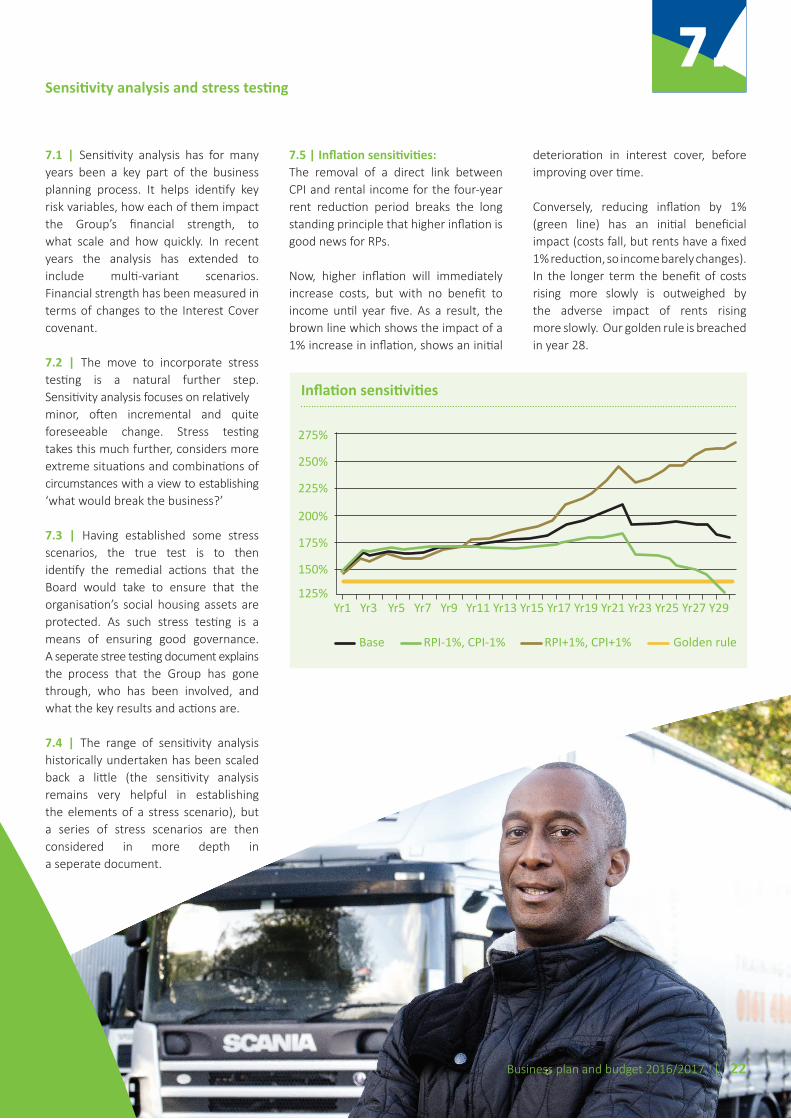
Inflation sensitivities
275%
250%
225%
200%
175%
150%
125%Yr1 Yr3 Yr5 Yr7 Yr9 Yr11 Yr13 Yr15 Yr17 Yr19 Yr21 Yr23 Yr25 Yr27 Y29
Base RPI-1%, CPI-1% RPI+1%, CPI+1% Golden rule
7.5 | Inflation sensitivities:The removal of a direct link between CPI and rental income for the four-year rent reduction period breaks the long standing principle that higher inflation is good news for RPs.
Now, higher inflation will immediately increase costs, but with no benefit to income until year five. As a result, the brown line which shows the impact of a 1% increase in inflation, shows an initial
deterioration in interest cover, before improving over time.
Conversely, reducing inflation by 1% (green line) has an initial beneficial impact (costs fall, but rents have a fixed 1% reduction, so income barely changes). In the longer term the benefit of costs rising more slowly is outweighed by the adverse impact of rents rising more slowly. Our golden rule is breached in year 28.
Business plan and budget 2016/2017 | 22

7.6 | Property prices and development costs: Property prices: While Great Places is determined not to have a business plan dependent on property sales, the increased proportion of development that is shared ownership (with a subsequent increasing pool of properties available for staircasing), and heightened ambitions for outright sale through Cube combine to mean sales do have an impact on interest cover, mainly due to the impact on cash generation.
The graph shows that a 1% reduction in ongoing property price inflation has a modest impact (blue line).
However a one off 35% fall in property prices (brown line) has a far bigger impact (and a significantly bigger impact than in previous plans) with our golden rule breached in year 6.
This is a key factor for stress testing to consider.
Construction inflation:A small increase in annual building price inflation has a gradual impact on interest cover as shown by the brown line with the golden rule breached in year 27.
A sudden one off increase of 10% (blue line) has a larger initial impact, which over the life of the plan ends up very similar to the more gradual inflationary impact with the golden rule breached in year 25. This is a lesser impact than in last year’s plan due to the reduced scale of development.
Additionally, the Group is protected in the first couple of years of the plan because it has fixed price contracts in place for much of its committed development activities, but after that construction costs would increase sharply.
This is also something for stress testing to review.
Sensitivity analysis and stress testing
7.
Property prices
225%
200%
175%
150%
125%
100%
75%
50%
25%Yr1 Yr3 Yr5 Yr7 Yr9 Yr11 Yr13 Yr15 Yr17 Yr19 Yr21 Yr23 Yr25 Yr27 Y29
Base PPI-1% PPI-35% Golden rule
Construction inflation
225%
200%
175%
150%
125%
100%Yr1 Yr3 Yr5 Yr7 Yr9 Yr11 Yr13 Yr15 Yr17 Yr19 Yr21 Yr23 Yr25 Yr27 Y29
Base BPI+1% BPI 10% one off Golden rule
Business plan and budget 2016/2017 | 23

7.7 | Loan repricing:The potential for repricing the Group’s low margin £300M 2007 loan facilities has been recognised as a significant risk for some years. The sensitivity considers a re-price where margins increase by 2% with immediate effect.
A 15% reduction in interest cover is generated by year four, and the 140% golden rule is nearly breached at that point.
Thereafter, the impact grows more slowly as those loans begin to be repaid and form a decreasing proportion of the overall debt portfolio.
There is no covenant breach although by the end of the plan the ratio drops to just below the golden rule threshold. This is certainly something for stress testing to consider.
7.8 | Bad debts double:The business plan already incorporates some very prudent assumptions around the impact of welfare reform, including arrears doubling and bad debts rising from around 1% to c3% over the next four years.
This sensitivity assumes that bad debts are double even that level, rising to 6% by year five. Evidence from the world of Universal Credit is suggesting collection rates of around 90%, it becomes easier to contemplate such levels of bad debt loss.
The impact is immediate and clearly adverse, dropping below the golden rule at year 28, but does not generate a covenant breach.
Sensitivity analysis and stress testing
7.
Loan repricing
225%
200%
175%
150%
125%Yr1 Yr3 Yr5 Yr7 Yr9 Yr11 Yr13 Yr15 Yr17 Yr19 Yr21 Yr23 Yr25 Yr27 Y29
Base Margin increased by 2% Golden rule
Bad debts double
225%
200%
175%
150%
125%
100%Yr1 Yr3 Yr5 Yr7 Yr9 Yr11 Yr13 Yr15 Yr17 Yr19 Yr21 Yr23 Yr25 Yr27 Y29
Base BDs doubled Golden rule
Business plan and budget 2016/2017 | 24

7.9 | Development sensitivities: Development: This sensitivity has assumed the future development programme (ie beyond the current HCA contracts that extend to March 2018) is halved from 300 units per annum to 150 units per annum.
There is a clear improvement in interest cover, although the benefit really only becomes material after 10 years.
This suggests that it is likely that reducing development will be a major factor in improving interest cover in any stress test recovery plan.
This ceasing development graph shows that if the organisation were to cease development as soon as reasonably possible (which is assumed here as being March 2018, when the Group’s existing contractual commitments end – for both GPHA and Cube), then would be able to repay its debts in line with the required repayment schedules.
The chart shows a nil net debt position by year 24, with sufficient cash so that remaining loan facilities can be paid off early.
7.10 | These sensitivities have provided some pointers as to what most affects the Great Places business, and what can be done to mitigate adverse circumstances, and feed neatly into the stress testing analysis seperately available.
Sensitivity analysis and stress testing
7.
Development
350%
300%
250%
200%
150%
100%Yr1 Yr3 Yr5 Yr7 Yr9 Yr11 Yr13 Yr15 Yr17 Yr19 Yr21 Yr23 Yr25 Yr27 Y29
Base Dev Halved Golden rule
Ceasing development
600.0
500.0
400.0
300.0
200.0
100.0
0.0
-100.0
-200.0
-300.0
-400.0
Loans (£M) Cash (£M) Net debt (£M)
Business plan and budget 2016/2017 | 25