Business Plan Eventmisshallshs.weebly.com/uploads/1/2/7/1/127162233/2018_ibp_thom… · 1 F...
30
1 F International Business Plan Event Skyline DECA Skyline High School 1122 228th Avenue Southeast Sammamish, WA, 98075 January 2018 Thomas Cole, Maleka Darvish, Natalia Villamil
Transcript of Business Plan Eventmisshallshs.weebly.com/uploads/1/2/7/1/127162233/2018_ibp_thom… · 1 F...

1
F
International
Business Plan
Event
Skyline DECA
Skyline High School 1122 228th Avenue Southeast
Sammamish, WA, 98075
January 2018
Thomas Cole, Maleka Darvish, Natalia Villamil

2
TABLE OF CONTENTS
I.EXCECUTIVE SUMMARY ...................................................................................................................................... 1
II.ANALYSIS OF THE INTERNATIONAL BUSINESS SITUATION ...................................................................... 4
III. PROBLEM .............................................................................................................................................................. 8
IV. CUSTOMER SEGMENTS ..................................................................................................................................... 9
V. UNIQUE VALUE PROPOSITION ........................................................................................................................ 10
VI. SOLUTION ........................................................................................................................................................... 11
VII. CHANNELS ........................................................................................................................................................ 12
VIII. REVENUE STREAMS ...................................................................................................................................... 13
IX. COST STRUCTURE ............................................................................................................................................ 16
X.DETAILED FINANCIALS ..................................................................................................................................... 20
XI. KEY METRICS .................................................................................................................................................... 22
XII. COMPETITIVE ADVANTAGE ......................................................................................................................... 24
XIII.CONCLUSION ................................................................................................................................................... 25
XIV. BIBILIOGRAPHY ............................................................................................................................................. 26
XV. APPENDIX.......................................................................................................................................................... 27

1
I.EXCECUTIVE SUMMARY
Business Description:
Khila India will be the first subsidiary company of Feeding America, with the goal to combat
extreme malnourishment and poverty. Khila (KEY-LA) means feeding in Hindi-the official
language of the targeted state; Jharkhand- and symbolizes the mission to feed the hungry one person
at a time. During the first three years of investment, the Jharkhand communities of Khunti and
Gumia will be targeted, due to their high poverty and hunger rates. The following graphic illustrates
the basic process that Khila India will take to work towards ending hunger in India.
FARMS DISTRIBUTION CENTER FOOD TRUCKS COMMUNTIES
Opportunity for Investment: India is the ideal country of investment for Khila India due the three
opportunities, as depicted in the table below.
Opportunity Relevance
28.5% of Indians live in poverty. Khila India will deliver food to targeted areas of
poverty in India through our food trucks.
Land in rural India is abundant and inexpensive. Khila India can affordably acquire a distribution
center and farm.
70% of Indians have limited access to quality food. There is a large need for Khila India to provide
Indians with quality food.
Problem/Solution: India is facing multiple problems that could be solved through Feeding America’s
international expansion to India, as displayed in the graphic below.

2
F E E D
Target Market: The food distributed to the rural communities in Jharkhand will have the following primary
and secondary markets:
Channels of Distribution: Khila India will use the following distribution methods to gather and deliver the
food packages to our primary and secondary markets. Our three-step process is explained below.
Unique Value Proposition: Adding Khila India as a subsidiary will increase Feeding America’s brand and
inflows, as portrayed in the acronym FEED below.
Revenue Streams: Khila India will have a similar revenue model as Feeding America. Khila India’s revenue
will come
from
various contributors. These contributions will be used to fund the distribution center and our costs.
Food banks are on trucks to make it
accessible to rural communities
Ethical company feeding malnourished children and families
healthy and inexpensive food
Eco-friendly resources in the distribution
center and for food trucks
Donations and contributions are large,
increasing Feeding America's retained earnings as a whole
Markets
Primary: Families in the villages of Khunti and
Gumia.
Secondary: Schools and institutions in the villages
of Khunti and Gumia
Co
llec
t U
nw
an
ted
P
rod
uce
fro
m
Fa
rmer
s Khila India will connect with local farmers to utilize their excess produce. Since this produce would otherwise go to waste, we are reducing the farmers' cost of disposal and gaining high quality/inexpensive produce. D
istr
ibu
tio
n C
ente
r
The collected produce will be delivered to our energy-sustainable distribution center. At this location, the produce will be cleaned, prepped, cooked and packaged. This distribution center will run on natural resources to lower expenditures and increase productivity.
Fo
od
Tru
ck
Del
iver
y t
o R
ura
l C
om
mu
nit
ies Our electric food trucks will
deliver the cooked food and grocery packages to the targetted communities. We will engage with a multitude of communities each week building relationships with the families and addressing their malnourishment.

3
At the end of the three fiscal years the available balance will be invested into new distribution centers, to maximize the reach of
Khila India’s efforts. The balance will also be available to begin purchasing crops from farmers in the event that their surpluses
decrease due to changing demand and supply in the economy.
As Khila India will be a subsidiary of Feeding America, an investment of $785,000 is requested to finance the international
expansion of the company into India. The projected income, cashflow, balance sheet, and return on investment for the first three
years of operations are shown below.
$0
$2,000,000
$4,000,000
$6,000,000
$8,000,000
$10,000,000
$12,000,000
$14,000,000
$16,000,000
$18,000,000
$20,000,000
Jan
18
Ma
r
Ma
y
Jul
Se
p
Nov
Jan
Ma
r
Ma
y
Jul
Se
p
Nov
Jan
Ma
r
Ma
y
Jul
Se
p
Nov
2018 - 2020
Cash Flow
2018 2019 2020
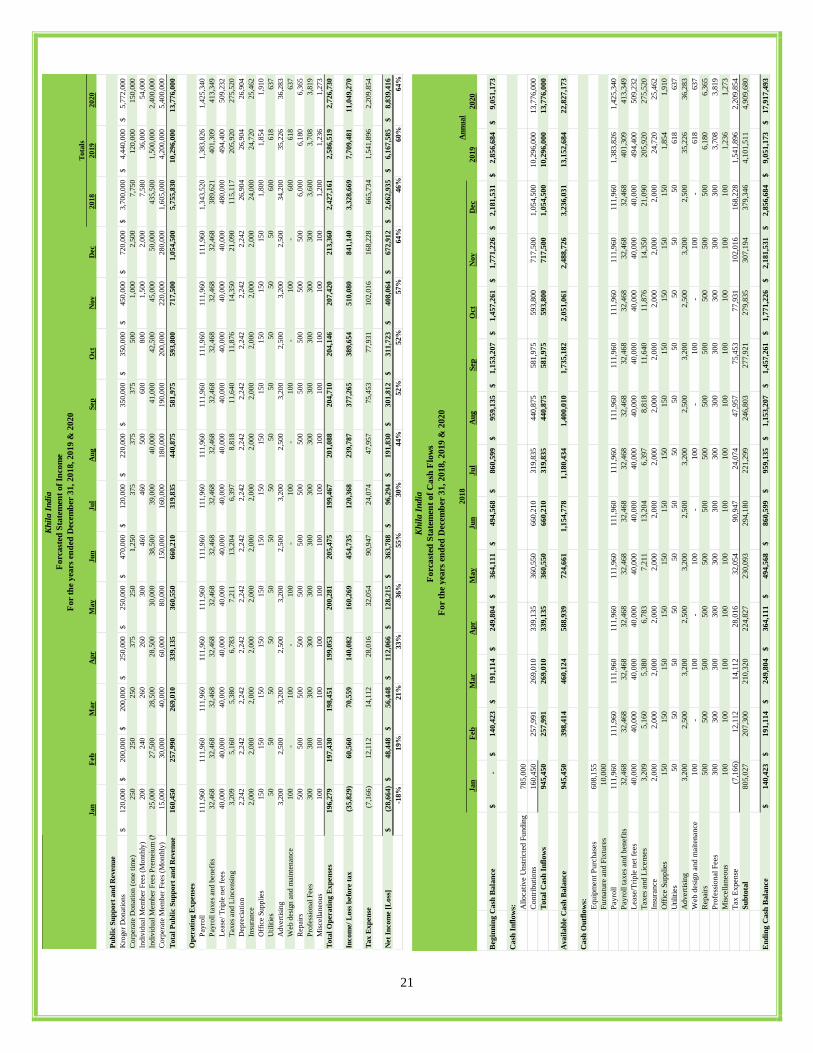
Operating Revenue 5,755,830$ 10,296,000$ 13,776,000$
Operating Expenses 2,427,161$ 2,586,519$ 2,726,730$
Income/ Loss before tax 3,328,669$ 7,709,481$ 11,049,270$
Tax Expense 665,734$ 1,541,896$ 2,209,854$
Net Income [Loss] 2,662,935$ 6,167,585$ 8,839,416$
46% 60% 64%
Forcasted Statement of Income
For the years ended December 31, 2018, 2019 & 2020
Khila India
2018 2019 2020
Beginning Cash Balance -$ 2,856,684$ 9,051,173$
Cash Inflows:
Allocative Unstricted Funding 785,000$ -$ -$
Contributions on Credit 1,398,345$ 2,574,000$ 3,444,000$
Contributions on Cash/Debit 4,357,486$ 7,722,000$ 10,332,000$
Total Cash Inflows 6,540,831$ 10,296,000$ 13,776,000$
Cash Outflows:
Fixed assets 618,155$ -$ -$
Payroll and related 1,733,141$ 1,785,135$ 1,838,689$
Customer acquisition 34,800$ 35,844$ 36,919$
Other 1,298,050$ 2,280,532$ 3,034,072$
Total Cash Outflows 3,684,146$ 4,101,511$ 4,909,680$
Net Cash Flow 2,856,684$ 6,194,489$ 8,866,320$
Ending Balance 2,856,684$ 9,051,173$ 17,917,493$
Khila India
Forecaseted Statement of Cash Flows
For the years ended December 31, 2018, 2019 & 2020
Assets Liabilities
Current Assets: Current Liabilities:
Cash 2,065,809 Accounts payable 13,416
Accounts Receivable 790,875 Other Current Liabilities 45,382
Other Current Assets 58,801 Total Current Liabilities 58,798
Total Current Assets 2,915,485
Net Assets
Fixed Assets 618,155 Unrestricted 785,000
Less: Accumulated Depreciation (26,907) Total Net Assets 785,000
Net Fixed Assets 591,248
Total Liabilities and Net Assets 843,798
Equity
Total Assets 3,506,733$ Retained Earnings 2,662,935
Total Equity 2,662,935
Total Liabilities and Equity 3,506,733$
As of 12/31/2018
Balance Sheet (Statement of Financial Position)
Khila India
Return On Investment
ROI = 𝐺𝑎𝑖𝑛 𝑓𝑟𝑜𝑚 𝐼𝑛𝑣𝑒𝑠𝑡𝑚𝑒𝑛𝑡 − 𝐶𝑜𝑠𝑡 𝑜𝑓 𝐼𝑛𝑣𝑒𝑠𝑡𝑚𝑒𝑛𝑡
𝐶𝑜𝑠𝑡 𝑜𝑓 𝐼𝑛𝑣𝑒𝑠𝑡𝑚𝑒𝑛𝑡 x 100%
Year Cost of
Investment
Gain with Khila
India
Implementation
Return On Investment (%)
2018 $785,000 $3,046,344 298%
2019 $785,000 $6,562,496 736%
2020 $785,000 $9,246,174 1,078%
4
II.ANALYSIS OF THE INTERNATIONAL BUSINESS SITUATION
A. Economic, political and legal analysis of the trading company
1. Describe the trading country’s economic system, economic information important to your proposed
business/product/service, the level of foreign investment in that country
India’s Economic System:
India’s economy is mixed and has several characteristics of a market economy. India tries to change the structure of the
capitalist economy to make it more appropriate for model economy situations. The productive activities in India are divided between
the government (public sector) and the people (private sector). Some examples of industries
that are placed in the public sector include: the basic industries, the capital good industries
and the heavy industries. The light industries and consumer goods industries are placed in the
private sector. In India, almost the entire agricultural sector is under private ownership. 1
This means that Khila India will be able to partner with local, private farms to collect
unwanted food.
India’s Economic Information:
India’s gross domestic product is at 2.264 trillion USD and is exponentially rising. It
is one of the fastest growing economies in the world, despite having the two extremes of
poverty and wealth. Due to the positive, exponential trend of India’s GDP, it is safe to invest
in the country, especially as a non-profit organization. As India’s economy is driven by
agriculture, such stability will provide abundant resources (crops, food) for us to distribute to
those in need.
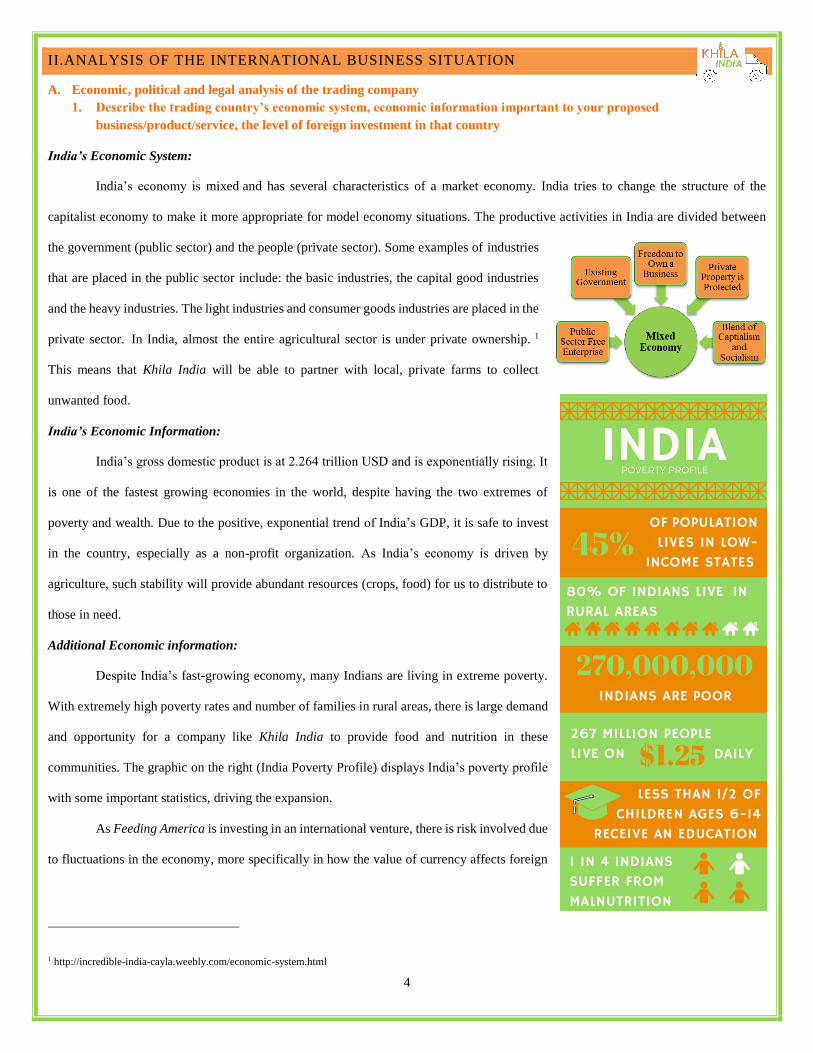
Additional Economic information:
Despite India’s fast-growing economy, many Indians are living in extreme poverty.
With extremely high poverty rates and number of families in rural areas, there is large demand
and opportunity for a company like Khila India to provide food and nutrition in these
communities. The graphic on the right (India Poverty Profile) displays India’s poverty profile
with some important statistics, driving the expansion.
As Feeding America is investing in an international venture, there is risk involved due
to fluctuations in the economy, more specifically in how the value of currency affects foreign
1 http://incredible-india-cayla.weebly.com/economic-system.html

5
trade. If the value of the rupee (Indian currency) goes down, the perceived
financial return of the company in the US will increase, enriching the
value of the investment and vise versa. The unpredictability of Indian
currency is shown on the graph to the right as there are frequent
fluctuations in the value of the rupee. Currently the rupee is valued at
0.016 USD, making it less expensive to start the business venture in India.
2. Describe the trading country’s governmental structure and stability, how the government controls trade and private
business
Governmental Structure of India:
India gained independence in 1947. India’s constitution came into effect in 1950 and promotes the country as “sovereign,
socialist, secular, democratic, republic.” In addition, the Indian Constitution provides three separate entities (similar to the U.S.) for
carrying out the functioning of government: executive, judiciary, and legislative.
The titular head of the executive branch is the president, who is the Head of State
and exercises his authority through his cabinet, which consists of a group of ministers
headed by the Prime Minister. The legislature’s duty is to make policies for the country.
The Parliament consists of two houses: Lok Sabha (“House of People) or the lower house,
and Rajya Sabha (“Council of States”), which is the upper house. The judiciary in India is
unified and divided into three tiers with the Supreme Court at its apex, followed by 21 High
Courts in the states and Lower courts at district levels.2
Governmental Control on Trade and Private Business:
Under the Indian Constitution, the Indian government protects private ownership. The Indian Law establishes clear rights to
private ownership; foreign firms receive the same legal treatment as Indian companies, including government protection of private
sectors. Moreover, the Indian government does not discriminate against private businesses. We can benefit from such freedoms.3
2. Describe laws and/or governmental agencies that affect that affect your business/product/service [i.e., labor laws, trade laws
(U.S.A. and/or Canada and foreign)]
Indian Laws and/or Governmental Agencies:
The latest national agricultural policy of India was announced on 28 July 2000. Its core goal includes equitable inclusive
growth and sustainability in terms of efficient use of resources. The policy incorporates scientific and technological advancement in its
2 http://www.discoveredindia.com/india-at-a-glance/government.htm 3 http://www.state.gov/e/eb/rls/othr/ics/2015/241747.htm
Indian Government
Structure
Executive
LegislativeJudiciary

6
objectives in order to compete globally. Also, it encourages the use of biotechnology for evolving plants that consume less water, are
drought and pest resistant, containing more nutrition, give higher yields and are environmentally safe. Furthermore, it promotes
technology for environmental protection through research undertaken by the government as well as research that are proprietary in
nature. The policy also emphasizes the conservation of bio resources through their ex-situ preservation in Gene Banks and in-situ
preservation in their natural habitat through biodiversity parks and so on. Biomass, organic and inorganic fertilizers, pesticides and
pest management are also promoted. The policy stipulates that the application of frontier sciences should be encouraged.
B. Trade area and cultural analysis
1. Geographic and demographic information, important customs and traditions, other pertinent cultural information,
competitive advantages and disadvantages of the proposed product and/or service
Geographic and Demographic Information:
India is a third world country located South of China and the Middle East. It
measures 1.2 million square feet, equivalent to twice the size of Alaska. The map on
the right displays two thirds of India is surrounded by water, more specifically the
Bay of Bengal and the Arabian Sea.4 India has three main geographic regions: 1) the
mountainous Himalayan region in the northern part of the country, 2) the Indo-
Gangetic Plain (where most of India's large-scale agriculture takes place), and 3) the
plateau region in the southern and central portions of the country.5 There are also
three large river deltas found on the Ganges, Brahmaputra, and Indus Rivers. All these
bodies of water facilitate agriculture by creating fertile land. The presence of a diverse
range of geographical structures in India causes a divide between different regions within the country. This makes it difficult for people
to travel to get food especially if they are of low income or in rural areas. However, this geographic layout is ideal for Khila India as it
provides the opportunity to bring relief to those who do not normally have access due to geographic constraints.
Important Customs/Traditions and Cultural Information:
Indian culture is full of rich customs and traditions. Throughout the year they observe holidays with extravagant festivals and
celebrations. One major holiday is Diwali, a five-day festival known as the festival of lights. The lights lit during the celebration
symbolize the inner light that protects them from spiritual darkness.6 Another important holiday is Holi (shown by the picture on the top
right), it celebrates love with a festival of color7.
4 https://tse1.mm.bing.net/th?id=OIP.vrcMzjIsG_W0unexkCqwugEREs&pid=15.1 5 https://www.thoughtco.com/geography-and-history-of-india-1435046 6 https://www.livescience.com/28634-indian-culture.html 7 https://tse2.mm.bing.net/th?id=OIP.SfESN3tVsUSmOpsR5Z-V9QEsCx&w=281&h=165&c
7
Competitive Advantages and Disadvantages:
After a careful review of the data and analysis previously explained, Khila India has identified a competitive advantage and a
competitive disadvantage, displayed in the following table.
Competitive Advantage Competitive Disadvantages
-Large amount of food in India goes to waste, creating an opportunity
for this food to be redistributed to the hungry
-Millions of people live under the poverty line; therefore, there is a
large market for the services that Khila India provides
-A large portion of the Indian population is in need of aid, and it will be
difficult to focus on a specific area/community
-Due to the conditions of poor sanitation, it will be difficult to maintain
proper health standards throughout our food distribution
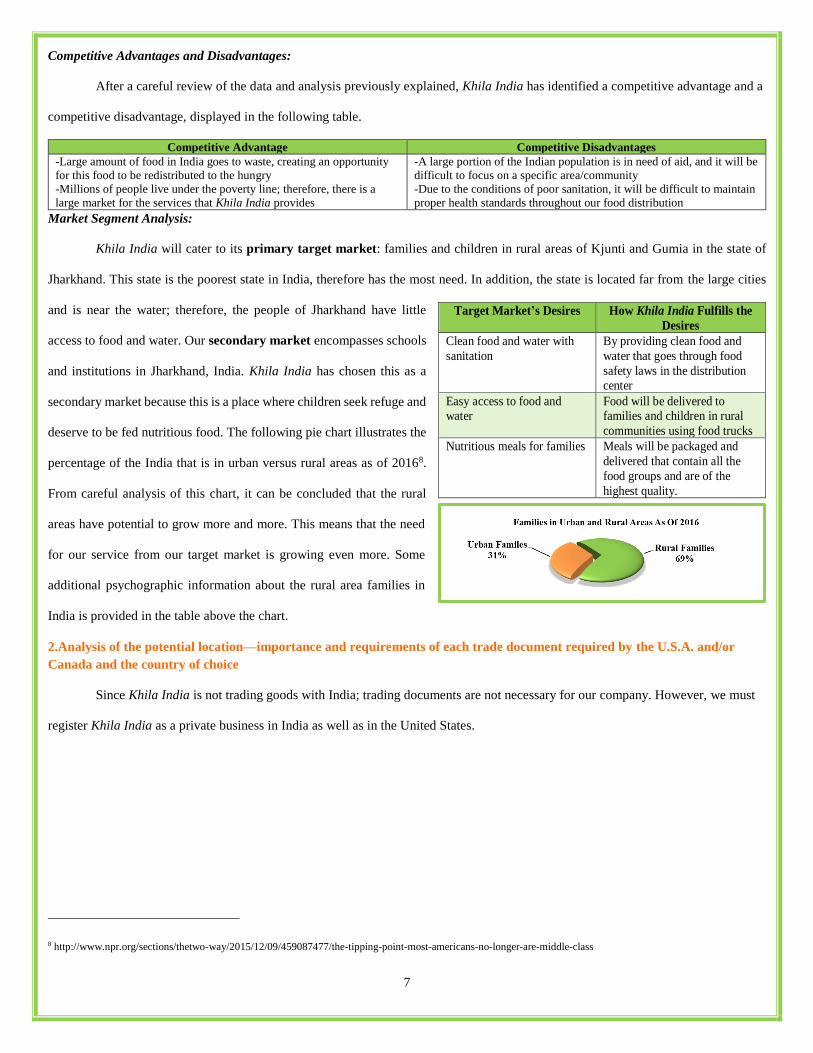
Market Segment Analysis:
Khila India will cater to its primary target market: families and children in rural areas of Kjunti and Gumia in the state of
Jharkhand. This state is the poorest state in India, therefore has the most need. In addition, the state is located far from the large cities
and is near the water; therefore, the people of Jharkhand have little
access to food and water. Our secondary market encompasses schools
and institutions in Jharkhand, India. Khila India has chosen this as a
secondary market because this is a place where children seek refuge and
deserve to be fed nutritious food. The following pie chart illustrates the
percentage of the India that is in urban versus rural areas as of 20168.
From careful analysis of this chart, it can be concluded that the rural
areas have potential to grow more and more. This means that the need
for our service from our target market is growing even more. Some
additional psychographic information about the rural area families in
India is provided in the table above the chart.
2.Analysis of the potential location—importance and requirements of each trade document required by the U.S.A. and/or
Canada and the country of choice
Since Khila India is not trading goods with India; trading documents are not necessary for our company. However, we must
register Khila India as a private business in India as well as in the United States.
8 http://www.npr.org/sections/thetwo-way/2015/12/09/459087477/the-tipping-point-most-americans-no-longer-are-middle-class
Target Market’s Desires How Khila India Fulfills the
Desires
Clean food and water with
sanitation
By providing clean food and
water that goes through food
safety laws in the distribution center
Easy access to food and water
Food will be delivered to families and children in rural
communities using food trucks
Nutritious meals for families Meals will be packaged and
delivered that contain all the
food groups and are of the
highest quality.
8
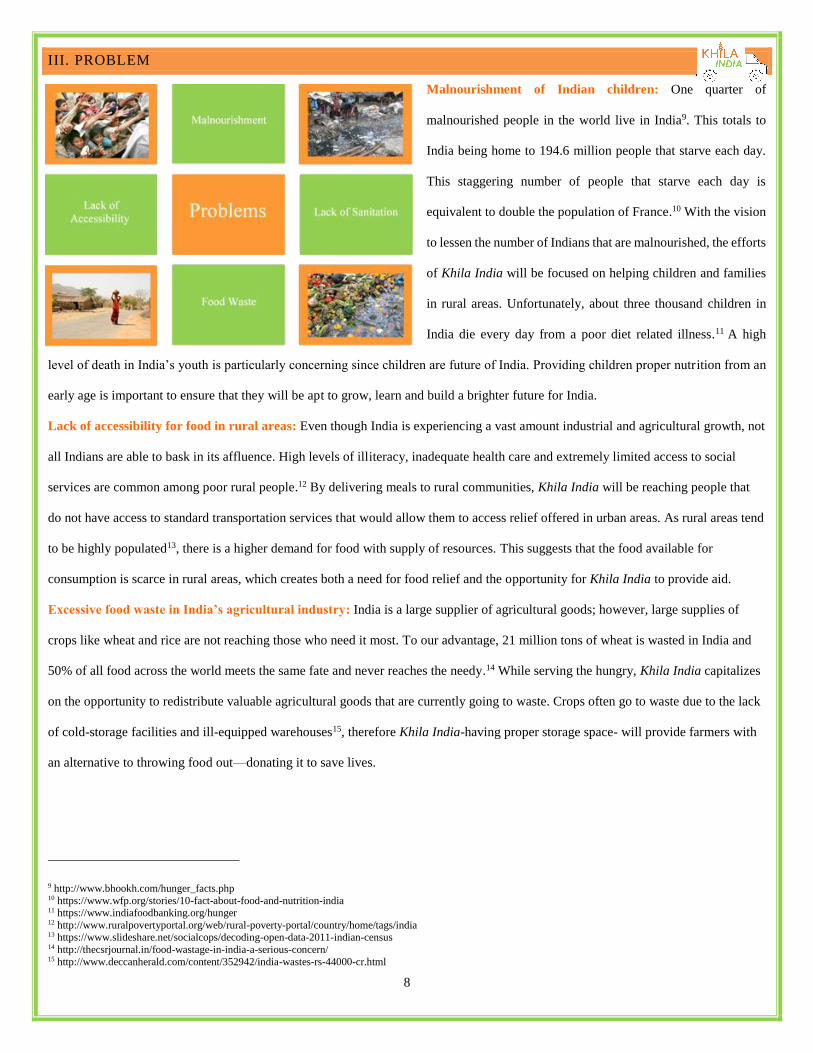
III. PROBLEM
Malnourishment of Indian children: One quarter of
malnourished people in the world live in India9. This totals to
India being home to 194.6 million people that starve each day.
This staggering number of people that starve each day is
equivalent to double the population of France.10 With the vision
to lessen the number of Indians that are malnourished, the efforts
of Khila India will be focused on helping children and families
in rural areas. Unfortunately, about three thousand children in
India die every day from a poor diet related illness.11 A high
level of death in India’s youth is particularly concerning since children are future of India. Providing children proper nutrition from an
early age is important to ensure that they will be apt to grow, learn and build a brighter future for India.
Lack of accessibility for food in rural areas: Even though India is experiencing a vast amount industrial and agricultural growth, not
all Indians are able to bask in its affluence. High levels of illiteracy, inadequate health care and extremely limited access to social
services are common among poor rural people.12 By delivering meals to rural communities, Khila India will be reaching people that
do not have access to standard transportation services that would allow them to access relief offered in urban areas. As rural areas tend
to be highly populated13, there is a higher demand for food with supply of resources. This suggests that the food available for
consumption is scarce in rural areas, which creates both a need for food relief and the opportunity for Khila India to provide aid.
Excessive food waste in India’s agricultural industry: India is a large supplier of agricultural goods; however, large supplies of
crops like wheat and rice are not reaching those who need it most. To our advantage, 21 million tons of wheat is wasted in India and
50% of all food across the world meets the same fate and never reaches the needy.14 While serving the hungry, Khila India capitalizes
on the opportunity to redistribute valuable agricultural goods that are currently going to waste. Crops often go to waste due to the lack
of cold-storage facilities and ill-equipped warehouses15, therefore Khila India-having proper storage space- will provide farmers with
an alternative to throwing food out—donating it to save lives.
9 http://www.bhookh.com/hunger_facts.php 10 https://www.wfp.org/stories/10-fact-about-food-and-nutrition-india 11 https://www.indiafoodbanking.org/hunger 12 http://www.ruralpovertyportal.org/web/rural-poverty-portal/country/home/tags/india 13 https://www.slideshare.net/socialcops/decoding-open-data-2011-indian-census 14 http://thecsrjournal.in/food-wastage-in-india-a-serious-concern/ 15 http://www.deccanherald.com/content/352942/india-wastes-rs-44000-cr.html
9
Lack of Sanitation in rural communities: A large divide between rural and urban areas continues to grow. Cities including Mumbai,
New Delhi, and Kolkata have been experiencing large economic growth and development during the last few years. Meanwhile, rural
areas in India still lack basic sanitation in their food and water. It is estimated that 21 percent of communicable diseases in India are
linked to unsafe water and the lack of hygiene practices.16 A lack of sanitation indicates that the little food that inhabitants of these
rural areas have access to can carry disease and bacteria. Khila India will be providing citizens in this area with food that is healthy
but also free of contamination. It is not only health that is affected by poor sanitation, the economy of India as a whole is impacted due
to the fact that people must pay for visits to the doctor and may lose their jobs because of inability to go to work. Specifically, 73
million working days across the country are lost annually due to sicknesses17. Without working, families are unable to provide for
their children. With nutritious meals from Khila India, Indians living in rural areas will be more apt to work and benefit their
economy.
IV. CUSTOMER SEGMENTS
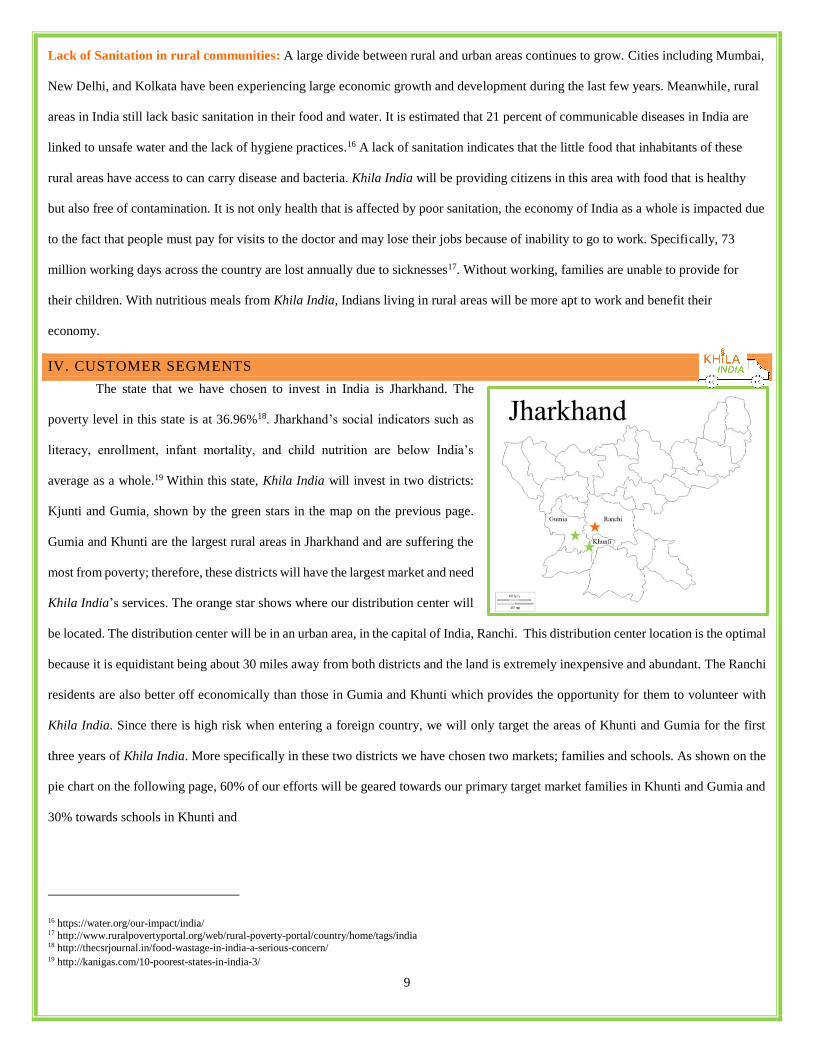
The state that we have chosen to invest in India is Jharkhand. The
poverty level in this state is at 36.96%18. Jharkhand’s social indicators such as
literacy, enrollment, infant mortality, and child nutrition are below India’s
average as a whole.19 Within this state, Khila India will invest in two districts:
Kjunti and Gumia, shown by the green stars in the map on the previous page.
Gumia and Khunti are the largest rural areas in Jharkhand and are suffering the
most from poverty; therefore, these districts will have the largest market and need
Khila India’s services. The orange star shows where our distribution center will
be located. The distribution center will be in an urban area, in the capital of India, Ranchi. This distribution center location is the optimal
because it is equidistant being about 30 miles away from both districts and the land is extremely inexpensive and abundant. The Ranchi
residents are also better off economically than those in Gumia and Khunti which provides the opportunity for them to volunteer with
Khila India. Since there is high risk when entering a foreign country, we will only target the areas of Khunti and Gumia for the first
three years of Khila India. More specifically in these two districts we have chosen two markets; families and schools. As shown on the
pie chart on the following page, 60% of our efforts will be geared towards our primary target market families in Khunti and Gumia and
30% towards schools in Khunti and
16 https://water.org/our-impact/india/ 17 http://www.ruralpovertyportal.org/web/rural-poverty-portal/country/home/tags/india 18 http://thecsrjournal.in/food-wastage-in-india-a-serious-concern/ 19 http://kanigas.com/10-poorest-states-in-india-3/
10
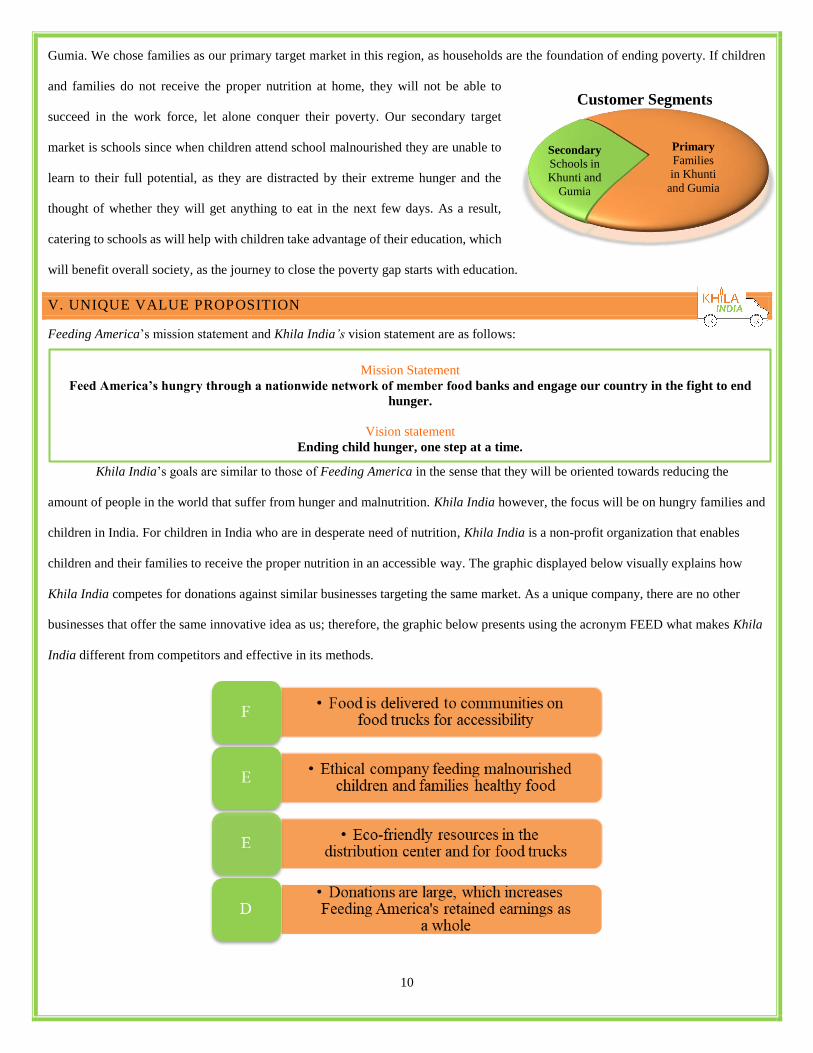
Gumia. We chose families as our primary target market in this region, as households are the foundation of ending poverty. If children
and families do not receive the proper nutrition at home, they will not be able to
succeed in the work force, let alone conquer their poverty. Our secondary target
market is schools since when children attend school malnourished they are unable to
learn to their full potential, as they are distracted by their extreme hunger and the
thought of whether they will get anything to eat in the next few days. As a result,
catering to schools as will help with children take advantage of their education, which
will benefit overall society, as the journey to close the poverty gap starts with education.
V. UNIQUE VALUE PROPOSITION
Feeding America’s mission statement and Khila India’s vision statement are as follows:
Khila India’s goals are similar to those of Feeding America in the sense that they will be oriented towards reducing the
amount of people in the world that suffer from hunger and malnutrition. Khila India however, the focus will be on hungry families and
children in India. For children in India who are in desperate need of nutrition, Khila India is a non-profit organization that enables
children and their families to receive the proper nutrition in an accessible way. The graphic displayed below visually explains how
Khila India competes for donations against similar businesses targeting the same market. As a unique company, there are no other
businesses that offer the same innovative idea as us; therefore, the graphic below presents using the acronym FEED what makes Khila
India different from competitors and effective in its methods.
Mission Statement
Feed America’s hungry through a nationwide network of member food banks and engage our country in the fight to end
hunger.
Vision statement
Ending child hunger, one step at a time.
Secondary
Schools in
Khunti and
Gumia
Primary
Families
in Khunti
and Gumia
Customer Segments

11
VI. SOLUTION
In order to provide food to malnourished families in the communities of Kjunti and Gumia Khila India will be established.
Feeding America is currently an American non-profit who works towards ending hunger by using the strategies shown below.
To offshore their services into India a new branch of Feeding America will be created known as Khila India. Khila India’s
operations will be controlled from the distribution center located in Gumia, Jharkhand. The distribution center will package and
process food from local farms which will then be distributed to rural communities in Gumia and Khunti (refer to section VII for
details). The distribution center will feature a reception center to receive the collected food, a loading dock to load food into the trucks
for delivery, a farm where food will be grown as to have a sustainable food source on site, a food storage center, a kitchen to cook the
necessary food, and a processing center to package the food. The floor plan of the proposed site is on the bottom corner of the page.
The farm will be outdoors but with easy access to the distribution center. There will be employees who focus on the farm daily,
as well as a groundskeeper that will be there daily to track the health of the farm. Grown in the farm will be traditional Indian crops of
wheat, rice and millet as well as seasonal fruits and vegetables that include tomatoes, peppers, gourds, carrots, okra, turnips, and
cauliflower.20 From the farm, food that will be distributed later that day will be cooked in the kitchen while the rest will be stored in the
storage area. There will also be food coming into the reception center from local farms and Indian events. The reception center food will
be inspected to make sure that it is safe to consume, as the food will be discards from other farms or recent celebrations. It will then be
transferred to the storage area or kitchen like the food from the farm. In the processing center the food is sorted into individual packages
so that there is variety and wholesome meals for
families. Once the meals have been packaged, they
will be placed into boxes based on the community
they will be delivered to. From there the boxes will
be loaded into trucks in the distribution center to be
distributed to the communities in need.
20 www.thealternative.in/lifestyle/a-sowing-calendar-for-vegtables-and-fruits-north-and-south-india/

12
The system described in the previous paragraph will be successful due to
the reasons illustrated on the graphic to the right. Our solution to malnourishment
in India will incorporate sustainable and nutritious meals, as food will come from
our own farm in the distribution center as well as left over crops from local farms
and food from events. It will be healthy since as food goes through the Khila India
distribution center it will be checked against disease and contamination which is
something that can be found in the food that people in rural communities typically
have access to. The distribution center will be green, as it will operate from the
energy generated from solar panels instead of conventional electricity. Our meals
will be accessible, as food will be distributed directly to those who need it rather than of those who are malnourished having to seek out
transportation to reach relief themselves. Khila India will be resourceful too as we will obtain part of the produce from discards of
weddings and farms which is food that would otherwise accumulate in landfills. Lastly, Khila India will be valuable as it will provide a
service to the Indian community by providing food to those in need. And while services like these might be available in urban areas in
India, Khila India will be the first to offer the proper nutrition to Indians in rural areas who are in need.
VII. CHANNELS
Khila India will exploit three channels: a farm, a distribution center, and a food truck delivery system.
Khila India will follow the system on the graphic above to ensure food is delivered to families and children in each
community on a weekly basis. Khila India is set up for high efficiency and productivity by only having three channels of distribution.
These attributes—productivity and efficiency—will be the key to success for the business. To inform the communities when we will
be delivering, we will use the community bulletin boards. This operation system will ensure that Khila India will be of success to the
communities and reach our goal of working to end malnourishment.
Collect Unwanted
Produce from Farmers
• Khila India will connect with local farmers to utilize their excess produce. Since this produce would otherwise go to waste, we are reducing the farmers' cost of disposal and gaining high quality/inexpensive produce.
Distribution Center
• The collected produce will be delivered to our energy-sustainable distribution center. At this location, the produce will be cleaned, prepped, cooked and packaged. This distribution center will run on natural resources to lower expenditures and increase productivity.
Food Truck Delivery to
Rural Communities
• Our electric food trucks will deliver the cooked food and grocery packages to the targetted communities. We will engage with a multitude of communities each week building relationships with the families and addressing their malnourishment.
Khila India
Green
Resourceful
Healthy
Accessible
Sustainable
Valuable

13
VIII. REVENUE STREAMS
A. What is the revenue model?
Khila India’s revenue will be derived from different types of donations provided by both individuals and corporations. Donations
are one time or monthly payments to accommodate donator’s preferences.
*Note Khila India will not accept temporary or permanently restricted donations due to the restriction related to the donation
Kroger Donations are collected from Kroger stores in the US by donations that customers provide as they check out. The
effectiveness of Kroger Donations will be further explained on pg. 19. General Donations are provided by small public and private
companies and are a one-time payment of $25USD. Individual Members are people in India and other countries who contribute through
a $2USD monthly donation. Individual Premium Members provide $50USD every month and Corporate Members provide $200USD
every fiscal quarter both individual premium members and corporate members will receive special recognition from the organization.
All members will commit to a year of membership while paying monthly payments of their corresponding values based on the type of
membership. These prices can be justified as higher-class individuals in India earn an average of $120,000-$600,000 a year, which
gives them higher disposable income that can be used to support Khila India, and its vision. Additionally, with multiple forms of
donations individuals and corporations can choose the payment plan that accommodates their income the best. By contributing to Khila
India’s mission corporations will be able to practice their corporate social
responsibility which creates brand loyalty and a positive company image.
The positioning map on the right compares Khila India to its
competitors, as mentioned in Section V. Khila India has two main
competitors in India: Pardon India and India Food Banking Network. These
companies are working to end hunger in India through various methods,
including education of farmer and the establishment of food banks.
Revenue Stream Employment
25%
35%5%
15%
20%
Kroger
Donations
General
Donations
Individual
Members
Individual
Premium
Members
Corporate
Members
1.Kroger Donations
•One time 1USD donations at US Kroger Store checkout
1.General Donations
•One time payment of 25 USD by individuals/corporations
1.Individual Member Fees
•Monthly payments of 2USD by individuals
1.Individual Member
Premium Fees
•Monthly payments of 50USD by individuals
1.Corporate Member Fees
•Monthly payments of 200USD by large corporations

14
This positioning map places Khila India ranked higher than its competitors for both status and effectiveness. The status is
based off how well the donators are treated by each company and the recognition that they are given. The effectiveness is derived
from how successful the services are towards ending hunger. Pardon India is placed on the less effective side with low status because
it does not reach a wide variety of Indians when distributing food and does not give recognition to their sponsors. Also, India Food
Banking Network is somewhat effective because it has set up food banks throughout India, but the target market has little access to
them. India Food Banking Network, also, does not give much recognition to those who have donated. However, a limitation of this
positioning map is that there is bias when creating the map.
B. What is the life time value?
Not all of Khila India’s revenue streams contribute equally to the revenue. To quantify each revenue stream’s
contribution, the following table shows each stream’s life time value:
Lifetime Values
Cost of
Donation ($)
Times Donation
Occurs Per Year
Annual
Cost ($)
Years as
Contributor
Life Time Value
Per Contributor
Total number of
Contributors
Life Time Value
($)
Kroger Donator 1 2 2 5 10 5,990,000 50,990,000
General Donators 25 2 25 6 150 310 46,500
Individual Member 2 12 24 7 168 1,000 168,000
Individual Premium
Member
50 12 600 3 1,800 1,000 1,800,000
Corporate Member 200 12 24,000 3 72,000 1,400 100,800,000
The life time value of type of contributor was derived by multiplying the value of the
donation by the number of times the donation occurs in a year by the number of years the
contributor is expected to continue donating to Khila India. The total life time value was then
found by multiplying the contributor life time value by the total number of contributors of that
type for the total number of years. For details on the different types of contributors and donation
costs refer to previous section VIII A. For details on the number of contributors for each revenue
stream refer to the next section VIII C. As shown above the revenue stream with the largest life time value are corporate members, this
is due to the large annual contribution and the larger number of corporate members. The next largest life time value are individual
donors, even though their donation is the smallest due to the massive number of contributors in this stream they add to the company’s
life time value. Next are individual premium members, similarly to the corporate members their large annual contribution and contributor
number totals up to a significant life time value. Next would be individual members which even though they have the same number of
contributors as the premium members they provide a smaller annual donation which results in a smaller life time value. This disparity
in contribution between premium and normal members justifies premium members receiving additional benefits like being recognized
by Khila India. The smallest life time value is produced by the general donors as their donation only occurs once a year. The graph on
previous page (life time value percents) corner shows what percentage of the total life time value is provided by each revenue stream.
15
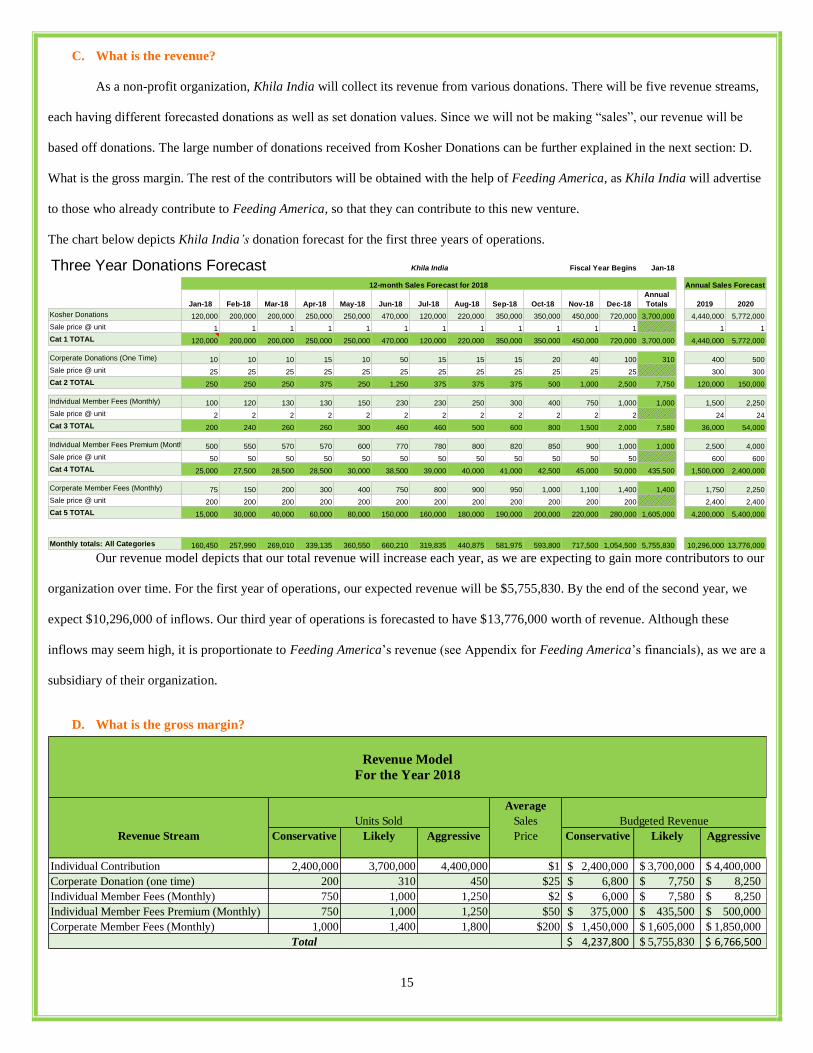
C. What is the revenue?
As a non-profit organization, Khila India will collect its revenue from various donations. There will be five revenue streams,
each having different forecasted donations as well as set donation values. Since we will not be making “sales”, our revenue will be
based off donations. The large number of donations received from Kosher Donations can be further explained in the next section: D.
What is the gross margin. The rest of the contributors will be obtained with the help of Feeding America, as Khila India will advertise
to those who already contribute to Feeding America, so that they can contribute to this new venture.
The chart below depicts Khila India’s donation forecast for the first three years of operations.
Our revenue model depicts that our total revenue will increase each year, as we are expecting to gain more contributors to our
organization over time. For the first year of operations, our expected revenue will be $5,755,830. By the end of the second year, we
expect $10,296,000 of inflows. Our third year of operations is forecasted to have $13,776,000 worth of revenue. Although these
inflows may seem high, it is proportionate to Feeding America’s revenue (see Appendix for Feeding America’s financials), as we are a
subsidiary of their organization.
D. What is the gross margin?
Average
Sales
Conservative Likely Aggressive Price Conservative Likely Aggressive
2,400,000 3,700,000 4,400,000 $1 2,400,000$ 3,700,000$ 4,400,000$
200 310 450 $25 6,800$ 7,750$ 8,250$
750 1,000 1,250 $2 6,000$ 7,580$ 8,250$
750 1,000 1,250 $50 375,000$ 435,500$ 500,000$
1,000 1,400 1,800 $200 1,450,000$ 1,605,000$ 1,850,000$
4,237,800$ 5,755,830$ 6,766,500$
Revenue Model
For the Year 2018
Corperate Donation (one time)
Total
Units Sold Budgeted Revenue
Revenue Stream
Individual Contribution
Individual Member Fees (Monthly)
Individual Member Fees Premium (Monthly)
Corperate Member Fees (Monthly)
Three Year Donations Forecast Khila India Fiscal Year Begins Jan-18
Jan-18 Feb-18 Mar-18 Apr-18 May-18 Jun-18 Jul-18 Aug-18 Sep-18 Oct-18 Nov-18 Dec-18
Annual
Totals 2019 2020
Kosher Donations 120,000 200,000 200,000 250,000 250,000 470,000 120,000 220,000 350,000 350,000 450,000 720,000 3,700,000 4,440,000 5,772,000
Sale price @ unit 1 1 1 1 1 1 1 1 1 1 1 1 1 1
Cat 1 TOTAL 120,000 200,000 200,000 250,000 250,000 470,000 120,000 220,000 350,000 350,000 450,000 720,000 3,700,000 4,440,000 5,772,000
Corperate Donations (One Time) 10 10 10 15 10 50 15 15 15 20 40 100 310 400 500
Sale price @ unit 25 25 25 25 25 25 25 25 25 25 25 25 300 300
Cat 2 TOTAL 250 250 250 375 250 1,250 375 375 375 500 1,000 2,500 7,750 120,000 150,000
Individual Member Fees (Monthly) 100 120 130 130 150 230 230 250 300 400 750 1,000 1,000 1,500 2,250
Sale price @ unit 2 2 2 2 2 2 2 2 2 2 2 2 24 24
Cat 3 TOTAL 200 240 260 260 300 460 460 500 600 800 1,500 2,000 7,580 36,000 54,000
Individual Member Fees Premium (Monthly) 500 550 570 570 600 770 780 800 820 850 900 1,000 1,000 2,500 4,000
Sale price @ unit 50 50 50 50 50 50 50 50 50 50 50 50 600 600
Cat 4 TOTAL 25,000 27,500 28,500 28,500 30,000 38,500 39,000 40,000 41,000 42,500 45,000 50,000 435,500 1,500,000 2,400,000
Corperate Member Fees (Monthly) 75 150 200 300 400 750 800 900 950 1,000 1,100 1,400 1,400 1,750 2,250
Sale price @ unit 200 200 200 200 200 200 200 200 200 200 200 200 2,400 2,400
Cat 5 TOTAL 15,000 30,000 40,000 60,000 80,000 150,000 160,000 180,000 190,000 200,000 220,000 280,000 1,605,000 4,200,000 5,400,000
Monthly totals: All Categories 160,450 257,990 269,010 339,135 360,550 660,210 319,835 440,875 581,975 593,800 717,500 1,054,500 5,755,830 10,296,000 13,776,000
12-month Sales Forecast for 2018 Annual Sales Forecast

16
As shown on the previous page, the largest source of donations for Khila India will be Kroger Donations, due to the large quantity
of projected donators in the revenue stream. There are 2,700 Kroger stores in the US, however it is expected that only 7.5% of these
stores will participate due to the operational changes required to collect donations for Khila India. This reduces the number of
participating stores to 1,900 The average number of transactions that occur in an individual Kroger store daily are 2,500 however it is
likely that the conversion rate for donations will be 2% as most Kroger store customers will not want to donate. After taking the
conversion rate into account only 50 daily transactions will lead to a Kroger Donation. In the table below, the information generated
above is used to calculate the total number of contributions received from Kroger Stores annually.
Kroger Donation Contributor Calculations
Daily Number of Contributing
Transactions Per Store
Annual Contributing
Transactions Per Store
Number of Stores Total Number of Kroger
Donation Contributions
50 18,250 203 3,695,220
*Please note that for the purpose of making the financial statements clear the number of contributions will be rounded to 3,700,000.
IX. COST STRUCTURE
A. What are the customer acquisition costs?
Customer (donator) acquisition costs for Khila India will include the costs associated with obtaining and retaining contributors and
volunteers will be included. This is because both stakeholders are essential for the success and efficiency of the company. Overall
customer acquisition is an integral part of the business as without the support of others Khila India would not be able to operate. The
Gantt chart below illustrates the promotional activities scheduled for the year 2018.
Online ads will be posted on websites like Paytm, and google which are frequented by middle to upper class Indians who are the
ideal target for contributors21. Celebrity endorsements will be used throughout our advertisements to persuade people into donating to
Khila India. This idea of ethos will be further developed by the chosen celebrity posting on social media about the organization.
Magazine ads will be used in the popular Indian magazine India Today to attract individual contributors and the magazine Business
India to attract corporate contributors. Emails will be sent to major corporations in the area and individuals to increase the number of
21 https://www.alexa.com/topsites/countries/IN

17
contributors. Promotional items in the form of stickers with the Khila India logo will be distributed to
volunteers after they come help at the distribution center. These items will generate word of mouth promotion
and are relatively inexpensive. Emails will be sent to people living near the distribution center to alert them
about this volunteer opportunity. Organizations like local churches and schools will be notified via phone about
Khila India and its mission since these organizations often look for non-profits like Khila India to support in
their volunteer efforts. A website will be useful as it will provide information on how to donate, how to volunteer, and general
information about Khila India and its mission. A social media page will also be created to show what is being done to solve child hunger
in India. The total costs of the customer acquisition methods described above for both contributors and volunteers are shown in the table
below, the yearly cost will be $34,800, for promotional activities including website development and maintenance.
Customer Acquisition Costs
Method Associated Activities One Time Cost Frequency Total Cost
Online Advertisements Developing Ads, and
putting them on websites
$700 Bi-weekly $16,800
Celebrity Endorsements Paying them to post on
social media
$1,000 Monthly $12,000
Emails
Sending them to potential
individual/corporate
contributors and volunteers
$800 Bi-monthly $4,800
Promotional Items Stickers with logo to
distribute to volunteers
$100 (for 500units) Bi-monthly $600
Website Website maintenance $100 Bi-Monthly $600
Organizations
Phone calls to
organizations to promote
volunteering
$0 Weekly $0
Social Media
Creating and managing
Instagram and Facebook
page
0 Weekly $0
Total Customer Acquisition Costs $34,800
B. What are the distribution costs?
Below are three primary distribution costs that Khila India will incur. As mentioned in Section VII, we will have three
channels of distribution; therefore, we will have three costs of distribution.
Distribution Costs for Khila India
Activity Cost Description Monthly Cost 2017 Cost 3-Year Cost
Collect Unwanted
Produce From Farmers
Khila India will collect produce waste from local
farms
$30 electric $900 $2,700
Distribution Center The collected produce will be delivered to our
energy-sustainable distribution center.
$30 electric $900 $2,700
Food Truck to Rural
Communities
Our electric food trucks will deliver the cooked food
and grocery packages to the targeted communities
from the distribution center.
$500 electric $6,000 $18,000
Totals N/A $560 $7,800 $23,400

18
C. What are the human resource costs?
In order for Khila India to successfully feed hungry families and children throughout Jharkhand, India, we will need a multitude
of employees. This organization is quite complex and there are many working parts to it. The organizational chart below illustrates the
different components and employees involved in the running of the business.
As a subsidiary of Feeding America, Khila India will have numerous human resource personnel. Due to this, Khila India will
need a human resource manager to manage all of the departments and employees. We will have one financial officer who will take
account of all financial decisions and payments. As a new subsidiary, it we must keep a strict budget with our spending and keep a
close eye on our financials. The community outreach director will conduct marketing campaigns to connect with donators and the
affected communities. It is also essential to have a supply chain manager in order to keep the farm, trucks, and distribution center
operating properly. The farm manager will connect with local farms to collect food waste as well as manage the distribution center
farm. We will need farmers to harvest the crops in our distribution center. It is essential to have truck managers to map out the truck
driver’s routes, connect them with communities, and make sure the trucks are in proper condition. The distribution center manager is
needed to properly operate the center. They will oversee the cooks, who will cook the crops from the farm, the janitor, who will make
sure the distribution center meets food safety standards, and the food packagers, who will package the cooked food into meals to be
sent off to the rural communities. With these working pieces, Khila India can successfully feed families and children in rural areas of
Jharkhand. As Khila India grows and gains more revenue the number of employees and their salaries will adjust to fill new needs of
the business.
Feeding America Khila India
PresidentVP of Human
ResourcesVP of
Operations
Farm Manager
Farmer (x3)
Supply Chain Manager (x1)
Truck Manager (x3)
Truck Driver (x5)
Distribution Center
Manager (x2)
Distribution Center
Manager (x2)
Cook (x5)
Janitor (x2)
Food Packagers (x10)
Vp of FinanceCommunity
Outreach Director
Khila India- Organizational Structure

19
The table below shows the projected salaries and benefits of Khila India for the first year of operations.
Employees at Khila India will be obtained from local area of Jharkhand and will be joined by current Feeding America
employees that know the business model, and will serve as managers. The right section of the table shows the total compensation for
each of our employees, not including contractors. From this table, we can conclude how much we will be paying each of our
employees annually. Our annual payroll expense will cost us $1,343,520. The section on the left of the table displays the employer-
related taxes and the benefit rate for each employee. It shows the total salary burden for our employees on Khila India is $389,620.
Furthermore, the employees will pay 9% of their annual salary as an employment tax to the local and federal government. Lastly, each
employee will have an additional 21% for his or her benefits.
Position
Rate Per
Hour, Per
Employee
Average Hours
Per Month, Per
Employee (Hours)
Average Monthly
Payroll Expense Per
Employee ($)
Total Annual
Payroll Expense
Per Employee ($)
Cumulative
Payroll Tax
(%)
Cumulative
Benefit
Rate (%)
Total Salary
Burden ($)
President $50 170 $8,500 $102,000 9% 21% $29,580
VP of Finance $48 170 $8,160 $97,920 9% 21% $28,397
VP of Operations $46 170 $7,820 $93,840 9% 21% $27,214
VP of Human Resources $42 160 $6,720 $80,640 9% 21% $23,386
General Manager #1 $38 160 $6,080 $72,960 9% 21% $21,158
General Manager #2 $38 160 $6,080 $72,960 9% 21% $21,158
Distribution Center Manager #1 $34 160 $5,440 $65,280 9% 21% $18,931
Distribution Center Manager #2 $34 160 $5,440 $65,280 9% 21% $18,931
Community Outreach Director $30 160 $4,800 $57,600 9% 21% $16,704
Farm Manager $25 140 $3,500 $42,000 9% 21% $12,180
Farmer #1 $16 120 $1,920 $23,040 9% 21% $6,682
Farmer #2 $16 120 $1,920 $23,040 9% 21% $6,682
Farmer #3 $16 120 $1,920 $23,040 9% 21% $6,682
Truck Manager #1 $20 120 $2,400 $28,800 9% 21% $8,352
Truck Manager #2 $20 120 $2,400 $28,800 9% 21% $8,352
Truck Manager #3 $20 120 $2,400 $28,800 9% 21% $8,352
Truck Driver #1 $13 160 $2,080 $24,960 9% 21% $7,238
Truck Driver #2 $13 160 $2,080 $24,960 9% 21% $7,238
Truck Driver #3 $13 160 $2,080 $24,960 9% 21% $7,238
Truck Driver #4 $13 160 $2,080 $24,960 9% 21% $7,238
Truck Driver #5 $13 160 $2,080 $24,960 9% 21% $7,238
Cook #1 $20 120 $2,400 $28,800 9% 21% $8,352
Cook #2 $20 120 $2,400 $28,800 9% 21% $8,352
Cook #3 $20 120 $2,400 $28,800 9% 21% $8,352
Cook #4 $20 120 $2,400 $28,800 9% 21% $8,352
Cook #5 $20 120 $2,400 $28,800 9% 21% $8,352
Janitor #1 $13 160 $2,080 $24,960 9% 21% $7,238
Janitor #2 $13 160 $2,080 $24,960 9% 21% $7,238
Food Packager #1 $11 90 $990 $11,880 9% 21% $3,445
Food Packager #2 $11 90 $990 $11,880 9% 21% $3,445
Food Packager #3 $11 90 $990 $11,880 9% 21% $3,445
Food Packager #4 $11 90 $990 $11,880 9% 21% $3,445
Food Packager #5 $11 90 $990 $11,880 9% 21% $3,445
Food Packager #6 $11 90 $990 $11,880 9% 21% $3,445
Food Packager #7 $11 90 $990 $11,880 9% 21% $3,445
Food Packager #8 $11 90 $990 $11,880 9% 21% $3,445
Food Packager #9 $11 90 $990 $11,880 9% 21% $3,445
Food Packager #10 $11 90 $990 $11,880 9% 21% $3,445
Totals $794 4400 Hours $111,960 $1,343,520 NA NA $389,621
Projected Benefits Projected Salaries

20
D. Additional Costs?
As an organization with an operating distribution center, Khila India will have various fixed assets that will depreciate over
time. The following table displays the depreciation schedule for Khila India’s fixed assets. The depreciation was calculated using the
straight-line method. In this method, each asset depreciates in a linear fashion, as it has the same depreciation expense each year. The
formula used for the straight-line depreciation method is (cost of fixed asset – salvage value)/estimated useful life. The depreciation
schedule shows a $26,907 in annual fixed asset expenses after all the depreciation costs are calculated. The distribution center will be
green and eco-friendly; and will therefore have various additional fixed assets. Although the costs of these may be high, having a
green-company is attractive to our donators as it adds a socially responsible image to the company.
X.DETAILED FINANCIALS
A. Projected Income and Expenses
The forecasted three-year income statement is shown on page 21 and the cash flow statement is shown on page 22. Both financial
statements are formatted in coherence to Feeding America’s financial reports for 2017 to accurately model the finances of a non-profit
business model.
Number Date Cost Value Expense
1 1/4/2018 3,200$ 20 500$ 2,700$ 135$
2 1/4/2018 390$ 20 50$ 340$ 17$
3 1/4/2018 3,786$ 12 500$ 3,286$ 274$
4 1/6/2018 6,198$ 12 1,500$ 4,698$ 392$
5 1/6/2018 8,900$ 20 2,000$ 6,900$ 345$
6 1/6/2018 12,000$ 20 3,000$ 9,000$ 450$
7 1/6/2018 7,302$ 14 2,000$ 5,302$ 379$
8 1/6/2018 1,799$ 15 250$ 1,549$ 103$
9 12/28/2017 20,000$ 20 -$ 20,000$ 1,000$
63,575$ 53,775$ 3,094$
10 12/28/2017 10,000$ 10 2,000$ 8,000$ 800$
11 1/3/2018 360,000$ 30 40,000$ 320,000$ 10,667$
12 1/3/2018 12,080$ 12 2,000$ 10,080$ 840$
13 1/3/2018 22,500$ 30 5,000$ 17,500$ 583$
404,580$ 355,580$ 12,890$
14 1/3/2018 150,000$ 13 8,000$ 142,000$ 10,923$
150,000$ 142,000$ 10,923$
618,155$ 26,907$ Total Fixed Assets
Total Transportation
Furniture and Equipment
Furniture and Equipment
Furniture and Equipment
2x All Electric 2009 Medium Duty eStar Food TruckTransportation
Total Furniture and Equipment
Tesla Solar Panels
Air conditioner
4x Tesla Power Wall
Kitchen Equipment
Kitchen Equipment
AcquisitionFixed Asset
For the Period Beginning January 2018
Fixed Asset and Depreciation Schedule
Khila India
Salvage
Value
Annual Straight Line
Depreciation
Class Description
Life in
Years
2x Commercial, All Electric Range Boiler Top
Commercial, All elctric Double Deck Convection
All Electric 7 ft Grease Hood
Kitchen Cabinets
Tables and Chairs
Total Kitchen Equipment
Kitchen Equipment
Commercial Walk in Freezer by AmeriKooler
Stainless Steel Commercial 3in1 sink
CMA Commerical Dishwasher
2x Commerical Fridgerator
Commercial, All Electric, 10 Burner Range with two
Kitchen Equipment
Kitchen Equipment
Kitchen Equipment
Kitchen Equipment
Kitchen Equipment
Kitchen Equipment
Furniture and Equipment
21
Jan
Feb
Mar
Ap
rM
ay
Ju
nJu
lA
ug
Sep
Oct
Nov
Dec
2019
2020
Begin
nin
g C
ash
Bala
nce
-$
140,4
23
$
191,1
14
$
249,8
04
$
364,1
11
$
494,5
68
$
860,5
99
$
959,1
35
$
1,1
53,2
07
$
1,4
57,2
61
$
1,7
71,2
26
$
2,1
81,5
31
$
2,8
56,6
84
$
9,0
51,1
73
$
Cash
In
flow
s: Allocati
ve U
nst
ricte
d F
undin
g785,0
00
Contr
ibuti
ons
160,4
50
257,9
91
269,0
10
339,1
35
360,5
50
660,2
10
319,8
35
440,8
75
581,9
75
593,8
00
717,5
00
1,0
54,5
00
10,2
96,0
00
13,7
76,0
00
Tota
l C
ash
In
flow
s945,4
50
257,9
91
269,0
10
339,1
35
360,5
50
660,2
10
319,8
35
440,8
75
581,9
75
593,8
00
717,5
00
1,0
54,5
00
10,2
96,0
00
13,7
76,0
00
Avail
ab
le C
ash
Bala
nce
945,4
50
398,4
14
460,1
24
588,9
39
724,6
61
1,1
54,7
78
1,1
80,4
34
1,4
00,0
10
1,7
35,1
82
2,0
51,0
61
2,4
88,7
26
3,2
36,0
31
13,1
52,6
84
22,8
27,1
73
Cash
Ou
tflo
ws:
Equip
ment
Purc
hase
s608,1
55
Furn
atu
re a
nd F
ixtu
res
10,0
00
Payro
ll111,9
60
111,9
60
111,9
60
111,9
60
111,9
60
111,9
60
111,9
60
111,9
60
111,9
60
111,9
60
111,9
60
111,9
60
1,3
83,8
26
1,4
25,3
40
Payro
ll t
axes
and b
enefi
ts32,4
68
32,4
68
32,4
68
32,4
68
32,4
68
32,4
68
32,4
68
32,4
68
32,4
68
32,4
68
32,4
68
32,4
68
401,3
09
413,3
49
Lease
/Tri
ple
net
fees
40,0
00
40,0
00
40,0
00
40,0
00
40,0
00
40,0
00
40,0
00
40,0
00
40,0
00
40,0
00
40,0
00
40,0
00
494,4
00
509,2
32
Taxes
and L
icense
s3,2
09
5,1
60
5,3
80
6,7
83
7,2
11
13,2
04
6,3
97
8,8
18
11,6
40
11,8
76
14,3
50
21,0
90
205,9
20
275,5
20
Insu
rance
2,0
00
2,0
00
2,0
00
2,0
00
2,0
00
2,0
00
2,0
00
2,0
00
2,0
00
2,0
00
2,0
00
2,0
00
24,7
20
25,4
62
Off
ice S
upplies
150
150
150
150
150
150
150
150
150
150
150
150
1,8
54
1,9
10
Uti
liti
es
50
50
50
50
50
50
50
50
50
50
50
50
618
637
Advert
isin
g3,2
00
2,5
00
3,2
00
2,5
00
3,2
00
2,5
00
3,2
00
2,5
00
3,2
00
2,5
00
3,2
00
2,5
00
35,2
26
36,2
83
Web d
esi
gn a
nd m
ait
enance
100
-
100
-
100
-
100
-
100
-
100
-
618
637
Repair
s500
500
500
500
500
500
500
500
500
500
500
500
6,1
80
6,3
65
Pro
fess
ional F
ees
300
300
300
300
300
300
300
300
300
300
300
300
3,7
08
3,8
19
Mis
cellaneous
100
100
100
100
100
100
100
100
100
100
100
100
1,2
36
1,2
73
Tax E
xpense
(7,1
66
)
12,1
12
14,1
12
28,0
16
32,0
54
90,9
47
24,0
74
47,9
57
75,4
53
77,9
31
102,0
16
168,2
28
1,5
41,8
96
2,2
09,8
54
Su
bto
tal
805,0
27
207,3
00
210,3
20
224,8
27
230,0
93
294,1
80
221,2
99
246,8
03
277,9
21
279,8
35
307,1
94
379,3
46
4,1
01,5
11
4,9
09,6
80
En
din
g C
ash
Bala
nce
140,4
23
$
191,1
14
$
249,8
04
$
364,1
11
$
494,5
68
$
860,5
99
$
959,1
35
$
1,1
53,2
07
$
1,4
57,2
61
$
1,7
71,2
26
$
2,1
81,5
31
$
2,8
56,6
84
$
9,0
51,1
73
$
17,9
17,4
93
$
An
nu
al
2018
Kh
ila
In
dia
Fo
rca
sted
Sta
tem
ent
of
Ca
sh F
low
s
Fo
r th
e y
ears
en
ded
Dec
emb
er 3
1, 2
01
8,
20
19
& 2
020
Jan
Feb
Mar
Ap
rM
ay
Ju
nJu
lA
ug
Sep
Oct
Nov
Dec
2018
2019
2020
Pu
bli
c S
up
port
an
d R
even
ue
Kro
ger
Donati
ons
120,0
00
$
200,0
00
$
200,0
00
$
250,0
00
$
250,0
00
$
470,0
00
$
120,0
00
$
220,0
00
$
350,0
00
$
350,0
00
$
450,0
00
$
720,0
00
$
3,7
00,0
00
$
4,4
40,0
00
$
5,7
72,0
00
$
Corp
era
te D
onati
on (
one t
ime)
250
250
250
375
250
1,2
50
375
375
375
500
1,0
00
2,5
00
7,7
50
120,0
00
150,0
00
Indiv
idual M
em
ber
Fees
(Month
ly)
200
240
260
260
300
460
460
500
600
800
1,5
00
2,0
00
7,5
80
36,0
00
54,0
00
Indiv
idual M
em
ber
Fees
Pre
meiu
m (
Month
ly)2
5,0
00
27,5
00
28,5
00
28,5
00
30,0
00
38,5
00
39,0
00
40,0
00
41,0
00
42,5
00
45,0
00
50,0
00
435,5
00
1,5
00,0
00
2,4
00,0
00
Corp
era
te M
em
ber
Fees
(Month
ly)
15,0
00
30,0
00
40,0
00
60,0
00
80,0
00
150,0
00
160,0
00
180,0
00
190,0
00
200,0
00
220,0
00
280,0
00
1,6
05,0
00
4,2
00,0
00
5,4
00,0
00
Tota
l P
ub
lic S
up
port
an
d R
even
ue
160,4
50
257,9
90
269,0
10
339,1
35
360,5
50
660,2
10
319,8
35
440,8
75
581,9
75
593,8
00
717,5
00
1,0
54,5
00
5,7
55,8
30
10,2
96,0
00
13,7
76,0
00
Op
erati
ng E
xp
en
ses
Payro
ll
111,9
60
111,9
60
111,9
60
111,9
60
111,9
60
111,9
60
111,9
60
111,9
60
111,9
60
111,9
60
111,9
60
111,9
60
1,3
43,5
20
1,3
83,8
26
1,4
25,3
40
Payro
ll t
axes
and b
enefi
ts32,4
68
32,4
68
32,4
68
32,4
68
32,4
68
32,4
68
32,4
68
32,4
68
32,4
68
32,4
68
32,4
68
32,4
68
389,6
21
401,3
09
413,3
49
Lease
/ T
riple
net
fees
40,0
00
40,0
00
40,0
00
40,0
00
40,0
00
40,0
00
40,0
00
40,0
00
40,0
00
40,0
00
40,0
00
40,0
00
480,0
00
494,4
00
509,2
32
Taxes
and L
incensi
ng
3,2
09
5,1
60
5,3
80
6,7
83
7,2
11
13,2
04
6,3
97
8,8
18
11,6
40
11,8
76
14,3
50
21,0
90
115,1
17
205,9
20
275,5
20
Depre
cia
tion
2,2
42
2,2
42
2,2
42
2,2
42
2,2
42
2,2
42
2,2
42
2,2
42
2,2
42
2,2
42
2,2
42
2,2
42
26,9
04
26,9
04
26,9
04
Insu
rance
2,0
00
2,0
00
2,0
00
2,0
00
2,0
00
2,0
00
2,0
00
2,0
00
2,0
00
2,0
00
2,0
00
2,0
00
24,0
00
24,7
20
25,4
62
Off
ice S
upplies
150
150
150
150
150
150
150
150
150
150
150
150
1,8
00
1,8
54
1,9
10
Uti
liti
es
50
50
50
50
50
50
50
50
50
50
50
50
600
618
637
Advert
isin
g3,2
00
2,5
00
3,2
00
2,5
00
3,2
00
2,5
00
3,2
00
2,5
00
3,2
00
2,5
00
3,2
00
2,5
00
34,2
00
35,2
26
36,2
83
Web d
esi
gn a
nd m
ain
tenance
100
-
100
-
100
-
100
-
100
-
100
-
600
618
637
Repair
s500
500
500
500
500
500
500
500
500
500
500
500
6,0
00
6,1
80
6,3
65
Pro
fess
ional F
ees
300
300
300
300
300
300
300
300
300
300
300
300
3,6
00
3,7
08
3,8
19
Mis
cellaneous
100
100
100
100
100
100
100
100
100
100
100
100
1,2
00
1,2
36
1,2
73
Tota
l O
perati
ng E
xp
en
ses
196,2
79
197,4
30
198,4
51
199,0
53
200,2
81
205,4
75
199,4
67
201,0
88
204,7
10
204,1
46
207,4
20
213,3
60
2,4
27,1
61
2,5
86,5
19
2,7
26,7
30
Incom
e/
Loss
befo
re t
ax
(35
,82
9)
60,5
60
70,5
59
140,0
82
160,2
69
454,7
35
120,3
68
239,7
87
377,2
65
389,6
54
510,0
80
841,1
40
3,3
28,6
69
7,7
09,4
81
11,0
49,2
70
Tax E
xp
en
se(7
,16
6)
12,1
12
14,1
12
28,0
16
32,0
54
90,9
47
24,0
74
47,9
57
75,4
53
77,9
31
102,0
16
168,2
28
665,7
34
1,5
41,8
96
2,2
09,8
54
Net
Incom
e [
Loss
](2
8,6
64
)$
48,4
48
$
56,4
48
$
112,0
66
$
128,2
15
$
363,7
88
$
96,2
94
$
191,8
30
$
301,8
12
$
311,7
23
$
408,0
64
$
672,9
12
$
2,6
62,9
35
$
6,1
67,5
85
$
8,8
39,4
16
$
-18
%19%
21%
33%
36%
55%
30%
44%
52%
52%
57%
64%
46%
60%
64%
Tota
ls
Kh
ila
In
dia
Fo
rca
sted
Sta
tem
ent
of
Inco
me
Fo
r th
e y
ears
en
ded
Dec
emb
er 3
1,
20
18
, 2
01
9 &
20
20

22
The following table shows the forecasted balance sheet for the first year of operations.
The bottom table depicts the return on investment for the years 2018-2020 showing why Khila India has the potential to positively
contribute to Feeding America’s financial return.
B. Proposed Plan to Meet Capital Needs
As Khila India will be an extension of Feeding America, a loan will not be required as funds will be provided in the form of allocative
unrestricted funding from Feeding America. Because of this Khila India’s retained earnings will be added to those of Feeding America
at the end of the trading period. Feeding America’s detailed financial statements can be found in the appendix for reference.
XI. KEY METRICS
To ensure Khila India reaches the key benchmarks, a series of metrics evaluating our financial and operating positions are
shown on the following page. The key metrics listed above assist Khila India in determining the growth, profitability, and ability to
sustain operations. Through continuous evaluation and improvements of key metrics, Khila India will become an increasingly more
successful subsidiary of Feeding America.
Assets Liabilities
Current Assets: Current Liabilities:
Cash 2,065,809 Accounts payable 13,416
Accounts Receivable 790,875 Other Current Liabilities 45,382
Other Current Assets 58,801 Total Current Liabilities 58,798
Total Current Assets 2,915,485
Net Assets
Fixed Assets 618,155 Unrestricted 785,000
Less: Accumulated Depreciation (26,907) Total Net Assets 785,000
Net Fixed Assets 591,248
Total Liabilities and Net Assets 843,798
Equity
Total Assets 3,506,733$ Retained Earnings 2,662,935
Total Equity 2,662,935
Total Liabilities and Equity 3,506,733$
As of 12/31/2018
Balance Sheet (Statement of Financial Position)
Khila India

23
Khila India – Financial Metrics
Metrics Purpose Calculation Benchmark How to Improve
Profitability (Income Statement):
Revenue Monitor market acceptance
and share
Contribution (See Section
XIII)
2018: $5,755,830
2019: $10,296,000
2020: $13,776,000
Evaluate revenue streams by customer
segment to establish strategies
Gross Profit
Margin (%)
Measures profit from product
sales and ability to cover
operating expenses
(Revenue – Cost of
Goods Sold) / Revenue
N/A Increase sales price
Increase quantity sold
Decrease operating expenses
Net Profit Measures overall
performance including
operating expenses
Gross Profit – Expenses –
Interest – Taxes –
Dividends
N/A Same as gross profit strategies above
Decrease operating expenses
Manage taxes and interest expenses
Efficiency (Balance Sheet):
Return On
Capital
Employed
Measures efficiency of
capital invested
Net Profit / (Lifetime
debt + Equity)
N/A Improve profitability
Pay off debt
Days A/R
Outstanding
Measures time that A/R is
paid
(A/R) / Credit Sales) X
365 Days
< 30 Days Shorten timeframe for customers to pay
back
Days A/P
Outstanding
Measures time that A/P is
paid
Revenue / Number of
Employees
> 30 Days Increase timeframe to payback suppliers
Liquidity:
Working
Capital Ratio
Reveals ability to use liquid
assets to cover short-term
debts
Current Assets / Current
Liabilities
2:1 Invest liquid assets into business
Raise value of current assets
Reduce value of current liabilities
Acid Ratio Measures ability to use quick
assets to pay current
liabilities immediately
(Current Assets – Stock) /
Current Liabilities
1:1 Decrease amount of cash or A/R
Decrease amount of short-term loans or
A/P
Net Cash Flow Cash inflows and outflows
difference
Cash Inflows – Cash
Outflows
2018: $12,679,658
2019: $9,051,173
2020: $17,919,493
Increase revenue
Decrease expenses/costs
Khila India – Operating Metrics
Metrics Purpose Calculation Benchmark How to Improve
Customer:
Lifetime Value Evaluate profitability of a
customer
Average value of
contribution) X (Average
Retention Time)
Kroger Donator:
$10,198,000
General Donator:
$7,750
Individual Member:
$24,000
Individual Premium
Member:
$600,000
Corporate Member:
$33,600,000
Adjust promotion strategies
Customer
Acquisition
Cost
Determine how much
promotional investment is
made to obtain contributors
See Section IX A Must be lower than
lifetime value
Adjust promotion strategies based on
customer segments
Customer
Satisfaction
Score
Reveals contributors
satisfaction with donating to
organization
N/A > 90% Make improvement’s based on
customer feedback and competitor’s strategies
Employees:
Staff Turnover Evaluate employee
engagement strategies
N/A N/A Training, recognition, teamwork, etc.
Employee
Satisfaction
Score
Reveals employees’
satisfaction with working
conditions and make
alterations based on
employee feedback
N/A > 90% Critically evaluate for prioritizing
Keep wellbeing of employees in mind
when decision making
Staff Cost
Ratio
Measures cost of Payroll staff
relative to revenue; determine
how many employees to hire
(Payroll + Payroll Tax) /
Sales
2018: 0.3: 1
2019: 0.2: 1
2020: 0.1: 1
Reduce employee
salaries/wages/benefits
Reduce budget expenses
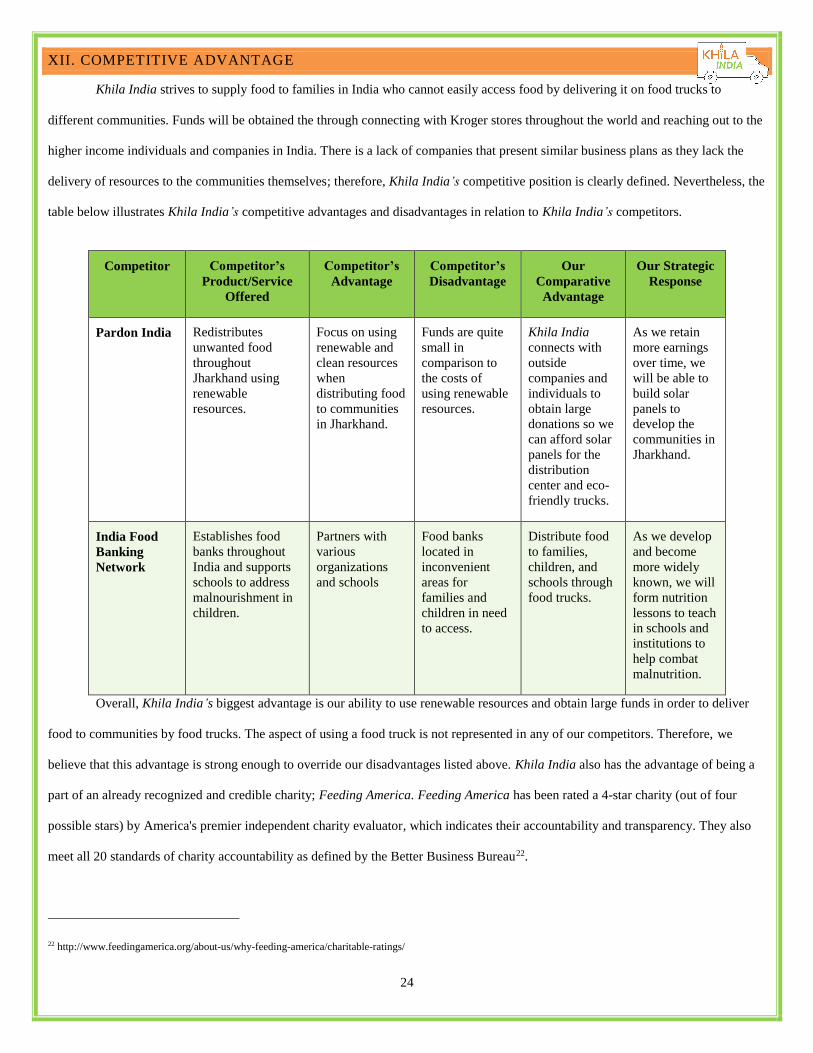
24
XII. COMPETITIVE ADVANTAGE
Khila India strives to supply food to families in India who cannot easily access food by delivering it on food trucks to
different communities. Funds will be obtained the through connecting with Kroger stores throughout the world and reaching out to the
higher income individuals and companies in India. There is a lack of companies that present similar business plans as they lack the
delivery of resources to the communities themselves; therefore, Khila India’s competitive position is clearly defined. Nevertheless, the
table below illustrates Khila India’s competitive advantages and disadvantages in relation to Khila India’s competitors.
Competitor Competitor’s
Product/Service
Offered
Competitor’s
Advantage
Competitor’s
Disadvantage
Our
Comparative
Advantage
Our Strategic
Response
Pardon India Redistributes
unwanted food
throughout
Jharkhand using
renewable
resources.
Focus on using
renewable and
clean resources
when
distributing food
to communities
in Jharkhand.
Funds are quite
small in
comparison to
the costs of
using renewable
resources.
Khila India
connects with
outside
companies and
individuals to
obtain large
donations so we
can afford solar
panels for the
distribution
center and eco-
friendly trucks.
As we retain
more earnings
over time, we
will be able to
build solar
panels to
develop the
communities in
Jharkhand.
India Food
Banking
Network
Establishes food
banks throughout
India and supports
schools to address
malnourishment in
children.
Partners with
various
organizations
and schools
Food banks
located in
inconvenient
areas for
families and
children in need
to access.
Distribute food
to families,
children, and
schools through
food trucks.
As we develop
and become
more widely
known, we will
form nutrition
lessons to teach
in schools and
institutions to
help combat
malnutrition.
Overall, Khila India’s biggest advantage is our ability to use renewable resources and obtain large funds in order to deliver
food to communities by food trucks. The aspect of using a food truck is not represented in any of our competitors. Therefore, we
believe that this advantage is strong enough to override our disadvantages listed above. Khila India also has the advantage of being a
part of an already recognized and credible charity; Feeding America. Feeding America has been rated a 4-star charity (out of four
possible stars) by America's premier independent charity evaluator, which indicates their accountability and transparency. They also
meet all 20 standards of charity accountability as defined by the Better Business Bureau22.
22 http://www.feedingamerica.org/about-us/why-feeding-america/charitable-ratings/
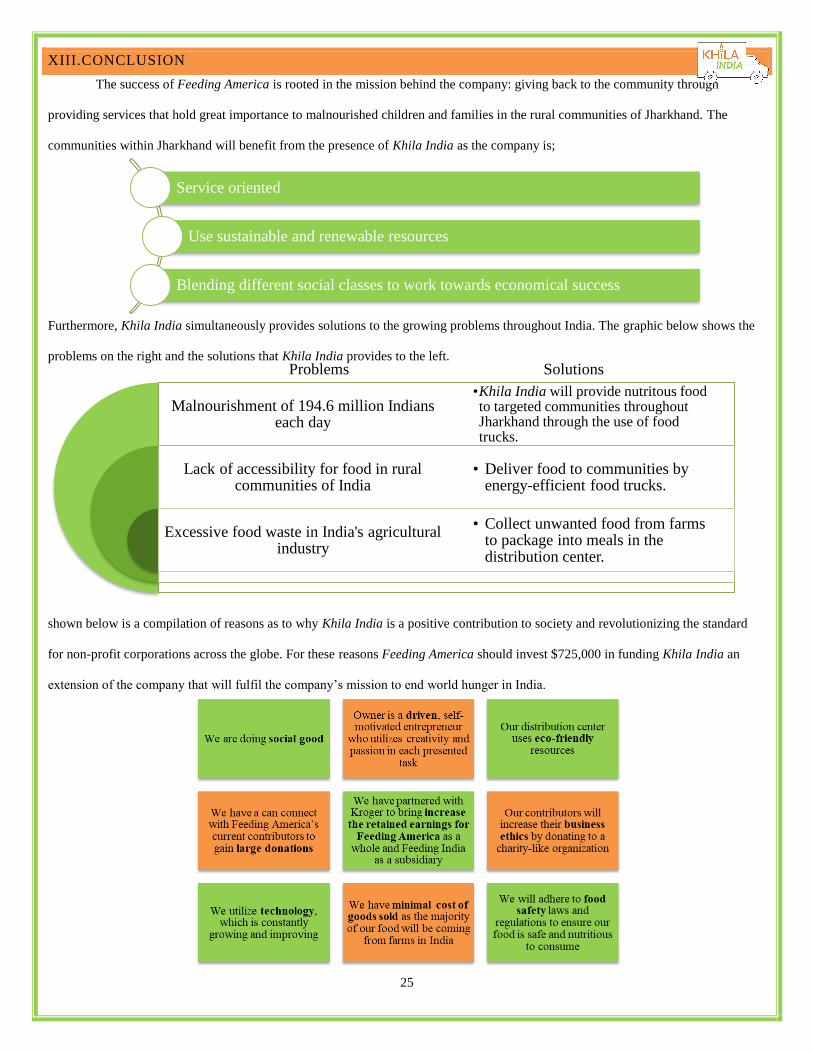
25
XIII.CONCLUSION
The success of Feeding America is rooted in the mission behind the company: giving back to the community through
providing services that hold great importance to malnourished children and families in the rural communities of Jharkhand. The
communities within Jharkhand will benefit from the presence of Khila India as the company is;
Furthermore, Khila India simultaneously provides solutions to the growing problems throughout India. The graphic below shows the
problems on the right and the solutions that Khila India provides to the left.
shown below is a compilation of reasons as to why Khila India is a positive contribution to society and revolutionizing the standard
for non-profit corporations across the globe. For these reasons Feeding America should invest $725,000 in funding Khila India an
extension of the company that will fulfil the company’s mission to end world hunger in India.
Malnourishment of 194.6 million Indians each day
Lack of accessibility for food in rural communities of India
Excessive food waste in India's agricultural industry
•Khila India will provide nutritous food to targeted communities throughout Jharkhand through the use of food trucks.
• Deliver food to communities by energy-efficient food trucks.
• Collect unwanted food from farms to package into meals in the distribution center.
Service oriented
Use sustainable and renewable resources
Blending different social classes to work towards economical success
Problems Solutions
26
XIV. BIBILIOGRAPHY
Briney, Amanda. "Get to Know the Geography and History of India." ThoughtCo. N.p., n.d. Web. 2017.
"Demographics of India." Demographics of India, Indian Demographics Data. N.p., n.d. Web. 2017.
"Economic System." India. N.p., n.d. Web. 2017.
Geewax, Marilyn. "The Tipping Point: Most Americans No Longer Are Middle Class."NPR. NPR, 09 Dec. 2015. Web. 2017.
"Government of India." Discover India. N.p., n.d. Web. 2017.
Gupta, Ankit, and Meghna. "10 Poorest States In India." Kanigas. N.p., 16 Nov. 2015. Web. 2017.
"Home." Rural Poverty Portal. N.p., n.d. Web. 2017.
"Home." Rural Poverty Portal. N.p., n.d. Web. 2017.
"Hunger in India." Hunger in India | India FoodBanking Network. N.p., n.d. Web. 2017.
"India Wastes Rs 44,000 Cr worth Food Every Year." Deccan Herald. N.p., n.d. Web. 2017.
"India Water Crisis - Clean Water In India." Water.org. N.p., n.d. Web. 2017.
Journal, Csr. "Food Wastage In India A Serious Concern." The CSR Journal. N.p., 08 Apr. 2017. Web. 2017.
"Poverty and Its Causes in India." Poverty in India - Facts, Causes and Effects | My India. N.p., n.d. Web. 2017.
"Practical Law." Practical Law UK Signon. N.p., n.d. Web. 2017.
Pti. "About 70 per Cent Indians Live in Rural Areas: Census Report." The Hindu. N.p., 15 July 2011. Web. 2017.
SocialCops Follow. "Decoding Open Data: 2011 Indian Census." LinkedIn SlideShare. N.p., 21 Aug. 2015. Web. 2017.
"Spain." U.S. Department of State. U.S. Department of State, n.d. Web. 2017.
"Top Sites in India The Sites in the Top Sites Lists Are Ordered by Their 1 Month Alexa Traffic Rank.The 1 Month Rank Is
Calculated Using a Combination of Average Daily Visitors and Pageviews over the past Month. The Site with the Highest
Combination of Visitors and Pageviews Is Ranked #1." Top Sites in India - Alexa. N.p., n.d. Web. 2017.
Zimmermann, Kim Ann. "Indian Culture: Traditions and Customs of India." LiveScience. Purch, 20 July 2017. Web.
"10 Facts About Food and Nutrition in India | WFP | United Nations World Food Programme - Fighting Hunger
Worldwide." UN World Food Programme. N.p., 26 July 2016. Web. 27 Nov. 2017.
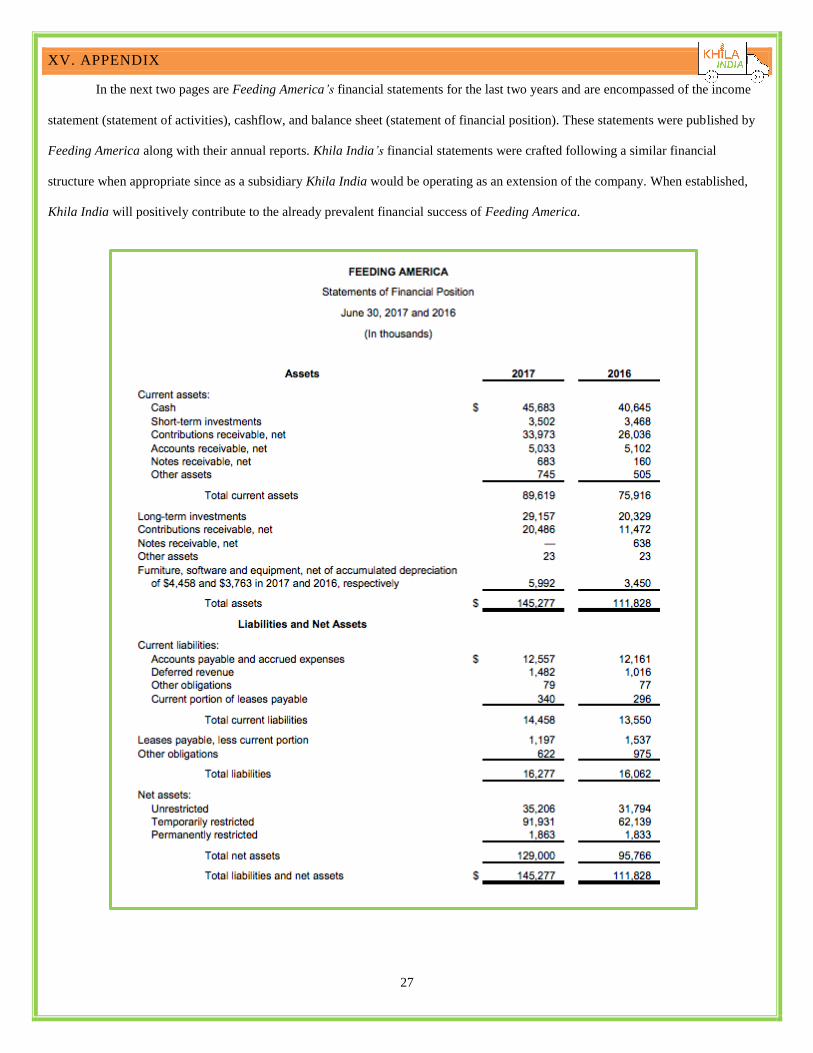
27
XV. APPENDIX
In the next two pages are Feeding America’s financial statements for the last two years and are encompassed of the income
statement (statement of activities), cashflow, and balance sheet (statement of financial position). These statements were published by
Feeding America along with their annual reports. Khila India’s financial statements were crafted following a similar financial
structure when appropriate since as a subsidiary Khila India would be operating as an extension of the company. When established,
Khila India will positively contribute to the already prevalent financial success of Feeding America.

28