
Business Performance - Bolsas y Mercados Españoles · Business Performance January–March 2016 -...
33
-1- April 2016 Business Evolution January – March 2016 Business Performance January–March 2016
Transcript of Business Performance - Bolsas y Mercados Españoles · Business Performance January–March 2016 -...

- 1 -
April 2016
Business Evolution January – March 2016
BusinessPerformance
January–March 2016

- 2 -
April 2016
Business Evolution January – March 2016
DisclaimerThis presentation, which is personal to the recipient, has been prepared and produced by Bolsas y Mercados Españoles, Sociedad Holding de Mercados
y Sistemas Financieros, S,A, (“BME”) solely for the benefit of investment analysis and may not be used for any purpose other than assessment of
investments concerning BME, Unless otherwise stated, BME is the source for all data contained in this presentation, Such data is provided as at the date
of this presentation and is subject to change without notice,
This presentation is strictly confidential and is being furnished to you solely for your information, It may not be reproduced, redistributed, passed on or
published, in whole or in part, to any other person for any other purpose, This presentation does not constitute or form part of, and should not be
construed as, an offer or invitation for the sale of or the subscription of, or a solicitation of any offer to buy or subscribe for, any securities, nor shall it or
any part of it or the fact of its distribution form the basis of, or be relied on in connection with, any offer, contract, commitment or investment decision
relating thereto, nor does it constitute a recommendation regarding the securities of BME,
Neither this presentation nor any copy of it may be taken, transmitted into or distributed in the United States, the United Kingdom, Canada, Australia or
Japan except by or on the express instructions of BME, The distribution of this presentation in other jurisdictions may also be restricted by law and
persons into whose possession this presentation comes should inform themselves about and observe any such restrictions,
This presentation is directed only at persons who (i) have professional experience in matters relating to investments falling within article 19(5) of the
Financial Services and Markets Act 2000 (financial promotion) order 2005 (“the order”); or (ii) are persons to whom it can otherwise lawfully be
distributed (all such persons together being referred to as “relevant persons”), This presentation must not be acted on, or relied on by, persons who are
not relevant persons,
The information in this presentation has not been independently verified, No representation or warranty, express or implied, is made as to, and no
reliance should be placed on, the fairness, accuracy or completeness of the information or opinions contained herein, None of BME, any of its
shareholders, or any of their respective subsidiary undertakings or affiliates or any of such person’s directors, officers or employees, advisers or other
representatives, accepts any liability whatsoever (whether in negligence or otherwise) arising, directly or indirectly, from the use of this presentation or
otherwise arising in connection therewith,
This presentation could include forward-looking statements, These forward-looking statements involve known and unknown risks, uncertainties and other
factors, which may cause our actual results, performance, achievements or industry results to be materially different from those expressed or implied by
these forward-looking statements, Forward-looking statements speak only as of the date of this presentation and BME expressly disclaim any obligation
or undertaking to release any update of, or revisions to, any forward-looking statements in this presentation as a result of any change in our expectations
or any change in events, conditions or circumstances on which these forward-looking statements are based,

- 3 -
April 2016
Business Evolution January – March 2016
Index
A. Results
B. Business Units
C. Financials
D. Business Drivers

- 4 -
April 2016
Business Evolution January – March 2016
Index
A. Results
B. Business Units
C. Financials
D. Business Drivers
- 5 -
April 2016
Business Evolution January – March 2016
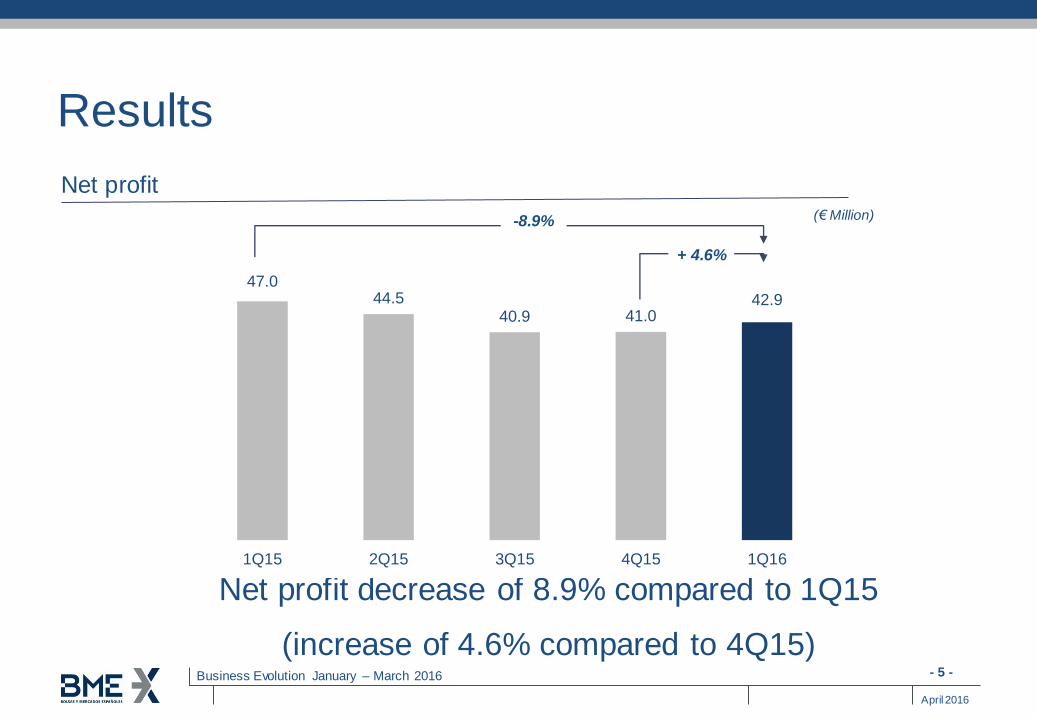
Results
Net profit
Net profit decrease of 8.9% compared to 1Q15
(increase of 4.6% compared to 4Q15)
-8.9% (€ Million)
47.044.5
40.9 41.042.9
1Q15 2Q15 3Q15 4Q15 1Q16
+ 4.6%

- 6 -
April 2016
Business Evolution January – March 2016
Results
Net profit
A comparison with an outstanding 1T15
-8.9%(€ Million)
35.533.0
42.2
47.042.9
1Q12 1Q13 1Q14 1Q15 1Q16

- 7 -
April 2016
Business Evolution January – March 2016
Solid operating leverage
Costs Revenues Revenues not linked to volumes Ratio

- 8 -
April 2016
Business Evolution January – March 2016
Key ratios benchmarking
• Efficiency • ROE
- BME´s data as of 31/03/2016
- Average peer Group figures are calculated using last results published and not taking account
of goodwill impairment charges
37.8%
19.7%
BME Average PeerGroup
32.6%
46.4%
BME Average PeerGroup
- 9 -
April 2016
Business Evolution January – March 2016
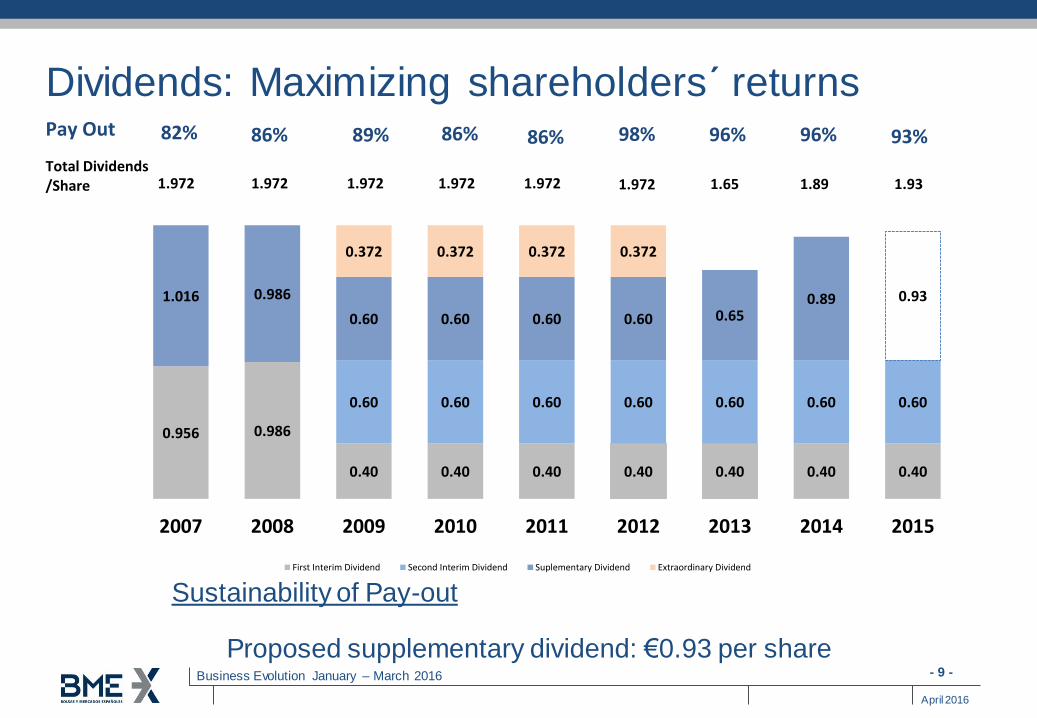
Dividends: Maximizing shareholders´ returns
Sustainability of Pay-out
Proposed supplementary dividend: €0.93 per share
0.956 0.986
0.40 0.40 0.40 0.40 0.40 0.40 0.40
0.60 0.60 0.60 0.60 0.60 0.60 0.60
1.016 0.986
0.60 0.60 0.60 0.60 0.650.89 0.93
0.372 0.372 0.372 0.372
2007 2008 2009 2010 2011 2012 2013 2014 2015
First Interim Dividend Second Interim Dividend Suplementary Dividend Extraordinary Dividend
1.972 1.972Total Dividends /Share
Pay Out 82% 86%
1.9721.9721.972
89% 86% 86%
1.972
98%
1.65
96%
1.89
96%
1.93
93%

- 10 -
April 2016
Business Evolution January – March 2016
Index
A. Results
B. Business Units
C. Financials
D. Business Drivers

- 11 -
April 2016
Business Evolution January – March 2016
Business Areas
Consolidated Revenues
1Q 2016 - %
EBITDA
1Q 2016 - %
Equity44.5%
Settlement24.2%
Clearing5.0%
Information 13.8%
Derivatives3.7%
Fixed Income
2.9%
IT & Consulting
5.9%
Equity45.9%
Settlement26.4%
Clearing3.2%
Information 16.1%
Derivatives2.9%
Fixed Income 1.8%
IT & Consulting
3.7%

- 12 -
April 2016
Business Evolution January – March 2016
261 262
222 218
198
56.2 56.046.3 50.3 51.5
17.7
15.6 14.814.1
15.6
1Q15 2Q15 3Q15 4Q15 1Q16
Mile
s d
e m
illo
ne
s
94
81 8689
8489
97
62 63
80
7068
74
61 63
27.2
13.016.1
29.4
10.915.7
22.5
9.7 14.0
21.615.2 13.5
23.0
13.0 15.4
6.9
5.35.5
5.7
4.4
5.4
5.44.4
5.0 5.2
4.3 4.6 5.2
5.55.0
1/15 2/15 3/15 4/15 5/15 6/15 7/15 8/15 9/15 10/15 11/15 12/15 1/16 2/16 3/16
Equity Market
Equity (Turnover, number of trades and number of shares traded
Revenue in line with 4Q15
Turnover (€ Bill.) Shares (Bill.) Trades (Mill.)
Thousands of € 1Q 2016 1Q 2015 %
Revenues 35,862 43,654 -17.8%
Expenses (9,762) (9,432) 3.5%
EBITDA 26,100 34,222 -23.7%

- 13 -
April 2016
Business Evolution January – March 2016
• Listing activity
Investment flows channeled through the Exchange (€ Million)
• Investment flows have slowed the pace
compared to the first half of 2015. Amounted to €3.3 billion, of which €886 million were in scrip dividend.
• Issuers return to market acess activity with
Telepizza, Dominion and Parques Reunidos IPOs in April.
Source: FESE (Federation of European Stock Exchanges)
Equity Market
11,089 11,770
5,455 5,2313,217
4,389 2,917
626157
37
1Q15 2Q15 3Q15 4Q15 1Q16
New shares issued of listed companies New listings (IPOs)

- 14 -
April 2016
Business Evolution January – March 2016
14.013.1
11.1
13.7
11.8
1Q15 2Q15 3Q15 4Q15 1Q16
1,447 1,446 1,457 1,455 1,464
832 840 768 772 718
1Q15 2Q15 3Q15 4Q15 1Q16
2,286 2,225 2,227 2,1822,279
Par Value registered in FI Market value registered in Equity
Securities under custody: Volumes
(€ Billion)
Settlement & Registration
Settlement: Number of trades settled
(Million of trades)
The stability of registration softens the effect of lower volumes
Thousands of € 1Q 2016 1Q 2015 %
Revenues 19,490 21,718 -10.3%
Expenses (4,463) (4,947) -9.8%
EBITDA 15,027 16,771 -10.4%

- 15 -
April 2016
Business Evolution January – March 2016
150156
150 152 154
4.43.5 3.6 3.1
4.0
1Q15 2Q15 3Q15 4Q15 1Q16
Subscribers (Thousand) P.Quote (Mill.)
Information
Information: Subscribers to primary market sources (Average for the period
in thousands of subscribers and millions of accesses per quote)
Core growth and Infobolsa adquisition
Thousands of € 1Q 2016 1Q 2015 %
Revenues 11,100 9,415 17.9%
Expenses (1,914) (807) 137.2%
EBITDA 9,186 8,608 6.7%

- 16 -
April 2016
Business Evolution January – March 2016
5,993
3,854 4,053
9,190 9,187
1Q15 2Q15 3Q15 4Q15 1Q16
245,892
210,543
141,121125,714 124,418
1Q15 2Q15 3Q15 4Q15 1Q16
Turnover BME Clearing REPO (€ Million) Volume (Mwh) traded in Energy market (Thousand)
Clearing
negative effect on income (REPO segment) offset by cost reduction
Thousands of € 1Q 2016 1Q 2015 %
Revenues 4,041 4,435 -8.9%
Expenses (2,237) (2,523) -11.3%
EBITDA 1,804 1,912 -5.6%

- 17 -
April 2016
Business Evolution January – March 2016
1,862 1,921
854 897
1,782
1,014
1Q15 1Q16
Derivatives
(Thousand of contracts)
Growth in IBEX® Futures not enough to offset rest of products
Stock derivatives contracts tradedIndex derivatives contracts traded
IBEX 35® Futures MiniIBEX 35® Futures IBEX 35® Options Stock Futures Stock Options
(Thousand of contracts)
Thousands of € 1Q 2016 1Q 2015 %
Revenues 3,020 3,159 -4.4%
Expenses (1,361) (1,274) 6.8%
EBITDA 1,659 1,885 -12.0%
3,6603,312
5,0474,829
1Q15 1Q16

- 18 -
April 2016
Business Evolution January – March 2016
126,894
93,083 91,647
73,100
119,962
1Q15 2Q15 3Q15 4Q15 1Q16
Fixed income
AIAF – Volume admitted (Million €)
• Public Debt trading in the quarter improved
19.2% over the previous year to €33.5 billion.
• The primary fixed income market has recovered compared to previous quarters. Issuances for the
first quarter amounted to €120 billion, 5.5% lower compared to 1Q15.
• Alternative Fixed Income Market, MARF, continues its growth path. The volume issued in the first quarter reached 482 million, multiplying
by more than 6 times one year ago issuances.
Thousands of € 1Q 2016 1Q 2015 %
Revenues 2,325 2,504 -7.1%
Expenses (1,274) (1,271) 0.2%
EBITDA 1,051 1,233 -14.8%

- 19 -
April 2016
Business Evolution January – March 2016
IT & Consulting
Market access
Alternative
Financial communication/Outsourcing
London Hubs
Proximity/Colocation
Virtual desks/Contingency/Call Centers
Highway Bulk Payment/Regis-TR®
Thousands of € 1Q 2016 1Q 2015 %
Revenues 4,797 4,630 3.6%
Expenses (2,709) (2,794) -3.0%
EBITDA 2,088 1,836 13.7%

- 20 -
April 2016
Business Evolution January – March 2016
Breakdown by business areas
Revenues
Thousands of € 1Q 2016 1Q 2015 %
Equity 35,862 43,654 -17.8%
Settlement & Registration 19,490 21,718 -10.3%
Clearing 4,041 4,435 -8.9%
Information 11,100 9,415 17.9%
Derivatives 3,020 3,159 -4.4%
Consulting & IT 4,797 4,630 3.6%
Fixed income 2,325 2,504 -7.1%
- 21 -
April 2016
Business Evolution January – March 2016
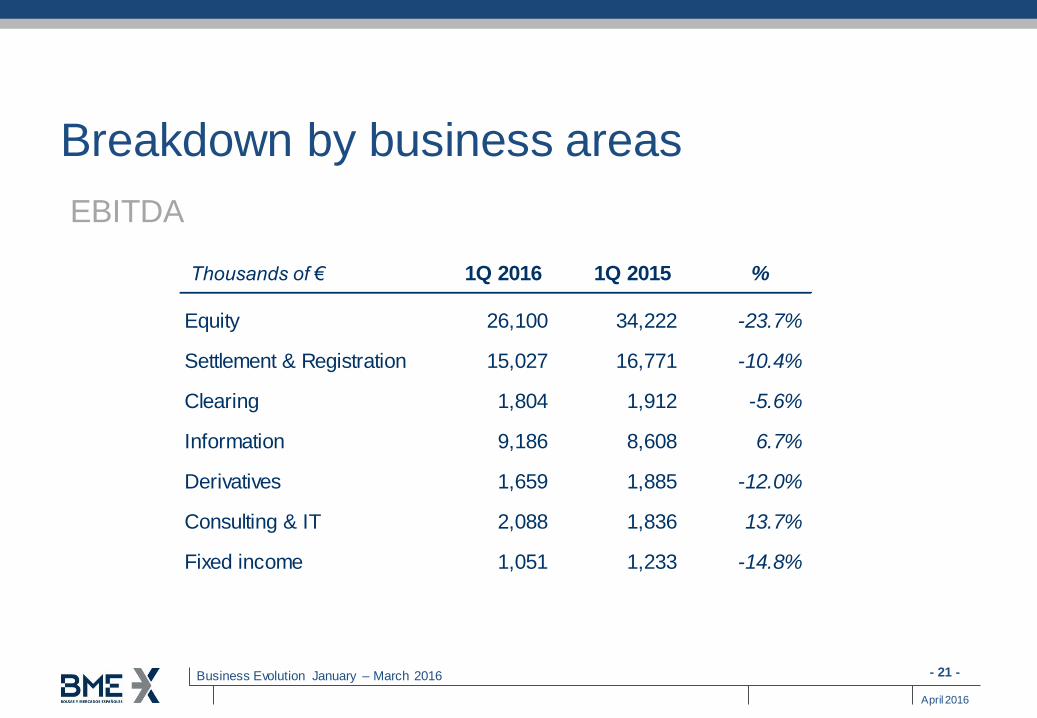
Breakdown by business areas
EBITDA
Thousands of € 1Q 2016 1Q 2015 %
Equity 26,100 34,222 -23.7%
Settlement & Registration 15,027 16,771 -10.4%
Clearing 1,804 1,912 -5.6%
Information 9,186 8,608 6.7%
Derivatives 1,659 1,885 -12.0%
Consulting & IT 2,088 1,836 13.7%
Fixed income 1,051 1,233 -14.8%

- 22 -
April 2016
Business Evolution January – March 2016
Index
A. Results
B. Business Units
C. Financials
D. Business Drivers

- 23 -
April 2016
Business Evolution January – March 2016
Balance sheet
as of March, 31st
(Thousands of €)2016 2015
Goodwill 88,718 80,619
Other non-current assets 88,233 88,193
Cash and cash equivalents 229,268 251,929
Current financial assets 121,118 100,167
Non-Group current financial assets 23,395,894 36,133,238
Other current assets 101,035 98,504
Total assets 24,024,266 36,752,650
Owners' Equity 478,254 467,002
Non-current liabilities 20,215 18,344
Current liabilities 23,525,585 36,267,304
Total equity and liabilities 24,024,266 36,752,650

- 24 -
April 2016
Business Evolution January – March 2016
P/L
Thousands of € 1Q 2016 1Q 2015 %
Revenues 82,135 93,048 -11.7%
Expenses (26,791) (26,767) 0.1%
EBITDA 55,344 66,281 -16.5%
EBIT 53,865 64,718 -16.8%
Financial results 2,534 225 1,026.2%
Share of profit (loss) of associates 111 66 68.2%
EBT 56,510 65,009 -13.1%
Net Profit 42,864 47,035 -8.9%

- 25 -
April 2016
Business Evolution January – March 2016
EBITDA 1Q 2016/2015[€ Mill.] Net Profit 1Q 2016/2015 [€ Mill.]
Comparison with 1Q 2015
Revenues 1Q 2016/2015 Costs 1Q 2016/2015
Margins
[€ Mill.] [€ Mill.]
- 11.7% + 0.1%
- 16.5% - 8.9%
82.1 93.0
1Q 2016 1Q 2015
26.8 26.8
1Q 2016 1Q 2015
55.3 66.3
1Q 2016 1Q 2015
42.9 47.0
1Q 2016 1Q 2015

- 26 -
April 2016
Business Evolution January – March 2016
32.6% 28.8%
1Q16 1Q15
49.7%41.4%
1Q16 1Q15
65.6%69.6%
1Q16 1Q15
Efficiency & ProfitabilityROE Evolution EBIT/Revenues Ratio Evolution
% ROE % EBIT/Revenues
% Cost/EBIT % Efficiency
Cost/EBIT Ratio Evolution Efficiency Ratio Evolution
37.8%42.7%
1Q16 1Q15

- 27 -
April 2016
Business Evolution January – March 2016
Index
A. Results
B. Business Units
C. Financials
D. Business Drivers

- 28 -
April 2016
Business Evolution January – March 2016
Business drivers: Highly liquid market • Spanish blue-chips are of the most liquid stocks in the EMU
Source: Bloomberg 1) As of 31/03/16
RK
1Q16
40.8
36.1
36.0
32.2
30.8
30.4
28.4
28.4
26.2
26.2
23.1
16.9
15.4
1
2
3
4
5
6
7
8
9
10
16
24
30
0.66
0.58
0.58
0.52
0.50
0.49
0.46
0.46
0.42
0.42
0.37
0.27
0.25
3.09%
5.22%
3.35%
1.79%
4.10%
2.03%
3.59%
1.10%
3.43%
4.20%
2.15%
1.73%
1.56%
Company
Daily avg. 1Q16Relative weight at
EuroStoxx50 (%)1)Turnover (€ Biilion) Turnover (€ Biilion)

- 29 -
April 2016
Business Evolution January – March 2016
• Quality of spreads and best market impact for Spanish stocks
Business drivers: Highly liquid market
Source: Market annual and monthly reports
After a period of high volatility,
which caused an increase inspreads, again have becomenarrowed:
– The IBEX 35® and IBEX®
Medium Cap spread reachedagain values near their lows.
– IBEX® Small Cap achieved
record mimimum levels in thebid-ask spread with animprovement of 6 basis
points from a year earlier,reflecting greater market
depth and liquidity in thesesecurities.
Horq. Media (%)Horq. Media (%)
0.240%
0.235%
0.238%
0.258%
0.255%
0.277%
0.282%
0.261%
0.257%
0.268%
0.281%
0.302%
0.239%
0.052%
0.054%
0.057%
0.061%
0.057%
0.063%
0.065%
0.061%
0.061%
0.070%
0.072%
0.077%
0.064%
201503
201504
201505
201506
201507
201508
201509
201510
201511
201512
201601
201602
201603
Horq. Media (%)
0.75%
0.74%
0.85%
0.84%
0.71%
0.82%
0.91%
0.88%
0.80%
0.87%
0.96%
0.98%
0.69%

- 30 -
April 2016
Business Evolution January – March 2016
• Distribution by markets of business volume of the IBEX 35® companies (2008 – 2015)
Diversified market
Source: Interim Reports from listed companies obtained from CNMV
Spain EU OCDE Rest
20%
20%
24%
- 31 -
April 2016
Business Evolution January – March 2016
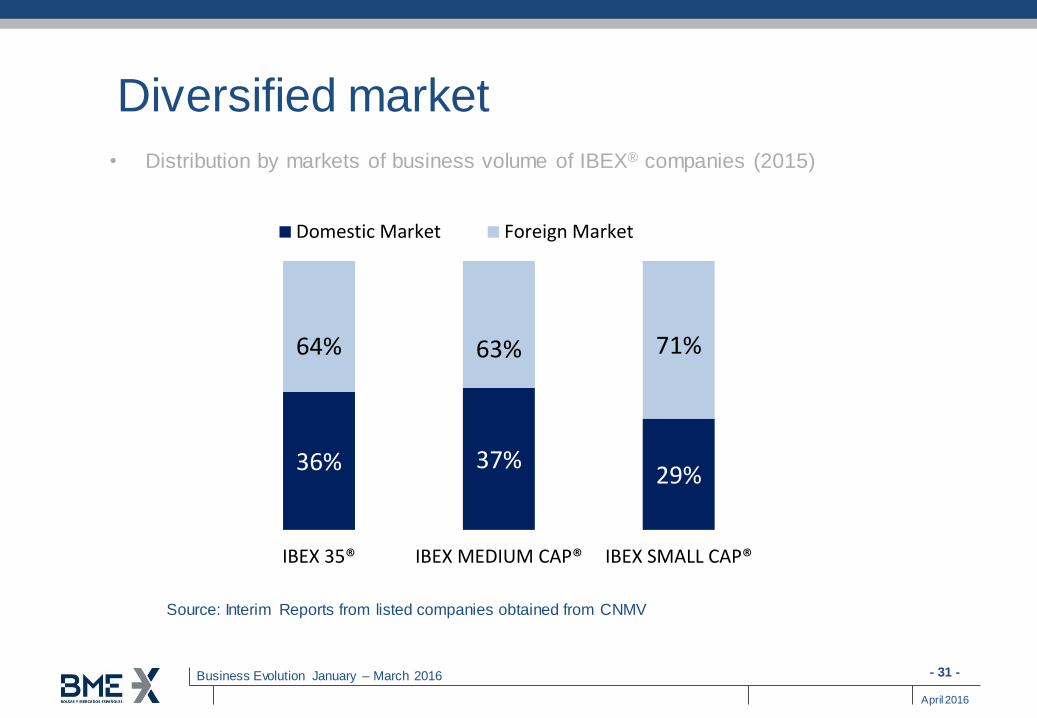
• Distribution by markets of business volume of IBEX® companies (2015)
Diversified market
Source: Interim Reports from listed companies obtained from CNMV
36% 37%29%
64% 63% 71%
IBEX 35® IBEX MEDIUM CAP® IBEX SMALL CAP®
Domestic Market Foreign Market

- 32 -
April 2016
Business Evolution January – March 2016
Growth projects “core” and “non-core”
Progress report
Listing/Trading
• Opportunity for financing companies
through the markets
• Funds Platform
Clearing
• Expansion of clearing
activities
• EMIR: OTC
instruments, new
segments
• Share infrastructure
with othermarkets/platforms
• Equity Segment
Settlement
• T2S conection.
Conection hub forpayment and
securities.
• Portfolio of Services
related to Post-Trading Reform and additional
European regulation.
Market Data
• LATAM project
• Growth in Regis TR®
activities
• New obligations in
compliance reporting(Mifid2)
• Enrichment of the value chain in all their links
Products/services “non-core”
• Open Finance Visual Trader Infobolsa Consulting
• Technology Compliance SIR/SICAM

- 33 -
April 2016
Business Evolution January – March 2016
Q&A


![Instructiva Para Fese 2008 Sis j Go[1]](https://static.fdocuments.in/doc/165x107/5571fc4e497959916996f5b3/instructiva-para-fese-2008-sis-j-go1.jpg)
