Business objects activities web intelligence
60
1 Web Intelligence Activities
-
Upload
dmitry-anoshin -
Category
Education
-
view
106 -
download
0
Transcript of Business objects activities web intelligence

1
Web Intelligence Activities
2
List of Activities
Contents Activity w1: Creating a document ....................................................................................................................... 3
Activity w2: Restricting data ............................................................................................................................... 5
Activity w3: Adding prompts ............................................................................................................................... 7
Activity w4: Restricting data with multiple filters ............................................................................................... 9
Activity w5: Designing Web Intelligence Reports ............................................................................................. 10
Activity w6: Formatting breaks and cross tabs ................................................................................................. 14
Activity w7: Enhancing the presentation of a report ........................................................................................ 16
Activity w8: Tracking data changes ................................................................................................................... 18
Activity w9: Creating complex alerters ............................................................................................................. 20
Activity w10: Creating sections in a report ....................................................................................................... 23
Activity w11: Formatting and printing reports ................................................................................................. 25
Activity w12: Formatting charts ........................................................................................................................ 29
Activity w13: Creating formulas and variables ................................................................................................. 32
Activity w14: Synchronizing data ...................................................................................................................... 33
Activity w15: Analyzing data ............................................................................................................................. 35
Activity w16: Managing and sharing Web Intelligence documents .................................................................. 37
Activity w17: Combined queries ....................................................................................................................... 40
Activity w18: Using subqueries ......................................................................................................................... 42
Activity w19: Changing the data source ........................................................................................................... 44
Activity w20: Calculation contexts .................................................................................................................... 48
Activity w21: Character and date string functions............................................................................................ 50
Activity w22: Grouping data ............................................................................................................................. 52
Activity w23: Modifying the calculation behavior ............................................................................................ 53
Activity w24: Displaying data restricted by a filter or ranking .......................................................................... 56
Activity w25: Creating hyperlinks in the Interactive panel ............................................................................... 58

3
Activity w1: Creating a document
Objective • Create a new document and retrieve data for the document by building and editing a query. Instructions
1. Create a new document using the eFashion universe, showing Sales Revenue by State and Store name. 2. Run the query to view your results. 3. Edit the document you just created to include a listing for Quantity sold by Year and Quarter. 4. View the SQL that will retrieve the data. 5. Run the query.
Your report should appear as shown below.

4
6. Save the document as 1W Activity Create Document.

5
Activity w2: Restricting data Objective • Apply filters to a query to limit the data returned by objects in a query. Instructions 1. Create a new document with a report showing Sales Revenue by Year, Quarter and Store name. 2. Create a query filter (in list) to show data for the store e-Fashion Texas. 3. Run the query to view your results.
4. Replace the filter to display figures only for e-Fashion New York Magnolia and e-Fashion New Miami Sundance You will need to change the filter operator. The Equal to operator can only return a single value. 5. Run the query. The top of your final report should appear as shown below.

6
6. Save the document as 2W Activity Filters.

7
Activity w3: Adding prompts Objective • Limit the data returned by objects in a query by applying prompts to a filter. Instructions 1. Create a new document showing Quantity sold by State, Store name, and Year. 2. Add a prompted filter to the query so that you are prompted to select the State each time the query is run or the document is refreshed. 3. Run the query to view your results selecting Florida as the State.
4. Change the prompted filter parameters so that the document : • Does not keep the last value selected shown in the table – • Users can select more than one value • The prompt is optional 5. Run the query without filters . Notice that the query retrieves the data for all states. Your final report should look similar to this.

8
6. Save the report as 3W Filters Activity.

9
Activity w4: Restricting data with multiple filters Objective • Limit the data returned by objects in a query by applying multiple filters to the query. Instructions 1. Create a new document showing Store name and Sales revenue where Margin is less than $1,000,000. Do not use commas in the numerical notation when creating the filter.
Note: You don't have to include Margin in the Result Objects pane. Your final report should look similar to this:
2. Edit the query and add a query filter to show store names with sales revenue more than $4,000,000. Note: Apply the appropriate operator (AND/OR) for retrieving the data that meets your criteria. Your final report should look similar to this:
3. Save the report as Activity Filters W4.

10
Activity w5: Designing Web Intelligence Reports Objective • Improve the presentation of a report to make information easier to understand. Instructions 1. Create a new document using the eFashion universe showing Year, Quarter, and Quantity sold. Filter to see only results for Q1. 2. Duplicate the table and paste the copy to the right of the existing table. 3. Change the presentation (Report elements -> Turn into) of the second block to a Vertical Group Bar chart. Your results should look like:
4. Select the chart, click the Properties tab, and check Yes next to the Legend zone in the Appearance area. – Click right button on chart ->Assign Data

11
Your results should look like:

12
5. To try a different presentation, drag and drop the Horizontal Stacked template, from the Templates tab, Charts folder, Bar folder, over your chart. Your results should look like:

13
6. To turn the chart back into a table, right-click the chart and select Turn to. Select the Tables tab and then select the Horizontal table tab, and click OK. Your results should look like:
Quarter Q1 Q1 Q1
Year 1999 2000 2001
Quantity sold 18,136 21,135 22,537
7. From the Template tab, drag the Radar Line template into an empty spot on your report. 8. Click the Data tab of the Report Manager and drag the Year object over to Place dimension objects here placeholder, at the bottom of the chart. Note: Be careful not to position this object on the optional placeholder. 9. Drag the Quantity sold object to the Place measure objects here placeholder, in the lower portion of the chart. 10.Refresh the report data. Your results should look like:
11.Save the document as 5W Activity Tables & Charts.
14
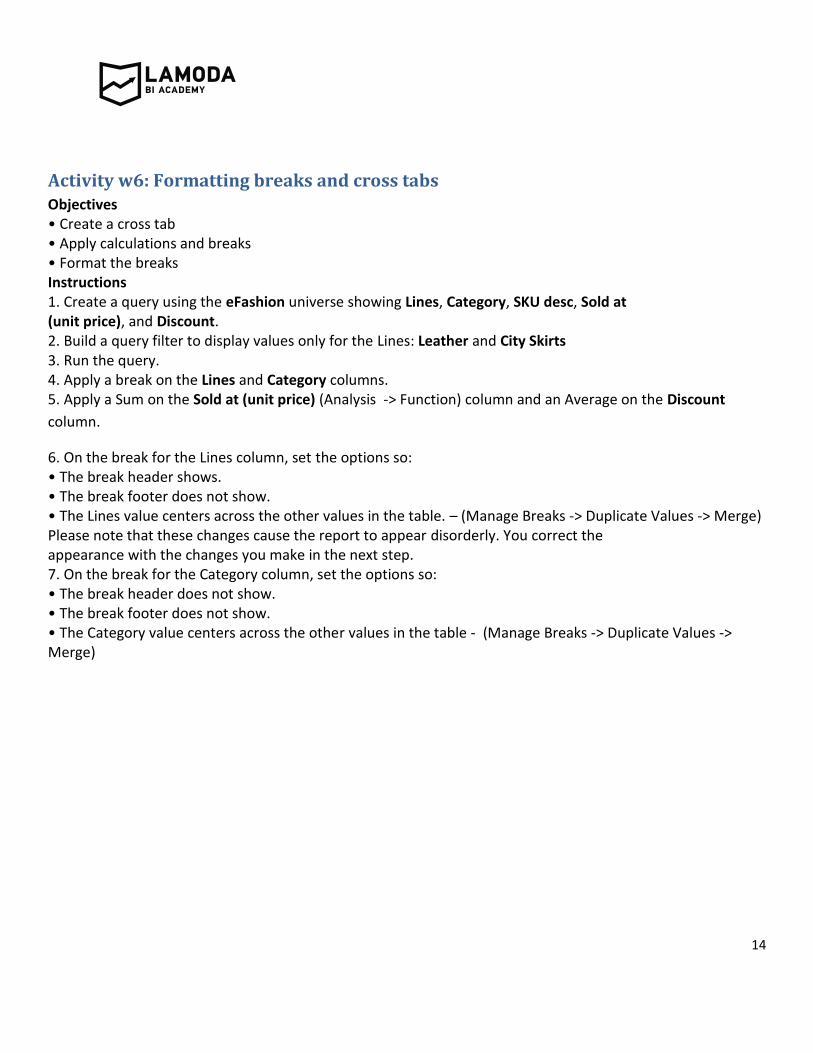
Activity w6: Formatting breaks and cross tabs Objectives • Create a cross tab • Apply calculations and breaks • Format the breaks Instructions 1. Create a query using the eFashion universe showing Lines, Category, SKU desc, Sold at (unit price), and Discount. 2. Build a query filter to display values only for the Lines: Leather and City Skirts 3. Run the query. 4. Apply a break on the Lines and Category columns. 5. Apply a Sum on the Sold at (unit price) (Analysis -> Function) column and an Average on the Discount
column.
6. On the break for the Lines column, set the options so: • The break header shows. • The break footer does not show. • The Lines value centers across the other values in the table. – (Manage Breaks -> Duplicate Values -> Merge) Please note that these changes cause the report to appear disorderly. You correct the appearance with the changes you make in the next step. 7. On the break for the Category column, set the options so: • The break header does not show. • The break footer does not show. • The Category value centers across the other values in the table - (Manage Breaks -> Duplicate Values -> Merge)

15
The report should look like this:
8. Save the report as 6W Activity Breaks and Cross Tabs.

16
Activity w7: Enhancing the presentation of a report Objective • Use breaks, calculations, and sorts to organize the presentation of data in a report. Instructions 1. Create a new document showing Quantity sold by State, Year and Quarter. 2. Apply a break on State and Year. 3. Add a sum and percentage to the Quantity sold column.
Your results should look like:
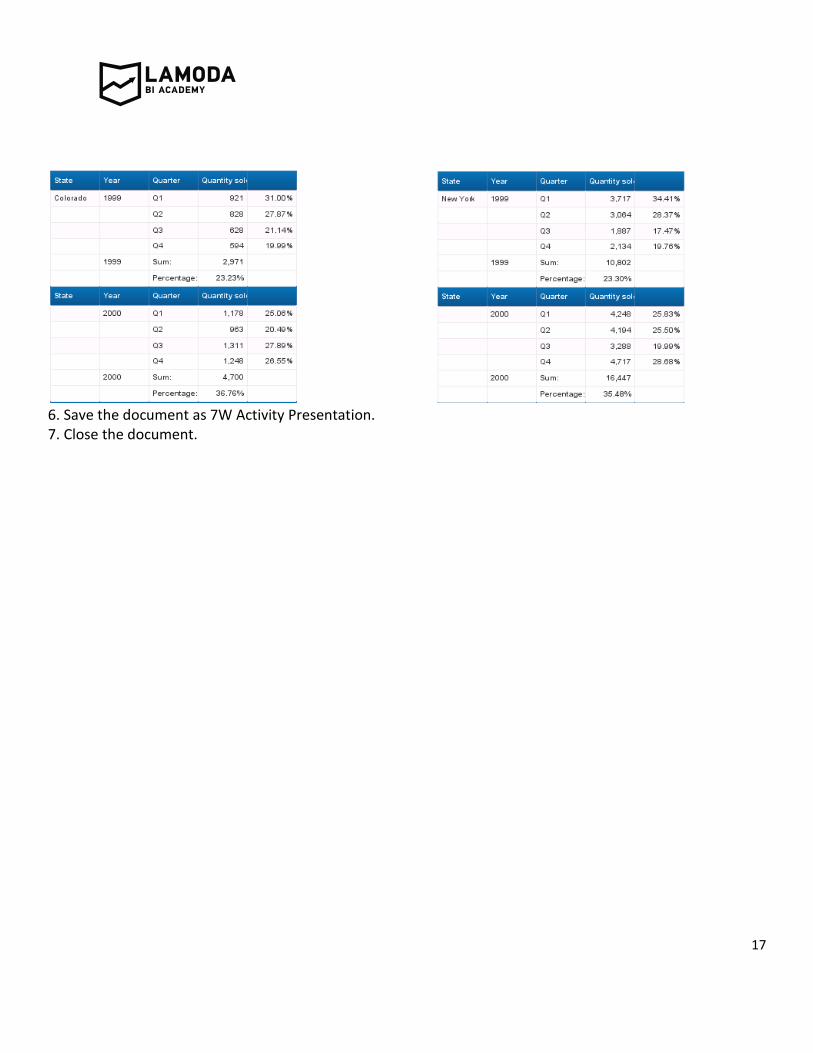
4. Filter the block to show only data for Colorado. 5. Create a duplicate of the table to the right of the existing table and filter it to show only data for New York. Your results should look like:
17
6. Save the document as 7W Activity Presentation. 7. Close the document.
18
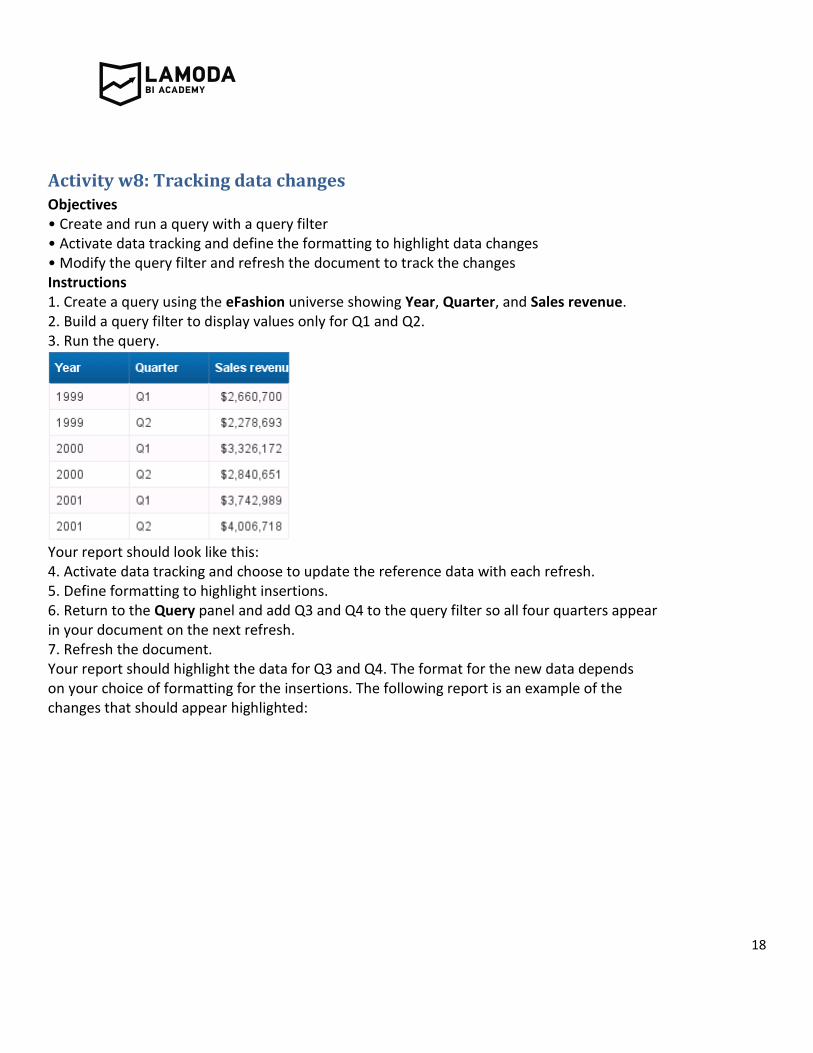
Activity w8: Tracking data changes Objectives • Create and run a query with a query filter • Activate data tracking and define the formatting to highlight data changes • Modify the query filter and refresh the document to track the changes Instructions 1. Create a query using the eFashion universe showing Year, Quarter, and Sales revenue. 2. Build a query filter to display values only for Q1 and Q2. 3. Run the query.
Your report should look like this: 4. Activate data tracking and choose to update the reference data with each refresh. 5. Define formatting to highlight insertions. 6. Return to the Query panel and add Q3 and Q4 to the query filter so all four quarters appear in your document on the next refresh. 7. Refresh the document. Your report should highlight the data for Q3 and Q4. The format for the new data depends on your choice of formatting for the insertions. The following report is an example of the changes that should appear highlighted:

19
8. Save the report as 8W Activity Tracking Data Changes.

20
Activity w9: Creating complex alerters Objectives • In this exercise, you are going to implement a range alert on the Quantity sold column. • You want to highlight values in the Quantity sold column in the following way: ○ values under 15,000 items ○ values between 15,000 and 45,000 items ○ values over 45,000 items Instructions 1. Create Universe State, Sales revenue, Quantity sold 1. Verify that the Alerters (Analysis -> Conditional -> New Rules) document is displayed. 2. Select the Quantity sold column. 3. Create a new alerter and name it Quantity Range. 4. Define the first alerter so that: • Filtered object or cell = Quantity sold • Operator = Less • Operand = 15000 5. Add a sub-alerter to this alerter definition by clicking the Add button in the bottom left corner of the Formating Rule Editor. Note: To create a sub-alerter, follow the same procedure as creating your first alerter. 6. Define the sub-alerter and a condition on the sub-alerter according to the following specifications. Sub-alerter: • Filtered object or cell = Quantity sold • Operator = Greater than or equal to • Operand = 15000 Condition on the sub-alerter: • Filtered object or cell = Quantity sold • Operator = Less than or equal to • Operand = 45000 7. Add a third sub-alerter by clicking the Add Sub-Alerter button again. 8. Define the third sub-alerter so that: • Filtered object or cell = Quantity sold • Operator = Greater than • Operand = 45000 The Alerter Editor should appear like this:

21
9. Accept the default formatting so that when you apply the alerter, the values under 15,000

22
will be red; values between 15,000 and 45,000 will be green; and values over 45,000 will be blue. Apply the new alerter, Quantity Range to the report. The final report should appear like this:
10.Save the report as 9W Creating complex alerters
23
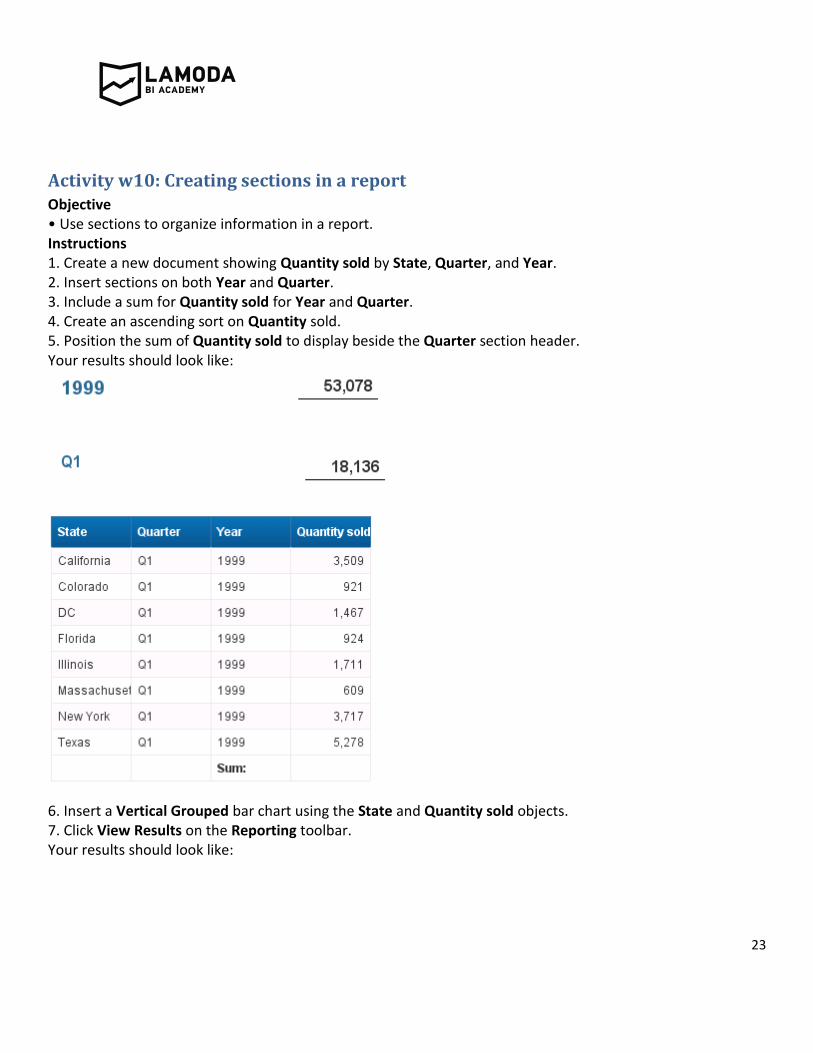
Activity w10: Creating sections in a report Objective • Use sections to organize information in a report. Instructions 1. Create a new document showing Quantity sold by State, Quarter, and Year. 2. Insert sections on both Year and Quarter. 3. Include a sum for Quantity sold for Year and Quarter. 4. Create an ascending sort on Quantity sold. 5. Position the sum of Quantity sold to display beside the Quarter section header. Your results should look like:
6. Insert a Vertical Grouped bar chart using the State and Quantity sold objects. 7. Click View Results on the Reporting toolbar. Your results should look like:

24
10.Duplicate the table and turn it into a pie chart.
11. Save report 10W Creating sections in a report

25
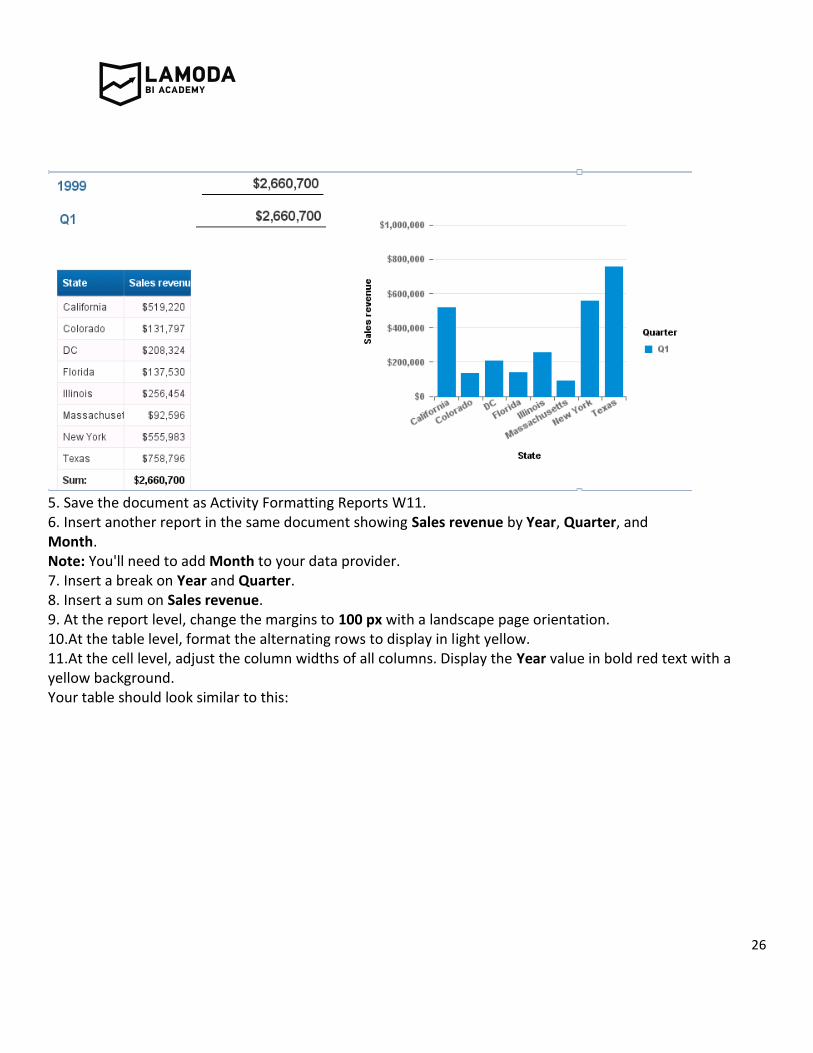
Activity w11: Formatting and printing reports Objective • In this Activity w you apply different formatting options to your report to structure your data and present it in a clear and readable manner. Instructions 1. Create a new document showing State, Year, Quarter, and Sales revenue. 2. Insert a section on Year and Quarter. 3. Insert a sum total for each Quarter and Year using white text on a blue background. 4. Insert a Vertical Group bar chart to show Sales revenue by State at the level of Quarter.
26
5. Save the document as Activity Formatting Reports W11. 6. Insert another report in the same document showing Sales revenue by Year, Quarter, and Month. Note: You'll need to add Month to your data provider. 7. Insert a break on Year and Quarter. 8. Insert a sum on Sales revenue. 9. At the report level, change the margins to 100 px with a landscape page orientation. 10.At the table level, format the alternating rows to display in light yellow. 11.At the cell level, adjust the column widths of all columns. Display the Year value in bold red text with a yellow background. Your table should look similar to this:

27
12.Insert another report in the same document showing Year, Quarter, Month, State, Store name, and Sales revenue. You need to add Store name to your data provider. 13.Click the Switch Page/Quick Display button to view how the report appears on a printed or PDF page. 14.Insert a break on Year. 15.For the Year column, select the option Avoid page breaks in table. You find this option on the Properties tab under Breaks, then Page layout. 16.Insert a section on State. 17.At the section level, select Start on new page for each state. 18.Select the option Repeat break value on every new page for Year. 19.Insert a break on Quarter and select the Avoid page breaks in table for Quarter.
The beginning of your report should look similar to this:

28
20.Save the report 11W Formatting and printing reports

29
Activity w12: Formatting charts Objective • Format a chart in a document. Instructions 1. Create a new query with Quantity sold, State and Year. 2. Add a Query Filter to the State object for California, Colorado, and DC. 3. Run the query. 4. Drag the Vertical Grouped Bar chart template onto the document on top of the vertical table. 5. Format the Vertical Grouped Bar chart as follows: • Adjust the Width and Height of the chart.
• Display the legend (Years). • Remove the axis names State (Category Axis -> Title) and Quantity sold (Volue axis -> Title).
6. Insert a new report and create a Vertical Stacked Area chart showing Quantity sold by State and Year. Format the chart as follows: • Adjust the Width and Height of the chart. • Display the legend to the left of the chart. • Remove the axis names State and Quantity sold. • Show the chart grid. • Show the chart data values in a Bold, dark blue, 10 point font size. • Add a chart title of Area Chart. (Area Chart -> Format chart-> Global -> Measure Properties -> Region type > Surfaces| Values Axis -> Design -> Stacking -> Stacked Chart| Format chart-> Global -> Palette and Style -> 3D Look) Your chart should look like the example below.

30
7. Insert a new report and create a 3D Pie (Format chart-> Global –> Palette and style-> 3D Look) chart showing Quantity Sold by Year. Format the chart as follows: • Adjust the Width and Height of the chart. • Show the Quantity sold data values as percentages (Format chart-> Global –> Area display-> Data values). • Create a background color of dark gray (Format chart-> Global –> Background) and Quantities sold (Format chart-> Global –> Area display-> Data values) chart data in white. Your chart should look like the example below.

31
8. Save the document as 12W Formatting charts.

32
Activity w13: Creating formulas and variables Objective • Create a new document that includes a table, prompt, ratio formula, variable, and title cell to display the results from the prompt. Instructions 1. Create a new document showing Margin and Quantity sold by Product Lines. 2. Add a column to the table (Table layout -> Insert -> insert column on...) 3. In the new column, create a formula to display the ratio for Margin and Quantity Sold. (Ratio = Margin/Quantity Sold) 4. Save the formula as a variable. 5. Format the column cell header to display Ratio (=NameOF([Ratio]). 6. Create a prompted query filter on State. 7. Insert a formula in the report title cell to show the State chosen from the prompt. Refresh the document for DC. (="Data for"+":"+" "+[State])
8. Save the document as Activity Formulas. 9. Create a cell showing the name of your document in the report header. 10.Save the document again.

33
Activity w14: Synchronizing data Objective • Create a new document and synchronize data from two different data providers.
Instructions 1. Create a new document using the eFashion universe. 2. Build a query that shows Sales revenue per State. 3. Run the query to view your results. 4. Data access tab ->Edit query
4. Add a new query to the document using the eStaff universe. 5. Build a query that shows the Quantity sold per State. 6. Run new query so that a new table is inserted in the existing report.

34
7. Synchronize the data so that you can display both the Sales revenue and Quantity sold per State in a single data block. (Data Access -> Data objects -> Merge)
7. Chose State from Q1 and State Q3 8. Drag and drop State and both Measures
Your table should look like:
9. Save your document as 14W Activity Synchronizing data.

35
Activity w15: Analyzing data Objective • Create a drillable document by defining a scope of analysis in the report. Instructions 1. Create a new document showing Lines and Sales revenue. 2. Define the Scope of Analysis using the Lines hierarchy to display the following levels: Category, SKU desc and Color. Note: When you set the scope of analysis level, select the Custom option and drag the objects you want to include into the Scope of Analysis zone to create a custom scope.
3. Run the query to view your results. Your report should look like the example below:

36
Note: Activate drill mode to enable drill down. 4. Save the document as w15 Drilling. 5. Drill on the report to answer the following questions: Which jacket category has the highest revenue? List the SKU descriptions for the items under the Outdoor category. Which color under the Canvas Jacket SKU has the highest sales revenue?

37
Activity w16: Working with WI Reach client Objectives • Log onto BI launch pad • View the documents that are available to you. • Open an existing document. • Create a new folder. • Save the document as a personal document. Instructions
1. Connect to RDS 2. Start -> All Programs -> SAP Business Intelligence -> Web Intelligence Rich Client
3. Log onto BI launch pad with the user name and password supplied by the instructor.

38
4. Browse to the Activity Documents folder
5. View the documents in Public Folders that are available to this user.
5. Save any document to My Analysis folder 6. Schedule the document to refresh on open.

39
7. Save the document you exported to your computer as a Microsoft Excel spreadsheet. 8. Log off from BI launch pad
9. Save as 16W Working with WI Reach client Activity
40
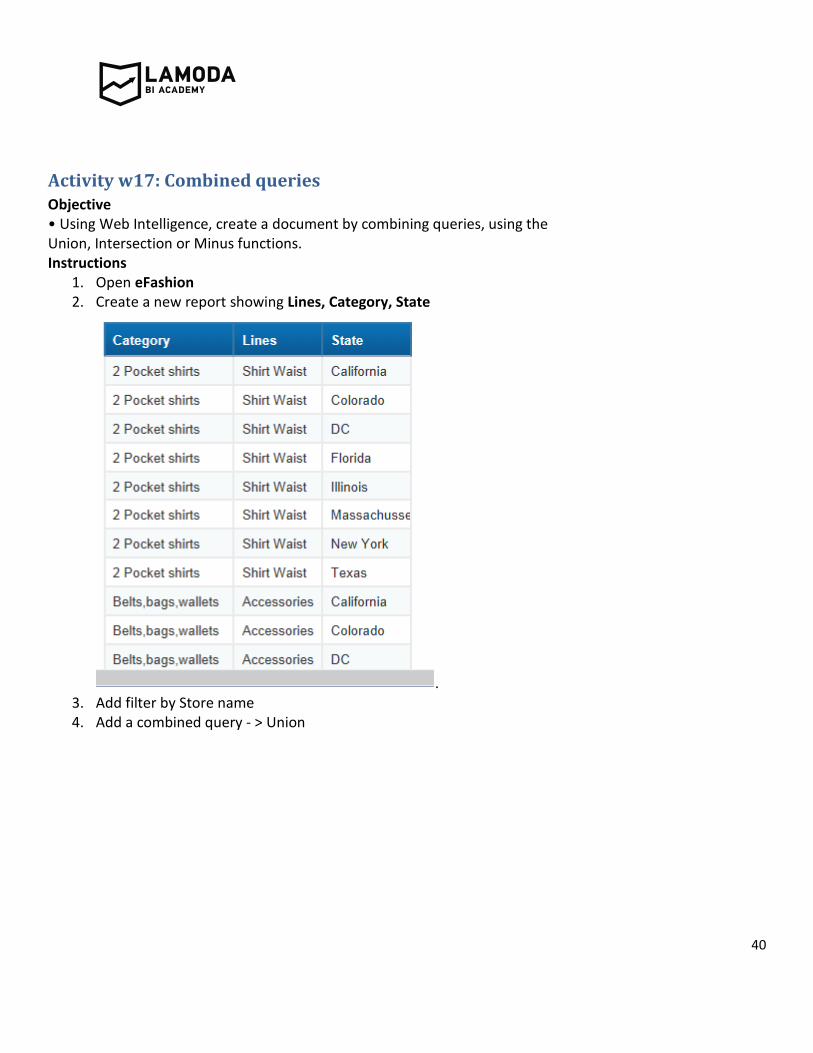
Activity w17: Combined queries Objective • Using Web Intelligence, create a document by combining queries, using the Union, Intersection or Minus functions. Instructions
1. Open eFashion 2. Create a new report showing Lines, Category, State
. 3. Add filter by Store name 4. Add a combined query - > Union

41
5.Add again 3 dimensions Lines, Category, State (!important: query1 = query2) 6.Add filter Store name

42
7. Run query
8. Save the document as 17W: Combined queries
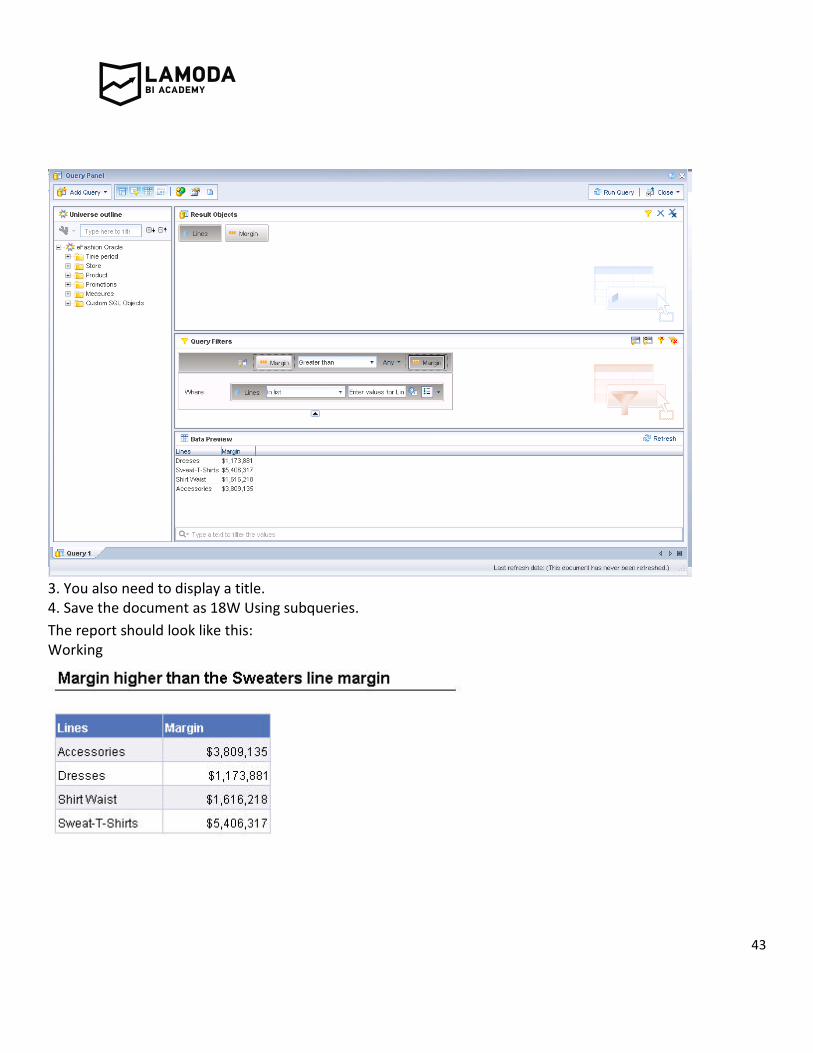
Activity w18: Using subqueries Objective • Create a subquery using the results of one query as the starting point for a second query. Instructions You have been asked by the Manager of the Colorado Springs store of the eFashion Group to produce a report that lists product lines and their Margin, when the lines' Margin is higher than that of the Sweaters line. 1. Using the eFashion universe, create a new document and build a query using Lines and Margin. 2. Using the subquery technique, return those lines with a higher Margin than the Sweaters line.
43
3. You also need to display a title. 4. Save the document as 18W Using subqueries.
The report should look like this: Working

44
Activity w19: Changing the data source Objective • In this activity, you change the data source from the development universe (eFashion) to the production universe (eStaff).
Instructions 1. From the course resources, open the report from exercise W18. The report looks like this:
2. Change the data source to the eStaff universe and map the objects as appropriate. Data Access ->Tools -> Change source 3. Specify a new data source (eStaff)

45

46
Note:To achieve the desired results, remove one object from the query and map another object to a corresponding object in the new universe that has a different name.

47
4. Use prompts enter values (Mini city, Pants, Wet wear, Long Sleeve)
Result shoul look like this:
5.Save 19W Changing the data source

48
Activity w20: Calculation contexts Objective • Use extended syntax to redefine the calculation context of measures in a Web Intelligence document.
Instructions 1. Create a document that shows in a single block: • Sales revenue for each eFashion store. • Total sales revenue for all stores. • Average revenue for all stores. (=Average([Sales revenue]) ForAll([Store name]) • Highlight those stores whose revenue was above the average revenue for all stores.
2. Change the name of the report to Revenue Information for All Stores. 3. Save the document as Act_Calculationcontext. Your document should look like this example:

49
50
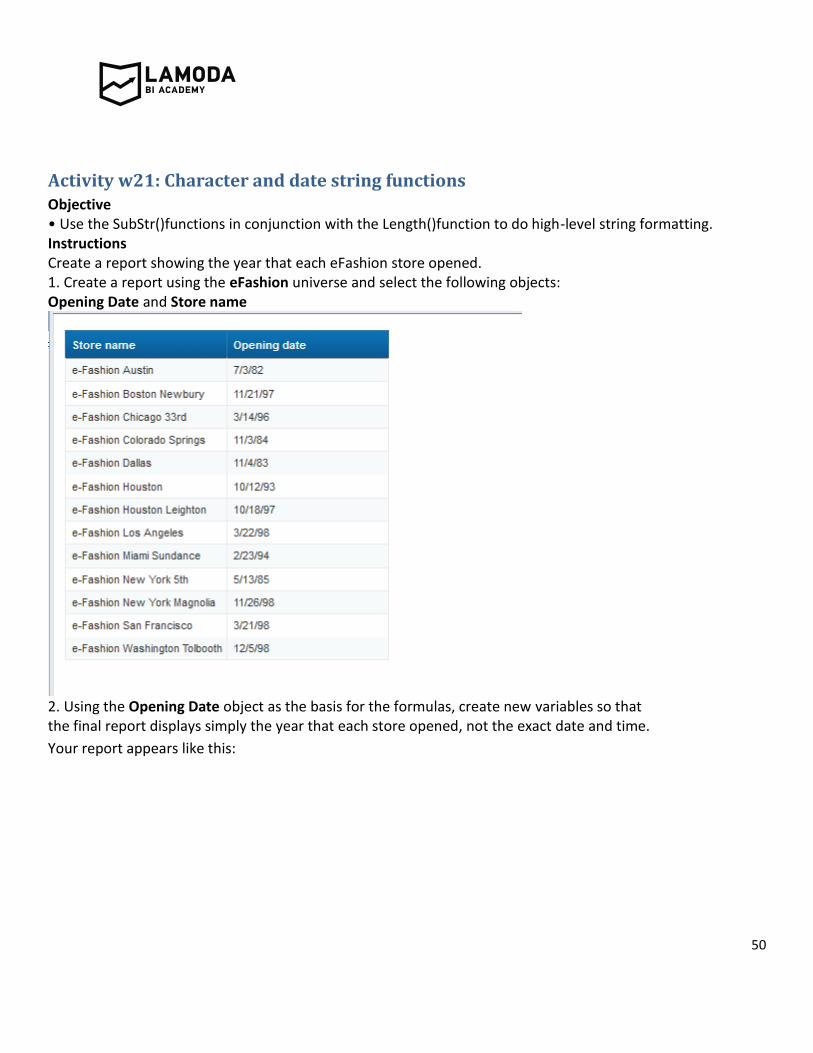
Activity w21: Character and date string functions Objective • Use the SubStr()functions in conjunction with the Length()function to do high-level string formatting. Instructions Create a report showing the year that each eFashion store opened. 1. Create a report using the eFashion universe and select the following objects: Opening Date and Store name
2. Using the Opening Date object as the basis for the formulas, create new variables so that the final report displays simply the year that each store opened, not the exact date and time.
Your report appears like this:

51
Note: The Year opened object is formatted as a number, not a date, so you must format the number to display without a comma to achieve the desired result. 3. Save the report as Act_YearOpened.

52
Activity w22: Grouping data Objective • Use the If() function syntax to group data values. Instructions You want to group states into regions so that you can compare revenue per region. 1. Create a new document using the eFashion universe and select the following objects: State and Sales revenue 2. Create a variable called Region and group the states by regions, based on the following categories:
3. Insert the Region variable into the table so that its values are projected in a new column in the table. Your report should look like this example:
4. Save the document as Act_Groupdata_1.

53
Activity w23: Modifying the calculation behavior Objective • Use the If() function to create a variable that calculates the projected revenue based on revenue by store. Instructions Using the eFashion universe, you want to display the projected revenue for each store based on the revenue generated to date. You need to create a variable to calculate this projection based on the sales revenue. This variable needs to look at the sales revenue, and if it falls above certain criteria, then a different calculation needs to be performed. 1. Create a new Web Intelligence document using the eFashion universe. 2. Include the State, Store name and Sales revenue objects in the query.
3. Create a variable called Projected Revenue. 4. Define the formula to calculate each store’s projected revenue based on the following:

54
5. Validate the syntax and verify that Web Intelligence has applied the Measure qualification to the variable. 6. Drag the Projected Variable variable to the right of the last column in the table. Your report appears like this example:

55

56
Activity w24: Displaying data restricted by a filter or ranking Objective • Build a formula to override a ranking and calculate total values. Instructions - Example 1 Create a document that displays the best sales revenue achieved for any year by state. For purposes of comparison, you also want to display the total state revenue. To achieve this, you need to create a new variable using the NoFilter() function. You will also apply breaks, ranking and formatting to the table. 1. Use the eFashion universe to build a query with the appropriate objects.
2. Modify the document to display the data as shown in the following screen capture:
Note: To display the data as shown, apply a break to the table and format the break so the break header and footer do not display. 3. Display a table header (Report element -> Table layout -> Show header). 4. On the Year column, display only the highest earning year for each state. 5. Create a new variable called Total revenue using the following syntax:

57
=NoFilter([Sales revenue] In([State])) Note: By putting In([State]) at the end of the formula, you change the way Web Intelligence calculates data by default. This is known as changing the calculation context. 6. Add the new variable to the table and display the sum in the footer of both the Sales revenue and the new Total revenue columns. 7. Verify the calculation displayed below the Total revenue column. Has the sum calculated the data correctly? 8. Using the Formula toolbar, modify the formula used in the Total Revenue footer cell to calculate the sum total accurately. The final report appears like this:
9. Save the document as Act_NoFilter.

58
Activity w25: Creating hyperlinks in the Interactive panel Objectives • In the Web Intelligence Interactive panel in BI launch pad, create two documents -- one to show sales margin for all stores for all years and another to show store details. • In the sales margin document create a hyperlink to a URL. Also, create a hyperlink on each store name to open the store details document and display only the data for the store name displayed in the hyperlink. 1. Log onto BI launch pad and verify that the Web Intelligence default view and the default creating/editing preferences are set to Interactive. 2. Using the eFashion universe, create the hyperlink target document that displays store details and save the document in the Favorites folder. 3. Create with eFashion, report same as on picture. Add filters with promt by Store name.
Save the document as Store Details.

59
4. Create with eFashion, report same as on picture. 3. Using the eFashion universe, create a second document that displays the sales margin per store and save the document in the Favorites folder.
Save the second document as Sales Margin per Store. 5. Click right button on Margin, chose Linking -> Add hyperlink ->Link to document ->Details

60
6. From the Sales Margin per Store document, create a hyperlink on the Store name value to link the two documents. Pass the value of the store name in the hyperlink to the Store Details. document so that it displays the details for a specific store name. 7. Test that the hyperlinks work in the Interactive panel. Save the documents and log off from BI launch pad 8. Save doc