BUSINESS MODEL FOR BANKS ON DRIP IN COTTON AND BETTER ...
20
Vidarbha Konkan Grameen Bank (VKGB) and Kamalnayan Jamnalal Bajaj Foundation (KJBF), Wardha BUSINESS MODEL FOR BANKS ON DRIP IN COTTON AND BETTER COTTON INITIATIVE Implemented by
Transcript of BUSINESS MODEL FOR BANKS ON DRIP IN COTTON AND BETTER ...

Vidarbha Konkan Grameen Bank (VKGB) and Kamalnayan Jamnalal Bajaj Foundation (KJBF), Wardha
BUSINESS MODEL FOR BANKS ON DRIP IN COTTON
AND BETTER COTTON INITIATIVE
Implemented by
Published byDeutsche Gesellschaft für Internationale Zusammenarbeit (GIZ) GmbH
Registered offices: Bonn and EschbornUmbrella Programme for Natural Resource ManagementA2/18, Safdarjung EnclaveNew Delhi 110 029 IndiaT: +91 11 4949 5353F : + 91 11 4949 5391E: [email protected]: www.giz.de
ResponsibleMohamed El-KhawadProgram Director and Cluster CoordinatorEnvironment, Climate Change and BiodiversityEmail: [email protected]
Rajeev AhalDirector, Natural Resource ManagementEmail: [email protected]
Technical PartnerAvinabh Kumar Gupta
Content ReviewVikash Sinha, Technical Expert, GIZ
EditorRaj Pratim Das
Design and LayoutRouge Communications [email protected]
Photo credits/GIZGIZ is responsible for the content of this publicationOn behalf of theGerman Federal Ministry for Economic Cooperation and Development (BMZ)
New Delhi, IndiaNovember, 2019
BUSINESS MODEL FOR
BANKS ON DRIP IN COTTON AND BETTER COTTON INITIATIVE

CONTENTSBusiness Model of VKGB and KJBF Foundation
1.1 01
04
06
08
Introduction
1.2 Financial Analysis
1.3 Profitability
1.4 Cost Economics
1.0

BUSINESS MODEL OF VKGB AND KJBF FOUNDATION
1.0

1BUSINESS MODEL FOR BANKS ON DRIP IN COTTON AND BETTER COTTON INITIATIVE
The National Bank for Agriculture and Rural Development (NABARD), German Development Bank (KfW) and Deutsche Gesellschaft für Internationale Zusammenarbeit (GIZ) GmbH are collectively implementing the Umbrella Programme for Natural Resource Management (UPNRM), the aim of which is to promote
environmentally sustainable growth by encouraging private investments that are pro-poor. This represents a paradigm shift as the programme moves away from purely grant-based funding to a greater reliance on loans. This increases the leverage and outreach of investments in the rural areas, creating income based on sound business models that ensure the sustainability of natural resources.
In Wardha, UPNRM is being implemented on unique Regional Rural Bank (RRB)-NGO model with Vidarbha Konkan Grameen Bank (VKGB) as the principal channel partner of UPNRM and Kamalnayan Jamnalal Bajaj Foundation (KJBF) as the implementing agency. The model leverages the strength of two agencies with VKGB focusing on financing and KJBF focusing on capacity building and project implementation on the ground.
This sub project of UPNRM in Wardha was titled - Promotion of Water Conservation based Farming through Micro Irrigation. The salient features of the sub project are provided in the table below.
Table 1: UPNRM project financial details
The sub project benefited 380 farmers with land holding of 728.5 hectares in 117 villages of Samudrapur and Hinganghat taluka. Among these 380 farmers, 78 farmers established drip irrigation system over 182.5 hectare of land while 294 farmers irrigated 546 hectares of land with sprinkler irrigation system. In addition, solar operated pumps were installed for 16 hectares of land of 8 farmers for demonstrative purposes.
VKGB was responsible for identification and selection of beneficiaries with the help of KJBF. VKGB was also responsible for providing grant to KJBF which would enable the implementation agency to conduct various activities at regular intervals to achieve the project objective.
Date of sanction Project period
Loan amount sanctioned
(in Rs Lakh)
Loan amount utilization
(in Rs Lakh)
Grant amount sanctioned
(in Rs Lakh)
Grant amount utilization
(in Rs Lakh)
November 2014 3 years 160.34 160.34 39.36 39.36
INTRODUCTION1.1
2 BUSINESS MODEL FOR BANKS ON DRIP IN COTTON AND BETTER COTTON INITIATIVE
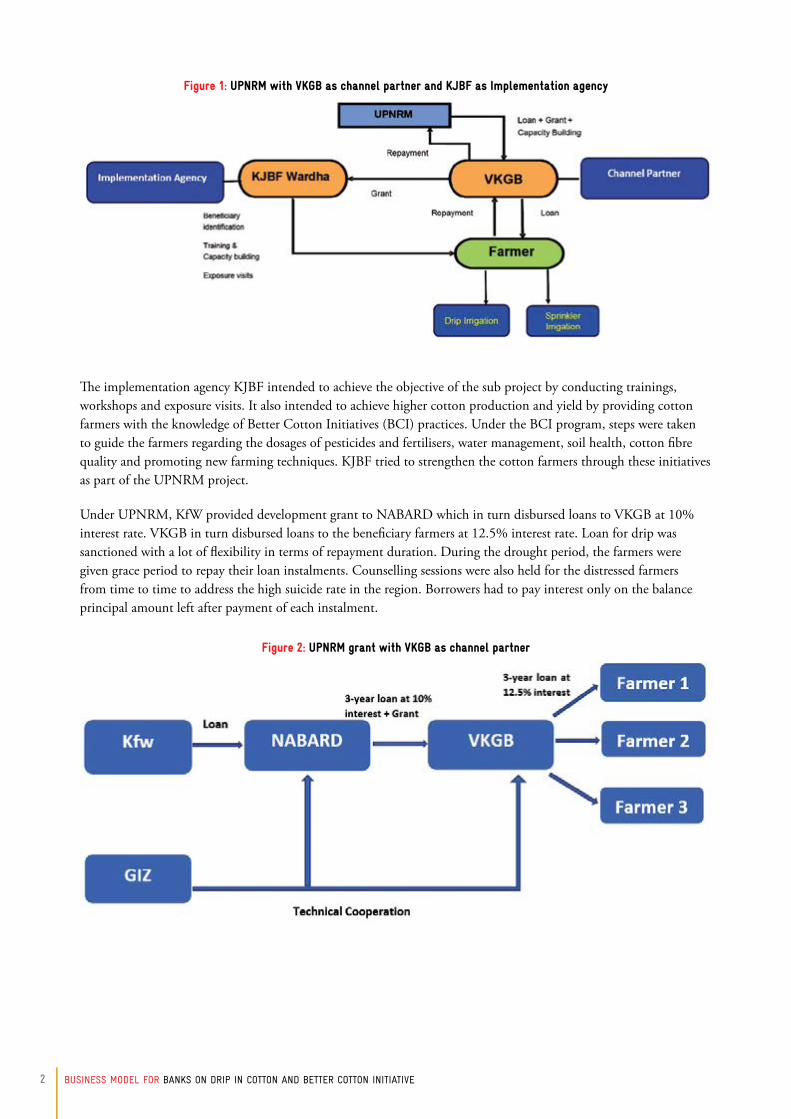
Figure 1: UPNRM with VKGB as channel partner and KJBF as Implementation agency
The implementation agency KJBF intended to achieve the objective of the sub project by conducting trainings, workshops and exposure visits. It also intended to achieve higher cotton production and yield by providing cotton farmers with the knowledge of Better Cotton Initiatives (BCI) practices. Under the BCI program, steps were taken to guide the farmers regarding the dosages of pesticides and fertilisers, water management, soil health, cotton fibre quality and promoting new farming techniques. KJBF tried to strengthen the cotton farmers through these initiatives as part of the UPNRM project.
Under UPNRM, KfW provided development grant to NABARD which in turn disbursed loans to VKGB at 10% interest rate. VKGB in turn disbursed loans to the beneficiary farmers at 12.5% interest rate. Loan for drip was sanctioned with a lot of flexibility in terms of repayment duration. During the drought period, the farmers were given grace period to repay their loan instalments. Counselling sessions were also held for the distressed farmers from time to time to address the high suicide rate in the region. Borrowers had to pay interest only on the balance principal amount left after payment of each instalment.
Figure 2: UPNRM grant with VKGB as channel partner

3BUSINESS MODEL FOR BANKS ON DRIP IN COTTON AND BETTER COTTON INITIATIVE
A loan of INR 125.08 Lakhs was given by NABARD to VKGB for 151 drip irrigation units and INR 35.26 Lakhs was given for 152 units for sprinkler irrigation. A grant of INR 39.36 Lakhs was also provided by NABARD for capacity building programmes.
The five stakeholders in the Wardha Cotton value chain are - Farmers, Traders or APMC (Agri Produce Marketing Committee), Cotton Ginning and Pressing Mills, Spinning Mills and Wholesalers and Exporters. The value chain is complex as there are many classes in which a stakeholder can be categorised. Moreover, the farmers are the first and foremost stakeholder of the cotton value chain. The farmers are responsible for production of the cotton and are involved with various activities such as - planting, seed treatment, land preparation, fertiliser application, picking and storing. Small and marginal farmers own about 65% of the total area under cultivation in Wardha.They account for approxiamtely 50% volume of raw cotton produced. These farmers mainly transact with village level traders and small traders. The large farmers own around 35% of area under cultivation and produce about 50% of raw cotton volume. The large farmers, who have substantial production capabilities, take their produce to APMC to access competitive prices. They generally sell their produce to the large traders in APMC.
The traders are classified into village level, small and large traders depending upon their procurement capability. The traders add value by performing various activities such as – aggregation, storage, grading, sorting and transporting. The village level and small level traders have direct linkages with the farmers in the villages as they also serve as money lenders to the farmers. The stock is weighed and the farmers are paid according to the current price of cotton in the market. The large traders procure cotton from large farmers. The traders in APMC are generally the large traders and they procure cotton from small traders as well.
Ginning and pressing mills are the next stakeholder in the value chain. They are responsible for extracting the cotton bale from the raw cotton and thus add value by performing a diverse set of activities such as - moisture conditioning, drying, cleaning, bale compression, classing and transportation. There are about 25 ginning mills in Hinganghat and Samudrapur blocks. The ginning and pressing mills are divided into small scale, medium scale and large-scale enterprises depending on their processing capacity. The ginning mills procure the raw cotton from various traders and produce cotton bale.
The next stakeholder in the value chain are the spinning mills. They are responsible for collecting the cotton bale and converting them into cotton yarn by performing different processes such as- carding, sliver, combing and spinning. Hinganghat has two large spinning mills which use about 35% of the cotton bale produced in Wardha. The rest 65% of the cotton bale produced is sent to Gujarat where some portion is sold to spinning mills and the rest is exported to international markets.
Wholesalers and exporters are the last stakeholder in the value chain. The wholesalers and exporters are responsible for using their distribution channel to move the product from spinning mills to the textile industry directly or via the retail outlets. Exporters sell the procured cotton yarn in the international markets and have to comply with quality standards of the international markets. The wholesalers sell their stock to retailers. Retailers are the interface between the cotton value chain and the textile industry.

4 BUSINESS MODEL FOR BANKS ON DRIP IN COTTON AND BETTER COTTON INITIATIVE
CAPITAL COST
Cotton has been a cash crop for the farmers in Wardha district. The capital cost in the model consists only of the cost associated with the installation of drip irrigation system in one acre of land. The cost of land is not taken into consideration because the farmers had the ownership of the land before the project was started. 20% of the total capital cost for drip installation was borne by the farmers and remaining 80% of the cost was sanctioned by VKGB via the loan process. The drip cost and the drip installation charge have been taken for one acre of land as the samples included farmers with different land holdings, ranging from 1 ha to 3 ha.
RECURRING COST / WORKING CAPITAL
The quality of cotton varies a lot with respect to the working capital cost. A good quality cotton usually has a higher working capital cost because of the higher cost especially labour cost associated with picking and weeding. Working capital includes expenditures such as seed procurement, fertilisers and pesticide cost, electricity cost, transportation cost and the labour cost associated with different activities performed during the whole season.
The fertiliser cost and the pesticide cost are the major components of the input cost. More the input cost, lesser is the profit margin and vice-versa. The overhead costs include the fertiliser application labour cost, pesticide spraying labour cost, electricity cost, transportation and the labour cost associated with transportation (loading and unloading). The working capital is considered for one acre of land.
Below is the working capital required to grow cotton in one acre of land with drip irrigation facilities installed. The data is considered for the year 2016 as the agro-climatic conditions were normal (as compared to drought conditions prevailing in recent years) and hence, the benefits of drip irrigation on farmers’ income could be captured in detail.
Capital cost (per acre)
Drip cost 55,074
Drip Installation charges 694
Total Rs 55,768
FINANCIAL ANALYSIS1.2
Table 2: Capital Cost of KJBF and VKGB Model

5BUSINESS MODEL FOR BANKS ON DRIP IN COTTON AND BETTER COTTON INITIATIVE
Table 3: Working Capital Cost of drip farmer
Working Capital of farmer using Drip irrigation (per Acre)
Input cost
Cost of seeds Number of packets*price of single packet= 2*850 1700
Cost of pesticides Average cost considered 4038
Cost of fertilizers Average cost considered 7771
Overhead cost
Land preparation cost Average cost considered 643
Fertilizer application cost Average cost considered 440
Pesticide Spraying Labour cost Number of spraying*cost of labour = 3*250 750
Weeding Labour cost Average cost considered 2100
Drip Annual Maintenance Average cost considered 390
Electricity cost Average cost considered 550
Picking and storage Labour cost Picking cost per kg*production in one acre= 8.65*986 8529
Transportation cost Average cost considered 872
Labour cost for loading of cotton for transport
Average cost considered 581
Total 28, 365
Benefits of BCI PracticesFarmers in Wardha adopted BCI practises which helped them to lower their input cost and conserve water. The BCI practices were implemented before the installation of drip technology in the agricultural land therefore allowing the research to attribute the benefits of BCI practices alone. Below is an analysis of the benefits achieved by the farmers of Wardha following BCI practices.
Labour cost: The farmers were able to save around INR 2000 per acre in terms of labour cost. The main component of this saving was the reduction in number of pesticides spraying by 2-3 times.
Water conservation: By implementing the BCI practises, the farmers saved 30% of water required for the cotton crop. This was mainly achieved by replacing the flood irrigation by the alternate furrow irrigation technique.
Pesticide cost: The pesticide cost was reduced by around INR 1200 per acre. This was mainly because of the incorporation of bio pesticide which are usually homemade and inexpensive. The examples of bio pesticide being used were Neem Ark, Bhram-astra, agni-astra, etc. The number of chemical pesticides spraying was reduced by 2-3 times from 6-7 times to 4-5 times which resulted in reduced labour cost for pesticide spraying.
Increase in Yield: The yield of cotton was increased by about 3 quintals per acre because the farmers followed the High-Density Plantation (HDP) method which is an integral principle of BCI. High density plantation means to increase the plant population per unit area for increasing the production of crops.
Fertiliser cost: The fertiliser cost was saved by about INR 2500 per acre. This was mainly achieved by applying specific fertiliser dosages as recommended in the soil testing report. This was not the case before, and farmers used to randomly apply fertilisers based on the advice of the input retailer.
Field Ploughing Cost: After incorporation of BCI practices, the farmers started ploughing their fields once in two years ploughing their fields every alternate year and saved around INR 1500 per acre per annum. Earlier farmers were found to be ploughing their fields every year with rented equipment which resulted in higher costs.
Increase in price: By implementing BCI practices, the farmers were able to get a price increase of INR 100 toINR 125 per quintal of cotton. This was mainly because of better picking practices (using cloth to cover head while picking cotton that ensured no impurities (human hair) enter the harvested cotton) and better post-harvest practices (elimination of practice of adding water to increase weight).
6 BUSINESS MODEL FOR BANKS ON DRIP IN COTTON AND BETTER COTTON INITIATIVE
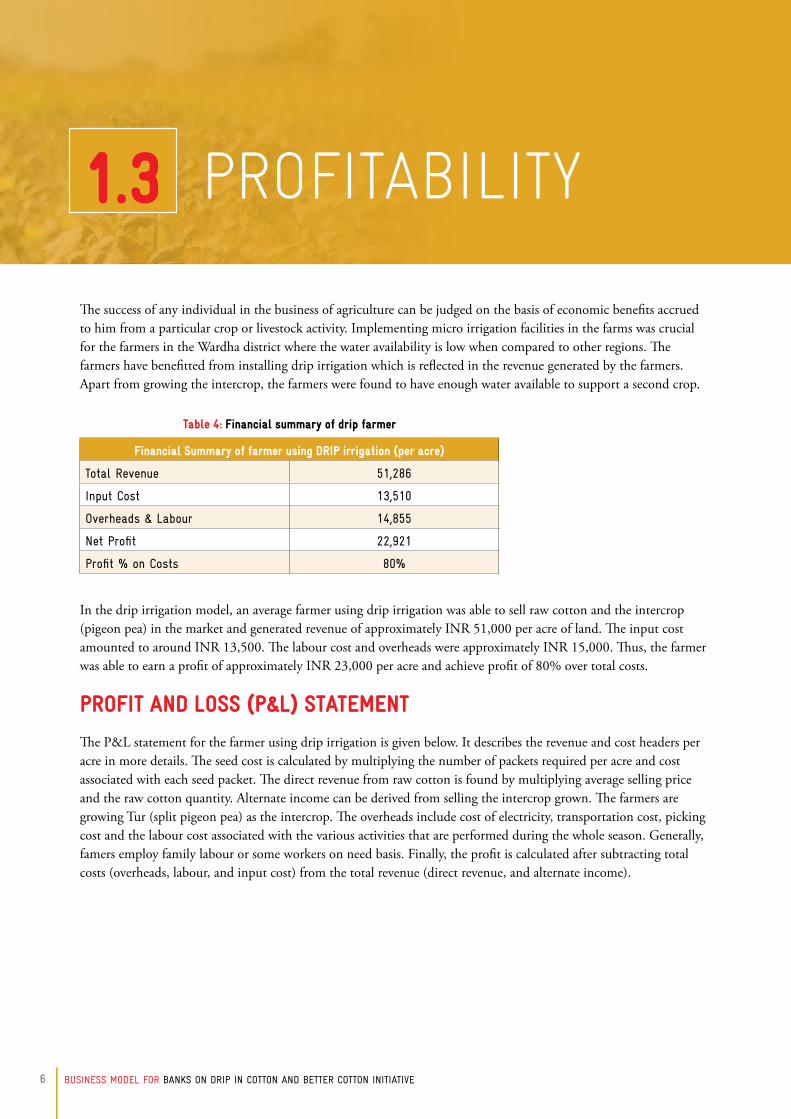
The success of any individual in the business of agriculture can be judged on the basis of economic benefits accrued to him from a particular crop or livestock activity. Implementing micro irrigation facilities in the farms was crucial for the farmers in the Wardha district where the water availability is low when compared to other regions. The farmers have benefitted from installing drip irrigation which is reflected in the revenue generated by the farmers. Apart from growing the intercrop, the farmers were found to have enough water available to support a second crop.
In the drip irrigation model, an average farmer using drip irrigation was able to sell raw cotton and the intercrop (pigeon pea) in the market and generated revenue of approximately INR 51,000 per acre of land. The input cost amounted to around INR 13,500. The labour cost and overheads were approximately INR 15,000. Thus, the farmer was able to earn a profit of approximately INR 23,000 per acre and achieve profit of 80% over total costs.
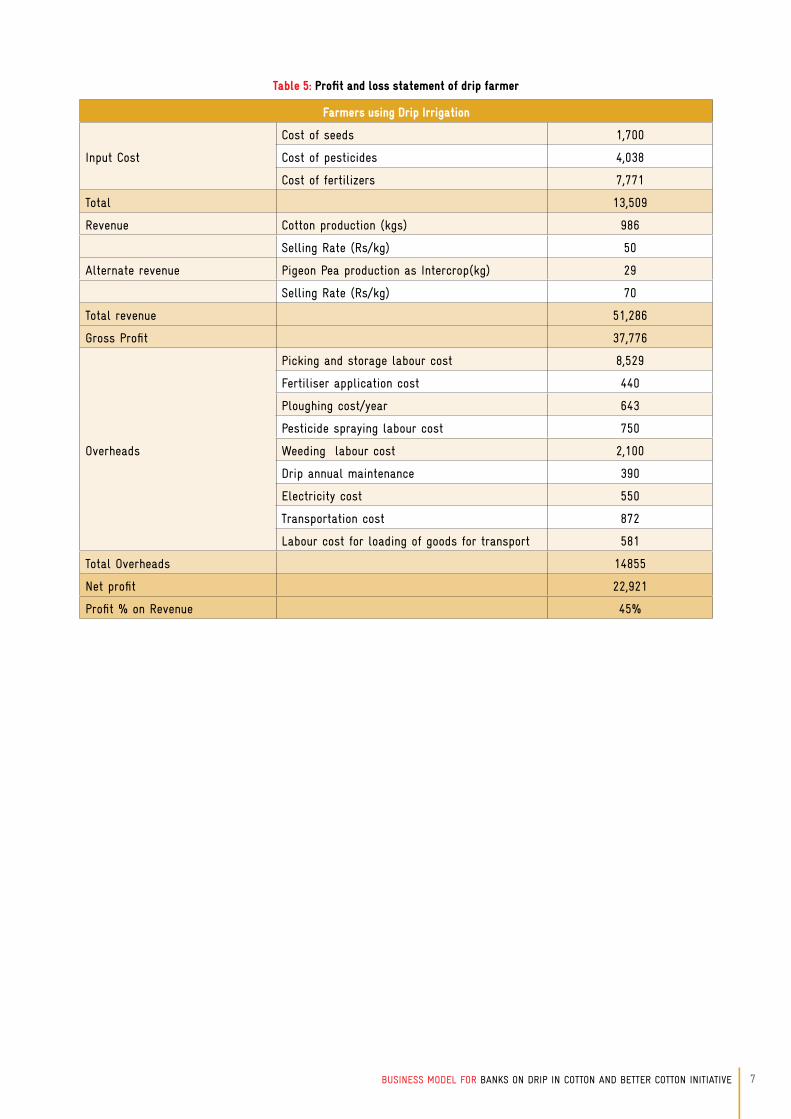
PROFIT AND LOSS (P&L) STATEMENT
The P&L statement for the farmer using drip irrigation is given below. It describes the revenue and cost headers per acre in more details. The seed cost is calculated by multiplying the number of packets required per acre and cost associated with each seed packet. The direct revenue from raw cotton is found by multiplying average selling price and the raw cotton quantity. Alternate income can be derived from selling the intercrop grown. The farmers are growing Tur (split pigeon pea) as the intercrop. The overheads include cost of electricity, transportation cost, picking cost and the labour cost associated with the various activities that are performed during the whole season. Generally, famers employ family labour or some workers on need basis. Finally, the profit is calculated after subtracting total costs (overheads, labour, and input cost) from the total revenue (direct revenue, and alternate income).
Financial Summary of farmer using DRIP irrigation (per acre)
Total Revenue 51,286
Input Cost 13,510
Overheads & Labour 14,855
Net Profit 22,921
Profit % on Costs 80%
PROFITABILITY1.3
Table 4: Financial summary of drip farmer
7BUSINESS MODEL FOR BANKS ON DRIP IN COTTON AND BETTER COTTON INITIATIVE
Table 5: Profit and loss statement of drip farmer
Farmers using Drip Irrigation
Input Cost
Cost of seeds 1,700
Cost of pesticides 4,038
Cost of fertilizers 7,771
Total 13,509
Revenue Cotton production (kgs) 986
Selling Rate (Rs/kg) 50
Alternate revenue Pigeon Pea production as Intercrop(kg) 29
Selling Rate (Rs/kg) 70
Total revenue 51,286
Gross Profit 37,776
Overheads
Picking and storage labour cost 8,529
Fertiliser application cost 440
Ploughing cost/year 643
Pesticide spraying labour cost 750
Weeding labour cost 2,100
Drip annual maintenance 390
Electricity cost 550
Transportation cost 872
Labour cost for loading of goods for transport 581
Total Overheads 14855
Net profit 22,921
Profit % on Revenue 45%

8 BUSINESS MODEL FOR BANKS ON DRIP IN COTTON AND BETTER COTTON INITIATIVE
Income Projections
In this section, some projections about the revenue, cost and profit of the drip irrigation method are made based on assumptions. The capital cost for drip installation is a one-time investment with a minimal cost occurring yearly for its maintenance after first year.
As per the primary data collected, it is assumed that the processor made no changes to other existing financing options such as trader credit, VKGB loan, commercial loan, etc. The input cost for cotton production are expected to increase each year by 4.5%, which is derived from the WPI inflation averaged over 10 years. Similarly, the selling price of raw cotton increases at a rate of 4.5%, which is derived from the averaged WPI inflation rate. This 4.5% is an assumption as there is no available raw cotton price trends because of the unpredictable nature of the seasonal cotton industry. A conservative 2% increase in yield is also considered for cotton and the intercrop (Pigeon pea) grown. The overhead cost is also considered to increase by 4.5%.
Table 6: Income projections of KJBF and VKGB model
Year Cost (INR) Revenue Profit
2019 28,365 51,286 22,921
2020 29,641 54,665 25,024
2021 30,975 58,268 27,293
2022 32,369 62,108 29,739
2023 33,825 66,201 32,375
2024 35,347 70,563 35,216
2025 36,938 75,213 38,275
After determining the total quantity of raw cotton produced and the selling price the total revenues can be calculated by keeping the weightage of other cost and revenue variables as same. The net income can be derived by subtracting total costs from the total revenue.
COST ECONOMICS1.4

9BUSINESS MODEL FOR BANKS ON DRIP IN COTTON AND BETTER COTTON INITIATIVE
Figure 3: Income projections of KJBF and VKGB model
It reflects a healthy growth rate of 9% despite other financing options being constant. If the project mainstreams the working capital requirement through commercial banking, then this growth rate can easily exceed the derived 9% value.
Internal Return Rate (IRR)
Internal Return Rate is the rate of growth a project is expected to generate. While the actual rate of return that a given project ends up generating will often differ from its estimated IRR, a project with a substantially higher IRR value than other available options would still provide a much better chance of strong growth. While calculating IRR and Net Present Value (NPV), the capital cost is taken for year 0. From 2019 cash inflow (profits) are considered from above projections.
IRR is calculated using the cash inflow (profits). In the drip irrigation model, the Internal Rate of Return (IRR) of 44% reflects the financial viability of the model. Similarly, NPV is the difference between the present value of cash inflows and the present value of cash outflows over a period of time. A positive net present value indicates that the projected earnings generated by a project or investment exceeds the anticipated costs. The present value is calculated for each year by considering the Reserve Bank of India (RBI) defined discount rate of 6.25%, resulting in a very healthy NPV of INR 1,07,486.
With an IRR of 44% and NPV of INR 1,07,486 the Wardha drip model is a smart choice for investor firms or commercial banks.

10 BUSINESS MODEL FOR BANKS ON DRIP IN COTTON AND BETTER COTTON INITIATIVE
Table 7: IRR and NPV Calculations KJBF and VKGB Model
Year Cash flow Present Value
Year 0 -55769 -55769
2,019 22,921 21,572.80
2020 25024 22,166.96
2021 27,293 22,754.37
2022 29739 23,335.16
2023 32,375 23,909.43
2024 35216 24,477.32
2025 38,275 25,038.93
NPV 1,07,486
IRR 44%
Benefit Cost Ratio (BCR)
Benefit Cost Ratio (B/C ratio) or Cost Benefit Ratio is another financial ratio which is considered for evaluating a project investment. This is an indicator used in cost-benefit analysis to show the relationship between the relative costs and benefits of a proposed project, expressed in monetary or qualitative terms.
The BCR must be used as a tool in conjunction with other types of analysis to make a well-informed decision.
Figure 4: BCR value Indicators
The BCR of a project is calculated by dividing the proposed total cash benefits (present value of net positive cash flow) by the proposed total cash costs (present value of net negative cash flow) at the mentioned discount rate.
Benefit Cost Ratio (BCR) = PV of Net Positive Cash Flow/PV of Net Negative Cash Flow BCR = 1,63,255/55769
BCR = 2.92
The value of BCR is greater than 1 and indicates that the model will deliver a positive net present value to the investors (banks, firms, etc) making it a profitable investment opportunity.
Payback Period
Payback period is the time required to recover the cost of an investment. It is the number of years it would take to get back the initial investment made for a project.
BCR VALUE INDICATION
GREATER THAN 1 THE PROJECT’S BENEFITS OUTWEIGH THE COSTS AND SHOULD BE CONSIDERED
LESS THAN 1 THE PROJECT’S COSTS OUTWEIGH THE BENEFITS AND SHOULD NOT BE CONSIDERED

11BUSINESS MODEL FOR BANKS ON DRIP IN COTTON AND BETTER COTTON INITIATIVE
It is a simple way to evaluate the risk associated with a proposed project. The desirability of an investment is directly related to its payback period. Shorter paybacks mean more attractive investments. Calculation of payback period is done below.
A= Last period of negative cash flow (number of years before full recovery)
B= Unrecovered cost at start of the year
C= Cash flow during the year
Table 8: Variables for payback period calculation
Year Expected Cash flow Remaining cash needed to cover initial investment
2019 22,921 32,848
2020(A) 25,024 7824(B)
2021 27,293(C) Not Required
Payback period = Years before full recovery (A) + ----------------------------------------------------------Unrecovered cost at start of the year(B)
Cash Flow during the year(C)
Applying the formula, Payback period = A + B/C
= 2 + 7824/27293 = 2.28
The payback period is 2.28 years which indicates that the initial capital cost of INR 55,769 will be recovered in 2 years and 4 months approximately. This short payback period of the model makes it quite attractive opportunity for investments as the time required to recover the cost of an investment is quite short.
Breakeven analysis
Break-even point analysis is a measurement system that calculates the margin of safety by comparing the amount of revenues or units that must be sold to cover fixed and variable costs associated with the sales. In other words, it’s a way to calculate when a project will be profitable by equating its total revenues with its total expenses.
Fixed cost: INR 55,678
Sales Price of 1Kg raw cotton: INR 50
Total production of raw cotton (Kg): 986
Variable cost of 1Kg raw cotton: INR 28.76 (variable cost of labour, overheads and production of 986Kg cotton is INR 28,365).
Pigeon pea is not considered for breakeven analysis because the quantity of pigeon pea is less than 3% of that of cotton.

12 BUSINESS MODEL FOR BANKS ON DRIP IN COTTON AND BETTER COTTON INITIATIVE
Sales amount of cotton = Total Production * Selling Price
= 986*50
= Rs 49,300
Total variable cost associated with 986 Kgs of raw cotton = Total production * variable cost per Kg
= 986* 28.76
= INR 28,357
Contribution margin (sales amount- total variable cost) = 49300- 28357
= INR 20,943
The contribution margin ratio is 42.48% (total contribution margin INR 20,943/total sales INR 49,300). Assuming the input cost remains constant and fixed costs for the company are INR 55,769.
Break-even point in Rupees = Fixed capital Cost/contribution margin ratio
= 55768/.4248
= INR 131281
So, the processor needs to generate INR 1,31,283 to reach the break-even point through sales of raw cotton.
Considering selling price of 1Kg of cotton (INR 50) as constant.
Amount of raw cotton (in Kg): = Breakeven point/ Selling price
= 1,31,281/50 = 2,625 Kgs
The farmer needs to sell a total of 2,625 Kg of raw cotton in order to reach the breakeven point.
The difference between breakeven value and the fixed capital costs is small, which is a positive indicator in terms of investment opportunity for commercial banks and investors.


BUSINESS MODEL FOR BANKS ON DRIP IN COTTON AND BETTER COTTON INITIATIVE
Deutsche Gesellschaft für Internationale Zusammenarbeit (GIZ) GmbH
A2/18 Safdarjung EnclaveNew Delhi-110029 India
T: +91-11-494953535E: [email protected]/India