Business fluctuations and bankruptcy avalanches …...Business fluctuations and bankruptcy...
18
J Econ Interact Coord (2009) 4:195–212 DOI 10.1007/s11403-009-0054-x REGULAR ARTICLE Business fluctuations and bankruptcy avalanches in an evolving network economy Domenico Delli Gatti · Mauro Gallegati · Bruce C. Greenwald · Alberto Russo · Joseph E. Stiglitz Received: 30 September 2008 / Accepted: 13 May 2009 / Published online: 29 May 2009 © Springer-Verlag 2009 Abstract We analyze the properties of a three-sector network economy character- ized by credit relationships connecting downstream and upstream firms (inside credit) and credit relationships connecting firms and banks (outside credit). The network topology changes over time due to an endogenous process of partner selection (the preferred-partner choice rule). The output of simulations shows that a business cycle at the macroeconomic level can develop as a consequence of the complex interaction of the heterogeneous financial conditions of the agents involved. In this paper we focus on the emergence of bankruptcy crises: the bankruptcy of one agent can bring about the bankruptcy of one or more other agents in a snowball effect of more or less large size, depending on the network structure and the incidence of non-performing loans on balance sheets of agents involved. Keywords Business fluctuations · Credit interlinkages · Network topology · Bankruptcy chain D. Delli Gatti Istituto di Teoria Economica, Università Cattolica, Largo Gemelli1, 20123 Milan, Italy M. Gallegati · A. Russo (B ) Dipartimento di Economia, Facoltà di Economia “Giorgio Fuà”, Università Politecnica delle Marche, Piazzale Martelli 8, 60121 Ancona, Italy e-mail: [email protected] B. C. Greenwald Columbia University, 611 Uris Hall, New York, NY 10027, USA J. E. Stiglitz Uris Hall, Columbia University, 3022 Broadway, New York, NY 10027, USA J. E. Stiglitz National Bureau of Economic Research (NBER), Cambridge, USA 123
Transcript of Business fluctuations and bankruptcy avalanches …...Business fluctuations and bankruptcy...
J Econ Interact Coord (2009) 4:195–212DOI 10.1007/s11403-009-0054-x
REGULAR ARTICLE
Business fluctuations and bankruptcy avalanchesin an evolving network economy
Domenico Delli Gatti · Mauro Gallegati ·Bruce C. Greenwald · Alberto Russo ·Joseph E. Stiglitz
Received: 30 September 2008 / Accepted: 13 May 2009 / Published online: 29 May 2009© Springer-Verlag 2009
Abstract We analyze the properties of a three-sector network economy character-ized by credit relationships connecting downstream and upstream firms (inside credit)and credit relationships connecting firms and banks (outside credit). The networktopology changes over time due to an endogenous process of partner selection (thepreferred-partner choice rule). The output of simulations shows that a business cycleat the macroeconomic level can develop as a consequence of the complex interactionof the heterogeneous financial conditions of the agents involved. In this paper we focuson the emergence of bankruptcy crises: the bankruptcy of one agent can bring aboutthe bankruptcy of one or more other agents in a snowball effect of more or less largesize, depending on the network structure and the incidence of non-performing loanson balance sheets of agents involved.
Keywords Business fluctuations · Credit interlinkages · Network topology ·Bankruptcy chain
D. Delli GattiIstituto di Teoria Economica, Università Cattolica, Largo Gemelli1, 20123 Milan, Italy
M. Gallegati · A. Russo (B)Dipartimento di Economia, Facoltà di Economia “Giorgio Fuà”,Università Politecnica delle Marche, Piazzale Martelli 8, 60121 Ancona, Italye-mail: [email protected]
B. C. GreenwaldColumbia University, 611 Uris Hall, New York, NY 10027, USA
J. E. StiglitzUris Hall, Columbia University, 3022 Broadway, New York, NY 10027, USA
J. E. StiglitzNational Bureau of Economic Research (NBER), Cambridge, USA
123
196 D. Delli Gatti et al.
JEL Classification C63 · D85 · E32
1 Introduction
In this paper we study the properties of a credit-network economy in which a multi-tude of heterogeneous agents interact giving rise to complex patterns of productive andcredit relationships. The amplitude of business fluctuations is related to the networktopology emerging from an endogenous process of partner selection. In particular, theevolution of the credit network depends on a preferred-partner choice rule accordingto which each agent selects the best partner in a limited set of observable partners dueto imperfect information.
In this framework, it is straightforward to think of agents as nodes and of debtcontracts as links in a credit network. Direct interaction—exemplified by debt con-tracts—is the raison d’etre of the network. Indirect interaction, i.e. interaction through“prices”–may still occur but does not necessarily lead to an equilibrium outcome,because decentralized decision making is not governed by a benevolent auctioneer, apure figment of fantasy which we will get rid of in modelling the network.1
It is also straightforward to think of agents as intrinsically heterogeneous. Differentcharacteristics such as technological, informational and financial endowments, pref-erences or expectations—to name just a few—can account for the role of lenders orborrowers that agents can assume.
Central to this picture is information, not only about the status of the parties in acredit relationship but also about the incentive structures that they face. The lender hasto assess the risk involved in extending credit to a specified borrower and his abilityand willingness to fulfill debt obligations. But information is asymmetric so that suchan assessment is at best incomplete: all the issues crucial to modelling borrowers’ andlenders’ behaviour in an asymmetric information context are relevant also in designingthe network of credit relationships. In this context, a simple and easily available indi-rect sign of the borrowers’ creditworthiness is a measure of their financial soundnesscaptured, for instance, by net worth.
In a credit relationship, a borrower may not be able to fulfill debt commitments,either by misfortune or mismanagement. The bankruptcy of a borrower is irrelevantif, so to speak, the agent is an “island”. In a networked economy, bankruptcy will notbe an isolated and therefore insignificant phenomenon. The bankruptcy of one agentcan bring about the bankruptcy of one or more other agents in a snowball effect ofmore or less large size. In other words, in a credit network we can observe avalanchesof bankruptcies.
Building upon ideas expounded first in Stiglitz and Greenwald (2003, Chapter 7),in Delli Gatti et al. (2006) we have modelled a credit network consisting of house-holds, firms and banks. Agents are linked by inside credit (i.e. credit relationships
1 Recent books by Jackson (2008), Vega-Redondo (2007) and Goyal (2007) describe the frontier of theresearch on economic networks. A growing literature has recently developed on the network analysis ofthe interbank market; see, for instance, Allen and Gale (200); Freixas et al. (2000); Furfine (2003); Ioriet al. (2006); Nier et al. (2007). Boissay (2006) and Battiston et al. (2007), instead, focus on the trade-creditrelationships along the “supply chain”.
123
Business fluctuations and bankruptcy avalanches in network economy 197
connecting firms belonging to different layers of the same industry, the corporatesector) and outside credit (i.e. credit relationships connecting agents belonging to dif-ferent sectors, i.e. banks and firms). In that paper, however, the network is static, i.e.its structure does not change over time. The specific contribution of the present paperis the introduction of a mechanism for the endogenous evolution of the network struc-ture, the preferred-partner choice rule which is defined as follows. In every period,each customer search for the minimum of the prices charged by a randomly selectedset of suppliers; if the minimum price is lower than the price the customer paid to theold supplier in the previous period, he will switch to the new supplier, otherwise hewill stick to the old supplier. In the jargon of the network literature, the number of linksconnecting the nodes of the customers to a certain node of the suppliers changes overtime so that the topology of the network is also in a process of continuous evolution.2
In the credit network we consider households play the role of passive final consum-ers. They spend their entire income purchasing consumption goods. The corporatesector consists of two layers of firms. Downstream (D hereafter) firms produce con-sumption goods, while upstream (U hereafter) firms supply intermediate inputs to Dfirms. Banks extend credit to firms in both layers. D firms are pure borrowers: theyborrow from U firms (trade credit) and from banks (bank loans). Banks are pure lend-ers: they lend to D and U firms. U firms are borrowers and lenders at the same time:they borrow from banks and lend to D firms.
Lenders conceive the borrower’s net worth as a proxy of creditworthiness. Hencecredit extended is increasing with the borrowers’ net worth. Since the scale of produc-tion of D firms is constrained only by the availability of funds, in the end, the supplyof consumption goods is increasing with net worth.
The net worth of D firms is the engine of growth and fluctuations in this economy.The scale of activity of U firms, in fact, is determined by the production of D firms.Changes in the D net worth, therefore, brings about changes in the same direction of Uproduction, profit and net worth. An unexpected shock to D revenues affect the creditrelationship between D firms and their U suppliers. Also banks are involved becausethe interest rate that banks charge, are a function of borrowers’ net worth.
If the shock is large enough, the D firm may be unable to fulfill debt commitmentsand go bankrupt. “Bad debt”, i.e. non-performing loans—affect the net worth of lend-ers, who can react increasing the interest rate. The interest rate hike leads to morebankruptcies and eventually to a bankruptcy chain: “the high rate of bankruptcy is acause of the high interest rate as much as a consequence of it” (Stiglitz and Greenwald,2003, p. 145).
The endogenous evolution of credit interlinkages affects the extent of bankruptcies’diffusion, because of the interdependence of firm and bank behaviours: the default ofone agent (e.g., a downstream firm) can cause the default of another agent by decreasing
2 Jackson (2005) distinguishes between a random graph approach to network formation, borrowed fromphysics, and the game theoretic approach specifically designed to deal with economic networks. The formeris, in a sense, “mechanical”: networks formation is purely stochastic or the product of an ad hoc algorithm.The latter focuses on “equilibrium” networks, where links are formed as a consequence of cost-benefitanalysis on the part of self-interested individuals. The approach followed in the present paper is half-waybetween the two: the preferred partner choice rule allocates links to nodes as a consequence of the algorithmthat represents the search for the lowest price on the part of customers.
123
198 D. Delli Gatti et al.
its financial soundness (e.g., an upstream firm linked to the bankrupt downstream one)and so on, depending on the number of links among agents (the default of an agent withmany links implies a high probability of bankruptcy diffusion across the network).
All in all, we consider four markets: consumption goods, intermediate goods, labourand credit. “Quantities”, i.e. the amount of consumption and intermediate goods pro-duced, labour employed and credit extended are not affected by “prices”. They depend,instead, in a complicated way on the financial conditions of the agents involved.
In two of the markets, i.e. the markets for intermediate goods and for bank loans,a preferred partner choice rule is applied. In these cases, the “prices” i.e. the interestrate on trade credit and on bank loans—affect the number of clients of each seller—theU firms and the banks, respectively—and therefore their profits and net worth.3
We study the properties of the network by means of simulations, which show thata business cycle at the macroeconomic level can develop as a consequence of thecomplex interaction of the agents’ financial conditions. In other words, statistical reg-ularities emerge as a self-organised process at the aggregate level. At the same time,the main facts of firms’ demography (such as power law distribution of firms’ size andLaplace distribution of growth rates) emerge endogenously.
The paper is organized as follows. The model is presented and discussed in Sect. 2.Section 3 is devoted to the discussion of the simulation results. Section 4 concludes.
2 The model
We model a multi-sector economy in discrete time (t = 1, 2, . . . , T ) populated by amultitude of heterogeneous agents. The economy consists of three sectors: a down-stream sector consisting of I firms (labeled by the index i = 1, 2, . . . , I ), an upstreamsector with J firms ( j = 1, 2, . . . , J ) and a banking sector consisting of Z banks(z = 1, 2, . . . , Z). In order to keep the analysis simple, the number of firms and ofbanks is exogenous.4
There are two goods, a consumption good and an intermediate good. D firms pro-duce a perishable consumption good using labor and intermediate goods. For simplicityand as a first approximation to a more realistic setting, we assume that firms sell all theoutput they produce at a stochastic price. In other words, households absorb completelythe supply of consumption goods. Therefore D firms do not hold inventories—eithervoluntary or involuntary—of consumption goods.
U firms produce the intermediate good “on demand” with a technology that requiresonly labor. Therefore U firms do not hold inventories of intermediate goods. We areruling out by construction the possibility of avalanches of output due to the mismatchof demand and supply of intermediate goods along a supply chain à la (Bak et al. 1993).
The financial side of the economy is characterized by two lending relationships:(i) downstream and upstream firms obtain credit from banks; (ii) downstream firmsbuy intermediate goods from upstream firms by means of a commercial credit contract.
3 On the other markets prices are exogenous, random (in the case of consumption goods) or deterministic(in the case of the labour market).4 Since in our framework agents can leave the market due to bankruptcy, in order to preserve constancy ofthe number of agents we have to apply a one-to-one replacement procedure. See below.
123
Business fluctuations and bankruptcy avalanches in network economy 199
The structure of the network of expenditure, production and credit relationshipsevolves endogenously due to the decentralized interaction among agents, on the basisof a simple incentive mechanism which we have labelled the preferred-partner choice:in every period each D firm looks for the U firm with the lowest price of intermediategoods; at the same time each firm searches for the bank with the lowest interest rate.
The core assumption of the model is that the scale of activity of the i th D firm attime t, i.e. the level of production Yit —is an increasing concave function of its financialrobustness, captured by net worth Ait :
Yit = φ Aβi t (1)
where φ > 1, 0 < β < 1 are parameters, uniform across D firms. The equation aboverepresents the financially constrained output function.
There are (at least) two rationales for (1). First, it can be thought of as a simplerule of thumb in a world in which (i) bounded rationality prevents the elaborationof optimizing decision-making processes and (ii) asymmetric information betweenborrowers and lenders yields a financing hierarchy in which net worth ranks first.
Alternatively one can think of equation (1) as the solution of an optimization prob-lem on the part of the firm. According to Greenwald and Stiglitz (1993) for instancethe problem of the form consists in maximizing expected profits E (πi ) net of bank-ruptcy costs Ci weighted by the probability of bankruptcy �i . From the definitionof profits follows that they are an increasing function of output Yi given net worthAi . Bankruptcy costs are assumed to be increasing with the firm’s size. Finally, fromthe definition of the probability of bankruptcy, it turns out that it is increasing withthe scale of activity, given net worth. An increase of financial fragility, captured by areduction of net worth, brings about an increase of the probability of bankruptcy. Inthe end the Greenwald–Stiglitz characterization of the problem of the firm is:
maxYi
V (Yi ; Ai ) = E (π (Yi ; Ai )) − C (Yi )� (Yi ; Ai )
whose solution is
Yi = arg max V (Yi ; Ai ) = f (Ai ) (2)
with f ′ > 0. Equation (1) can be considered a linearization of (2). By construction, thesecond interpretation of (1) is grounded on more stringent requirements of rationalitythan those implicit in (i) above. However, it is still true that asymmetric informationyields a financing hierarchy as assumed in (ii). The concavity of the financially con-strained output function captures the idea that an increase in the variance of financialconditions brings about a reduction of average (and therefore aggregate) output.
For simplicity we assume that the production function of D firms is of the Leontieftype: Yi = min( 1
δdNi ,
1γ
Qi ) with δd > 0 and γ > 0. Therefore, D firms have the fol-lowing labor and intermediate goods requirement functions: Nit = δdYit , Qit = γ Yit .
In the end, both the demand for labor and the demand for intermediate goods of
123
200 D. Delli Gatti et al.
downstream firms depend in a non-linear way on their financial conditions. Nit =δdφ Aβ
i t , Qit = γφ Aβi t .
Final goods are sold at a stochastic price uit , that is a random variable uniformlydistributed in the interval (0, 2).5 We can provide the following rationale for thisapparently restrictive assumption. Let the demand of the i th commodity in period t bed (uit , δi t+1) where uit is the relative price of the i th commodity and δi t is a stochasticdemand disturbance specific to the market in question. Let supply be sit . By assumptionsit is made up of the quantities produced by a “large number” of producers so that thecontribution of each firm to total supply is negligible. In equilibrium uit = f (δi t , sit )
i.e. the relative price is an increasing function of the demand disturbance, given the pre-determined supply. If demand is sufficiently elastic, changes in supply do not affectthe relative price significantly so that the relative price is essentially an increasingfunction of random demand. A high realization of uit can be thought of as a regimeof high demand which drives up the relative price of the commodity in question. In aregime of low demand, the realization of uit turns out to be low and may push the firmout of the market if it is “too low”, i.e. if it makes the net worth of the firm negative.
Upstream firms produce the intermediate good by means of a Leontief technologywhich employs only labor: Q jt = 1
δuN jt where δu > 0. For simplicity, we assume an
asymmetric structure of the D–U network: many D firms can be linked to a single Ufirm but each D firm has only one supplier of intermediate goods.
In each period the supplier—say the j th firm—receives orders from a set of Dcustomers which will be denoted by � j . Since each D firm looks for the U firm withthe lowest price of intermediate goods, by construction the number of elements of � j
depends on the price p jt that the upstream firm charges to its customers: the lower theprice, the higher the number of downstream firms placing orders to the j th supplierof intermediate goods.
The price the supplier is charging is defined as p jt = 1 + r jt where r jt is theinterest rate on trade credit. We assume that the level of r jt depends on the financialcondition of the upstream firm:
r jt = αA−αj t (3)
with α > 0. In words, the interest rate on commercial paper charged to each and everyD firm belonging to � j is decreasing with the financial soundness of the U firm. Ifthe U firm is in good shape from the financial point of view, it will be eager to extendtrade credit at more favourable terms to its D customers.
In principle, the interest rate on trade credit charged by the j th U firm should beaffected also by the financial conditions of the borrowers, i.e. of the D firms in the set
5 Following Greenwald and Stiglitz (1993) (GS hereafter) we assume that firms sell all the output theyproduce at a stochastic price. Undoubtedly, this is the source of an important idiosyncratic shock at thefirm-level which influences the whole economy due to a direct mechanism—via output volatility of down-stream firms—and an indirect mechanism, i.e. the propagation of shocks through productive and creditinterlinkages. In our framework, as in GS, stochastic prices are the vehicle of idiosyncratic shocks at thefirm level. In our setting, however, the mechanism of propagation and amplification is richer than in GSbecause shocks affecting downstream firms spread to connected agents in a networked-economy with bankand trade credit.
123
Business fluctuations and bankruptcy avalanches in network economy 201
� j . In order to keep the framework as simple as possible, however, we have assumedthat asymmetric information prevents a correct assessment of the financial conditionsof the borrowers on the part of the lenders. Therefore the interest rate on trade creditincorporates only the financial condition of the lender.
We can propose the following rationale for this assumption. In our framework, theexistence of trade credit is basically due to a transaction motive (Nilsen 2002). Firmsaim at extending market shares (when agents’ financial conditions allow to act in thisway). The increase of upstreams’ net worth produces a decrease of interest rates ontrade credit affecting aggregate credit conditions in a way similar to that characterizingbanks. In a sense, upstream firms use trade credit as a marketing strategy (Summers andWilson 2001). Like expenditures in advertising, commercial credit is an investmentthat, by establishing a long-term relationship between the lender and the borrower,yields a long term return (Nadiri 1969). In our setting, firms extend trade credit atmore favourable terms, increasing the likelihood of gaining new customers, when theirfinancial conditions are sound. Accordingly, our modelling choice is consistent withan explanation based on trade credit as a ‘long-term investment’ aimed at achievingnew customers through applying more favourable commercial credit conditions.6
While the scale of production of D firms is financially constrained, i.e. it is deter-mined by their degree of financial robustness—the scale of production of U firms isdemand constrained, i.e. it is determined by the demand of intermediate goods onthe part of D firms. Therefore, the financial conditions of the D firms are the drivingforce also for the production of U firms. The more robust, on average, D firms, thehigher their scale of activity and the demand for labour and intermediate goods sothat the higher will be, on average, the scale of activity of U firms. For instance, thedemand of intermediate goods—and therefore the scale of production—of the j th Ufirm will be Q jt = γ
∑i∈� j
Yit = γφ∑
i∈� jAβ
i t and the demand for labor will be
N jt = δuγφ∑
i∈� jAβ
i t .
Firms face a financing hierarchy in which internal finance ranks first and bank loanssecond. Therefore, by assumption, the financing gap, i.e. the difference between thefirm’s expenditures and internal finance, is filled by means of credit. For U firms, thefinancing gap is the difference between the wage bill and net worth. As to D firms,expenditures consists of wages and the cost of intermediate goods. In order to keep theanalysis as simple as possible, however, we assume that also for D firms the financinggap is the difference between the wage bill and net worth. This means that the acquisi-tion of intermediate goods can be financed by means of trade credit, not by bank loans.
Accordingly, the demand of credit is equal to Bxt = Wxt − Axt where Wxt = wNxt
is the firm’s wage bill (x = i for D firms, j for U firms). We assume that the real
6 According to Mateut and Mizen (2003), firms behaves like banks in extending credit to other firms, charg-ing to borrowers an external finance premium due to collection costs, e.g. costly state verification (Boissay2006). In this way, trade credit affects aggregate credit conditions in the economy. Mateut (2001) showsthat trade credit has an important role in the transmission of monetary policy, interacting with externalfinancing decision made by banks. There is then a finance motive underlying commercial credit (Nilsen2002). Nevertheless, in our model, trade credit is not a substitute for bank credit: we do not model theinterplay between bank and trade credit (although this is a relevant aspect highlighted by the literature:see, for instance, Gertler and Gilchrist (1993), on commercial credit, and Jaffee and Stiglitz (1990), on theinterplay between commercial credit and credit rationing).
123
202 D. Delli Gatti et al.
wage w is constant and uniform across firms. By assumption, labour is abundant sothat firms do not face any labour shortage at the pre-determined real wage.
Self-financed firms, i.e. firms with a level of net worth sufficient to finance the wagebill, do not demand credit. From the expression above follows that the demand forcredit of the i th D firm is
Bit = wNit − Ait = wδdφ Aβi t − Ait (4)
so that a D firm is self financed if it has net worth Ait ≥ A ≡ (wδdφ)1
1−β .
As to U firms, the demand for credit of the j th U firm is
B jt = wN jt − A jt = wδuγφ∑
i∈� j
Aβi t − A jt (5)
so that a U firm is self financed if it has net worth A jt ≥ A j ≡ wδuγφ∑
i∈� jAβ
i t .
The higher the net worth of D customers of the U firm, the less likely it is that the Ufirm is self financed.
For simplicity, we assume an asymmetric structure of the firms-banks network:many firms can be linked to a single bank but each firm has only one supplier of loans.The set of customers of the zth bank will be denoted by �z . We assume that eachbank has a certain degree of market power. Since each firm looks for the bank withthe lowest interest rate, by construction the number of elements of �z depends on theinterest rate the bank charges to its customers: the lower the interest rate, the higherthe number of firms asking loans to the zth bank.
The zth bank adopts the following rule in setting the interest rate on loans to thex th borrower (x = i for downstream, j for upstream):
r xzt = σ A−σ
zt + θ (lxt )θ (6)
where Azt is the net worth of the zth bank and lxt = Bxt/Axt is the leverage ratio ofthe x th firm, σ and θ positive parameters. Accordingly, the interest rate on bank loansis (i) decreasing with the financial soundness of the bank (proxied by the bank’s networth Azt ) and (ii) increasing with the firms’ leverage ratio.
The rationale of (i) is obvious: if the bank is in good shape from the financial pointof view, it will be eager to extend credit at more favourable terms. This is the case, forinstance, if the bank adopts a rule of thumb according to which the amount of loansoutstanding must be reduced if it is “too high” with respect to the bank’s own capital,i.e. net worth.7 When net worth is “too low”, the bank pushes the interest rate up toreduce the number of borrowers the demand for loans.
7 Total loans extended by the zth bank are
Bzt =
∑
i∈�z
Bit +∑
j∈�z
B jt =∑
i∈�z
(wδdφ Aβ
i t − Ait
)+
∑
j∈�z
⎛
⎜⎝wδuγφ
∑
i∈� j
Aβi t − A jt
⎞
⎟⎠
If the interest rate goes down more borrowers will be attracted by the bank and more loans will be extended.
123
Business fluctuations and bankruptcy avalanches in network economy 203
As to (ii), we simply assume that the firm penalizes financially fragile firms. Ina sense, we adopt the principle according to which the interest rate charged by thelender incorporates an external finance premium increasing with leverage and there-fore inversely related to the borrower’s net worth.8
Notice that the leverage ratio of the i th D firm is
li t = Bit/Ait = wδdYit
Ait= wδdφ A−(1−β)
i t − 1 (7)
i.e., it is decreasing with net worth. Therefore, in the end, the interest rate charged bythe zth bank to the i th D firm will be:
r izt = σ A−σ
zt + θ(wδdφ A−(1−β)
i t − 1)θ
(8)
i.e., it will be a decreasing function of the net worth of the bank and of the firm.The situation is different in the case of U firms. The leverage is
l j t = B jt/A jt = wδuQ jt
A jt− 1 = wδuγφ
A jt
∑
i∈� j
Aβi t − 1 (9)
since Q jt = γφ∑
i∈� jAβ
i t as shown above. The leverage of the U firm is decreasingwith its own net worth but increasing with the net worth of the downstream customers.The interest rate charged by the zth bank to the j th U firm will be:
r jzt = σ A−σ
zt + θ
⎛
⎝wδuγφ
A jt
∑
i∈� j
Aβi t − 1
⎞
⎠
θ
(10)
i.e. it will be a decreasing function of the net worth of the bank and of the j-firm butan increasing function of the net worth of the downstream customers.
Each D firm has a (productive and credit) relationship with an U firm. Initially, i.e.at time t = 1, the network of firms is random, i.e. the links among D and U firms areestablished at random. Therefore, for instance the D firm indexed by i (Di) ends uplinked to the U firm indexed by j0 (U j0). In each of the subsequent periods, the net-work changes endogenously according to a preferred-partner choice rule (with noise)which is defined as follows:
– with (a small) probability ε the D firm chooses a partner (i.e. a U supplier) atrandom;
– with probability 1 − ε he looks at the prices of a randomly selected number—sayM—of U firms;
8 In a sense in our model the bank behaves as a lender in a Bernanke and Gertler (1989, 1990) worldcharacterized by asimmetric information and costly state verification. See Bernanke et al. (1999) for acomprehensive exposition of the approach.
123
204 D. Delli Gatti et al.
– if the minimum observed price—say the price of U j1—is lower than the priceof U j0,then Di will switch to U j1;
– otherwise, Di will stick to U j0.
In the jargon of the network literature, the number of links connecting D nodes toa certain U node changes over time due to the changing price charged by the U firmso that the topology of the network is also in a process of continuous evolution. Thetotal number of nodes, however, is constant.
The preferred-partner choice rule applies also to the relationship between firms(both D and U) and banks. At time t = 1 the links among firms and banks areestablished at random. For instance, firm Di ends up linked to the bank z0 (Bz0).Afterwards, with probability 1 − ε each firm looks at the interest rate charged bya randomly selected number—say N—of banks. If the minimum observed interestrate—say the one charged by Bz1—is lower than the one charged by Bz0, then Diwill switch to Bz1; otherwise, he will stick to Bz0.
Suppose that Di belonging to �j0 goes bankrupt. The demand of intermediategoods produced by U j0 goes down and so do revenues, profits and net worth. Theinterest rate r j0
zt = σ A−σzt + θ
(l j0t
)θ goes up. Therefore also U j0 can go bankrupt.In principle there can be negative repercussions also on other D firms belonging to�j0 which cannot produce as much as they want, due to the bankruptcy of their sup-plier U j0. An avalanche of bankruptcies will follow due to the positive feedback ofthe bankruptcy of a single agent on the net worth of the “neighbours”, linked to thebankrupt agent by trade or credit links. Notice, however, that there is also a negativefeedback with a stabilizing effect due to the fact that the smaller net worth of the partof D firms makes the leverage of U firms smaller and therefore it makes the interestrate charged by the bank smaller.
The profit of the i th D firm is defined as follows: πi t = uit Yit − (1 + r izt )Bit −
(1 + r jt )Qit where uit is the price and Yit is the quantity of consumption goods, r izt
is the interest rate charged by Bz to Di , r jt is the interest rate on trade credit chargedby U j to Di and Qit is the amount of intermediate input that Di has bought fromU j . Upstream firms’ profit is equal to: π j t = (1 + r jt )Q jt − (1 + r j
zt )B jt . Banks’
profit is equal to πzt = ∑i∈Iz
(1 + r izt )Bit + ∑
j∈Jz(1 + r j
zt )B jt , where Iz and Jz are,
respectively, the set of D and U firms interacting with bank z.9
At the end of the period, the net worth of the x th agent (x = i for downstream, jfor upstream, z for bank) is defined as follows
Axt+1 = Axt + πxt − B Dxt
where B Dxt is “bad debt”. In fact, if a borrower cannot pay back the loan obtained fromthe lender and goes bankrupt, the lender has a “bad debt” (non-performing loan), thatis accounted for as a reduction of its net worth. The agent goes bankrupt if Axt+1 ≤ 0.
In our framework, the lenders are the U firms and the banks, while both types offirms can be borrowers (if they are not self-financed).
9 Of course Iz ∪ Jz = �z .
123
Business fluctuations and bankruptcy avalanches in network economy 205
In the case of U firms, “bad debt” is B D jt = (1+r jt )γ∑
i∈�Bj
Yit , i.e. the amount
of trade credit not reimbursed (intermediate goods not paid for) by bankrupt D cus-tomers, which are grouped for convenience in the set �B
j .
In the case of banks, “bad debt” is B Dz = ∑i∈�B
z(1+r i
zt )Bit +∑j∈�B
z(1+r j
zt )B jt
i.e. non-performing loans of bankrupt D and U firms, which are grouped for conve-nience in the set �B
z .
3 Simulation results
In this section, we analyze the dynamic properties of the credit network modelledabove, with a particular emphasis on the amplitude and length of bankruptcy ava-lanches. We perform computer simulations of an economy consisting of I = 500 Dfirms, J = 250 U firms and Z = 100 banks over a time span of T = 1,000 periods.There are 12 parameters in the model, which are set as follows: φ = 1.2, β = 0.8,δd = 0.5, δu = 1, γ = 0.5, α = 0.1, σ = 0.1, θ = 0.05, w = 1, M = 5, N = 5,ε = 0.01.
The net worth of agents (firms and banks) at the beginning of the time span (t = 1)is set to 1. We assume a simple mechanism of entry-exit: bankrupt firms/banks arereplaced with new entrants on the basis of a one-to-one replacement. New agents areendowed with an initial amount of net worth drawn from a uniform distribution withmean 1 and finite variance.10
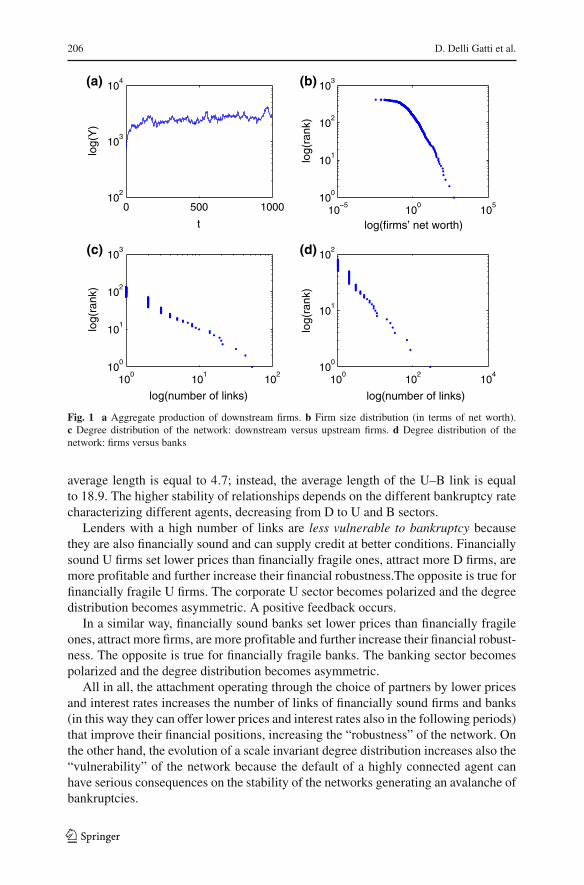
Figure 1 shows some relevant aspects emerging from the simulation of the creditnetwork. Panel (a) shows the fluctuating behavior of the D aggregate production. TheU aggregate production follows the same dynamic pattern since U suppliers produceintermediate goods for D production “on demand”. Panel (b) shows that, over time,a power law distribution of firms’ size emerges, according to the empirical evidenceon firm size distribution (Axtell 2001; Gaffeo et al. 2003). Accordingly, starting fromidentical initial conditions, firms become rapidly heterogeneous11 In addition, thedistribution of the number of links for each lender (U firm or bank) becomes asym-metric over time due to the preferred-partner choice rule governing the interactionamong borrowers and lenders. In other words, the actual degree distribution of thecredit network suggests that some lenders, in the right tail of the distribution, have anumber of customers higher than that generated by a normal distribution. This holdstrue for the number of commercial credit relationships between D and U firms (panel(c)), as well as for the number of connections between firms and banks (panel (d)).
The length of credit relationships is endogenously determined by the preferred-partner choice rule. In particular, the average length of the D–U link across 100Monte Carlo simulations of the model is equal to 1.4; in the case of the D–B link the
10 For the sake of simplicity, the total number of agents in the economy is constant over time. In order toavoid capital coutercyclicality, when new agents replace bankrupt ones, the initial endowment of capitalfor entrants is “small” with respect to other agents or the average net worth.11 Each D firms is hit by a price shock in each time period because the sale price is stochastic. Thereforethe accumulation of net worth on the part of each D firm rapidly takes different routes. The accumulationof net worth on the part of U firms and banks is determined as a consequence.
123
206 D. Delli Gatti et al.
0 500 100010
2
103
104
t
log(
Y)
(a)
10−5
100
105
100
101
102
103
log(firms’ net worth)
log(
rank
)
(b)
100
101
102
100
101
102
103
log(number of links)
log(
rank
)
(c)
100
102
104
100
101
102
log(number of links)
log(
rank
)
(d)
Fig. 1 a Aggregate production of downstream firms. b Firm size distribution (in terms of net worth).c Degree distribution of the network: downstream versus upstream firms. d Degree distribution of thenetwork: firms versus banks
average length is equal to 4.7; instead, the average length of the U–B link is equalto 18.9. The higher stability of relationships depends on the different bankruptcy ratecharacterizing different agents, decreasing from D to U and B sectors.
Lenders with a high number of links are less vulnerable to bankruptcy becausethey are also financially sound and can supply credit at better conditions. Financiallysound U firms set lower prices than financially fragile ones, attract more D firms, aremore profitable and further increase their financial robustness.The opposite is true forfinancially fragile U firms. The corporate U sector becomes polarized and the degreedistribution becomes asymmetric. A positive feedback occurs.
In a similar way, financially sound banks set lower prices than financially fragileones, attract more firms, are more profitable and further increase their financial robust-ness. The opposite is true for financially fragile banks. The banking sector becomespolarized and the degree distribution becomes asymmetric.
All in all, the attachment operating through the choice of partners by lower pricesand interest rates increases the number of links of financially sound firms and banks(in this way they can offer lower prices and interest rates also in the following periods)that improve their financial positions, increasing the “robustness” of the network. Onthe other hand, the evolution of a scale invariant degree distribution increases also the“vulnerability” of the network because the default of a highly connected agent canhave serious consequences on the stability of the networks generating an avalanche ofbankruptcies.
123
Business fluctuations and bankruptcy avalanches in network economy 207
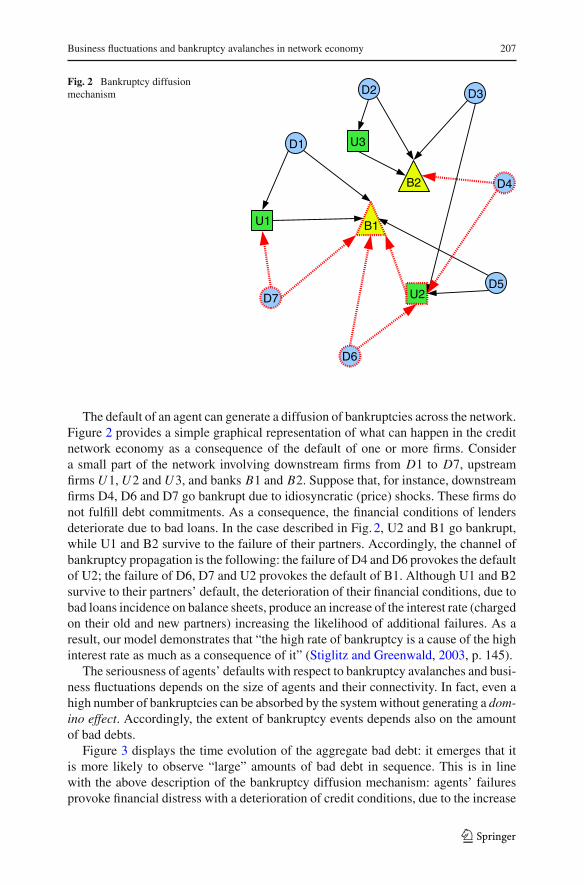
Fig. 2 Bankruptcy diffusionmechanism
U1
D7
D6
U2
U3
D5
D4
D3D2
D1
B1
B2
The default of an agent can generate a diffusion of bankruptcies across the network.Figure 2 provides a simple graphical representation of what can happen in the creditnetwork economy as a consequence of the default of one or more firms. Considera small part of the network involving downstream firms from D1 to D7, upstreamfirms U1, U2 and U3, and banks B1 and B2. Suppose that, for instance, downstreamfirms D4, D6 and D7 go bankrupt due to idiosyncratic (price) shocks. These firms donot fulfill debt commitments. As a consequence, the financial conditions of lendersdeteriorate due to bad loans. In the case described in Fig. 2, U2 and B1 go bankrupt,while U1 and B2 survive to the failure of their partners. Accordingly, the channel ofbankruptcy propagation is the following: the failure of D4 and D6 provokes the defaultof U2; the failure of D6, D7 and U2 provokes the default of B1. Although U1 and B2survive to their partners’ default, the deterioration of their financial conditions, due tobad loans incidence on balance sheets, produce an increase of the interest rate (chargedon their old and new partners) increasing the likelihood of additional failures. As aresult, our model demonstrates that “the high rate of bankruptcy is a cause of the highinterest rate as much as a consequence of it” (Stiglitz and Greenwald, 2003, p. 145).
The seriousness of agents’ defaults with respect to bankruptcy avalanches and busi-ness fluctuations depends on the size of agents and their connectivity. In fact, even ahigh number of bankruptcies can be absorbed by the system without generating a dom-ino effect. Accordingly, the extent of bankruptcy events depends also on the amountof bad debts.
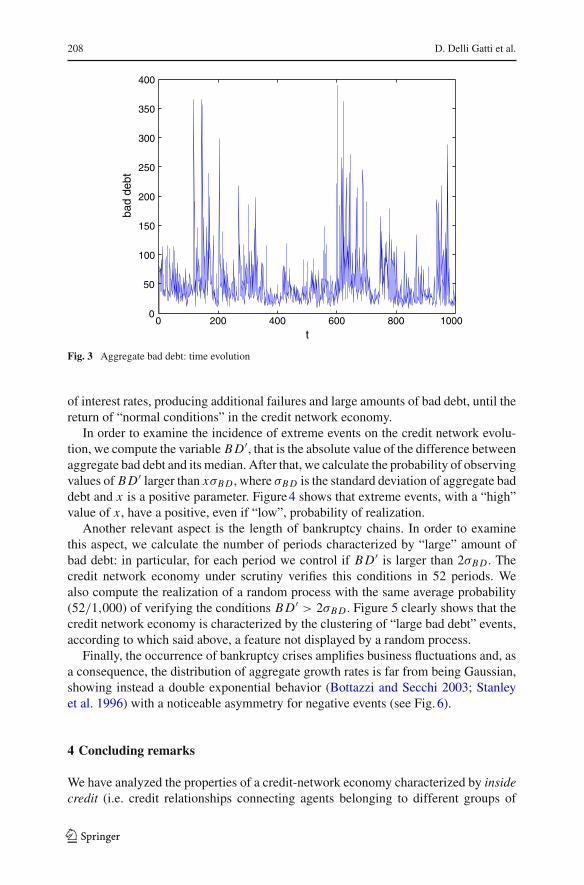
Figure 3 displays the time evolution of the aggregate bad debt: it emerges that itis more likely to observe “large” amounts of bad debt in sequence. This is in linewith the above description of the bankruptcy diffusion mechanism: agents’ failuresprovoke financial distress with a deterioration of credit conditions, due to the increase
123
208 D. Delli Gatti et al.
0 200 400 600 800 10000
50
100
150
200
250
300
350
400
t
bad
debt
Fig. 3 Aggregate bad debt: time evolution
of interest rates, producing additional failures and large amounts of bad debt, until thereturn of “normal conditions” in the credit network economy.
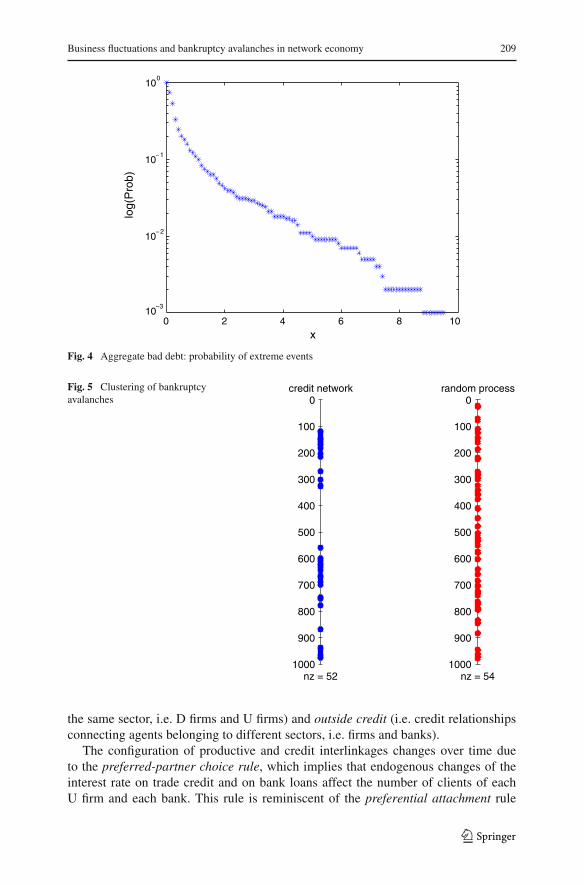
In order to examine the incidence of extreme events on the credit network evolu-tion, we compute the variable B D′, that is the absolute value of the difference betweenaggregate bad debt and its median. After that, we calculate the probability of observingvalues of B D′ larger than xσB D , where σB D is the standard deviation of aggregate baddebt and x is a positive parameter. Figure 4 shows that extreme events, with a “high”value of x , have a positive, even if “low”, probability of realization.
Another relevant aspect is the length of bankruptcy chains. In order to examinethis aspect, we calculate the number of periods characterized by “large” amount ofbad debt: in particular, for each period we control if B D′ is larger than 2σB D . Thecredit network economy under scrutiny verifies this conditions in 52 periods. Wealso compute the realization of a random process with the same average probability(52/1,000) of verifying the conditions B D′ > 2σB D . Figure 5 clearly shows that thecredit network economy is characterized by the clustering of “large bad debt” events,according to which said above, a feature not displayed by a random process.
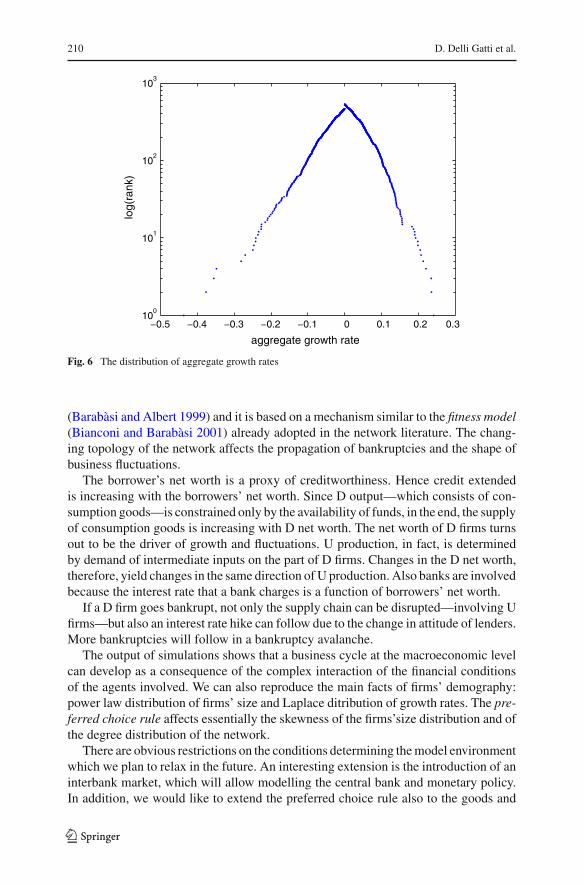
Finally, the occurrence of bankruptcy crises amplifies business fluctuations and, asa consequence, the distribution of aggregate growth rates is far from being Gaussian,showing instead a double exponential behavior (Bottazzi and Secchi 2003; Stanleyet al. 1996) with a noticeable asymmetry for negative events (see Fig. 6).
4 Concluding remarks
We have analyzed the properties of a credit-network economy characterized by insidecredit (i.e. credit relationships connecting agents belonging to different groups of
123
Business fluctuations and bankruptcy avalanches in network economy 209
0 2 4 6 8 1010
−3
10− 2
10−1
100
x
log(
Pro
b)
Fig. 4 Aggregate bad debt: probability of extreme events
Fig. 5 Clustering of bankruptcyavalanches 0
100
200
300
400
500
600
700
800
900
1000nz = 52
credit network0
100
200
300
400
500
600
700
800
900
1000nz = 54
random process
the same sector, i.e. D firms and U firms) and outside credit (i.e. credit relationshipsconnecting agents belonging to different sectors, i.e. firms and banks).
The configuration of productive and credit interlinkages changes over time dueto the preferred-partner choice rule, which implies that endogenous changes of theinterest rate on trade credit and on bank loans affect the number of clients of eachU firm and each bank. This rule is reminiscent of the preferential attachment rule
123
210 D. Delli Gatti et al.
−0.5 −0.4 −0.3 −0.2 −0.1 0 0.1 0.2 0.310
0
101
102
103
aggregate growth rate
log(
rank
)
Fig. 6 The distribution of aggregate growth rates
(Barabàsi and Albert 1999) and it is based on a mechanism similar to the fitness model(Bianconi and Barabàsi 2001) already adopted in the network literature. The chang-ing topology of the network affects the propagation of bankruptcies and the shape ofbusiness fluctuations.
The borrower’s net worth is a proxy of creditworthiness. Hence credit extendedis increasing with the borrowers’ net worth. Since D output—which consists of con-sumption goods—is constrained only by the availability of funds, in the end, the supplyof consumption goods is increasing with D net worth. The net worth of D firms turnsout to be the driver of growth and fluctuations. U production, in fact, is determinedby demand of intermediate inputs on the part of D firms. Changes in the D net worth,therefore, yield changes in the same direction of U production. Also banks are involvedbecause the interest rate that a bank charges is a function of borrowers’ net worth.
If a D firm goes bankrupt, not only the supply chain can be disrupted—involving Ufirms—but also an interest rate hike can follow due to the change in attitude of lenders.More bankruptcies will follow in a bankruptcy avalanche.
The output of simulations shows that a business cycle at the macroeconomic levelcan develop as a consequence of the complex interaction of the financial conditionsof the agents involved. We can also reproduce the main facts of firms’ demography:power law distribution of firms’ size and Laplace ditribution of growth rates. The pre-ferred choice rule affects essentially the skewness of the firms’size distribution and ofthe degree distribution of the network.
There are obvious restrictions on the conditions determining the model environmentwhich we plan to relax in the future. An interesting extension is the introduction of aninterbank market, which will allow modelling the central bank and monetary policy.In addition, we would like to extend the preferred choice rule also to the goods and
123
Business fluctuations and bankruptcy avalanches in network economy 211
labour markets. This will imply a more sophisticated design of households’ behaviour,which so far has been essentially passive. Our aim is then to further investigate theinterplay between the formation of credit interlinkages and macroeconomic dynamicsby extending our model in different directions, towards a “complete” credit network.
Acknowledgments We are grateful for insightful comments and criticisms to participants to the East-ern Economic Association meeting, New York City, February 2007—in particular Duncan Foley, whosedetailed comments have been expecially useful-, the Net-Work-shop at Catholic University in Milan, April2007, the XLVIII Annual Meeting of the Italian Economists Society in Turin, October 2007. Last but notleast, thanks to the participants to the ESHIA/WEHIA 2008, Warsaw, June 19–21, and, in particular, toPedro Campos and Paul Ormerod for very useful suggestions. We are grateful to the referees for theirinsightful comments and criticisms.
References
Allen F, Gale D (2000) Financial contagion. J Polit Econ 108:1–33Axtell R (2001) Zipf distribution of U.S. firm sizes. Science 293:1818–1820Bak P, Chen K, Scheinkman J, Woodford M (1993) Aggregate fluctuations from independent sectoral
shocks: Self-organized criticality in a model of production and inventory dynamics. Ricerche Eco-nomiche 47(1):3–30
Barabàsi A-L, Albert R (1999) Emergence of scaling in random networks. Nature 286:509–512Battiston S, Delli Gatti D, Gallegati M, Greenwald B, Stiglitz J (2007) Credit chains and bankruptcy ava-
lanches in supply networks. J Econ Dyn Control 31(6):2061–2084Bernanke B, Gertler M (1989) Agency costs, net worth and business fluctuations. Am Econ Rev 79:14–31Bernanke B, Gertler M (1990) Financial fragility and economic performance. Q J Econ 105:87–114Bernanke B, Gertler M, Gilchrist S (1999) The financial accelerator in quantitative business cycle frame-
work. In: Taylor J, Woodford M (eds) Handbook of macroeconomics, vol 1C. North-Holland,Amsterdam
Bianconi G, Barabàsi A-L (2001) Competition and multiscaling in evolving networks. Europhys Lett54(4):436–442
Boissay F (2006) Credit chains and the propagation of financial distress. ECB Working Paper No. 573Bottazzi G, Secchi A (2003) Why are distributions of firm growth rates tent-shaped? Econ Lett 80:415–420Delli Gatti D, Gallegati M, Greenwald B, Russo A, Stiglitz J (2006) Business fluctuations in a credit-network
economy. Phys A 370:68–74Freixas X, Parigi B, Rochet J (2000) Systemic risk, interbank relations and liquidity provision. J Money
Credit Bank 32:611–638Furfine C (2003) Interbank exposures: quantifying the risk of contagion. J Money Credit Bank 35(1):111–
128Gaffeo E, Gallegati M, Palestrini A (2003) On the size distribution of firms: additional evidence from the
G7 countries. Phys A 324:117–123Gertler M, Gilchrist S (1993) The role of credit market imperfections in the monetary transmission mech-
anism. Scand J Econ 95(1):43–64Goyal S (2007) Connections. Princeton University Press, New JerseyGreenwald B, Stiglitz J (1993) Financial market imperfections and business cycles. Q J Econ 108:77–114Iori G, Jafarey S, Padilla F (2006) Systemic risk on the interbank market. J Econ Behav Organ 61(4):525–
540Jackson M (2005) The economics of social networks. In: Blundell R, Newey W, Persson T (eds) Proceedings
of the ninth world congress of the Econometric Society. Cambridge University Press, LondonJackson M (2008) Social and economic Networks. Princeton University Press, New JerseyJaffee D, Stiglitz JE (1990) Credit rationing. In: Friedman BM, Hahn FH (eds) Handbook of monetary
economics, edn 1, vol 2, chap 16. North-Holland, Amsterdam, pp 837–888Mateut S (2001) Trade credit and monetary policy transmission. J Econ Surv 19(4):655–670Mateut S, Mizen P (2003) Trade credit and bank lending: An investigation in the determinants of UK
manufacturing firms access to trade credit. Working Paper No. 2003/3. European University Institute
123

212 D. Delli Gatti et al.
Nadiri MI (1969) The determinants of trade credit in the US total manufacturing sector. Econometrica37(3):408–423
Nier E, Yang J, Yorulmazer T, Alentorn A (2007) Network models and financial stability. J Econ DynControl 31:2033–2060
Nilsen J (2002) Trade credit and the bank lending channel. J Money Credit Bank 34:227–253Stanley M, Amaral L, Buldyrev S, Havlin S, Leschorn H, Maas P, Salinger M, Stanley E (1996) Scaling
behavior in the growth of companies. Nature 379:804–806Stiglitz J, Greenwald G (2003) Towards a new paradigm in monetary economics. Cambridge University
Press, LondonSummers B, Wilson N (2001) Trade credit and customer relationships. University of Leeds, Credit Man-
agement Research Center, MimeoVega-Redondo F (2007) Complex social networks. Econometric society monograph series. Cambridge
University Press, London
123