Business Department Annual Operations Review FY2014.
46
Business Department Annual Operations Review FY2014
-
Upload
hugo-walsh -
Category
Documents
-
view
216 -
download
2
Transcript of Business Department Annual Operations Review FY2014.
Business Department
Annual Operations ReviewFY2014

Transportation
• Statistics• Regular Expenses– Routes– Monitors– Field Trips– Special Needs– Extra Contract Costs– Bus Fuel
• Payments In-Lieu of

Transportation Statistics
2010-2011 2011-2012 2012-2013 2013-2014
2894 2819 2798 2956
54 54 55 5560 65 62 6215 15 18 21
Number of Riders Number of RoutesNumber of Drivers Number of Monitors

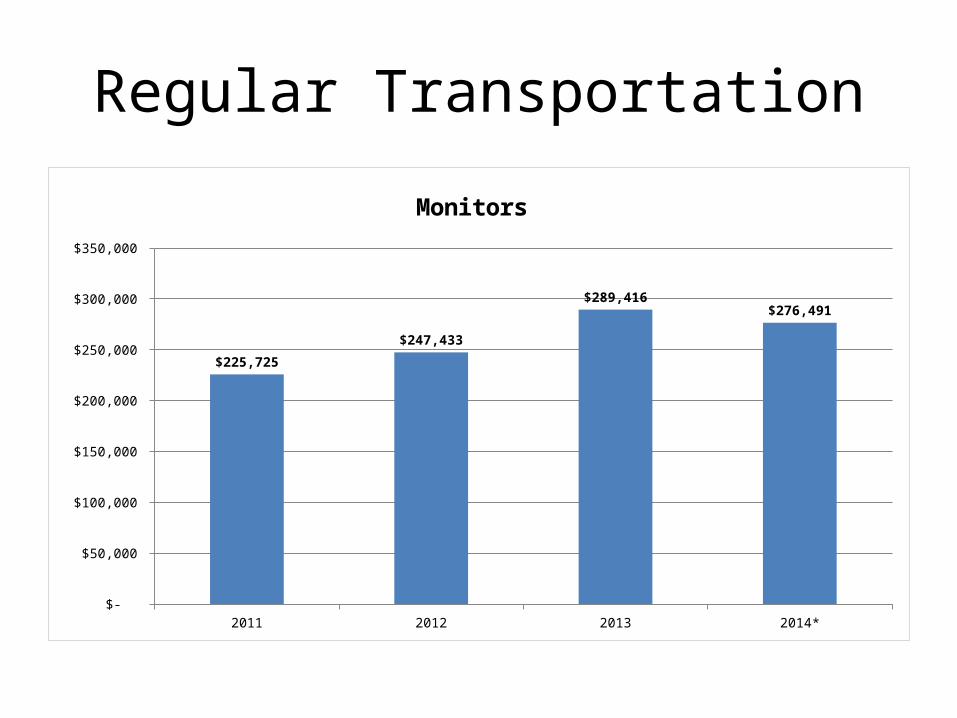
Regular Transportation
2011 2012 2013 2014* $2,200,000
$2,250,000
$2,300,000
$2,350,000
$2,400,000
$2,450,000
$2,500,000
$2,550,000
$2,322,400
$2,411,218
$2,518,684 $2,527,286
Route Charges
Regular Transportation
2011 2012 2013 2014* $-
$50,000
$100,000
$150,000
$200,000
$250,000
$300,000
$350,000
$225,725
$247,433
$289,416 $276,491
Monitors

Field Trip and Special Needs Transportation Expense
2011 2012 2013 2014* $-
$20,000
$40,000
$60,000
$80,000
$100,000
$120,000
$140,000
$160,000
$180,000 $169,626
$110,197
$126,352
$159,393
$132,242 $132,541
$148,747 $152,000
Special Needs Field Trips

Regular Transportation
2011 2012 2013 2014* $-
$5,000
$10,000
$15,000
$20,000
$25,000
$30,000
$35,000
$40,000
$45,000
$50,000
$39,969 $39,867
$44,736
$11,815
Excess Charges< 4.5 Hours

Regular Transportation
2011 2012 2013 2014* $-
$50,000
$100,000
$150,000
$200,000
$250,000
$300,000
$350,000
$400,000
$450,000
$375,196 $397,685
$419,096
$344,816
Bus Fuel

In Lieu of Transportation
2011 2012 2013 2014* $-
$5,000
$10,000
$15,000
$20,000
$25,000
$30,000
$11,086
$14,752 $16,124
$25,500
Expenditure

In Lieu of Transportation
2011 2012 2013 2014* $-
$50
$100
$150
$200
$250
$300
$199
$225 $241
$250
Per Student Stipend
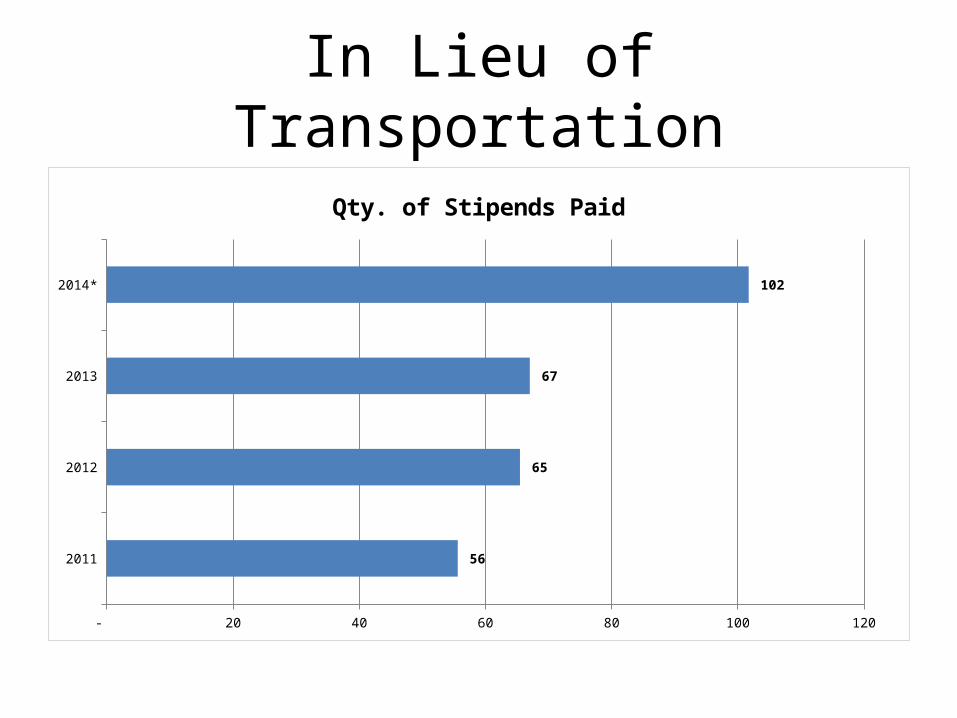
In Lieu of Transportation
2011
2012
2013
2014*
- 20 40 60 80 100 120
56
65
67
102
Qty. of Stipends Paid

Transportation Opportunity Areas
• Ridership• Expand Hudson Fleet• Competitive options for Suburban• Cost/Benefit for WRA In-lieu of payments

Accident Management
• Employee Accidents • Workers Compensation• Student Accidents
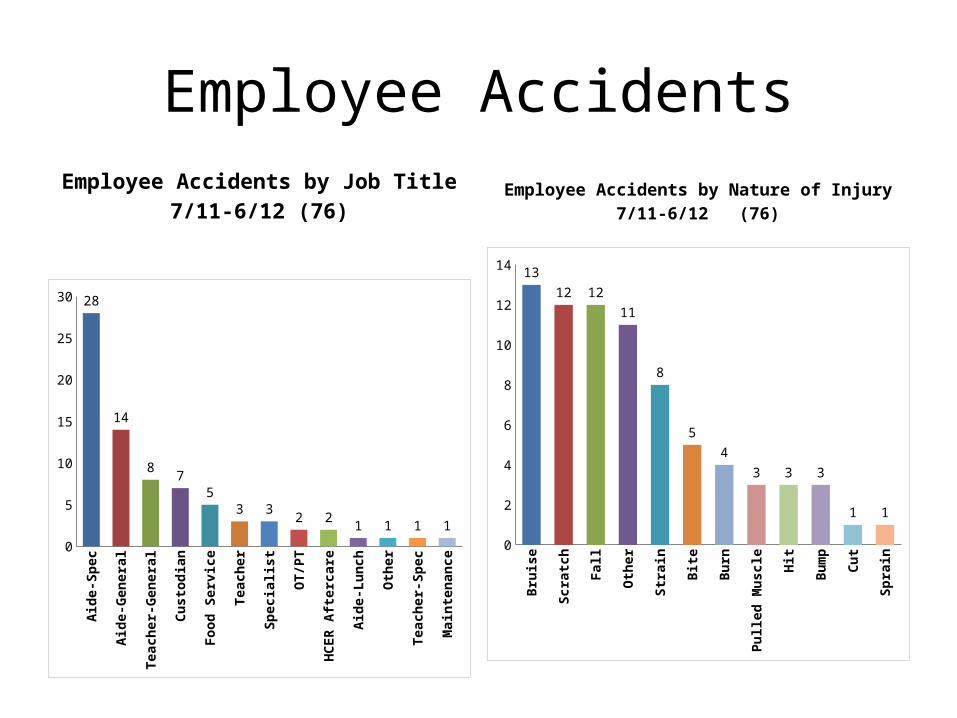
Employee AccidentsEmployee Accidents by Job Title
7/11-6/12 (76)Employee Accidents by Nature of Injury
7/11-6/12 (76)
Aide
-Spe
c
Aide
-Gen
eral
Teac
her-
Gene
ral
Cust
odia
n
Food
Ser
vice
Teac
her
Spec
ialis
t
OT/
PT
HCER
Afte
rcar
e
Aide
-Lun
ch
Oth
er
Teac
her-
Spec
Mai
nten
ance
0
5
10
15
20
25
3028
14
87
53 3
2 21 1 1 1
Brui
se
Scra
tch
Fall
Oth
er
Stra
in
Bite
Burn
Pulle
d M
uscle Hi
t
Bum
p
Cut
Spra
in
0
2
4
6
8
10
12
1413
12 12
11
8
5
4
3 3 3
1 1

Employee AccidentsEmployee Accidents by Job Title
7/12-6/13 (49)Employee Accidents by Nature of Injury
7/12-6/13 (49)
Oth
er
Stra
in Fall
Bite
Hit H
ead
Cut
Abra
sion
Hit
Lace
ratio
n
Scra
tch
Brui
se
Bum
p
Punc
ture
0
2
4
6
8
10
12
10
6 6
5
4 4
3 3
2 2 2
1 1
Aide
-Spe
c
Aide
-Gen
eral
Mai
nten
ance
Cust
odia
n
Teac
her-
Gene
ral
Food
Ser
vice
Spec
ialis
t
Teac
her
Subs
titue
Aid
e
Com
mun
ity M
embe
r
Aide
-Lun
ch
Secr
etar
y
HCER
Afte
rcar
e0
2
4
6
8
10
12
14
16
18
16
9
5 54
3
1 1 1 1 1 1 1

Employee AccidentsEmployee Accidents by Job Title
7/13-4/14 (62) Employee Accident by Nature of Injury
7/13-4/14 (62)
Aide-Spec
Aide-General
Teach
er-General
Mainte
nance
Teach
er-Spec
Custodian
OT/PT
Food Se
rvice
Substi
tute
Sub Custo
dian
Tech
Aide
Librar
ian
Psychologis
t
Long-t
erm Su
b
Secre
taryCoach
Specia
list0
2
4
6
8
10
12
14
16
18 17
14
7
3 3 3 32 2
1 1 1 1 1 1 1 1
Bite Fall
Oth
er Hit
Scra
tch
Stra
in
Cut
Spra
in
Brui
se
Bum
p
Hit H
ead
Abra
sion
Lace
ratio
n
Frac
ture
0
2
4
6
8
10
12
10 10
8
7
5 5
4
3
2 2 2 2
1 1

Workers Compensation
2010 2011 2012 2013 20140
5
10
15
20
25
30
35
Medical OnlyLost Time
MO Claims (83)
Lost Time (9)
Claims History
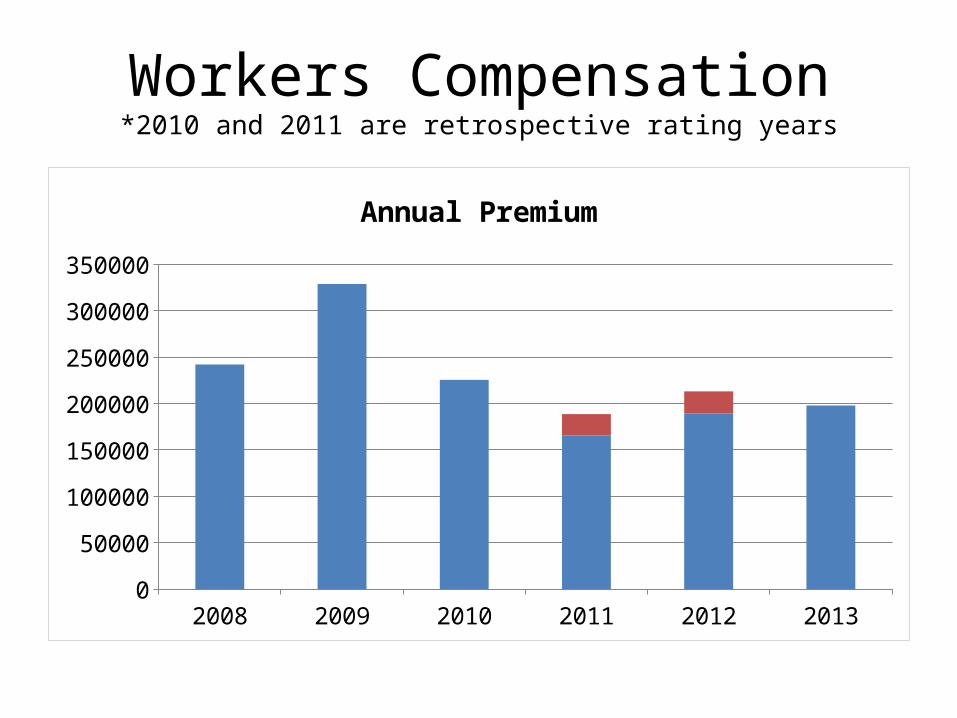
Workers Compensation*2010 and 2011 are retrospective rating years
2008 2009 2010 2011 2012 20130
50000
100000
150000
200000
250000
300000
350000
Annual Premium
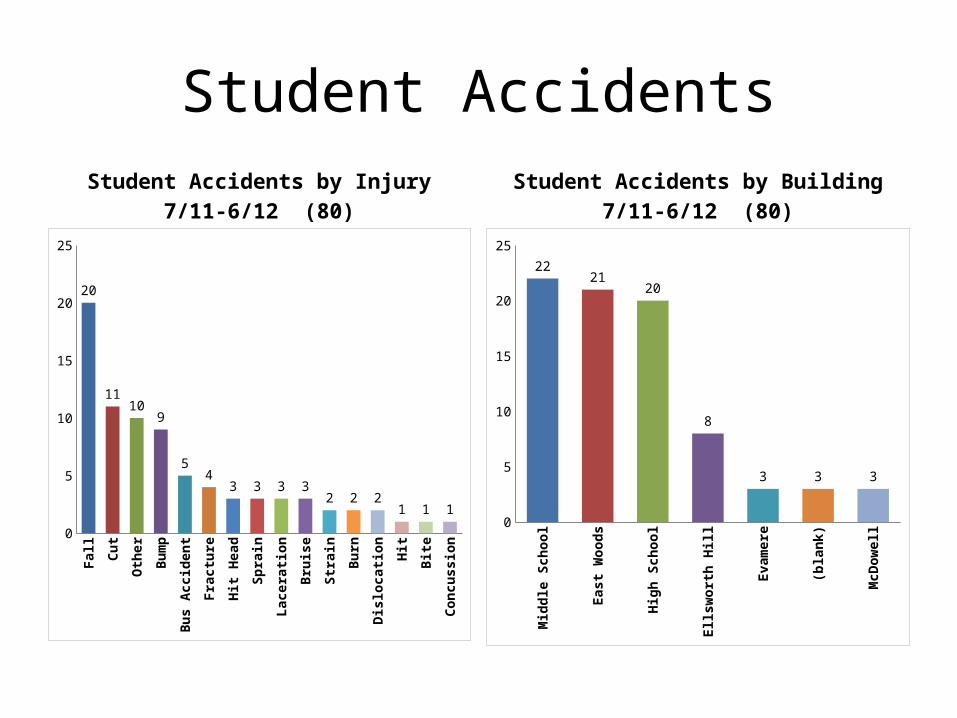
Student AccidentsStudent Accidents by Injury
7/11-6/12 (80)Student Accidents by Building
7/11-6/12 (80)
Fall
Cut
Oth
er
Bum
p
Bus A
ccid
ent
Frac
ture
Hit H
ead
Spra
in
Lace
ratio
n
Brui
se
Stra
in
Burn
Dislo
catio
n
Hit
Bite
Conc
ussio
n0
5
10
15
20
25
20
1110
9
54
3 3 3 32 2 2
1 1 1M
iddl
e Sc
hool
East
Woo
ds
High
Sch
ool
Ellsw
orth
Hill
Evam
ere
(bla
nk)
McD
owel
l0
5
10
15
20
25
2221
20
8
3 3 3

Student AccidentsStudent Accidents by Injury
7/12-6/13 (94)Student Accidents by Building
7/12-6/13 (94)
Fall
Hit H
ead
Bum
p
Burn
Lace
ratio
n
Stra
in
Conc
ussio
n
Bite
0
5
10
15
20
25
30
3532
18
109
6 6
3 31 1 1 1 1 1 1
Mid
dle
Scho
ol
High
Sch
ool
East
Woo
ds
Ellsw
orth
Hill
McD
owel
l
Evam
ere
(bla
nk)
Out
of D
istric
t0
5
10
15
20
25
30
35
29
26
20
7 7
31 1
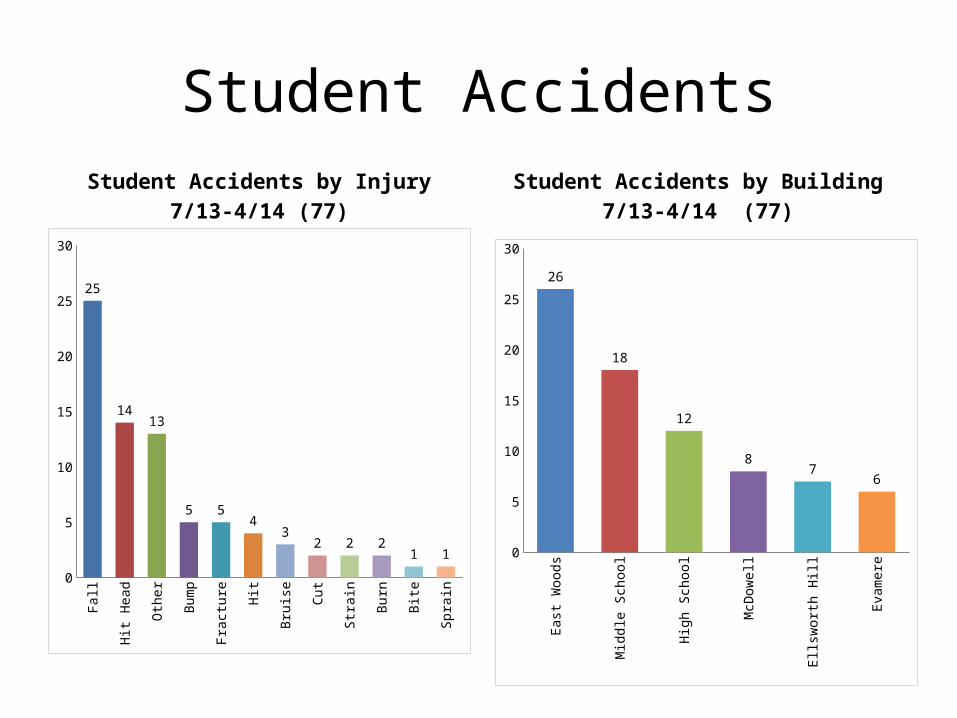
Student AccidentsStudent Accidents by Injury
7/13-4/14 (77)Student Accidents by Building
7/13-4/14 (77)
Fall
Hit H
ead
Oth
er
Bum
p
Frac
ture Hi
t
Brui
se Cut
Stra
in
Burn Bite
Spra
in
0
5
10
15
20
25
30
25
1413
5 54
32 2 2
1 1
East
Woo
ds
Mid
dle
Scho
ol
High
Sch
ool
McD
owel
l
Ellsw
orth
Hill
Evam
ere0
5
10
15
20
25
30
26
18
12
87
6

Accident ManagementOpportunity Areas
• Prevention– Training-Playground and Classroom Safety, proper lifting– Parking lots, Sidewalks, trip hazards
• Continued focus on Special Needs Aides• Pursue Safety Grants and Discount Programs• Aggressive Accident Management– Timely reporting– Salary Continuation– Transitional Work

Facility Services
• Event Statistics• Work Order Statistics• OT Statistics• Energy Conservation• Dashboards

Facility Services
12.31.10 6.30.11 12.31.11 6.30.12 12.31.12 6.30.13 12.31.13
HCER 2688 2308 3328 2047 3038 2492 3459
District 1500 1320 1425 1401 1367 1730 1664
Athletics 570 818 685 849 1166 750 903
Community 659 533 510 702 782 490 652
Outside 0 2 29 46 48 45 109
500
1,500
2,500
3,500
4,500
5,500
6,500
7,500
Number of Events SupportedSix Month Intervals
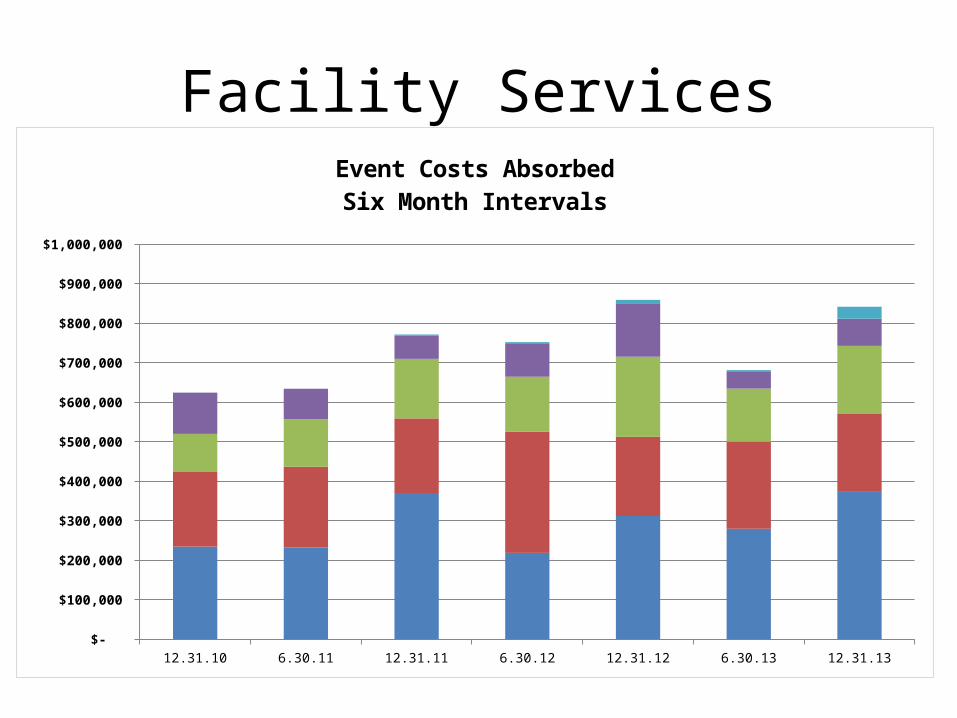
Facility Services
12.31.10 6.30.11 12.31.11 6.30.12 12.31.12 6.30.13 12.31.13
HCER 234318.75 231761.25 370081.25 218382.5 311973.75 279461.25 372951.25
District 190416.25 204737.5 188990 306205 200035 220351.25 197152.5
Athletics 94910.625 120085.625 150491.875 139545 203011.875 134494.375 172120.625
Community 104596.875 77133.125 58210 82866.875 135099.375 41869.375 68912.5
Outside 0 200 3352.5 4907.5 8680 4907.5 30212.5
$50,000
$150,000
$250,000
$350,000
$450,000
$550,000
$650,000
$750,000
$850,000
$950,000
Event Costs AbsorbedSix Month Intervals

Facility Services
HVAC
Genera
l Main
tenan
ce
Housekee
ping
Documen
t Man
agem
ent
Speci
al Pro
jects
Food Se
rvice
Delive
ry
Plumbing
Even
t Setu
p
Doors an
d Hardware
Moving
Delive
ry
Health
/Safet
y
IT/Te
chnology
Speci
al Ev
ents
Vehicle
Main
tenan
ce
Athletic F
ields
Lighting
Structu
re
Courier
Electr
ical
Snow Rem
oval
Kitchen
Equipmen
t
Playgro
und0
100
200
300
400
500
600
700
800
900
1000
866
646
503
354
243208 194 179
148 127 123 107 100 91 91 81 78 64 64 63 63 54 46
Work Orders by Craft (Top 25)2013-14 through April

Facility Services
Genera
l Main
tenan
ce
Documen
t Man
agem
ent
Athletic F
ields
Snow Rem
oval
Heating/V
entilati
on /Air C
onditioning
Speci
al Pro
jects
Constructi
on
Grass C
utting
Building A
utomation
Pool
Operational
Servi
cesBoile
r
Speci
al Ev
ents
Vehicle
Main
tenan
ce
Doors an
d Hardware
Plumbing
Secu
rity
Moving
Electr
ical
Irriga
tion
Clocks/B
ells
Even
t Setu
p
Playgro
und
Turf
Mainten
ance
Structu
re0
500
1,000
1,500
2,000
2,500
3,000
3,500
4,0003,753
1,901
990870
734597 509 481 466 457 398 389 366 327 326 314 239 197 166 148 132 132 113 112 100
Maintenance Hours by Craft 2013-14 through April

Facility Services
Elem
EW
MS
HS
Maint
- 500 1,000 1,500 2,000 2,500 3,000
OT Hours by Building2013-14 through April

Facility Services
Boiler
Grounds
HVAC
HCER
Event
Admin
Athletics
Snow
Football
Calamity
Community
Demand Mnt.
SHT
- 200 400 600 800 1,000 1,200 1,400
50
53
57
68
99
157
183
194
200
219
569
757
1,250
OT by Purpose2013-14 through April

Facility ServicesDashboard

Facility ServicesEnergy Conservation Dashboard
8/2009 - 4/2014

Facility ServicesEnergy Conservation Cumulative Effect
1 BTU (British Thermal Unit) is the amount of energy needed to cool or heat one pound of water by one degree Fahrenheit

Facility ServicesEnergy Conservation Performance by Building
Energy Conservation

Facility ServicesOpportunity Areas
• Site Management• Cost Recovery• Substitute Staffing (rates)• Continue Energy Conservation Program• Preventative Maintenance

Nutrition Services
• Utilization• Efficiency• Financial Performance• Pricing

School Nutrition
2010 2011 2012 2013 2014* -
100,000
200,000
300,000
400,000
500,000
600,000
514,170 485,084
449,013 418,991 403,346
25,310 26,877
26,052 25,875
25,048
Total District Meals ServedMeals-Free/RedMeals-Full price
Annualized for 2014

School Nutrition
2010 2011 2012 2013 2014* 15.00
15.50
16.00
16.50
17.00
17.50
18.00
18.50
19.00
17.52
18.61
17.71
16.45 16.36
Meals per Labor Hour- District
Meals/HourTarget

School Nutrition
2010 2011 2012 2013 2014* 950,000
1,000,000
1,050,000
1,100,000
1,150,000
1,200,000
1,250,000
1,300,000
1,350,000
1,283,751
1,258,179
1,200,112
1,159,891
1,082,395
Full Price Meal Sales

School Nutrition
2010 2011 2012 2013 2014* -
50,000
100,000
150,000
200,000
250,000
300,000
350,000
134,025 140,483 137,786 130,189 134,037
86,372 58,905
43,044 75,533
50,272
83,292
58,199
29,534
29,578
25,237
Other RevenueVendingCateringGovt. Subsidy
$303,689
$209,546

School Nutrition
2010 2011 2012 2013 2014* 1,000,000
1,100,000
1,200,000
1,300,000
1,400,000
1,500,000
1,600,000
1,700,000
1,587,739
1,515,767
1,423,476
1,396,248
1,291,941
1,517,310
1,376,831 1,406,355
1,370,713
1,291,742
Revenue vs. Expense
Revenue TotalExpense Total
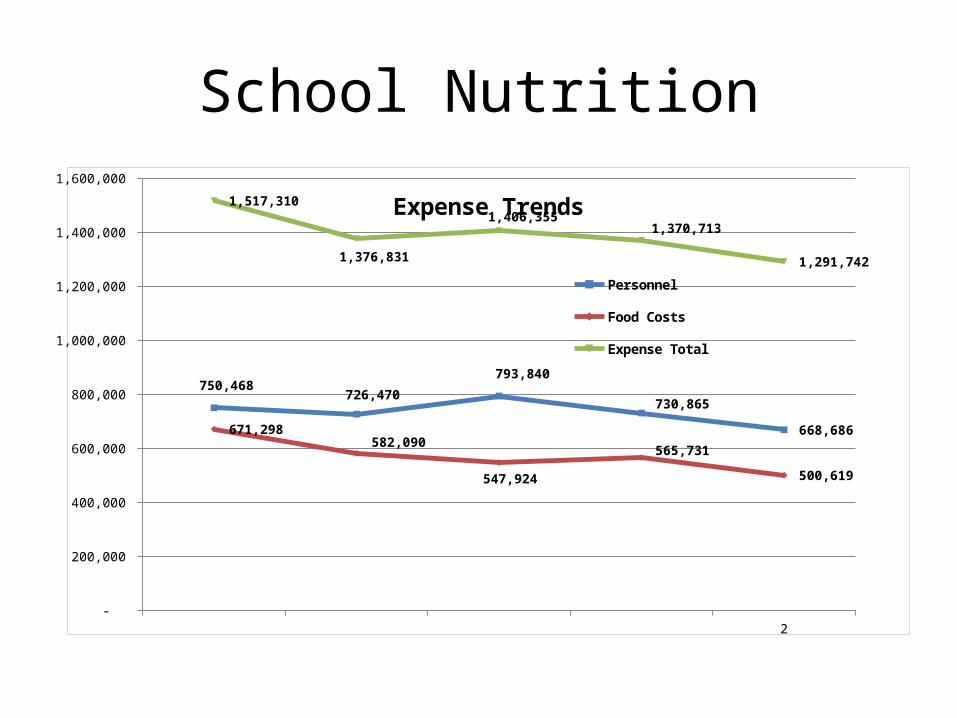
School Nutrition
2010 2011 2012 2013 2014* -
200,000
400,000
600,000
800,000
1,000,000
1,200,000
1,400,000
1,600,000
750,468 726,470
793,840
730,865
668,686 671,298 582,090
547,924
565,731
500,619
1,517,310
1,376,831
1,406,355 1,370,713
1,291,742
Expense Trends
Personnel
Food Costs
Expense Total

School Nutrition
2010 2011 2012 2013 2014* $-
$0.50
$1.00
$1.50
$2.00
$2.50
$3.00
$3.50
$2.94 $2.96 $3.00 $3.14
$3.02
$2.50
$2.69
$2.96 $3.08
$2.99
Per Plate Indicators Plate RevenuePlate Cost

School Nutrition
Solon City
Schools
Stow-M
unroe F
alls C
ity Sc
hools
Nordonia
Schools
Stree
tsboro
City Sc
hools
Coventry
Local
Schools
Brecksv
ille Bro
advie
w Heights
North Roya
lton City
Schools
Hudson City
Schools
Mayfield
City Sc
hools
Kent C
ity Sc
hools
Revere
Local
Schools
Twinsb
urg - C
urrent P
ricing
Tallm
adge
City Sc
hools
Woodrid
ge Lo
cal Sc
hools
Cuyahoga
Falls
City Sc
hools
Wad
sworth
City Sc
hools
Aurora
City Sc
hools
Averag
e $-
$0.50
$1.00
$1.50
$2.00
$2.50
$3.00
$3.50 $3.10
$2.75 $2.75 $2.75 $2.75 $2.75 $2.75 $2.70 $2.65 $2.55 $2.55 $2.50 $2.50 $2.50 $2.50 $2.45 $2.40 $2.64
Elementary Lunch Price
Axis Title

School Nutrition
Solon City
Schools
Stow-M
unroe F
alls C
ity Sc
hools
Nordonia
Schools
Stree
tsboro
City Sc
hools
Coventry
Local
Schools
Brecksv
ille Bro
advie
w Heights
North Roya
lton City
Schools
Hudson City
Schools
Mayfield
City Sc
hools
Kent C
ity Sc
hools
Revere
Local
Schools
Twinsb
urg - C
urrent P
ricing
Tallm
adge
City Sc
hools
Woodrid
ge Lo
cal Sc
hools
Cuyahoga
Falls
City Sc
hools
Wad
sworth
City Sc
hools
Aurora
City Sc
hools
Averag
e $-
$0.50
$1.00
$1.50
$2.00
$2.50
$3.00
$3.50
$4.00
$3.35
$3.00 $3.00 $3.00 $3.00
$-
$3.00 $2.95 $2.85 $3.00
$2.60 $2.75
$3.00 $3.00 $2.80
$2.55 $2.75
$2.91
Middle School Lunch Price
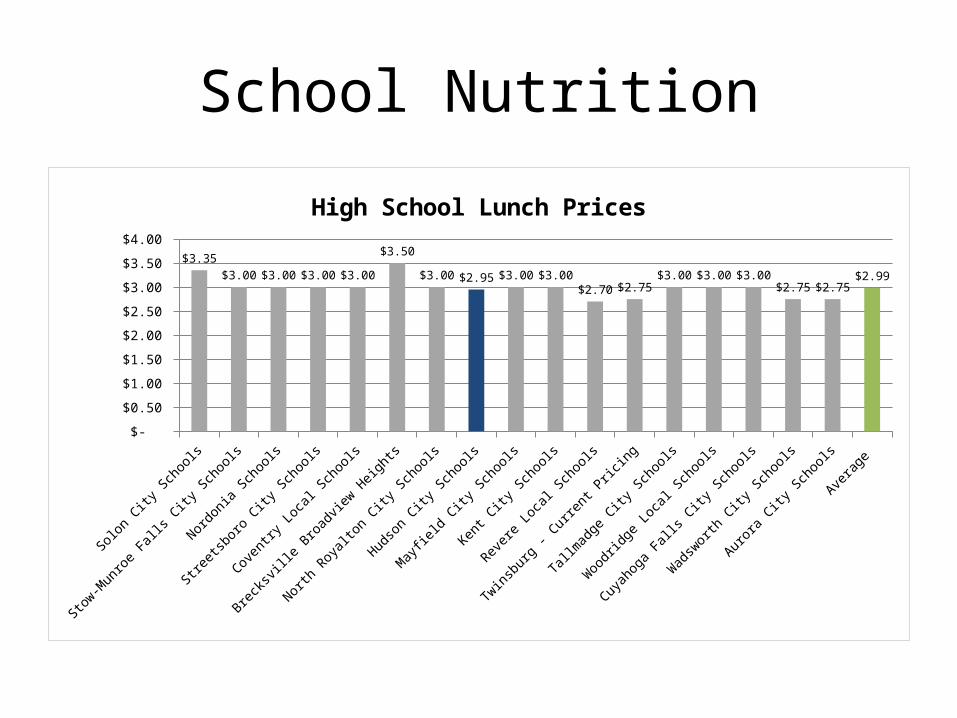
School Nutrition
Solon City
Schools
Stow-M
unroe F
alls C
ity Sc
hools
Nordonia
Schools
Stree
tsboro
City Sc
hools
Coventry
Local
Schools
Brecksv
ille Bro
advie
w Heights
North Roya
lton City
Schools
Hudson City
Schools
Mayfield
City Sc
hools
Kent C
ity Sc
hools
Revere
Local
Schools
Twinsb
urg - C
urrent P
ricing
Tallm
adge
City Sc
hools
Woodrid
ge Lo
cal Sc
hools
Cuyahoga
Falls
City Sc
hools
Wad
sworth
City Sc
hools
Aurora
City Sc
hools
Averag
e $-
$0.50
$1.00
$1.50
$2.00
$2.50
$3.00
$3.50
$4.00
$3.35
$3.00 $3.00 $3.00 $3.00
$3.50
$3.00 $2.95 $3.00 $3.00
$2.70 $2.75 $3.00 $3.00 $3.00
$2.75 $2.75 $2.99
High School Lunch Prices

School NutritionOpportunity Areas
• Revenue Growth– Lunch price increase– Vending– Breakfast– Other
• Expense Management– Staff rightsizing– Food procurement management strategies
• Substitute staffing (rate)