Business Demographics at Novogradac & Company LLP · 2014-06-04 · – Google Maps API •...
22
Business Demographics at Novogradac & Company LLP Business Demographics at Novogradac & Company LLP How Novoco implemented Business Analyst Desktop and ArcWeb Services Online How Novoco implemented Business Analyst Desktop and ArcWeb Services Online
Transcript of Business Demographics at Novogradac & Company LLP · 2014-06-04 · – Google Maps API •...

Business Demographics at Novogradac & Company LLPBusiness Demographics at
Novogradac & Company LLP
How Novoco implemented Business Analyst Desktop and
ArcWeb Services Online
How Novoco implemented Business Analyst Desktop and
ArcWeb Services Online

Two Solutions with ESRITwo Solutions with ESRI• Part 1 - Internal
– ArcGIS Business Analyst Extension
– Automated Reporting System
– Custom Demographic Mapping
• Part 1 - Internal– ArcGIS Business
Analyst Extension– Automated
Reporting System– Custom
Demographic Mapping
• Part 2 - External– ArcWeb Services– compsMART+
• portal to internal housing database
• Custom Demand Analysis
• Part 2 - External– ArcWeb Services– compsMART+
• portal to internal housing database
• Custom Demand Analysis

Company BackgroundCompany Background
• Accounting firm specializing in Low-Income Housing Tax Credits (LIHTC)
• Valuation Group performs over 1,000 market studies and appraisals annually
• Every client/state has different requirements
• Accounting firm specializing in Low-Income Housing Tax Credits (LIHTC)
• Valuation Group performs over 1,000 market studies and appraisals annually
• Every client/state has different requirements

Part 1Part 1
Internal Solutions with Business Analyst
Internal Solutions with Business Analyst

The DemographicReporting Process - Intro
The DemographicReporting Process - Intro
• Each study consists of:– Primary Market Area (PMA)– Secondary Market Area (SMA)
• Usually the Metropolitan Statistical Area (MSA)• County is often used in rural areas
– Comparison to the State or the USA• Almost 500 individual demographic variables
used for each market area– Core set makes up the basis for every report– Many clients require supplemental information

The DemographicReporting Process - Setup
The DemographicReporting Process - Setup
• Analyst submits their estimated PMA– Usually a boundary
drawn in Microsoft Streets & Trips
• PMA is recreated in ArcGIS at a higher detail level
• Data is generated and imported into Excel for demand analysis
• Analyst submits their estimated PMA– Usually a boundary
drawn in Microsoft Streets & Trips
• PMA is recreated in ArcGIS at a higher detail level
• Data is generated and imported into Excel for demand analysis

The Demographic Reporting Process – Model Builder
The Demographic Reporting Process – Model Builder
• Old Method– Run a series of
reports one at a time– Aggregate one at a
time into Excel• New Method
– Run all reports once with Model Builder
– Data is imported with VBA into a standardized Excel input sheet
• Old Method– Run a series of
reports one at a time– Aggregate one at a
time into Excel• New Method
– Run all reports once with Model Builder
– Data is imported with VBA into a standardized Excel input sheet

Outcome?Outcome?
• Turned a 2-4 hour process into a 15 minute exercise
• Allows for low-cost revisions to PMAs• More time for other profit-generating
activities
• Turned a 2-4 hour process into a 15 minute exercise
• Allows for low-cost revisions to PMAs• More time for other profit-generating
activities

Part 2Part 2
ArcWeb ServicesArcWeb Services

ArcWeb Services - IntroArcWeb Services - Intro
• Back to Market Studies– Comparables analysis
• Survey data is collected from surrounding properties
• Data is stored in an internal database– Qualified Census Tract (QCT) lookup
• Additional credit in QCTs• Required mapping within ArcGIS
– Demand Analysis• Required custom demographic report (Part 1)

ArcWeb Services – SetupArcWeb Services – Setup• Interface
– ArcWeb’s offering was similar to the old Mapquest
• At time of design (Fall 2005)• Static map required refresh to pan or zoom
– Google Maps API• Familiar interface• Smooth panning and zooming (no refresh!)
– Result• compsMART+
– Comparable Market Analysis and Research Tool
• Interface– ArcWeb’s offering was similar to the old
Mapquest• At time of design (Fall 2005)• Static map required refresh to pan or zoom
– Google Maps API• Familiar interface• Smooth panning and zooming (no refresh!)
– Result• compsMART+
– Comparable Market Analysis and Research Tool

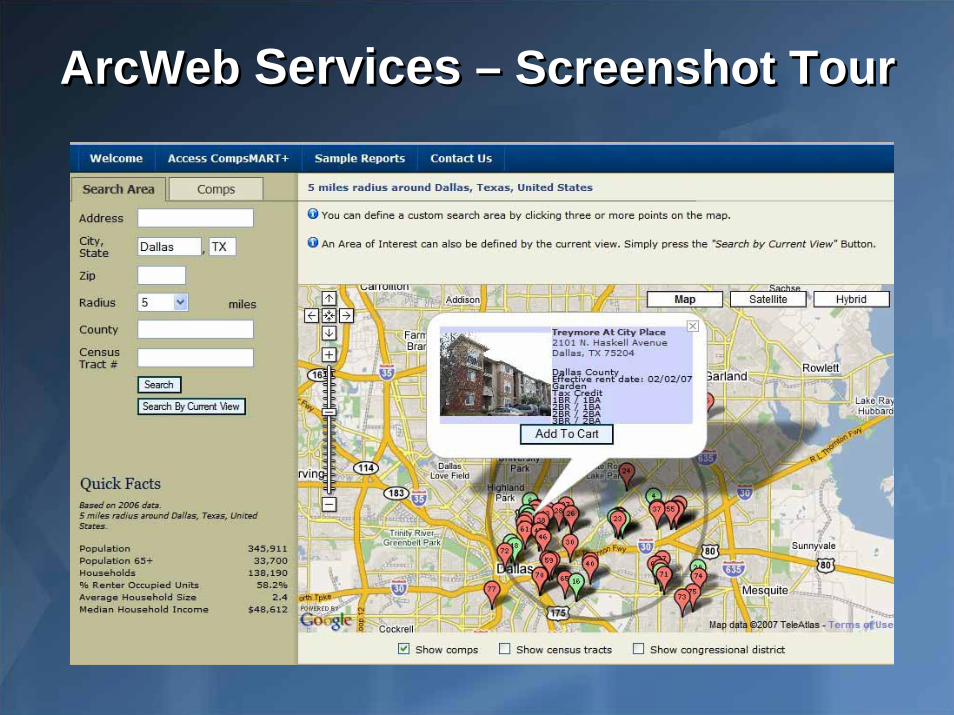
ArcWeb Services - SearchArcWeb Services - Search• Location and search
radius are selected• Additional criteria is
specified to narrow search
• Location and search radius are selected
• Additional criteria is specified to narrow search
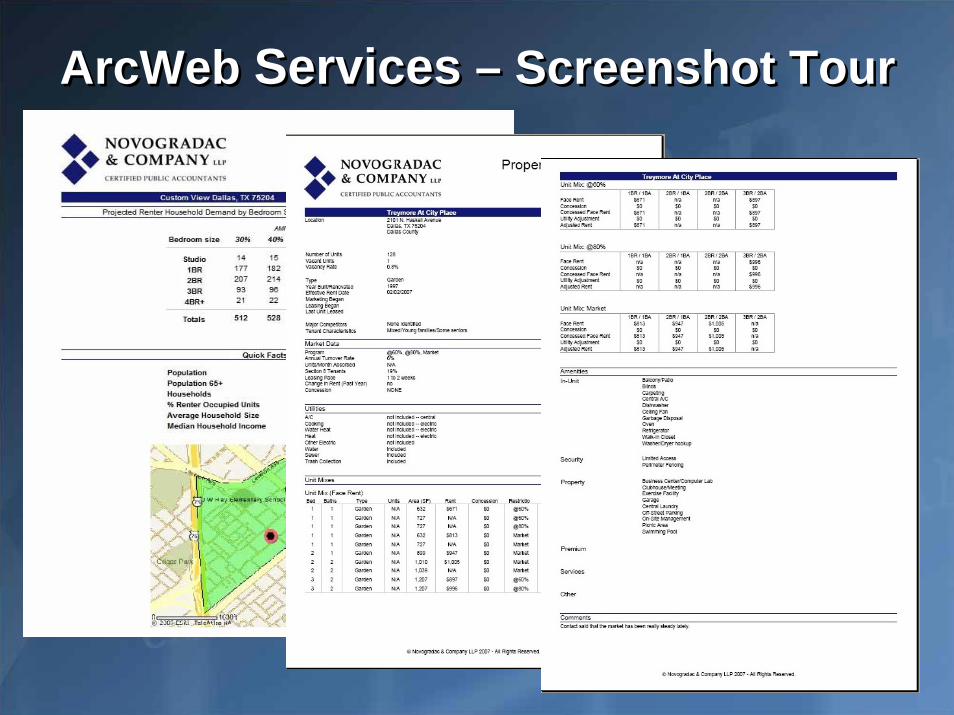
• Demographics– Quick Facts
• Key demographic variables provided with every search
– Full PDF Reports• Demand Analysis
• Demographics– Quick Facts
• Key demographic variables provided with every search
– Full PDF Reports• Demand Analysis

ArcWeb Services – Screenshot TourArcWeb Services – Screenshot Tour

ArcWeb Services – Screenshot TourArcWeb Services – Screenshot Tour

ArcWeb Services – Screenshot TourArcWeb Services – Screenshot Tour
ArcWeb Services – Screenshot TourArcWeb Services – Screenshot Tour

ArcWeb Services – Screenshot TourArcWeb Services – Screenshot Tour

ArcWeb Services – Screenshot TourArcWeb Services – Screenshot Tour

ArcWeb Services – Screenshot TourArcWeb Services – Screenshot Tour
ArcWeb Services – Screenshot TourArcWeb Services – Screenshot Tour

http://compsmart.novoco.comhttp://compsmart.novoco.com

Outcome?Outcome?
• Turned an idle database into a profit-generating service
• Allows clients to get an idea of an area’s performance without buying a full market study
• Pay per use – We only pay for what we use instead of a monthly flat rate
• Turned an idle database into a profit-generating service
• Allows clients to get an idea of an area’s performance without buying a full market study
• Pay per use – We only pay for what we use instead of a monthly flat rate