Business Cycles in Central Asia and the Russian Federation · 6 Business Cycles in Central Asia and...
32
Business Cycles in Central Asia and the Russian Federation Nurbek Jenish WORKING PAPER №15, 2013 GRADUATE SCHOOL OF DEVELOPMENT Institute of Public Policy and Administration
Transcript of Business Cycles in Central Asia and the Russian Federation · 6 Business Cycles in Central Asia and...

Business Cycles in Central Asia and the Russian Federation
Nurbek Jenish
WoRking PAPeR №15, 2013
GRADUATE SCHOOL OF DEVELOPMENT
Institute of Public Policy and Administration


INSTITUTE OF PUBLIC POLICY AND ADMINISTRATION
WORKING PAPER NO.15, 2013
AbstractThe paper examines business cycle (BC) features of selected Central Asian (CA) countries – Kyrgyzstan, Kazakhstan and Tajikistan- and the Russian Federation, from the first quarter of 2000 through the fourth quarter of 2011. Key find-ings include the following: (i) Output fluctuations in these countries are more volatile than in developed countries; (ii) Unlike in the Russian Federation, the duration of business cycles in the CA countries is shorter compared to that of developed countries; (iii) With the exception of Kazakhstan, household con-sumption is more volatile than output; (iv) There is a mixed picture on the BC properties of other main macroeconomic variables in these countries; (v) In Kyrgyzstan and Tajikistan, monetary shocks matter for BC fluctuations; (vi) In Kyrgyzstan and Tajikistan, government expenditures are found to be procycli-cal, which may indicate the inefficiency of fiscal policy in stabilizing economy following negative shocks in these countries; (vii) Kyrgyz and Tajik BCs are not synchronized with either Russian or Kazakh BCs; (viii) Kazakh and Russian BCs are synchronized, indicating the increasing degree of economic integration be-tween the countries, and (ix) With the exception of Tajikistan, there is a positive correlation between BCs in Kyrgyzstan and Kazakhstan with fluctuations in the global prices of their main export commodities: gold and oil.
keywordsbusiness cycles, Kyrgyzstan, Kazakhstan, Tajikistan, Russian Federation
JeL Codes: E32
Business Cycles in Central Asia and the Russian Federation
Nurbek Jenish

The Institute of Public Policy and Administration was established in 2011 to promote systematic and in-depth research on issues related to the socio-economic development of Central Asia, and explore policy alternatives. This paper is part of research being conducted for the “Regional Cooperation and Confidence Building in Central Asia and Afghanistan” (RCCB) project supported by the Government of Canada, Department of Foreign Affairs and International Trade.The Institute of Public Policy and Administration is part of the Graduate School of Development, University of Central Asia. The University of Central Asia was founded in 2000. The Presidents of Kazakhstan, the Kyrgyz Republic, and Tajikistan, and His Highness the Aga Khan signed the International Treaty and Charter establishing this secular and private university, ratified by the respective parliaments, and registered with the United Nations. The University is building simultaneously three fully-residential campuses in Tekeli (Kazakhstan), Naryn (Kyrgyz Republic) and Khorog (Tajikistan) that will open their doors to undergraduate and graduate students in 2016.The Institute of Public Policy and Administration’s Working Papers is a peer-reviewed series that publishes original contributions on a broad range of topics dealing with social and economic issues, public administration and public policy as they relate to Central Asia.
About the authorNurbek Jenish is a research fellow at the IPPA and associate professor at the Department of Economics, American University of Central Asia. He holds PhD in Economics from Central Eu-ropean University, and has an extensive experience in modeling and researching monetary and fiscal policy interactions in developing countries.
Copyright © 2012University of Central Asia 138 Toktogul Street, Bishkek 720001, Kyrgyz RepublicTel.: +996 (312) 910 822, E-mail: [email protected]
The findings, interpretations and conclusions expressed in this paper are entirely those of the author and do not necessary represent the view of the University of Central Asia
Text and data in this publication may be reproduced as long as the source is cited.

Contents 3
Contents
Acronyms ...............................................................................................................................................................5
1. Introduction..................................................................................................................................................6
2. Literature Review .......................................................................................................................................6
3. Methodology and Data ..............................................................................................................................8Methodology ......................................................................................................................................................................8Data .....................................................................................................................................................................................10
4. Business Cycles in Central Asia and the Russian Federation: empirical Results ................ 12Persistence .......................................................................................................................................................................12Volatility ............................................................................................................................................................................13Cross-correlations with real GDP ..........................................................................................................................15
5. Synchronization of Central Asian Business Cycles and their Dependence on External Developments .......................................................................................................................... 18
6. Conclusions and Policy implications ................................................................................................. 22
References .......................................................................................................................................................... 23
Annexes ............................................................................................................................................................... 24

Business Cycles in Central Asia and the Russian Federation4
Tables
Table 1. Data sources .................................................................................................................................................11
Table 2. Persistence of main macroeconomic variables .............................................................................13
Table 3. Absolute volatility (measured as standard deviation) ...............................................................14
Table 4. Relative volatility ........................................................................................................................................15
Table 5. Cross-correlations with real GDP. “+”: procyclical, “-”: countercyclical. .............................17
Table 6. Synchronisation of Business Cycles....................................................................................................18
Table 7. Correlation of Global Price Fluctuations of Main Export Commodities with Business Cycles ...........................................................................................................................................20
Figures
Figure 1. Kyrgyz real GDP and its trend given by HP filter .............................................................................9
Figure 2. Percentage deviations of the Kyrgyz real GDP from its trend given by the HP filter .......9
Figure 3. Real GDP growth in Kyrgyzstan ...........................................................................................................11
Figure 4. Main Export Partners of Kyrgyzstan ..................................................................................................19
Figure 5. Main Export Partners of Tajikistan .....................................................................................................20
Figure 6. Main Export Partners of Kazakhstan .................................................................................................21
Figure 7. Main Import Partners of Kazakhstan ................................................................................................21
Acronyms 5
Acronyms
BC Business Cycle CA Central Asian CB Central/National Bank CIS Commonwealth of Independent States CIS STAT Statistics Office of the Commonwealth of Independent States CPI Consumer Price Index FDI Foreign Direct Investment GDP Gross Domestic Product IFS International Financial Statistics of the IMF ILO International Labour Organization IMF International Monetary Fund IPPA, UCA Institute of Public Policy and Administration, University of Central Asia OECD Organisation for Economic Co-operation and Development REER Real Effective Exchange Rate SO National Statistics Office UK United Kingdom UN Comtrade United Nations Commodity Trade Statistics Database US United States

Business Cycles in Central Asia and the Russian Federation6
1. Introduction
This paper provides business cycle (BC) facts for Kyrgyzstan, Kazakhstan and Tajikistan, and their important economic partner, the Russian Federation.1 BCs are defined as periodic but irregular up-and-down movements in economic activity, measured by fluctuations in real Gross Domestic Product (GDP) or industrial output and other macroeconomic variables. The paper also attempts to provide answers to the following questions: What is the extent of BCs synchronization across countries? Is there increasing regional economic integration across countries? What are the nature of shocks that cause cyclical fluctuations in these countries? Are they similar?
Why is it important to study BC features of a country? First, BC facts help us understand what drives fluctuations in the economies of countries, such as supply or demand shocks. Establish-ing the nature of shocks can help decision-makers decide what the most appropriate policy is to smooth out cyclical fluctuations. Additionally, BC facts can also help decision-makers assess the role of fiscal and monetary policies in mitigating or aggravating aggregate fluctuations.
Section 2. includes a literature review. Section 3. provides a discussion of methodology and discusses data. Section 4. presents BC facts for our sample countries. Section 5. includes an ex-amination of the extent of synchronization of business cycles across the countries and their de-pendence on external developments. Section 6. discusses conclusions and policy implications.
2. Literature Review
Following the seminal paper by Kydland and Prescott2 that established the first set of “styl-ized facts” for developed countries, there has been an explosion in the literature devoted to the examination of the properties of BCs in both developed and developing countries.
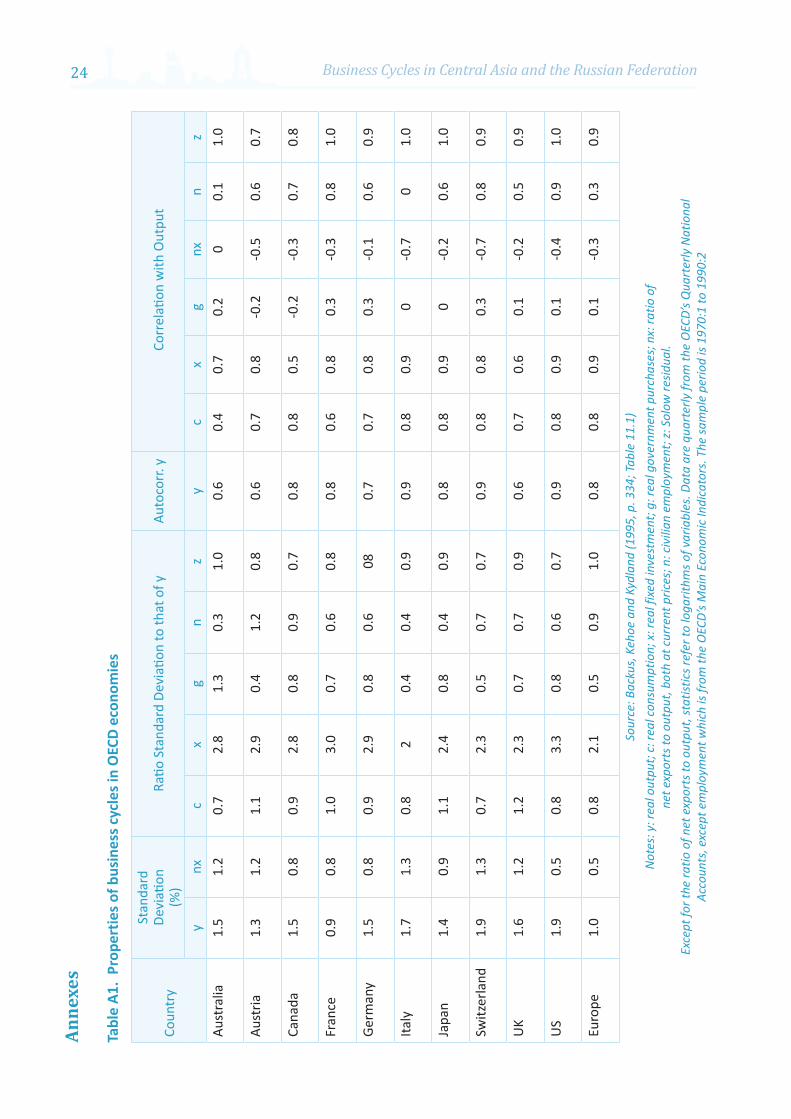
The key findings of existing literature on BCs in industrialised countries can be summarized as follows (see Table A1):• Real output and real exchange rate fluctuations have been persistent in recent years. • The magnitude of output, consumption and net exports volatility is fairly similar. The
volatility of real (private) consumption is slightly smaller than volatility of output for the majority of developed countries.
• Consumption, investment, employment, inflation and money velocity are generally procyclical.
• For the majority of countries, government expenditures are less volatile than output and are typically acyclical.
• Investments are, on average, more than two times more volatile than output.• There is international co-movement in output, consumption and investment. However,
output correlations are generally higher than consumption correlations.
1 The author would like to thank Dr. Charles Becker for providing valuable comments and suggestions, and Anvar Muratkhanov for providing excellent research assistance.
2 Finn E. Kydland and Edward C. Prescott, “Business Cycle: Real Facts and a Monetary Myth,” Federal Reserve Bank of Minneapolis Quarterly Review 14 no. 2, (1990): 3–18.

2. Literature Review 7
While the “stylized facts” for developed countries discussed in the literature are quite robust,3 this is may not be true for those of developing countries. In fact, there is mixed evidence regard-ing the cyclical properties of main macroeconomic variables across developing countries.4
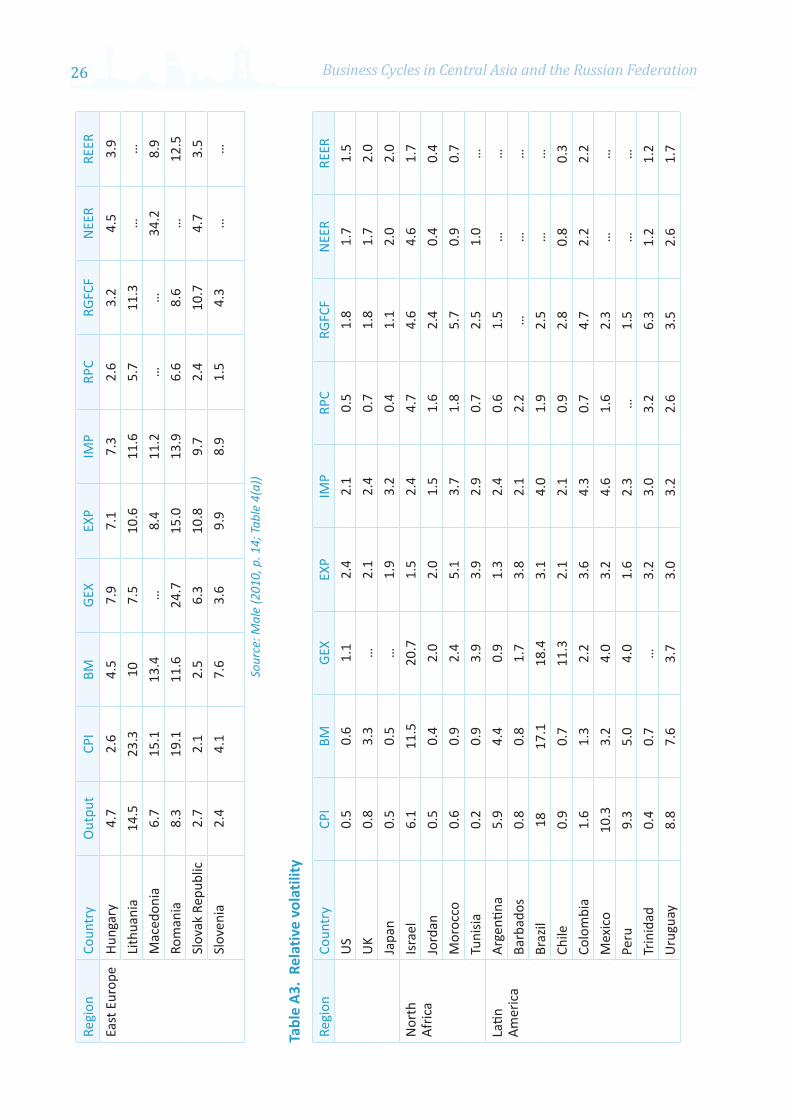
A recent paper by Male5 documents empirical regularities for 32 developing countries in Lat-in America, Africa, North Africa, East Europe and Asia (see Tables A2 and A3). The common empirical regularities arising from this and the other papers (listed in footnote 4) examining developing countries can be summarized as follows:• BCs are generally shorter and more volatile in developing countries, compared to those
in the industrialized countries. • Output is more volatile in developing countries than in developed countries. • In developing countries, consumption is more volatile than output. • Monetary aggregates, private consumption, investment and real wages are all generally
procyclical. • Real interest rates are more volatile in developing countries than those in developed
countries.
Despite numerous studies of BCs in developing countries, there are few recent studies that examine countries in the Central Asian region, namely, Kyrgyzstan, Kazakhstan and Tajik-istan. One exception is a paper by Benczúr and colleagues6 that studies BC features in coun-tries of the former Soviet Union. They use quarterly observations covering the period 1996-2004. However, the findings of the paper may be distorted because since the collapse of the Soviet Union, almost all the counties in their sample went through large-scale structural re-forms. The cyclical properties of macroeconomic variables may therefore be substantially different from what they may be once the reforms are over. The Russian financial crisis years from 1998 to 1999 may also have caused some distortions in the results.
3 See, for instance, Kydland and Prescott (1990); Pierre-Richard Agénor, C. John McDermott, and Eswar S. Prasad. “Macroeconomic Fluctuations in Developing Countries: Some Stylised Facts,” World Bank Economic Review 14 no. 2, (2000):251-285; David K. Backus and P.J. Kehoe, “International Evidence on the Historical Properties of Business Cycles.” American Economic Review 82, (1992): 864-888; and David K. Backus, P.J. Kehoe and Finn E. Kydland, “International Business Cycles: Theory and Evidence” in Frontiers of Business Cycle Analysis, ed. Thomas F. Cooley (Princeton: Princeton University Press, 1995), among others.
4 See, for instance, see Agenor et al (2000); John Rand and Finn Tarp, “Business Cycles in Developing Countries: Are They Different?” World Development 30 no. 12, (2002): 2071-2088; Pablo Andrés Neumeyer and Fabrizio Perri, “Business Cycles in Emerging Economies: The Role of Interest Rates.” Journal of Monetary Economics 52, 2005: 345-380; and Mark Aguar and Gita Gopinath, “Emerging Market Business Cycles: The Cycle is the Trend.” Journal of Political Economy 115 no. 1, 2007: 69–102.
5 Rachel Male, “Developing Country Business Cycles: Revisiting the Stylized Facts” School of Economics and Finance Working Paper 663 (London: Queen Mary, University of London, 2010).
6 Péter Benczúr, Emin Muradov and Attila Rátfai, “Cyclical Fluctuations in CIS Economies” Journal of Business Cycle Measurement and Analysis 3 no. 1, (2007): 121-135.

Business Cycles in Central Asia and the Russian Federation8
3. Methodology and Data
Methodology
Analysing BC properties of a variable requires examining the volatility and cross-correlation of the variable with a GDP, which is used as a measure of aggregate economic activity. To ob-tain volatilities and correlation coefficients, several steps are necessary. The first step is to take natural logarithms of times series, wherever possible. It is a standard practice in the real BC literature to assume that macroeconomic time series are multiplicatively separable. Tak-ing natural logarithms would therefore render the variable additively separable. Moreover, taking logarithms also helps smooth out the series. The next step is to deseasonalise the data. One has to get rid of seasonal variation in the data in order not to contaminate the cycle. This is done using the Census Bureau’s X-11 method. Once deseasonalised, the series are filtered (detrended) to extract the cyclical (stationary) and the trend (nonstationary) components. For that purpose, the Hodrick-Prescott (HP) detrending procedure was employed. Despite some drawbacks, the HP remains the most common choice in the real BC literature.7
The HP filter is designed to optimally extract a nonstationary component yielding a station-ary cyclical component, which can be used by researchers to analyse BC. A (nonstationary) series �t can be decomposed into cyclical component, ct, and trend component, τt: �t = ct + τt for t=1,... ,T
The trend component, τt, is obtained by minimising
where λ is set equal to 1,600 for a quarterly series.8 The cyclical part of a series, which is of main interest (Figure 2), is obtained by
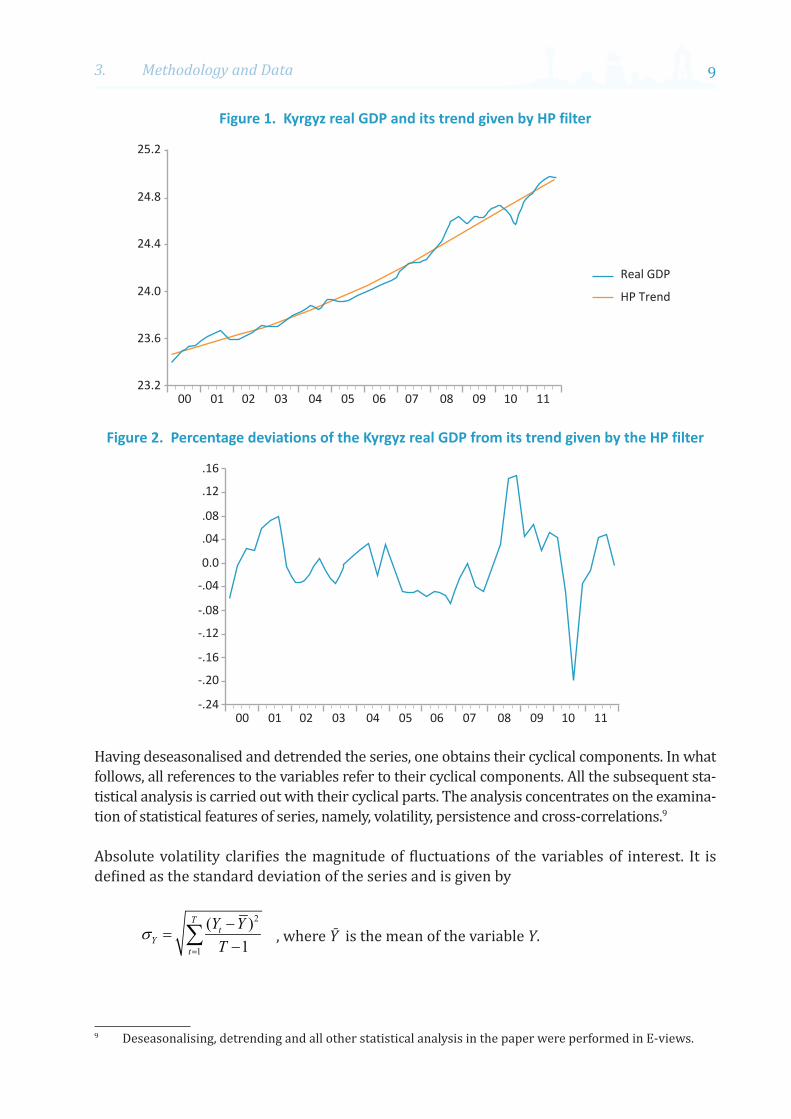
Figure 1 depicts the deseasonalized logarithm of Kyrgyz real GDP series and the trend given by the HP filter. Figure 3 plots the cyclical part of the logarithm of Kyrgyz real GDP series.
7 See Robert G. King and Sergio T. Rebelo, “Low Frequency Filtering and Real Business Cycles” Journal of Economic Dynamics and Control 17 no. 1-2, (1993): 207-231; and Timothy F. Cogley and James M. Nason, “Effects of the Hodrick-Prescott Filter on Trend and Difference Stationary Time Series: Implications for Business Cycle Research” Journal of Economic Dynamics and Control 19 no. 1-2, (1995): 253-278 for more detailed discussion of the shortcomings of the HP filter. An alternative detrending procedure also used in the literature is the band-pass (BP) filter developed in Marianne Baxter and Robert G. King, «Measuring Business Cycles: Approximate Band-Pass Filters for Economic Time Series» Review of Economics and Statistics 81 no. 4, (1999): 575-593. See Rand and Tarp (2002) for a discussion of the relative advantages of the BP filter vis-à-vis the HP.
8 Choosing an optimal value for has caused much controversy in the literature. However, Hodrick and Prescott, amongst others, find this value to be reasonable for quarterly time series. They showed little change in results when was changed by a factor of four to 400 or 6,400.
3. Methodology and Data 9
Figure 1. Kyrgyz real GDP and its trend given by HP filter
23.200 01 02 03 04 05 06 07 08 09 10 11
23.6
24.0
24.4
24.8
25.2
HP Trend
Real GDP
Figure 2. Percentage deviations of the Kyrgyz real GDP from its trend given by the HP filter
-.2400 01 02 03 04 05 06 07 08 09 10 11
-.16
-.08
0.0
.08
.16
-.20
-.12
-.04
.04
.12
Having deseasonalised and detrended the series, one obtains their cyclical components. In what follows, all references to the variables refer to their cyclical components. All the subsequent sta-tistical analysis is carried out with their cyclical parts. The analysis concentrates on the examina-tion of statistical features of series, namely, volatility, persistence and cross-correlations.9
Absolute volatility clarifies the magnitude of fluctuations of the variables of interest. It is defined as the standard deviation of the series and is given by
, where Ȳ is the mean of the variable Y.
9 Deseasonalising, detrending and all other statistical analysis in the paper were performed in E-views.

Business Cycles in Central Asia and the Russian Federation10
Relative volatility is measured as the ratio of the standard deviation of the series and stand-ard deviation of (detrended) real GDP. If relative volatility equals one, it implies that the vari-able has the same cyclical amplitude as the aggregate business cycle, which is proxied by real GDP; whereas relative volatility greater than one means that the variable has greater cyclical amplitude than the aggregate business cycle. Degree of persistence is captured by the first order autoregressive coefficient in the series. The Ljung-Box portmanteau (Q) test statistics measures the significance of persistence. If Q-statistics has p-value greater than the signifi-cance level10 then it implies that there is little or no persistence in the cyclical component of the variable.
The extent of co-movement of the variables, Yt and Xt , is measured by the magnitude of the (cross-) correlation coefficient
where variables with bars denote their respective means.
Variables are defined to be a) procyclical if they move in the same direction – the contempo-raneous correlation coefficient, ρ(0), is positive; b) countercyclical if they move in the oppo-site direction - negative contemporaneous correlation coefficient, and c) acyclical if they are uncorrelated if ρ(0)=0.
The cross-correlation coefficient also indicates whether the macroeconomic series leads, lags or is synchronous with the business cycle. Series Yt is considered to (i) lead the cycle by i periods if the largest cross-correlation coefficient, ρ(i), arises for a negative i; (ii) be syn-chronous with the cycle if the largest cross-correlation coefficient arises at i=0, and (iii) lag the cycle by i periods if the maximum cross-correlation arises for a positive i.
Data
The data for the countries under consideration - Kyrgyzstan, Tajikistan, Kazakhstan and the Russian Federation - are quarterly and cover the period from the first quarter of 2000 through the fourth quarter of 2011.11 The data come mainly from national statistics offices and national/central banks, as well as from databases of international financial institutions (Table 1). With the sole exception of Tajikistan, the quarterly data for almost all macroeco-nomic series are available for the other countries. Data on (realized) quarterly foreign direct investments (FDI), household consumption and monetary aggregate M1 are not available and therefore cross-correlation of these variables with the aggregate business cycle in Tajik-istan is not examined.
10 5 % significance level is most frequently used.11 Pre-2000 years are not considered since (i) During that period the countries underwent large-scale
structural reforms; (ii) There are missing data, and (iii) Including 1998-1999 is not desirable since this was the time of the Russian financial crisis.

3. Methodology and Data 11
Table 1. Data sources
Kazakhstan Kyrgyzstan Tajikistan Russian FederationNominal GDP SO CB CIS STAT SONominal exchange rate CB CB CB CBReal effective exchange rate CB CB CB IFSRemittances n/a CB Russian CB n/aGovernment expenditures IFS SO CB CBConsumption IFS SO - IFSForeign Direct Investment (FDI) CB CB - CBM1 CB CB - -M2 CB CB CIS STAT CBGross fixed capital formation CIS STAT CB SO CIS STATExport CB CB SO CBImport CB CB SO CBCPI CB CB and SO CB CBEmployment IFS IFS SO IFS and ILO
Notes: CB: Central/National Bank; SO: National Statistics Office; IFS: International Financial Statistics of the International Monetary Fund; ILO: International Labour Organisation; CIS STAT: Statistics Office of the Commonwealth of Independent States; n/a: not applicable; “-”: unavailable data
To generate the cyclical component of variables, a number of transformations are made. First, nominal GDP and its components, government expenditure, consumption, export, import and investment (as proxied by gross fixed capital formation) are deflated by the consumer price index (CPI) to obtain constant price measures of these variables.12 For all the countries, their respective first quarter 2000 CPI series are used as a base year CPI. In the case of Kyrgyzstan, Figure 3. shows that GDP growth rates obtained by deflating nomi-nal GDP series are not different from the actual ones.13 Inflation is defined as the rate of change in the CPI. Increases in the values of nominal and real effective exchange rates cor-respond to nominal and real depreciation of currency, respectively. Finally, the variables are transformed into natural logarithm form, and statistical analysis is carried out.
Figure 3. Real GDP growth in Kyrgyzstan
-50-30
2000 2001 2002 2003 2004 2005 2006 2007 2008 2009 2010 2011-101030507090
Perc
ent
author's calculation IFS
12 Quarterly real GDP series are not reported for most of the countries under consideration. Moreover, quarterly GDP deflator series are generally not available in these countries. The SO of the Russian Federation publishes quarterly real GDP series, which are used in this paper.
13 I have conducted similar exercises for Kazakhstan and Tajikistan. The comparison showed that there is not much difference between officially reported and the calculated figures.
Business Cycles in Central Asia and the Russian Federation12
4. Business Cycles in Central Asia and the Russian Federation: empirical Results
Persistence
Persistence of main macroeconomic variables (measured by the first order autocorrelation coefficient) is presented in Table 2. Significant output (real GDP) persistence can be observed in the Russian Federation, Kyrgyzstan and Tajikistan. However, in the latter two countries, the magnitude of the persistence is substantially lower compared to that of Russia. The per-sistence of Russia’s GDP is similar to developed countries. Surprisingly, output persistence in Kazakhstan is even smaller than in Kyrgyzstan and Tajikistan. A key empirical feature of business cycles in industrialised countries is the significant persistence in output fluctua-tions. Though Kazakhstan is not considered an industrialised country, it is more developed than Kyrgyzstan and Tajikistan. Therefore, one would expect the magnitude of persistence of Kazakh output fluctuations to be, at least higher than in Kyrgyzstan and Tajikistan.14
There is significant persistence of remittances’ fluctuations in Kyrgyzstan and Tajikistan. The economies of these countries are heavily reliant on migrant remittances. In 2011, remittanc-es constituted more than 30 % and 50 % of GDP in Kyrgyzstan and Tajikistan respectively. The magnitude of remittances fluctuations is higher in Tajikistan than in Kyrgyzstan. One possible explanation for this observed difference is the difference in the sectors that migrant worker engage in. The majority of migrant workers from both Kyrgyzstan and Tajikistan work in the Russian Federation. It is argued that the migrants from Kyrgyzstan are typically employed by the services sector in Russia, while Tajik workers are mostly in construction. In general, construction sector is more sensitive than the services sector to changes in eco-nomic conditions, so the extent of remittance fluctuations persistence is greater in Tajikistan.
The persistence of real exchange rate fluctuations in industrialised countries is significant. All four countries being assessed also exhibit significant real exchange rate fluctuations, though the magnitude of this persistence is slightly lower than that of developed countries. For instance, the average autocorrelation coefficient at lag one for the United States (US), the United Kingdom (UK) and Japan is 0.84. It is 0.7 for the countries in our sample.
There is some price persistence over the sampling period, except for Kazakhstan, which is characterised by the first autocorrelation coefficient for CPI series. This is indicative of existing price rigidities (stickiness) in the countries.15 Again, the magnitude of price per-sistence in these countries is smaller than that of the developed countries. For instance, the average price persistence for the US, UK and Japan is 0.92, while for Kyrgyzstan, Tajikistan and Russia it is 0.33. It would be also interesting to see how labour markets adjust to changing economic environment by examining cyclical properties of real wages in these countries. However, existing official wage statistics, at least in Kyrgyzstan and Tajikistan, are not suitable for such analysis, as they do not take into account wages paid in the informal sector or income of self-employed people. Moreover, in what follows,
14 After correcting for the influence of oil prices.15 This may be partially due to policy inconsistency and may imply policy lurching and imported inflation.

4. Business Cycles in Central Asia and the Russian Federation: Empirical Results 13
cyclical properties of employment are not analysed since the official labour statistics, at least in Kyrgyzstan and Tajikistan, are not reliable.
Finally, our sample countries show significant real exchange rate persistence similar to in-dustrialised economies. Again, the magnitude of Real Effective Exchange Rate (REER) persis-tence in slightly smaller in our countries than in developed countries.
With the exception of the Russian Federation, the duration of BCs (measured by persistence of real GDP fluctuations) is shorter in our sample economies compared to that of developed countries. This is generally in line with the findings in the existing literature that BCs in de-veloping countries are shorter than those in developed ones.
Table 2. Persistence of main macroeconomic variables
Country Real GDP Cons’n Gov.
exp. M1 M2 REER NER Export Import Remit’s Inv’t FDI CPI Empl’t
Kyrgyzstan 0.57 0.49 0.20* 0.79 0.82 0.78 0.82 0.29 0.67 0.57 0.27 0.12* 0.38 0.87Kazakhstan 0.36 0.19* 0.45 0.80 0.84 0.67 0.83 0.65 0.65 - 0.38 0.15* 0.19* 0.44Russia 0.88 0.82 -0.08* - 0.84 0.61 0.75 0.71 0.73 - 0.83 - 0.30 0.50Tajikistan 0.54 - 0.34 - 0.78 0.73 0.74 0.32 0.32 0.73 0.28* - 0.32 0.45
Notes: *: not significant p>0.05; “-”: unavailable data
Volatility
The magnitude of fluctuations of the macroeconomic variables of interest is presented in Table 3. If we compare absolute volatility of real GDP in our sample countries with the corresponding figures for the developed countries reported in Table A1, one can note that volatility of output (real GDP) is substantially higher than corresponding fig-ures for developed countries. This is in line with some stylised BC facts for developing countries: BCs are more volatile in developing countries than in industrialised econo-mies. One explanation for excessive volatility in developing countries includes three key obeservations:16 (i) Developing countries are more vulnerable to external shocks; (ii) They may be subject to greater domestic shocks, for instance, arising from policy failures, and (iii) Developing countries do not have well developed and functioning fi-nancial markets that would allow them to diversify risks and they may not possess the ability to carry out macroeconomic stabilisation policy. In the context of our sample countries, the Russian Federation has the lowest volatility of output at 0.03. Surpris-ingly, Kazakhstan, with its “more developed” economy than Kyrgyzstan and Tajikistan, exhibits the highest output volatility.17
16 Norman V. Loayza, Romain Rancière, Luis Servén, and Jaume Ventura, “Macroeconomic Volatility and Welfare in Developing Countries: An Introduction” The World Bank Economic Review 21 no. 3, (2007): 343–357.
17 One has to consider that the economy of Kazakhstan has a mineral orientation.

Business Cycles in Central Asia and the Russian Federation14
Table 3. Absolute volatility (measured as standard deviation)18
Country Real GDP Cons’n Gov.
exp. M1 M2 REER NER Export Import Remit’s Inv’t FDI CPI Emp’t
Kyrgyzstan 0.06 0.09 0.08 0.06 0.07 0.05 0.04 0.14 0.12 0.36 0.17 0.48 0.02 0.01Kazakhstan 0.10 0.06 0.08 0.08 0.09 0.04 0.05 0.15 0.08 - 0.12 0.23 0.01 0.01Russia 0.03 0.03 0.10 - 0.08 0.04 0.06 0.11 0.09 - 0.08 - 0.01 0.01Tajikistan 0.06 - 0.15 - 0.20 0.04 0.06 0.16 0.14 0.17 0.24 - 0.03 0.01
Notes: “-”: unavailable data
In recent years, remittances in Kyrgyzstan were twice as volatile than those in Tajikistan. One can also observe that volatilities of prices (based on CPI) in our sample economies are of the same magnitude as those for developed countries (Table A1), which is indicative of more or less stable inflation control policy during the last decade. Among our countries, Kyrgyzstan has the highest household consumption volatility. There may be two possible explanations. First, the financial system in Kyrgyzstan is less developed than that of Kazakhstan and the Russian Federation. As a result, households have more limited access to bank loans as they face higher interest rates. Despite a large number of microfinance institutions in Kyrgyzstan, the effective annual interest rate charged by micro-credit and finance entities can be as high as 60 %. These factors prevent households from obtaining loans at reasonable rates that would otherwise allow them to smooth consumption during difficult times. Second, high vol-atility of consumption can also be due to high volatility of remittances in Kyrgyzstan (which constitute more than 30 % of GDP), which are primarily used for consumption. The lower volatility of consumption in Kazakhstan may reflect stabilisation policy efforts and the pres-ence and active use of the stabilisation fund.
Relative volatilities, which are defined as a ratio of absolute volatility of a macroeconomic variable to absolute volatility of real GDP, are reported in Table 4. In Kyrgyzstan, consump-tion is one and half times more volatile than output. This may be attributable to a lack of consumption smoothing over the course of the BC in the country. In the Russian Federation, consumption is almost as volatile as output, whereas in Kazakhstan, consumption is 40% less volatile than output. From the stylised BC facts, we know that consumption in developed countries is on average 50% less volatile than output. In that regard, cyclical properties of consumption in Kazakhstan resemble those of developed countries.
With the exception of Kazakhstan, government expenditures in the four countries are more volatile than output: in Kyrgyzstan, they are 40 % more volatile than output; in the Rus-sian Federation and Tajikistan, government expenditures are more than three and two times more volatile than output, respectively. The observed excessive volatility in these countries may suggest that rather than helping smooth BC fluctuations, the government may actually aggravate them.
18 In Tajikistan and Kyrgyzstan, agriculture and petty trade are relatively large shares of the economy. These sectors may be prone to measurement error and are not usually estimated carefully on a quarterly or even annual basis. If this is the case, then volatility of output and consumption in these countries may actually be lower.

4. Business Cycles in Central Asia and the Russian Federation: Empirical Results 15
Table 4. Relative volatility
Country Cons’n Gov. exp. M1 M2 REER NER Export Import Remit’s Inv’t FDI CPI Emp’t
Kyrgyzstan 1.5 1.4 1.1 1.3 0.8 0.7 2.5 2.1 6.2 2.9 8.4 0.4 0.2Kazakhstan 0.6 0.8 0.8 0.9 0.4 0.5 1.5 0.8 n/a 1.2 2.4 0.1 0.1Russia 1.1 3.4 - 2.6 1.5 2.2 3.7 3.0 n/a 2.7 - 0.3 0.4Tajikistan - 2.5 - 3.3 0.7 1.0 2.7 2.3 2.8 4.0 - 0.4 0.1
Notes: “-”: unavailable data
With the exception of Russia, both nominal and real exchange rates showed lower volatility than output. This is due to the fact that all of the CA economies studied follow de facto man-aged exchange rate regime and enjoyed relative price stability in the last decade. In the case of Russia, excessive volatility of nominal exchange rate (which led to high real exchange rate volatility) may be attributable to huge amounts of capital inflows and outflows in recent years. This may also partially explain the higher relative volatility of monetary aggregate M2 in Russia compared to Kyrgyzstan and Tajikistan. Average relative export and import volatili-ties in our sample countries were 2.6 and 2.1, respectively. These figures are similar to cor-responding average figures for the US, UK and Japan, which were 2.1 and 2.6.
The existing stylised facts for developing countries suggest that volatility of investment should be larger than that of output in developing countries. Investment volatility in our countries is in line with these facts. One can note that FDIs are 8.4 times more volatile in Kyrgyzstan than output. This is primarily a consequence of the 2005 and 2010 events, when the country went through socio-political disturbances that led to leadership change and dis-rupted economic activity.
Cross-correlations with real GDP
This section examines the degree of co-movement of the macroeconomic variable of inter-est with aggregate cycle (measured as the cyclical part of real GDP). The extent of co-move-ment is measured by the correlation coefficient between the variable and the real GDP (see methodology section). Table 5 presents the correlation results for the four countries.
Consumption and investmentThe correlation coefficients of household consumption with the real GDP in Kyrgyzstan, Kazakhstan and the Russian Federation are positive. This means that consumption in these countries is procyclical. In Kyrgyzstan, consumption leads the cycle by 2 periods (or six months), whereas in Kazakhstan and Russia it lags the cycle by three and six months, respectively. Roughly speaking, these numbers may suggest that a reduction in private consumption precedes a downturn in economic activity in Kyrgyzstan, whereas in Kazakhstan and Russia, private consumption follows the aggregate cycle. The strong procyclicality of private consumption is found for the majority of developed and devel-oping countries. Investment is procyclical in Kazakhstan and Tajikistan and Russia, while in Kyrgyzstan it is acyclical.

Business Cycles in Central Asia and the Russian Federation16
Government expenditureIn Kazakhstan, government expenditure is acyclical. In contrast, government expendi-ture is strongly procyclical in Kyrgyzstan, the Russian Federation and Tajikistan. In both countries, government expenditures lag the cycle; in Kyrgyzstan by six months, and in Tajikistan by three months. It is widely argued that for a fiscal policy to have a stabilis-ing effect it should be countercyclical. If government expenditure is procyclical it can exacerbate business cycle fluctuations. For instance, if economy goes into recession, contractionary fiscal policy may lead to even deeper economic recession. Conversely, during economic booms expansionary fiscal policy may lead to overheating of an econo-my.19 The procyclicality of government expenditure in Kyrgyzstan and Tajikistan may be attributable to (i) (relatively) limited government revenue administration capacity. Revenue collections are (very) sensitive to economic conditions in these countries; (ii) (relatively) high budget deficits in recent years that prevent countries to further in-crease budget deficit to follow expansionary fiscal policy during economic downturns, and (iii) the absence of an abundant natural resource base, e.g. oil, and as a conse-quence, an absence of stabilisation funds where extra revenues associated with natu-ral resources can be saved and utilised during bad times. Therefore, the governments in Kyrgyzstan and Tajikistan should address their revenue administration policies so as not to reinforce business cycle fluctuations. In the Russian Federation, stabilisation fund resources have been rarely used to counter economic downturns on the grounds that they may trigger inflation increase.
Monetary aggregates and pricesIn addition to fiscal policy, monetary policy is an important tool for macroeconomic sta-bilisation. It is therefore important to examine whether or not changes in money supply (represented by monetary aggregates M1 and M2) actually cause output fluctuations in our sample countries.
The results of cross-correlation tests suggest that money supply in our countries were strongly procyclical with output, leading cycles in Kyrgyzstan and Tajikistan and coinciding with the cycle in Kazakhstan and Russia. In the case of the latter three countries, changes in money are transmitted fairly quickly to economic activity (within three months). In Kyr-gyzstan, monetary innovations are transmitted within one year.
To this end, a series of Granger causality20 tests were undertaken for cyclical components of monetary aggregates and output. The test results (Table A4) suggest that changes in money supply in Kyrgyzstan and Tajikistan can help to predict the direction of cyclical fluctuations in the country. In the case of Kazakhstan, neither real GDP nor monetary aggregates have been found to Granger cause each other. In the Russian Federation, real GDP Granger causes monetary aggregate M2, whereas there is no reverse causality. This suggests that money is influenced by, and does not influence, output.
19 Provided that economy is close to its full-employment level.20 Granger causality has a different meaning than the standard causality concept in economics/
econometrics: a variable X is said to Granger cause variable Y if the past realisations of X help to predict current realisation of Y.

4. Business Cycles in Central Asia and the Russian Federation: Empirical Results 17
Tabl
e 5.
Cro
ss-c
orre
latio
ns w
ith re
al G
DP. “
+”: p
rocy
clic
al, “
-”: c
ount
ercy
clic
al.
Coun
try
Cons
’nGo
v.exp
.M
1M
2RE
ERN
EREx
port
Impo
rtRe
mit’
sIn
v’t
FDI
CPI
Empl
’tKy
rgyz
stan
0.5
0.4
0.6
0.6
0.4
-0.5
0.7
0.6
-0.5
0.6
0.5
-0.4
lead
s the
cy
cle
by 2
pe
riods
lags
the
cycl
e by
2
perio
ds
lead
s the
cy
cle
by 4
pe
riods
lead
s the
cy
cle
by 4
pe
riods
coin
cide
n-ta
l with
th
e cy
cle
lead
s the
cy
cle
by 4
pe
riods
coin
cide
n-ta
l with
th
e cy
cle
lead
s the
cy
cle
by 2
pe
riods
lags
the
cycl
e by
1
perio
d
acyc
lical
coin
cide
n-ta
l with
th
e cy
cle
lead
s the
cy
cle
by 4
pe
riods
lags
the
cycl
e by
5
perio
ds
Kaza
khst
an0.
40.
30.
4-0
.30.
3n/
a0.
3la
gs th
e cy
cle
by 1
pe
riod
acyc
lical
acyc
lical
coin
cide
n-ta
l with
th
e cy
cle
lags
the
cycl
e by
2
perio
ds
lags
the
cycl
e by
1
perio
d
acyc
lical
lags
the
cycl
e by
3
perio
ds
n/a
lags
the
cycl
e by
5
perio
ds
acyc
lical
acyc
lical
acyc
lical
Tajik
istan
-0.
5-
0.6
0.5
0.74
-0.5
0.3
0.7
0.6
--0
.4-
lags
the
cycl
e by
1
perio
d
-le
ads t
he
cycl
e by
1
perio
d
lags
the
cycl
e by
2
perio
ds
acyc
lical
lags
the
cycl
e by
2
perio
ds
lead
s the
cy
cle
by 1
pe
riod
lead
s the
cy
cle
by 1
pe
riod
coin
cide
n-ta
l with
th
e cy
cle
-la
gs th
e cy
cle
by 2
pe
riods
acyc
lical
Russ
ia0.
80.
3-
0.9
0.4
-0.8
0.7
0.8
n/a
0.9
-0.
40.
6la
gs th
e cy
cle
by 2
pe
riods
lags
the
cycl
e by
5
perio
ds
-co
inci
den-
tal w
ith
the
cycl
e
coin
cide
n-ta
l with
th
e cy
cle
coin
cide
n-ta
l with
th
e cy
cle
coin
cide
n-ta
l with
th
e cy
cle
lags
the
cycl
e by
1
perio
d
n/a
lags
the
cycl
e by
1
perio
d
-la
gs th
e cy
cle
by 2
pe
riods
coin
cide
n-ta
l with
th
e cy
cle
Not
es: n
/a: n
ot a
pplic
able
; “-”
: una
vaila
ble
data
. For
mac
roec
onom
ic v
aria
bles
foun
d to
be
acyc
lical
, cor
rela
tion
coef
ficie
nts a
re n
ot re
port
ed.

Business Cycles in Central Asia and the Russian Federation18
Based on the examination of cross-correlations and results of Granger causality tests, one can conclude that monetary shocks do matter for business cycle fluctuations, at least in Kyr-gyzstan and Tajikistan. Further, one can observe that prices (as proxied by CPI) are strongly procyclical in Kyrgyzstan and Russia and countercyclical in Tajikistan. It is argued that if both prices and inflation are procyclical then BCs are driven by demand shocks. If fluctuations are due to supply side shocks then both prices and inflation should be countercyclical. There-fore, it is plausible that BCs in Kyrgyzstan and the Russian Federation are driven by demand shocks, whereas those in Tajikistan are driven by supply shocks. There is no clear cut picture for Kazakhstan since prices are found to be acyclical.21
RemittancesMigrant remittances in Tajikistan are strongly procyclical and lead the cycle by one quarter. This is not surprising as remittances recently constituted more than 50 % of GDP in Tajik-istan. Therefore, the degree of economic activity and aggregate fluctuations are heavily de-pendent on the dynamics of remittances in Tajikistan.
In Kyrgyzstan, remittances also constitute a substantial share of GDP; over 30 % in 2011. However, they are countercyclical and lag the cycle by three month. A possible explana-tion for this is that following deteriorating economic conditions, migrant workers remit more money back home to help their families mitigate the negative consequences of re-cession. Conversely, during good times, migrant workers reduce the amount of money they remit home.
5. Synchronization of Central Asian Business Cycles and their Dependence on External Developments
The final objectives of this paper are (i) to assess whether BCs in our sample countries are synchronised, and (ii) to examine what other external factors may affect cyclical fluctuations in the countries.
To examine the degree of BCs synchronisation, correlation was computed between (cyclical parts of) real GDPs. The BCs across countries are said to be synchronised if the correlation is positive. The higher the value of correlation coefficient, the stronger the synchronisation is. The results of the analysis are summarized in Table 6.
Table 6. Synchronisation of Business Cycles
Country Kazakhstan Russian Federation Kyrgyzstan No synchronisation No synchronisationKazakhstan - Synchronised, correlation=0.3Tajikistan No synchronisation No synchronisation
21 In part this may reflect more sophisticated monetary policy but it is also possible that there is more error in Kazakh prices because of underestimation of housing price inflation, which is especially important there.
195. Synchronization of Central Asian Business Cycles
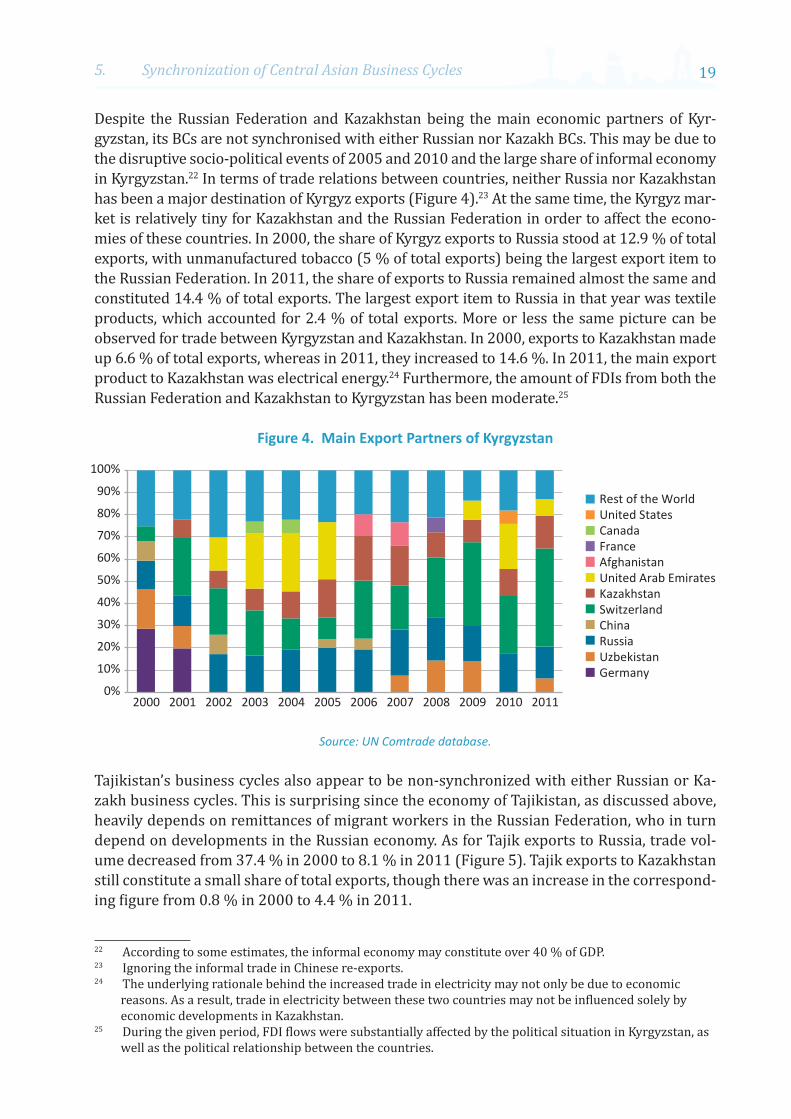
Despite the Russian Federation and Kazakhstan being the main economic partners of Kyr-gyzstan, its BCs are not synchronised with either Russian nor Kazakh BCs. This may be due to the disruptive socio-political events of 2005 and 2010 and the large share of informal economy in Kyrgyzstan.22 In terms of trade relations between countries, neither Russia nor Kazakhstan has been a major destination of Kyrgyz exports (Figure 4).23 At the same time, the Kyrgyz mar-ket is relatively tiny for Kazakhstan and the Russian Federation in order to affect the econo-mies of these countries. In 2000, the share of Kyrgyz exports to Russia stood at 12.9 % of total exports, with unmanufactured tobacco (5 % of total exports) being the largest export item to the Russian Federation. In 2011, the share of exports to Russia remained almost the same and constituted 14.4 % of total exports. The largest export item to Russia in that year was textile products, which accounted for 2.4 % of total exports. More or less the same picture can be observed for trade between Kyrgyzstan and Kazakhstan. In 2000, exports to Kazakhstan made up 6.6 % of total exports, whereas in 2011, they increased to 14.6 %. In 2011, the main export product to Kazakhstan was electrical energy.24 Furthermore, the amount of FDIs from both the Russian Federation and Kazakhstan to Kyrgyzstan has been moderate.25
Figure 4. Main Export Partners of Kyrgyzstan
0%
10%
20%
30%
40%
50%
60%
70%
80%
90%
100%
2000 2001 2002 2003 2004 2005 2006 2007 2008 2009 2010 2011
Rest of the WorldUnited StatesCanadaFranceAfghanistanUnited Arab EmiratesKazakhstanSwitzerlandChinaRussiaUzbekistanGermany
Source: UN Comtrade database.
Tajikistan’s business cycles also appear to be non-synchronized with either Russian or Ka-zakh business cycles. This is surprising since the economy of Tajikistan, as discussed above, heavily depends on remittances of migrant workers in the Russian Federation, who in turn depend on developments in the Russian economy. As for Tajik exports to Russia, trade vol-ume decreased from 37.4 % in 2000 to 8.1 % in 2011 (Figure 5). Tajik exports to Kazakhstan still constitute a small share of total exports, though there was an increase in the correspond-ing figure from 0.8 % in 2000 to 4.4 % in 2011.
22 According to some estimates, the informal economy may constitute over 40 % of GDP.23 Ignoring the informal trade in Chinese re-exports.24 The underlying rationale behind the increased trade in electricity may not only be due to economic
reasons. As a result, trade in electricity between these two countries may not be influenced solely by economic developments in Kazakhstan.
25 During the given period, FDI flows were substantially affected by the political situation in Kyrgyzstan, as well as the political relationship between the countries.

Business Cycles in Central Asia and the Russian Federation20
Small trade (export) turnover between Kyrgyzstan and Tajikistan with both Russia and Ka-zakhstan partly explain non-synchronisation between business cycles in these countries.
Figure 5. Main Export Partners of Tajikistan
0%
10%
20%
30%
40%
50%
60%
70%
80%
90%
100%
2000 2001 2002 2003 2004 2005 2006 2007 2008 2009 2010 2011
Rest of the WorldKoreaAfghanistanChinaIranLatviaTurkeySwitzerlandUzbekistanNetherlandsRussia
Source: UN Comtrade database.
There is quite a strong synchronization between Russian and Kazakh BCs. The list of po-tential factors behind the observed synchronisation may include, but is not limited to: (i) geographical location of the countries, and hence large (cross-border) trade (Figures 6 and 7); (ii) long-standing interdependencies of production facilities in the countries; and (iii) relatively large FDI flows between countries.
Finally, let us turn to the examination of other external factors that could have affected economic fluctuations in our sample countries. In particular, whether or not fluctuations of global prices of the countries’ main export commodities affect the cyclicality of their economies. The main export items considered are: for Kyrgyzstan, gold; for Tajikistan, aluminum; and oil for the Russian Federation and Kazakhstan. Table 7 reports the cor-relation results. One can observe that with the exception of Tajikistan, there is a strong positive correlation between main export commodity price fluctuations and business cycles in Kyrgyzstan, Kazakhstan and Russia. For the latter two countries, the correlation is contemporaneous.
Table 7. Correlation of Global Price Fluctuations of Main Export Commodities with Business Cycles
Business Cycles in Gold Oil AluminumKyrgyzstan 0.5
Gold prices lead the cycle by 4 periods
- -
Kazakhstan - 0.3Coincidental with the
cycle
-

215. Synchronization of Central Asian Business Cycles
Business Cycles in Gold Oil AluminumTajikistan - - -0.5
Aluminum prices lag the cycle by 2 periods
Russia - 0.7Coincidental with the
cycle
-
Figure 6. Main Export Partners of Kazakhstan26
0%
10%
20%
30%
40%
50%
60%
70%
80%
90%
100%
2000 2001 2002 2003 2004 2005 2006 2007 2008 2009 2010
Rest of the WorldNetherlandsFranceSwitzerlandGermanyChinaItalyBritish Virgin IslandsBermudaRussia
Source: UN Comtrade database.
Figure 7. Main Import Partners of Kazakhstan
0%
10%
20%
30%
40%
50%
60%
70%
80%
90%
100%
2000 2001 2002 2003 2004 2005 2006 2007 2008 2009 2010
Rest of the WorldUkraineChinaItalyUnited KingdomUnited StatesGermanyRussia
Source: UN Comtrade database.
26 Trade with Bermuda and the British Virgin Islands represented offshore operations in oil and oil products.

Business Cycles in Central Asia and the Russian Federation22
6. Conclusions and Policy implications
This paper examined BC features of three CA countries, Kyrgyzstan, Kazakhstan and Tajik-istan, and the Russian Federation from first quarter of 2000 through fourth quarter of 2011. The findings can be summarized as follows:• Unlike in the Russian Federation, the duration of BC in the CA countries is shorter
compared to that of developed countries.• All four countries show significant real exchange rate persistence, which is similar to
industrialised countries’ BC properties of real exchange rate.• Volatility of output in all four countries is significantly higher than in developed countries.• Household consumption is more volatile than output in Kyrgyzstan and the Russian
Federation, and it is less volatile than output in Kazakhstan.• Household consumption is procyclical in the Russian Federation, Kyrgyzstan and
Kazakhstan.• Government expenditures are procyclical in Kyrgyzstan, Tajikistan and the Russian
Federation, and it is acyclical in Kazakhstan. It is widely argued that for a fiscal policy to have a stabilising effect it should be countercyclical. Procyclical government expenditure can exacerbate BC fluctuations. Therefore, the governments in Kyrgyzstan and Tajikistan should address their revenue administration policies so as not to reinforce business cycle fluctuations.
• Based on the examination of cross-correlations and results of Granger causality tests, one can conclude that monetary shocks do matter for business cycle fluctuations in Kyrgyzstan and Tajikistan.
• Based on the examination of cyclical properties of prices, it is plausible to conclude that business cycles in Kyrgyzstan and the Russian Federation are driven by demand shocks, and in Tajikistan by supply shocks. There is no clear picture for Kazakhstan since prices are found to be acyclical.
• Migrant remittances are found to be strongly procyclical in Tajikistan, and, surprisingly, countercyclical in Kyrgyzstan.
• Despite the Russian Federation and Kazakhstan being the main economic partners of the Kyrgyz Republic, there is no synchronisation between Kyrgyz BCs with either Russian or Kazakh business cycles.
• Tajikistan’s business cycles also appear to be non-synchronised with Russian and Kazakh BCs. This is surprising since the economy of Tajikistan heavily depends on remittances of its migrant workers in the Russian Federation.
• There is synchronisation between Russian and Kazakh BCs. This is indicative of increasing integration of economies of these countries.
• With the exception of Tajikistan, there is a strong positive correlation between price fluctuations of main export commodities of the countries and their BCs. In Kyrgyzstan, aggregate fluctuations are positively correlated with changes in global gold prices, whereas in Kazakhstan and the Russian Federation their BCs are positively correlated with changes in global prices for oil.

References 23
References
Pierre-Richard Agénor, C. John McDermott, and Eswar S. Prasad. “Macroeconomic Fluctuations in Developing Countries: Some Stylised Facts.” World Bank Economic Review 14 no. 2, 2000:251-285.
Mark Aguar and Gita Gopinath. “Emerging Market Business Cycles: The Cycle is the Trend.” Journal of Political Economy 115 no. 1, 2007: 69–102.
David K. Backus and P.J. Kehoe. “International Evidence on the Historical Properties of Business Cycles.” American Economic Review 82, 1992: 864-888
David K. Backus, P.J. Kehoe and Finn E. Kydland. “International Business Cycles: Theory and Evi-dence” in Frontiers of Business Cycle Analysis, ed. Thomas F. Cooley, Princeton: Princeton University Press, 1995.
Marianne Baxter and Robert G. King. «Measuring Business Cycles: Approximate Band-Pass Filters for Economic Time Series,» Review of Economics and Statistics 81 no. 4, 1999: 575-593.
Péter Benczúr, Emin Muradov and Attila Rátfai “Cyclical Fluctuations in CIS Economies.” Journal of Business Cycle Measurement and Analysis 3 no. 1, 2007: 121-135.
Timothy F. Cogley and James M. Nason. “Effects of the Hodrick-Prescott Filter on Trend and Differ-ence Stationary Time Series: Implications for Business Cycle Research.” Journal of Economic Dynam-ics and Control 19 no. 1-2, 1995: 253-278.
Robert G. King and Sergio T. Rebelo. “Low Frequency Filtering and Real Business Cycles.” Journal of Economic Dynamics and Control 17 no. 1-2, 1993: 207-231.
Finn E. Kydland and Edward C. Prescott. “Business Cycle: Real Facts and a Monetary Myth.” Federal Reserve Bank of Minneapolis Quarterly Review 14 no. 2, 1990: 3–18.
Norman V. Loayza, Romain Rancière, Luis Servén, and Jaume Ventura. “Macroeconomic Volatility and Welfare in Developing Countries: An Introduction.” The World Bank Economic Review 21 no. 3, 2007: 343–357.
Rachel Male. “Developing Country Business Cycles: Revisiting the Stylized Facts.” School of Econom-ics and Finance Working Paper 663, London: Queen Mary, University of London, 2010.
Pablo Andrés Neumeyer and Fabrizio Perri. “Business Cycles in Emerging Economies: The Role of Interest Rates.” Journal of Monetary Economics 52, 2005: 345-380.
John Rand and Finn Tarp. “Business Cycles in Developing Countries: Are They Different?” World Development 30 no. 12, 2002: 2071-2088.
Business Cycles in Central Asia and the Russian Federation24An
nexe
s
Tabl
e A1
. Pr
oper
ties o
f bus
ines
s cyc
les i
n O
ECD
econ
omie
s
Coun
try
Stan
dard
De
viati
on(%
)Ra
tio S
tand
ard
Devi
ation
to th
at o
f yAu
toco
rr. y
Cor
rela
tion
with
Out
put
ynx
cx
gn
zy
cx
gnx
nz
Aust
ralia
1.5
1.2
0.7
2.8
1.3
0.3
1.0
0.6
0.4
0.7
0.2
00.
11.
0
Aust
ria1.
31.
21.
12.
90.
41.
20.
80.
60.
70.
8-0
.2-0
.50.
60.
7
Cana
da1.
50.
80.
92.
80.
80.
90.
70.
80.
80.
5-0
.2-0
.30.
70.
8
Fran
ce0.
90.
81.
03.
00.
70.
60.
80.
80.
60.
80.
3-0
.30.
81.
0
Germ
any
1.5
0.8
0.9
2.9
0.8
0.6
080.
70.
70.
80.
3-0
.10.
60.
9
Italy
1.7
1.3
0.8
20.
40.
40.
90.
90.
80.
90
-0.7
01.
0
Japa
n1.
40.
91.
12.
40.
80.
40.
90.
80.
80.
90
-0.2
0.6
1.0
Switz
erla
nd1.
91.
30.
72.
30.
50.
70.
70.
90.
80.
80.
3-0
.70.
80.
9
UK
1.6
1.2
1.2
2.3
0.7
0.7
0.9
0.6
0.7
0.6
0.1
-0.2
0.5
0.9
US
1.9
0.5
0.8
3.3
0.8
0.6
0.7
0.9
0.8
0.9
0.1
-0.4
0.9
1.0
Euro
pe1.
00.
50.
82.
10.
50.
91.
00.
80.
80.
90.
1-0
.30.
30.
9
Sour
ce: B
acku
s, K
ehoe
and
Kyd
land
(199
5, p
. 334
; Tab
le 1
1.1)
Not
es: y
: rea
l out
put;
c: re
al c
onsu
mpt
ion;
x: r
eal f
ixed
inve
stm
ent;
g: re
al g
over
nmen
t pur
chas
es; n
x: ra
tio o
f ne
t exp
orts
to o
utpu
t, bo
th a
t cur
rent
pric
es; n
: civ
ilian
em
ploy
men
t; z:
Sol
ow re
sidua
l. Ex
cept
for t
he ra
tio o
f net
exp
orts
to o
utpu
t, st
atist
ics r
efer
to lo
garit
hms o
f var
iabl
es. D
ata
are
quar
terly
from
the
OEC
D’s Q
uart
erly
Nat
iona
l Ac
coun
ts, e
xcep
t em
ploy
men
t whi
ch is
from
the
OEC
D’s M
ain
Econ
omic
Indi
cato
rs. T
he sa
mpl
e pe
riod
is 19
70:1
to 1
990:
2

254. Quantitative Assessment of the Impact of the Customs Union on Trade in Central Asia
Tabl
e A2
. Vo
latil
ity (m
easu
red
as p
erce
ntag
e st
anda
rd d
evia
tion)
Regi
onCo
untr
yO
utpu
tCP
IBM
GEX
EXP
IMP
RPC
RGFC
FN
EER
REER
US
2.9
1.3
1.6
3.2
7.2
6.1
1.5
5.2
4.9
4.5
UK
2.6
2.0
8.4
…5.
46.
11.
94.
54.
45.
1Ja
pan
3.7
1.8
1.7
…7.
211
.81.
63.
97.
37.
5N
orth
Af
rica
Isra
el4.
326
.249
.989
.46.
510
.620
.219
.919
.97.
2Jo
rdan
8.
23.
73.
316
.316
.311
.813
.319
.73.
33.
2M
oroc
co
2.9
1.7
2.5
6.8
14.7
10.5
5.3
16.3
2.5
1.9
Tuni
sia
3.5
0.7
3.0
13.8
13.9
10.3
2.4
9.0
3.4
…La
tin
Amer
ica
Arge
ntina
9.6
56.6
42.2
8.3
12.5
22.9
6.0
14.5
……
Barb
ados
4.
33.
53.
37.
116
.58.
99.
3…
……
Braz
il3.
359
.656
.861
.110
.413
.16.
48.
4…
…Ch
ile
8.3
7.1
5.8
94.1
17.2
17.3
7.7
23.6
6.5
2.1
Colo
mbi
a3.
14.
84.
06.
711
.013
.12.
314
.66.
86.
8M
exic
o 3.
637
.111
.414
.511
.416
.55.
98.
1…
…Pe
ru8.
579
.142
.634
.413
.219
.9…
12.7
……
Trin
idad
5.
92.
43.
9…
18.7
17.9
19.0
36.8
7.0
6.9
Uru
guay
5.
447
.841
.320
.316
.217
.513
.919
.114
.09.
2As
iaBa
ngla
desh
4.
41.
53.
6…
10.8
13.9
2.5
2.8
……
Hong
Kon
g3.
81.
92.
49.
47.
07.
92.
57.
43.
94.
0In
dia
2.6
3.9
5.8
8.5
7.5
11.4
4.7
……
…Ko
rea,
Sou
th
5.1
3.4
6.9
12.2
9.4
13.7
3.7
9.7
……
Mal
aysia
6.
72.
13.
210
.110
.411
.67.
623
.25.
25.
2Pa
kist
an4.
23.
23.
613
.213
.512
.2…
11.7
4.3
4.3
Phili
ppin
es
18.0
7.1
3.9
11.2
11.5
11.6
8.0
12.3
6.9
6.1
Turk
ey
4.0
38.8
9.6
33.3
12.3
14.1
4.6
9.6
……
Business Cycles in Central Asia and the Russian Federation26Re
gion
Coun
try
Out
put
CPI
BMGE
XEX
PIM
PRP
CRG
FCF
NEE
RRE
EREa
st E
urop
eHu
ngar
y4.
72.
64.
57.
97.
17.
32.
63.
24.
53.
9Li
thua
nia
14.5
23.3
107.
510
.611
.65.
711
.3…
…M
aced
onia
6.
715
.113
.4…
8.4
11.2
……
34.2
8.9
Rom
ania
8.
319
.111
.624
.715
.013
.96.
68.
6…
12.5
Slov
ak R
epub
lic
2.7
2.1
2.5
6.3
10.8
9.7
2.4
10.7
4.7
3.5
Slov
enia
2.4
4.1
7.6
3.6
9.9
8.9
1.5
4.3
……
Sour
ce: M
ale
(201
0, p
. 14;
Tabl
e 4(
a))
Tabl
e A3
. Re
lativ
e vo
latil
ity
Regi
onCo
untr
yCP
IBM
GEX
EXP
IMP
RPC
RGFC
FN
EER
REER
US
0.5
0.6
1.1
2.4
2.1
0.5
1.8
1.7
1.5
UK
0.8
3.3
…2.
12.
40.
71.
81.
72.
0Ja
pan
0.5
0.5
…1.
93.
20.
41.
12.
02.
0N
orth
Af
rica
Isra
el6.
111
.520
.71.
52.
44.
74.
64.
61.
7Jo
rdan
0.
50.
42.
02.
01.
51.
62.
40.
40.
4M
oroc
co
0.6
0.9
2.4
5.1
3.7
1.8
5.7
0.9
0.7
Tuni
sia
0.2
0.9
3.9
3.9
2.9
0.7
2.5
1.0
…La
tin
Amer
ica
Arge
ntina
5.9
4.4
0.9
1.3
2.4
0.6
1.5
……
Barb
ados
0.
80.
81.
73.
82.
12.
2…
……
Braz
il 18
17.1
18.4
3.1
4.0
1.9
2.5
……
Chile
0.
90.
711
.32.
12.
10.
92.
80.
80.
3Co
lom
bia
1.6
1.3
2.2
3.6
4.3
0.7
4.7
2.2
2.2
Mex
ico
10.3
3.2
4.0
3.2
4.6
1.6
2.3
……
Peru
9.
35.
04.
01.
62.
3…
1.5
……
Trin
idad
0.
40.
7…
3.2
3.0
3.2
6.3
1.2
1.2
Uru
guay
8.
87.
63.
73.
03.
22.
63.
52.
61.
7

274. Quantitative Assessment of the Impact of the Customs Union on Trade in Central Asia
Regi
onCo
untr
yCP
IBM
GEX
EXP
IMP
RPC
RGFC
FN
EER
REER
Asia
Bang
lade
sh0.
40.
8…
2.5
3.2
0.6
0.7
……
Hong
Kon
g 0.
50.
62.
51.
92.
10.
72.
01.
01.
1In
dia
1.5
2.2
3.3
2.9
4.4
1.8
……
…Ko
rea,
Sou
th
0.7
1.3
2.4
1.8
2.7
0.7
1.9
……
Mal
aysia
0.
30.
51.
51.
51.
71.
13.
50.
80.
8Pa
kist
an
0.8
0.9
3.2
3.2
2.9
…2.
81.
01.
0Ph
ilipp
ines
0.
40.
20.
60.
60.
70.
40.
70.
40.
3Tu
rkey
9.
72.
48.
33.
13.
51.
12.
4…
…Ea
st E
urop
eHu
ngar
y 0.
61.
01.
71.
51.
60.
60.
71.
00.
8Li
thua
nia
1.6
0.7
0.5
0.7
0.8
0.4
0.8
……
Mac
edon
ia
2.2
2.0
…1.
31.
7…
…5.
11.
3Ro
man
ia
2.3
1.4
3.0
1.8
1.7
0.8
1.0
…1.
5Sl
ovak
Re
publ
ic
0.8
0.9
2.3
4.0
3.6
0.9
3.9
1.7
1.3
Slov
enia
1.7
3.2
1.5
4.1
3.7
0.6
1.8
……
Sour
ce: M
ale
(201
0, p
. 16;
Tabl
e 5
(a))
Not
es: O
utpu
t: re
al m
anuf
actu
ring
or in
dust
rial p
rodu
ctio
n; C
PI: c
onsu
mer
pric
e in
dex;
BM
: bro
ad m
oney
; GEX
: rea
l gov
ernm
ent
expe
nditu
re; E
XP: r
eal e
xpor
ts o
f goo
ds a
nd se
rvic
es; I
MP:
real
impo
rts o
f goo
ds a
nd se
rvic
es; R
PC: r
eal p
rivat
e co
nsum
ptio
n; R
GFCF
: rea
l gr
oss f
ixed
cap
ital f
orm
atio
n (in
vest
men
t); N
EER:
nom
inal
effe
ctiv
e ex
chan
ge ra
te; R
EER:
real
effe
ctiv
e ex
chan
ge ra
te.

Business Cycles in Central Asia and the Russian Federation28Ta
ble
A4.
Gra
nger
cau
salit
y be
twee
n m
oney
supp
ly c
ycle
and
real
GDP
cyc
le
Coun
try
Gran
ger c
ausa
lity
of c
yclic
al p
art
of M
1 on
cyc
lical
par
t of r
eal
GDP
Gran
ger c
ausa
lity
of c
yclic
al p
art
of M
2 on
cyc
lical
par
t of r
eal
GDP
Gran
ger c
ausa
lity
of c
yclic
al p
art
of re
al G
DP o
n cy
clic
al p
art o
f M
1
Gran
ger c
ausa
lity
of c
yclic
al p
art
of re
al G
DP o
n cy
clic
al p
art o
f M
2La
g 2
Lag
4La
g 6
Lag
2La
g 4
Lag
6La
g 2
Lag
4La
g 6
Lag
2La
g 4
Lag
6Ky
rgyz
stan
Does
not
Gr
ange
r Ca
use
Gran
ge
Caus
eGr
ange
Ca
use
Does
not
Gr
ange
r Ca
use
Gran
ge
Caus
eGr
ange
Ca
use
Gran
ge
Caus
eDo
es n
ot
Gran
ger
Caus
e
Does
not
Gr
ange
r Ca
use
Gran
ge
Caus
eDo
es n
ot
Gran
ger
Caus
e
Does
not
Gr
ange
r Ca
use
Kaza
khst
anDo
es n
ot
Gran
ger
Caus
e
Does
not
Gr
ange
r Ca
use
Does
not
Gr
ange
r Ca
use
Does
not
Gr
ange
r Ca
use
Does
not
Gr
ange
r Ca
use
Does
not
Gr
ange
r Ca
use
Does
not
Gr
ange
r Ca
use
Does
not
Gr
ange
r Ca
use
Does
not
Gr
ange
r Ca
use
Does
not
Gr
ange
r Ca
use
Does
not
Gr
ange
r Ca
use
Does
not
Gr
ange
r Ca
use
Tajik
istan
--
-Gr
ange
Ca
use
Does
not
Gr
ange
r Ca
use
Does
not
Gr
ange
r Ca
use
--
-Do
es n
ot
Gran
ger
Caus
e
Does
not
Gr
ange
r Ca
use
Does
not
Gr
ange
r Ca
use
Russ
ia-
--
Does
not
Gr
ange
r Ca
use
Does
not
Gr
ange
r Ca
use
Does
not
Gr
ange
r Ca
use
--
-Gr
ange
Ca
use
Gran
ge
Caus
eGr
ange
Ca
use
Not
es: “
-”: u
nava
ilabl
e da
ta.

Produced by UCA Communications DepartmentCopy edited by Sia Nowrojee
Printed by VRS, Bishkek, Kyrgyz Republic

www.ucentralasia.org