Business Case and Intervention Summary Title: Green Africa ... · enter a policy dialogue with host...
88
1 Business Case and Intervention Summary Title: Green Africa Power (GAP), a new facility of the Private Infrastructure Development Group (PIDG) to mobilise investment in renewable energy in Africa EDRM No: 3751459 OCTOBER 2012
Transcript of Business Case and Intervention Summary Title: Green Africa ... · enter a policy dialogue with host...

1
Business Case and Intervention Summary Title: Green Africa Power (GAP), a new facility of the Private Infrastructure Development Group (PIDG) to mobilise investment in renewable energy in Africa EDRM No: 3751459
OCTOBER 2012

2
Business Case and Intervention Summary Title: Green Africa Power (GAP), a new facility of the Private Infrastructure Development Group (PIDG) to mobilise investment in renewable energy in Africa
Intervention Summary
What support will the UK provide? The UK will provide £98m to capitalise Green Africa Power (GAP), a new company to be established under the Private Infrastructure Development Group (PIDG) Trust. DFID’s Private Sector Department (PSD) will provide £50m of Capital Departmental Expenditure Limit (CDEL) and £3m of Resource Departmental Expenditure Limit (RDEL), DFID’s Climate and Environment Department (CED) will provide £20m CDEL and Department of Energy and Climate Change (DECC) will provide £25m CDEL. The latter two are from the International Climate Fund (ICF). GAP will invest in renewable energy (RE) projects in Africa, by providing capital (quasi-equity) and lines of credit to cover specific risks, to demonstrate the viability of renewable energy in Africa. It will enter a policy dialogue with host Governments to help move the country towards cost-reflective tariffs.
Why is UK support required? Sub-Saharan Africa is power starved, with a huge energy deficit and under-investment in the sector is estimated to be ~$48bn per yeari. There is a shortage of all power generation projects in Africa, but particularly of renewables. Market failures which are particularly pronounced and inhibit the growth of renewables in the region are:
1. Lack of cost-reflective tariffs 2. High upfront cost of renewables which makes projects less easy to finance, particularly when
only short-term loans are available from local banks 3. Specific risks e.g. around construction delays and offtaker payments which make some other
potential financiers hesitate to finance. These market failures mean that well-structured projects are also unable to attract financing as at the prevailing tariffs, the returns are not high enough to provide adequate returns to both debt and equity investors in early years. No private sector renewable energy projects managed to get to financial close in Sub- Saharan Africa (SSA) in 2011ii.
What are the expected results? GAP aims to generate the results below: i. 10 Renewable Energy Projects financed in Africa by 2016. ii. 75% of investments made in countries classified by the OECD DAC1 as Low-Income countries
(LICs), or DAC I and II countries, with the remainder in Lower-Middle income countries (DAC III countries).
iii. Commercial Private Sector finance mobilised in a ratio of 1:1.5- 1:2 to GAP investments. iv. Expected increase in installed capacity of renewable energy by ~270 Mega-Watts (MW) by 2018. v. Increased availability/quality of renewable power to approximately 9.2 m people 2014 onwards.
vi. Net carbon emission savings of 3.9 Million-Tonnes of Carbon Dioxide (MtCO2) using the UK’s International Climate Fund’s (ICF) methodology.
vii. Countries encouraged and enabled to move towards cost-reflective tariffs. viii. Demonstration of the commercial and technical feasibility of renewable energy projects in Africa.
1 Organisation for Economic Co-operation and Development’s (OECD) Development Assistance Committee (DAC)
3
List of Abbreviations AfDB: African Development Bank BAU: Business as Usual CCGT: Combined Cycle Gas Turbine CCS: Carbon Capture and Storage CDEL: Capital Departmental Expenditure Limit CDM: Clean Development Mechanism CED: DFID’s Climate and Environment Department CER: Carbon Emission Reduction Certificate CIFs: Climate Investment Funds CfD: Contract for Difference CLoC: Contingent Line of Credit CO2e: Carbon Di-oxide Emissions CP3: Climate Public Private Partnership CSP: Concentrated Solar Power CTF: Clean Technology Fund DAC: Development Assistance Committee of the OECD DECC: UK Department for Energy and Climate Change DFI: Development Finance Institution DFID: UK Department for International Development DSRA: Debt Service Reserve Account EAIF: Emerging Africa Infrastructure Fund, a PIDG Facility EAPM: East African Power Masterplan ERA: Uganda Energy Regulatory Authority EU ETS: European Union Emissions Trading Scheme FiT: Feed-in Tariff GAP: Green Africa Power GDP: Gross Domestic Product GetFiT: GET Feed-in- Tariff, a KfW sponsored program for renewable energy GHG: Green-House Gas GW: Giga-Watt HDV: High Development Value HMG: Her Majesty’s Government HMT: Her Majesty’s Treasury ICF: UK International Climate Fund IFC: International Finance Corporation IPP: Independent Power Producer KfW: Kreditanstalt Für Wiederaufbau (German Development Bank) KwH: Kilo-Watt Hour LCD: Low Carbon Development LIC: Low Income Country LRVC: Long Run Variable Cost LT: Long Term MAR: Multilateral Aid Review MDB: Multilateral Development Bank MDG: Millennium Development Goal MoU: Memorandum of Understanding Mt: Million Tonnes

4
MTR: Mid Term Review MW: Mega-Watt Norad: Norwegian Agency for Development Cooperation NOx: Nitrogen Monoxide NPV: Net Present Value ODA: Overseas Development Assistance OECD: Organisation for Economic Co-operation and Development QEL: Quasi- Equity Loan PIDG: Private Infrastructure Development Group PMU: Programme Management Unit PN: Promissory Note PPA: Power Purchase Agreement PSD: DFID’s Private Sector Department PV: Photovoltaic Solar power RDEL: Resource Departmental Expenditure Limit RE: Renewable Energy REEEP: Renewable Energy and Energy Efficiency Program RMS: Result Monitoring Sheet SCF: Strategic Climate Fund SOx: Sulphur Monoxide SR: Spending Review SREP: Scaling-up Renewable Energy Programme ST: Short Term TA: Technical Assistance TAF: Technical Assistance Facility, a PIDG Facility TF: Trust Fund TOR: Terms of Reference VERs: Voluntary Emission Reduction Certificates VfM: Value for Money WB: World Bank
5
Contents Intervention Summary ............................................................................................ 2
What support will the UK provide? ...................................................................... 2 Why is UK support required? .............................................................................. 2 What are the expected results? .......................................................................... 2 List of Abbreviations............................................................................................ 3
Strategic Case ........................................................................................................ 6 A. Context and need for a UK intervention .......................................................... 6 B. Impact and Outcome that we expect to achieve ........................................... 15 Appraisal Case ................................................................................................. 18 A. What are the feasible options that address the need set out in the Strategic case? ................................................................................................. 18 B. Assessing the strength of the evidence base for each feasible option .... 31 What are the costs and benefits of each feasible option? ................................. 34 C. What measures can be used to assess Value for Money for the intervention? ..................................................................................................... 39 D. Summary Value for Money Statement for the preferred option ................ 39
Commercial Case ................................................................................................. 41 A. Why is the proposed funding mechanism/form of arrangement the right one for this intervention, with this development partner? ......................................... 41 B. Value for money through procurement ......................................................... 44 E. What is the intended Procurement Process to support contract award? ..... 44
Financial Case ...................................................................................................... 45 A. What are the costs, how are they profiled and how will you ensure accurate forecasting? ...................................................................................................... 45 B. How will it be funded: capital/programme/admin? ........................................ 46 C. How will funds be paid out? .......................................................................... 47 D. What is the assessment of financial risk and fraud?..................................... 48 E. How will expenditure be monitored, reported, and accounted for? ............... 48
Management Case ............................................................................................... 49 A. Oversight ...................................................................................................... 49 B. What are the Management Arrangements for implementing the intervention? .......................................................................................................................... 50 C. What are the risks and how these will be managed? ................................... 50 D. What conditions apply (for financial aid only)? ............................................. 54 E. How will progress and results be monitored, measured and evaluated? ...... 54 Annex 1: The likely impact on climate change and environment for each feasible option ................................................................................................................ 63 Annex II: Detailed Economic appraisal of GAP’s quantifiable benefits ............. 66 Appendix I: Impact of more reliable/ increased supply of Electricity on Economic Growth & Poverty .............................................................................................. 73 Appendix II: PIDG Contestability Mechanism ................................................... 76 Annex 3: Evidence underpinning the intervention: ............................................ 79 Appendix III: PIDG Project Results Monitoring Sheet ....................................... 81 Appendix IV: Overview of the PIDG .................................................................. 83

6
Strategic Case
A. Context and need for a UK intervention
The need for energy in Sub-Saharan Africa 1. Sub-Saharan Africa is the world’s most power-starved region. Estimates suggest that 110 million African
households – about 589 million people – do not have access to the electricity gridiii.
2. At 68 Giga-Watts (GW) in 2010, the entire generation capacity of the 48 countries of sub-Saharan Africa was no more than that of Spain. Without South Africa, the total falls to a mere 28 GW, equivalent to the installed capacity of Argentina. As much as 25% of this 28 GW is not currently available for generation due to ageing plants and lack of maintenance.
3. Lack of energy holds back private sector growth and human development. It reduces the productivity of businesses, makes it difficult for children to study and affects safety and security, especially for women and children. Health clinics work without fridges, power and light, reducing their efficiency.
4. Energy generation capacity in Africa has grown at an annual rate of less than 3% since 1980 whilst demand has been increasing at 5%. This is accompanied by low rates of electrification, with less than 25-30% of households in Sub-Saharan Africa having access to electricityiv. Per capita consumption excluding South Africa averages just 124 Kilo-Watt hours (KWh) annually, 1% of the annual average per capita consumption in high-income countriesv, and is falling as population growth outstrips generation capacity. Thus higher power generation capacity is needed even to maintain current levels of consumption, and to supply new grid connections providing more energy access.
5. The unreliability of power supply is also a major issue. Businesses experience power outages on average of 56 days per year and are forced to maintain expensive back-up diesel generation capacity, which can cost up to 40c per KWhvi. This results in significant losses equivalent to 6-16% of turnovervii, or overall productivity losses of up to 4% of a country’s Gross Domestic Product (GDP)viii. Overall, poor power infrastructure is estimated to reduce growth rates by about 2.1% per year in Africa ix. Further analysis on the development and poverty reducing impact of increased or more reliable energy supply is provided in Appendix I.
The Case for Renewable Energy 6. The poorest countries and people are already suffering from climate change. Africa is highly vulnerable
to climate change and the cost of coping with the consequences of climate change (‘adaptation’) could be as high as 5 to 10% of GDPx. While Africa accounts for less than 4% of the world’s total greenhouse gas emissions (GHGs)xi, it is entering a period of rapid economic and population growth. These will create demand for new energy infrastructure.
7. There is a risk that to respond to this demand, Africa installs primarily new fossil fuel generation capacity. Most fossil fuel power plants have lives of 40 years or more. This means that African countries will continue to generate energy from high carbon fossil fuels for several decades to power their growth, thus getting on a ‘High-carbon growth path’ and being trapped in a long-term (LT) ‘carbon lock-in’. Several analysts warn of peaks in global oil and coal production before and up to 2030xii. Long term dependence on fossil fuels, with increasingly volatile prices and worsening availability exposes countries to future energy insecurity and fiscal vulnerability.
8. Diversifying energy supplies from fossil fuels to renewable energy can reduce such vulnerability and secure energy suppliesxiii. It also reduces geopolitical security risks by reducing dependence on fossil fuel suppliersxiv.
9. Africa has a comparative advantage in renewables with vast untapped renewable energy potential, ranging from hydropower, to solar, wind, geothermal and biomass. These are ‘low carbon’ sources of energy as their use does not produce harmful GHG emissions. Thus, by using these resources to

7
generate energy, there is an opportunity to place Africa on a low carbon growth path.
Underinvestment in Power Generation 10. The World Economic Forum identified a lack of investment in infrastructure as a key constraint to
growth in SSAxv. The Africa Infrastructure Country Diagnostic estimated that there is a need for investment in infrastructure of $93 billion per year in Africa, with about half of this needed for power generation. This gap represents 15% of Africa’s GDP and more than 20% of GDP for most low income countries. Africa is estimated to have a funding gap of $29bn for power infrastructure alone, the difference between the estimated needs of $40.6bn and the current annual investments of $11.6bn for Africa excluding Egyptxvi, $6bn of which could be met by efficiency gains still leaving an investment need of $23bn.
11. The public sector is currently underinvesting in infrastructure due to fiscal constraints and the long term nature of infrastructure. Due to the relatively short-term political cycles, Governments often prefer to spend public money on investments that yield a quicker return than infrastructure, which has high upfront costs but takes several years to build and deliver results. Regular maintenance is essential to ensure the long term impact is realised. However, a short term focus often leads to maintenance budgets being cut, thereby reducing the operational lifetime of infrastructure and reducing the lifetime return.
12. Fiscal constraints means that even well designed public investment is not sufficient to fill the infrastructure gapxvii. About half of capital financing currently comes from the domestic public sector, a quarter is from non OECD financiers and a quarter comes from OECD and private sector. In terms of financing for capital expenditure plus maintenance, the private sector currently contributes only 4% of the total. The scale of the gap is so significant that both private and public finance must be mobilised to achieve the scale of finance requiredxviii.
13. The private sector is under investing because of pervasive market and institutional failures. These include a high cost of finance; difficult regulatory environments; a lack of locally available technical capacity and skills; political uncertainties and high country risk; problems obtaining long term foreign exchange denominated debt; limited availability of local currency finance; high front-end cost; uncertainty attached to project developmentxix; and the lack of cost reflective tariffs. Many of these risks are heightened in the African context.
Underinvestment in Renewable Power Generation 14. Renewable energy faces an even greater challenge because of additional market failures and risks
associated with renewable energy projects. These include higher upfront costs, lack of cost reflective tariffs and broader financing and power purchase frameworks, technologies which are new in the region, construction risks and a low price of carbonxx (see para 18 below). The Private Infrastructure Development Group (PIDG) has identified several projects which have been prevented from reaching financial close, as a result of these market failures.
15. Low carbon energy solutions are frequently the least-cost long term optionxxi. However, they often have high installation costs and take time to build. Often due to politicians’ need to scale up power supply quickly, diesel or heavy fuel fed large generators which can be installed in months, or other fossil fuel fed power plants get built. The per unit cost of production of energy from renewable technologies thus often remains higher than that of conventional thermal or large hydro power which, which most Governments associate with on-grid energy.
16. Lack of cost-reflective tariffs: Commercial renewable energy projects are not being developed largely due to the lack of cost-reflective tariffs, meaning a tariff which enables the developer to recover its costs (including meeting debt service) and achieve a reasonable profit. Increasing consumer tariffs abruptly when a private or Independent Power Producer (IPP) joins the Grid is highly politically sensitive and relatively few Governments are willing to do this, with many maintaining retail and also wholesale tariffs at low levels. This means that the Utility Company which buys the power from power plants and supplies it to the distributors and the consumers, “the offtaker”, cannot pay power plants (at least at the outset) commercial tariffs. This keeps wholesale tariffs at levels which cannot deliver a commercial

8
return to private investorsxxii. This is documented more fully in the Economic appraisal in Annex II. Table 19 compares the tariffs in several African countries with the Long Run Variable Costs (LRVC) of generation and finds that often, tariffs are as low as 50% of LRVC. This implies that tariffs are inadequate to sustain long-term financing of renewable energy projects.
17. Carbon market failures: Fossil fuels which are high carbon generate GHG emissions which are responsible for climate change and global warming, cause air pollution and health damage and are harmful for the environment, particularly when the fuels involve deforestationxxiii.These social costs are not taken into account in the financial cost of fossil fuels or energy produced using them. The United Nations Clean Development Mechanism (CDM) aims to go some way to address this market failure. It is an initiative set up under the Kyoto Protocol in 2007 when developed and developing nations met to discuss cutting carbon emissions. Under the Kyoto Protocol, signatory developed countries which are responsible for historical emissions pledged to cap their future carbon emissions. One of the ways they can meet their emission caps is by using the CDM mechanism.
18. Renewable energy generation and other carbon reducing initiatives in developing countries may acquire and sell Carbon Emission Reduction Certificates (CERs) which can be used as part of the emission reduction/ cap calculations of the developed countries. The emission reductions are verified by the CDM, both in terms of amount and to ensure that the emission reductions are additional i.e. those reductions would not be happening anyway. The price paid for each tonne of carbon reduction, (the price of a CER) is not fixed but determined by the supply and demand of CERs, giving rise to a marketplace, the ‘carbon market’. The theory behind the CDM is to allow developed countries to reduce their emissions wherever it makes most sense because carbon is fungible and not geographically specific. It also aims to promote low carbon development in developing countries. Voluntary Emission Reduction Certificates (VERs) may be sold to companies or organisations that are voluntarily cutting their carbon. The two forms of finance are collectively referred to as “carbon finance” or “carbon markets”xxiv. Carbon finance can thus be a potential way of adding extra revenues to renewable energy projects and thus reducing their overall cost. However, accreditation under CDM is expensive and time- consuming and often prevents projects from applying for CERsxxv. More significantly, carbon prices are currently very lowxxvi, driven by weak targets in developed countries. Thus carbon markets are unlikely to be a substantial source of revenue in the near future.
19. Upfront costs and early stage risks of Greenfield projects: Greenfield, i.e. new, renewable power projects have a high upfront cost and a high risk. Most of the capital costs are incurred at the start while running costs during the life of the project are lower. For the UK, upfront costs have been documented to be highest for offshore wind, followed by onshore wind and coal with carbon capture and storage (CCS). Gas is the cheapest technology followed by Gas+ CCS and Coalxxvii. The risks are highest in early stages of Greenfield projects, when construction is still to be completed and delays or cost over-runs could happen. At this stage the project is not producing any returns, but lenders that provide debt to finance such projects (‘project finance lenders’) require certainty in respect of cash-flow with such being able to meet debt service requirements. The ability to attract long-term debt is critical to allow such projects to be economic. In developing countries, Development Finance Institutions (DFIs) and Multilateral Development Banks (MDBs), and in some cases, commercial banks, are able to provide the required long-term senior debt. DFI’s, MDBs and commercial lenders will always require a robust contractual and regulatory framework to allow a project to be “bankable”. The offtaker under a PPA will need to be creditworthy or have a security structure built around it (whether through a host Government Guarantee, Letter of Credit, escrow account, assignment of receivables of a combination of these instruments) to allow Lenders to again have certainty as to the cash-flow. Commercial lenders will typically also have concerns in respect of political risk in a number of sub-Saharan countries and would require a political risk insurance policy to allow a commitment for long term debt in respect of a projects financing.
20. The rate of return required for equity on a renewable IPP in most parts of sub-saharan Africa, to reflect the risks assumed, would be in the region of 15 to 25%. To allow the overall cost of capital to be lowered it is often the case that subordinated or mezzanine debt is sought which has a prior ranking to available cash-flow than equity but is subordinated to senior lenders. Such subordinated debt is

9
typically made available from the same sources as the senior debt, but would carry a higher rate of interest than the coupon on the senior debt - typically between 12% and 18% per annum, so as to compensate for the higher risk this subordinated debt takes. It is usually not possible to defer such interest payments until the project becomes operational. This means that the amount of cash that is required to pay interest and any principal repayments (‘debt service’) on both senior and subordinated debt in early years of the project is very high. Project finance lenders also require projects to maintain a buffer of cash in a specific bank account to cover upcoming debt service payments (‘debt service cover’).
21. A greenfield project requires careful financial structuring to ensure that the various risks and financial pressures can adequately be assumed by it. As only one cash-flow is available to service debt, being i.e. under the PPA negotiated with the offtaker, the certainty required for this cash-flow has to be high and there is much negotiation of the “waterfall” or the cash-flow allocation between operating costs, debt service and equity. Once construction has been completed and PPA revenues commence, and the offtaker is seen as being capable of meeting the PPA obligations on a timely and regular basis, these infrastructure projects then have more of an attractive profile with a long-term PPA allowing significant cash-flows for a term of between 15 to 30 years. An equity investor in such a project requires patience and, in addition, lenders and other partners around it who are similarly patient and flexible. Infraco Africa, another PIDG facility has been designed to be such a patient investor. Details are provided in Appendix 3.
22. Lack of and constraints of sponsor equity: Due to the risks of doing business in Africa and the more specific risks described below, the large well-capitalised investors shun sub-saharan Africa in particular. There is a shortage of investors willing to commit equity and those investors that do enter (small IPPs) are very constrained with small balance sheets and for risk diversification reasons they can often only take a limited stake in a project. Although certain DFIs provide equity alongside these small IPPs, this is quite limited and there remains a lack of equity or equity-like financing that is available at financial close. The IPPs that do exist expect a quick equity return which is difficult to achieve in the early years of an RE project.
23. Lack of Turnkey contractors: Due to the complicated nature of these projects, there is normally a risk that the project does not start commercial operations by the agreed date and at the budgeted cost. This risk would typically be assumed by one contractor that takes care of all requirements – equipment supply and all required construction works (‘Turnkey contractor’). This structure is certainly the norm in developed country power projects. For renewable projects in Africa, such Turnkey contractors are typically not available and there is often a split approach required whereby there would be an equipment supply contract (with the turbine supplier or solar panel provide say) with a separate contract with a civil works contractor in relation to the construction of the project. Lenders would perceive this to be a construction risk which then continues to be assumed by the borrower (the project company) as the risk has not been laid off fully to a construction contractor. As a result Lenders will need to be satisfied that the perceived risk of an overrun (in time or cost or both) has been quantified, often in a conservative manner, and cash set aside to absorb this risk if it were to arise.
24. Lack of skilled developers and Government officials: There are a number of skills required to develop such a project; a developer needs to be able to pull together the land, consents, equipment supply, civil works, offtake contracts/Power Purchase Agreements (PPAs), mitigate the political and project risks and arrange a debt and equity financing structure. Few developers have all these skills and the experience of working in African countries. Further, host Governments and utility offtakers themselves often lack an understanding of the demands and requirements on IPPs and, in particular, the expectations of project finance lenders. This makes structuring such projects extremely difficult and time consuming.
25. Creditworthiness of offtakers and Political Risk: The creditworthiness of the offtaker in sub-saharan Africa is often considered insufficient by project finance lenders, i.e. lenders do not have the confidence that the offtaker will be able to make the tariff payments on time which are due under a PPA. Several offtakers in African countries are state owned, with limited balance sheets. The lack of liquidity of offtakers is one of the reasons why commercial banks have been unwilling to fund IPPs. State

10
ownership can complicate things further in a situation of heightened political risk. Political risk associated with the potential acts (or omissions) of Government hinder the ability PPA to be properly performed in accordance with its terms and discourage developers and financiers.
26. Lack of clear legal and regulatory frameworks: As most renewable energy technologies are new for African countries, legal and regulatory frameworks that would apply to renewable energy IPPs either do not exist or are outdated and inappropriate. Investors and developers require clarity on regulatory aspects, including pricing, land rights, use of natural resources, tariffs and offtake arrangements, foreign exchange rules, reporting and disclosure etc. In the absence of clearly written and legally binding rules and regulations, investors and developers take a higher risk which discourages investment.
Tackling these challenges 27. Green Africa Power (GAP) is designed to tackle some of these constraints to financing of renewable
energy IPPs in Africa. At the micro (project) level, it aims to alter the cost profile of renewable projects over time by facilitating the ability of a project to attract long term debt, reducing the cost of such debt in the early stages of a project (due to the removal of certain risks from the project) and to mitigate some of the risk associated with construction delays and cost over-runs. At the macro level, it aims to further the pricing, legal and regulatory framework for renewable energy IPPs in the recipient country through a policy dialogue with the host Government.
28. GAP is proposed to be instituted as a Facility of the PIDG (see para 34). UK would provide a grant to the PIDG Trust, which would then use it to provide equity capital to GAP Company. As a multi-donor Trust, PIDG would be able to raise funds from other donors to invest in GAP. A Management company for GAP would be competitively procured by the GAP Board and is likely to be a private sector entity with experience in structuring or investing in renewable energy projects in Africa. This would provide specialist skills required to understand and make investments in conjunction with project finance lenders, project developers and sponsors in Africa.
29. GAP proposes to provide three instruments below to support the development of renewable IPP projects in Africa.
o Quasi- Equity Loan (QEL): a loan advanced to a project company that is structured specifically to meet the requirements of that project. In general the terms of the QEL will be tailored such that they enable a reasonable return for equity invested in the project in the early years of the project with a higher return accruing to GAP in later years. This might be through an interest rate rise, a profit
Box 1: Innovation in Green Africa Power Green Africa Power is a PIDG effort to address the lack of renewable energy projects in Africa. Despite the availability of donor and DFI instruments, few private sector projects have been financed and built. GAP addressed this with two new financial instruments. A similar instrument is offered by the US Overseas Private Investment Corporation (OPIC) but its scope is limited to US investors. The main financial instrument offered by GAP would be a cross between a debt and an equity instrument. In piloting a new instrument in a difficult market, PIDG would be taking a high risk on various fronts, some of which are financial exposure, up-take, donor expectations, financial viability and broader impact. These risks have been elaborated in the Risk Matrix in the Management case. Both the success and failure of the GAP instruments to catalyse the market for renewable energy in Africa would add to the knowledge and evidence on policy tools available to target this market. While success may call for a scale-up of GAP in its current form, failure might call for exploration of new instruments and forms of intervention for GAP or PIDG to deploy. GAP would retain this flexibility to adopt new or additional instruments in response to emerging evidence. The GAP Business Case is built on limited evidence in several areas and the programme will thus make a strong effort to capture knowledge generated via this project. An Evaluation plan and a knowledge component are built into the program for this purpose and are set out in more detail below.

11
share agreement or otherwise. In effect this implies that GAP gets a low rate of return in early years of the project and a higher rate of return in later years once the project is operational and generating revenues. The overall return over the life of the QEL will be close to prevailing market rates. The QEL aims to address the market failures of upfront costs and early stage risks of Greenfield projects (Para 19) and lack of sponsor equity (Para 22).
o Contingent Line of Credit (CLoC): a contingent line of credit to provide additional comfort to project finance lenders that the Project will be built to a date and cost which are certain. Without such certainty senior lenders will impose this risk on equity through callable equity requirements to fund any deficiency, thus increasing the amount of equity commitments required. The CLoC will provide a guarantee that in the case of project delays or cost over-runs, the GAP CLoC can be drawn down (‘called’) to fund the deficiency, subject to the pre-agreed terms of the CLoC. In the event of any call on a CLoC, such would typically rank subordinated to senior debt service but, depending on the requirements of the specific project, may rank ahead of other subordinated or mezzanine debt to the Project (including any QEL also advanced). The repayment profile of a CLoC, if drawn, would be negotiated and reflected in the documentation providing for the CLoC and would be structured following due diligence of the project generally and the risks being assumed (including technical and legal due diligence) and also consequent to a detailed review of the project’s financial model. The CLoC aims to address the specific market failures of lack of Turnkey contractors (Para 23) and lack of sponsor equity (Para 22).
o Policy Dialogue: In any application of a GAP instrument, GAP will enter into a policy dialogue with the host Governments and off-taker to encourage them to move towards cost-reflective tariffs. This policy dialogue is aimed at bringing about broader transformation of the sector to facilitate future projects. It addresses the specific market failures of lack of cost-reflective tariffs (Para 16) and the lack of clear legal and regulatory frameworks (Para 26).
These instruments are further detailed in Para 58a, b and c of Section A of the Appraisal case.

12
Interaction with the Carbon Market & GAP’s fit with the ICF Carbon Market Principles 30. For all projects that GAP finances using ICF funds, it will ensure consistency with ICF Carbon Market
principlesxxviii. The rationale behind such principles is to ensure that ICF projects have a real, net reduction in carbon emissions and do not distort the carbon markets and there is not excessive subsidy by donors or Governments which could occur if CER revenue occurs but has not been taken into account. For the proportion of ICF funds in GAP, the GAP Manager will ensure net carbon emissions by either obtaining a legal commitment from the project company that it will not apply for CERs or by cancelling any CERs generated by the project at the option of the UK.. For the proportion of GAP projects funded by GAP using non-ICF funds, GAP will seek assignment of any CERs produced as security for the advance made. Such CERs may then be sold or cancelled by GAP. In order to manage the ICF and non-ICF funds, GAP managers will determine on a project by project basis whether the project can apply for CERs or CERs are cancelled based on the overall position in GAP so as to ensure the balance. The impact of this is explained in detail in Para 61 of the Appraisal case.
Box 2: Examples of Projects that GAP could potentially finance
13
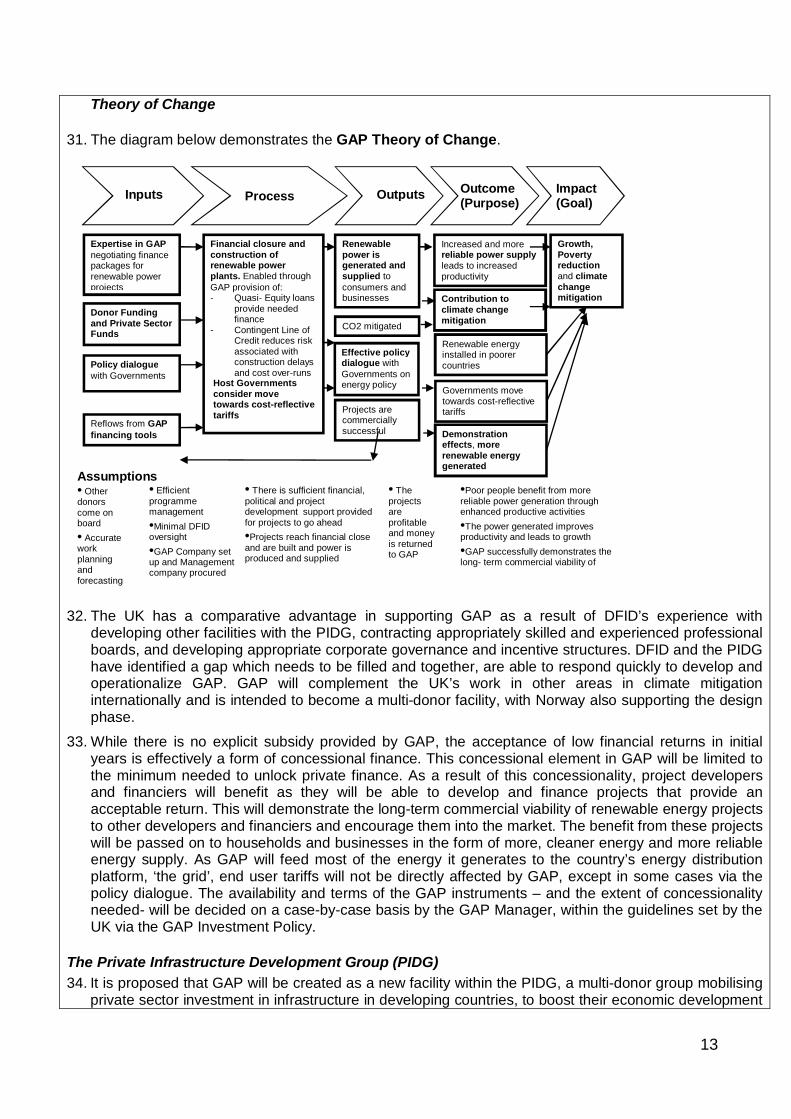
Theory of Change
31. The diagram below demonstrates the GAP Theory of Change.
32. The UK has a comparative advantage in supporting GAP as a result of DFID’s experience with
developing other facilities with the PIDG, contracting appropriately skilled and experienced professional boards, and developing appropriate corporate governance and incentive structures. DFID and the PIDG have identified a gap which needs to be filled and together, are able to respond quickly to develop and operationalize GAP. GAP will complement the UK’s work in other areas in climate mitigation internationally and is intended to become a multi-donor facility, with Norway also supporting the design phase.
33. While there is no explicit subsidy provided by GAP, the acceptance of low financial returns in initial years is effectively a form of concessional finance. This concessional element in GAP will be limited to the minimum needed to unlock private finance. As a result of this concessionality, project developers and financiers will benefit as they will be able to develop and finance projects that provide an acceptable return. This will demonstrate the long-term commercial viability of renewable energy projects to other developers and financiers and encourage them into the market. The benefit from these projects will be passed on to households and businesses in the form of more, cleaner energy and more reliable energy supply. As GAP will feed most of the energy it generates to the country’s energy distribution platform, ‘the grid’, end user tariffs will not be directly affected by GAP, except in some cases via the policy dialogue. The availability and terms of the GAP instruments – and the extent of concessionality needed- will be decided on a case-by-case basis by the GAP Manager, within the guidelines set by the UK via the GAP Investment Policy.
The Private Infrastructure Development Group (PIDG) 34. It is proposed that GAP will be created as a new facility within the PIDG, a multi-donor group mobilising
private sector investment in infrastructure in developing countries, to boost their economic development
Projects are commercially successful
Financial closure and construction of renewable power plants. Enabled through GAP provision of: - Quasi- Equity loans
provide needed finance
- Contingent Line of Credit reduces risk associated with construction delays and cost over-runs
Host Governments consider move towards cost-reflective tariffs
Renewable power is generated and supplied to consumers and businesses
Increased and more reliable power supply leads to increased productivity
Growth, Poverty reduction and climate change mitigation
Donor Funding and Private Sector Funds
Expertise in GAP negotiating finance packages for renewable power projects
Inputs Process Outputs Outcome (Purpose)
Impact (Goal)
Assumptions • The
projects are profitable and money is returned to GAP
•Poor people benefit from more reliable power generation through enhanced productive activities •The power generated improves productivity and leads to growth •GAP successfully demonstrates the long- term commercial viability of renewable energy projects
• Other donors come on board • Accurate work planning and forecasting
• Efficient programme management •Minimal DFID oversight •GAP Company set up and Management company procured
• There is sufficient financial, political and project development support provided for projects to go ahead •Projects reach financial close and are built and power is produced and supplied
Reflows from GAP financing tools Demonstration
effects, more renewable energy generated
Policy dialogue with Governments
Contribution to climate change mitigation
Renewable energy installed in poorer countries
Effective policy dialogue with Governments on energy policy
CO2 mitigated
Governments move towards cost-reflective tariffs
14
and combat poverty. DFID was a founding partner of the PIDG in 2002 and continues to be one of its strongest supporters. The PIDG was assessed in the DFID 2011 Multilateral Aid Review (MAR)xxix as well as the Australian Multilateral Aid Assessmentxxx as offering very good value for money. More detail on this and other aspects of the PIDG and its facilities are provided in the Commercial, Financial and Management cases and Appendix 3.
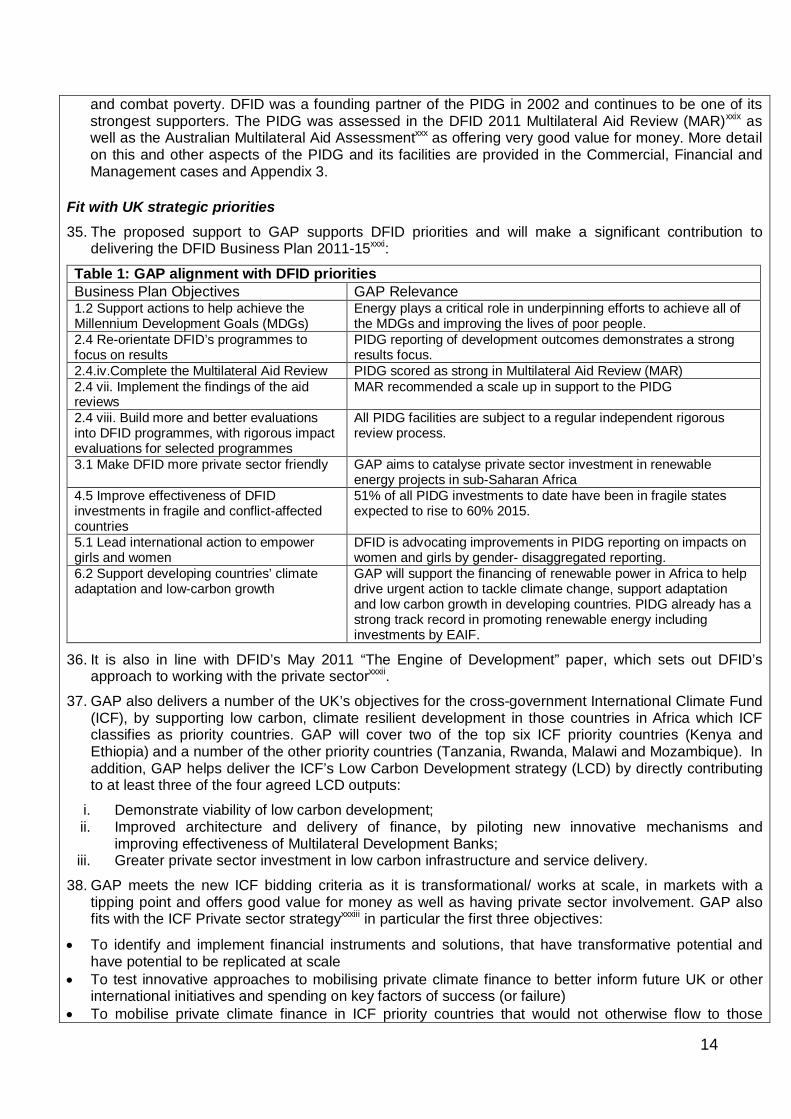
Fit with UK strategic priorities 35. The proposed support to GAP supports DFID priorities and will make a significant contribution to
delivering the DFID Business Plan 2011-15xxxi:
Table 1: GAP alignment with DFID priorities Business Plan Objectives GAP Relevance 1.2 Support actions to help achieve the Millennium Development Goals (MDGs)
Energy plays a critical role in underpinning efforts to achieve all of the MDGs and improving the lives of poor people.
2.4 Re-orientate DFID’s programmes to focus on results
PIDG reporting of development outcomes demonstrates a strong results focus.
2.4.iv.Complete the Multilateral Aid Review PIDG scored as strong in Multilateral Aid Review (MAR) 2.4 vii. Implement the findings of the aid reviews
MAR recommended a scale up in support to the PIDG
2.4 viii. Build more and better evaluations into DFID programmes, with rigorous impact evaluations for selected programmes
All PIDG facilities are subject to a regular independent rigorous review process.
3.1 Make DFID more private sector friendly GAP aims to catalyse private sector investment in renewable energy projects in sub-Saharan Africa
4.5 Improve effectiveness of DFID investments in fragile and conflict-affected countries
51% of all PIDG investments to date have been in fragile states expected to rise to 60% 2015.
5.1 Lead international action to empower girls and women
DFID is advocating improvements in PIDG reporting on impacts on women and girls by gender- disaggregated reporting.
6.2 Support developing countries’ climate adaptation and low-carbon growth
GAP will support the financing of renewable power in Africa to help drive urgent action to tackle climate change, support adaptation and low carbon growth in developing countries. PIDG already has a strong track record in promoting renewable energy including investments by EAIF.
36. It is also in line with DFID’s May 2011 “The Engine of Development” paper, which sets out DFID’s approach to working with the private sectorxxxii.
37. GAP also delivers a number of the UK’s objectives for the cross-government International Climate Fund (ICF), by supporting low carbon, climate resilient development in those countries in Africa which ICF classifies as priority countries. GAP will cover two of the top six ICF priority countries (Kenya and Ethiopia) and a number of the other priority countries (Tanzania, Rwanda, Malawi and Mozambique). In addition, GAP helps deliver the ICF’s Low Carbon Development strategy (LCD) by directly contributing to at least three of the four agreed LCD outputs:
i. Demonstrate viability of low carbon development; ii. Improved architecture and delivery of finance, by piloting new innovative mechanisms and
improving effectiveness of Multilateral Development Banks; iii. Greater private sector investment in low carbon infrastructure and service delivery.
38. GAP meets the new ICF bidding criteria as it is transformational/ works at scale, in markets with a tipping point and offers good value for money as well as having private sector involvement. GAP also fits with the ICF Private sector strategyxxxiii in particular the first three objectives:
To identify and implement financial instruments and solutions, that have transformative potential and have potential to be replicated at scale
To test innovative approaches to mobilising private climate finance to better inform future UK or other international initiatives and spending on key factors of success (or failure)
To mobilise private climate finance in ICF priority countries that would not otherwise flow to those
15
countries, and create a sustainable climate investment market
39. £25m of the support for GAP could potentially count towards the UK’s 2012 Fast Start commitmentxxxiv to help developing countries to adapt to climate change and develop in a low carbon way, including reducing emissions from deforestation.
What would happen without the intervention? 40. In the absence of GAP we would expect the development of fewer renewable projects in sub-Saharan
Africa. We expect that some of the finance that will be co-invested alongside GAP in RE generation would have been invested in fossil fuel power plants. There is little evidence available on the exact path countries would follow to expand their energy supply. Given the vast fossil fuel reserves being discovered in SSA, especially coal and gas, and the small timeframes of installing diesel generators, we would expect that significant coal and gas fired power generation plants would be built and diesel or heavy fuel oil plants installed. The amount of money flowing into these would be less than with GAP therefore we expect some of the energy generation capacity financed by GAP to be additional in that it would not have been built at all without GAP. In the absence of concrete evidence, we have assumed that 50% of the energy generated by GAP will be additional and 50% will replace high- carbon fossil fuel power plants.
41. This would lead to higher carbon emissions, increase the risks of lock-in to carbon intensive energy, leave countries more vulnerable to oil price fluctuations and weaken longer term energy security. It would also lead to less energy generation and lower reliability of supply, resulting in lower competitiveness of African businesses in export markets. Energy use in Africa will expand slower, delaying potential gains for poor people as a result of using more diverse and efficient powered devices.
42. Without a strategy to accelerate private sector financing and project development of power generation, fiscal constraints would impede Africa’s ability to build sufficient reliable capacity. It would also weaken the ability to achieve the global goal of sustainable energy access for all (2012 is the International Year of Sustainable Energy for All). Lower growth and power supply will compromise basic services (such as water and sanitation, health, education); and hamper the achievement of the MDGs. And poor people will continue to miss out on productivity gains, from powered grain milling, devises enhancing small scale manufacturing (such as carpentry, welding), reliable refrigeration, locally accessible new technology etc.
B. Impact and Outcome that we expect to achieve
Impact 43. The overarching impact of GAP is higher, low carbon, climate resilient economic growth for poverty
reduction and human development, as a result of a cleaner, more reliable and diverse energy supply. GAP aims to achieve this through supporting and demonstrating the LT commercial viability of Greenfield RE projects, leading to increased investment in RE in Africa, helping to reduce the risk of countries being locked-in to high carbon growth paths. GAP will help fuel economic growth, improve competitiveness of RE sectors and reduce exposure to fossil fuel markets and associated price shocks.
Outputs 44. GAP is expected to increase availability or improve quality of clean energy supply to 9.2m people2,
through projects financed by 2016 and becoming operational by 2018. About 10 renewable energy projects are expected to benefit from GAP with an installed capacity of approximately 270MW.
2 Assume annual average household demand of 500 KWh/household and 6 persons per household (Africa's Infrastructure: A Time for Transformation, The World Bank, 2010). In line with current practice followed by the majority of 25 DFIs that are members of the DFI Indicator Harmonisation Working Group, the PIDG does not factor in commercial use at present, but this is expected to change next year following the results of an ongoing indicator harmonisation best practice consultancy study.
16
Outcomes 45. GAP will lead to improved energy security resulting from a more diversified energy mix and more
reliable electricity supply. Reliability and energy security will drive economic activity.
46. GAP would help countries adopt cost-reflective tariffs for renewable energy. It projects that it would mobilise ~$270m of private sector investment into renewable energy projects, a ratio of circa 2x of GAP investment in these projects.
47. Improvements in air quality and health from reduced air pollution will also be achieved.
Demonstration Effects 48. Private sector financing of renewables could be bolstered by enhancing the perception in the private
sector that there is a valuable commercial opportunity in the renewable energy sector. In addition to the direct benefits from GAP projects, lessons learnt and demonstration effects of GAP should increase the confidence of the private sector to invest in renewable energy in Africa as well as helping developers to identify the country’s comparative advantage in a particular form of renewable energy. As such, GAP aims to catalyse investment in renewables further than in the direct projects it supports. For example, Infraco Africa, a PIDG facility developed the Cabeolica wind farm in Cape Verde. During the development of the project, Infraco Africa helped the Government of Cape Verde put in place a renewable energy framework and a renewable energy masterplan. The Government also undertook tariff reform, paving the way for future projects to be financed. The success of this project has attracted interest from several other African countries, with officials from Senegal, Ghana and Mozambique having visited Cape Verde to hold discussions with the Government on their experience with implementing the project. Infraco Africa is now helping another African Government develop a similar project.
49. GAP will seek to demonstrate that private investment in RE is profitable in the long term, by demonstrating the risks of projects are not as high as currently perceived by investors and by helping frontier investors in renewable energy in Africa to overcome the costs associated with being the first entrant. It will undertake 75% of its projects in Low Income (DAC I and II) countries, where the sector lags behind the most and a first mover in various RE sectors is needed. The success of such demonstration effect depends on various factors outside PIDG and GAP’s control. Among other variables, this includes no further worsening of political risk and financial markets and presence of supportive and consistent regulatory and legislative frameworks, which GAP will endeavour to encourage via policy dialogue but the success and credibility of which cannot be guaranteed by GAP. The evidence that demonstration effects impact on the decisions on unrelated investors is weakxxxv. The PIDG is thus looking to build the demonstration effect from its operations more systematically. GAP will incorporate an explicit knowledge management component (para 148) to capture and proactively disseminate lessons from its activities. GAP’s expected demonstration effect is further detailed in para 95 of the Appraisal Case.
Affordability 50. Consumers with no or limited access to grid based power face much higher costs, for example, from
paraffin lighting in houses. Businesses use small generators which cost on average four times grid price just to run (ignoring upfront purchase costs)xxxvi. In 2009, only 35% of African households were connected to the grid. Africans without access to electricity spend up to 20% of their income on kerosene every yearxxxvii. GAP will increase the energy available to the grid and from the grid to consumers already connected to it, thus increasing the proportion of affordable grid energy they can get and reducing their expenditure on more expensive energy from diesel generators.
GAP will not make grid connections directly. By increasing the amount of energy available to the grid, it will improve the economics of new grid connections being made and hence complement other initiatives. The World Bank, Regional Development Banks (RDBs) and country Governments themselves are implementing other grid connection programs which will benefit from the increased

17
availability of energy via GAP. GAP will be able to draw on funding from the Viability Gap Funding window under the PIDG Technical Assistance Facility (TAF) to cover the affordability GAP in specific circumstances and link with other PIDG facilities and affiliated programmes such as the Global Partnership for Output-Based Aid (GPOBA) in order to explore complementary programs targeting new connections for the poor. PIDG is considering developing a methodology to monitor the affordability to end-users of the infrastructure services provided by projects it supports.
Outputs/Direct Benefits 51. GAP aims to enable the financing of 10 Greenfield RE projects by 2016. These are likely to be wind
power, geothermal, hydro, solar Photovoltaic (PV) and concentrated solar power (CSP) or biomass projects.
52. GAP aims to finance ~270MW of new renewable energy generation capacity in Africa by 2016. Initial modelling suggests that GAP could avoid over 3.9 million tonnes of net3 CO2 emissionsxxxviii in Africa, or ~200,000 tonnes of CO2 emissions annually. There will also be a direct impact on job creation through the construction and operation of GAP supported projects, along with significant indirect long-term job-creation.
Additionality 53. All PIDG facilities, including GAP, are required to be additional – only providing support to
programmes/projects where the private sector would not be willing to do so. Additionality criteria will be fundamental to GAP’s investment policy. The PIDG Program Management Unit (PMU) began to monitor additionality as a qualitative indicator in 2010.
3 After accounting for the sale of CERs

18
Appraisal Case
A. What are the feasible options that address the need set out in the Strategic case? 54. In this section we present a qualitative analysis of the feasibility of each option considered, and its
ability to deliver on the need set out in the Strategic Case. We then compare these options in a Table 3 at the end to arrive at a preferred option. A full cost benefit analysis of the preferred option is then presented in Section C of the Appraisal Case.
55. Drawing on the analysis laid out in the Strategic Case, GAP aims to address the below three key strategic issues that hold back private sector financing of renewable energy in Africa:
i. Lack of cost reflective tariffs for renewable energy ii. High upfront cost of renewable energy IPPs, and high perceived risks which makes them
difficult to finance in early years iii. Risks associated with construction delays and cost over-runs, and the lack of turnkey
contractors in Africa who would typically assume such risks. 56. A range of options were considered and the below 5 were found to be potentially feasible, as they may
have the ability to provide financing as well as build a demonstration effect on the viability of renewable energy finance. These are:
i. Do Nothing- Business as Usual ii. Contribute to setting up Green Africa Power as a PIDG facility iii. Increase funding to Multilateral Development Banks (MDBs) iv. Support a Feed in Tariff scheme, e.g. GET FiT v. Support a program using Contracts for Difference
1. OPTION 1: Do Nothing – Business as Usual 57. This is what we expect to happen in the absence of the DFID intervention. It assumes a business as
usual development with high growth in fossil fuel energy generation in Africa and lower renewable energy generation. This is detailed in paras 40 to 42 of the Strategic Case. Key features include:
Fewer renewable projects are developed in Africa, with a greater risk of higher carbon emissions Greater exposure of country budgets to oil and gas price fluctuations affecting the stability of their
energy buyer in many instances which further deters private sector investment. Continued reliance on limited public financing for energy generation in African countries.
2. OPTION 2: Contribute to setting up Green Africa Power (GAP) as a PIDG facility 58. In collaboration with other donors, we could support the creation of GAP. GAP would deploy the
following 3 instruments to strengthen projects’ capital base and encourage policy reform to support renewable energy projects:
a) Quasi-equity Loan (QEL): GAP would advance a subordinated loan to the Project Company, considered as equity by senior lenders and consequently decreasing the amount of equity (“Sponsor equity”) required from project sponsors (the main equity investors in a project, the “Sponsors”). The loan would not require collateral although on a project by project basis it may be that GAP would negotiate specific security structures for a QEL.
On each project, GAP would negotiate and pre-agree the order in which any surplus cash is paid to financiers (‘Cash Waterfall’), whereby, subject to cash being available in the company, payments would be made in a certain order, as agreed with senior lenders / GAP to meet the specific requirements of that project. A typical priority of cash application would be the following order:
i. Senior lenders would be paid interest payments and any principals repayments that are due; ii. GAP will be paid a basic rate of interest, ‘Running Yield’ (5% in the illustration below); iii. Equity sponsors would be paid a certain agreed Internal Rate of Return (IRR), the cumulative
overall return over time, 10% p.a. in the below illustration;

19
iv. GAP would be paid the balance of cash surplus, to bring its overall return, its IRR, to an pre-agreed threshold, 12% in the illustration; and
v. Equity sponsors would be paid the balance of any free cash-flow.
In the early stages of the project, if the minimum returns required to pay the Running Yield on the GAP QEL are not available, the Running Yield can be deferred until a later date when such returns become available (it can be ‘accrued’).
Thus in early years (years 3,4 and 5 in Chart 1), equity sponsors will receive a cash payment higher than GAP, until their minimum threshold is met. Then GAP will receive a higher cash payment (years 6, 7, 8 and 9) until the GAP minimum threshold IRR is met. After this, GAP will continue to receive its agreed rate of interest and any additional cash will be paid to the equity sponsors. Overall, we expect the equity IRR to be higher than the IRR received by GAP.
Discussions with Senior lenders indicate that they are indifferent to whether the sponsor equity or GAP
gets paid first, as they would be senior to both and would get paid before either. They would thus be willing to invest alongside GAP QEL. Project sponsors would receive only a minimum yield rather than a potentially higher yield until GAP has been paid, after which they would be able to reap higher returns. They have indicated that they would also be willing to invest alongside GAP as it would potentially enable the projects to go forward towards financial close while currently this is not happening.
0%
5%
10%
15%
20%
25%
1 2 3 4 5 6 7 8 9 10
SponsorEquity
GAP QEL
Minimum Equity IRR (10%)
Equity returns rise to minimum Equity IRR threshold
GAP returns rise, Principal repayment starts
GAP returns continue to rise to achieve GAP IRR
Equity returns rise again once full GAP IRR paid
GAP IRR (12%)
GAP earns Running Yield
Year
Returns
Chart 1: GAP Return illustrative payment order ("Cash Waterfall")
20
b) Contingent Line of Credit (CLoC): GAP will also be able to provide a contingent line of credit which
could be put in place on a Project to mitigate some element of the construction risks associated with a number of renewable power projects, particularly in sub-Saharan Africa, subject to demonstration of need and negotiation of specific requirements. It is often the case in a renewable IPP that different elements of the construction contract, e.g.
supply of certain parts, installation, civil works, are undertaken by different contractors. There is a risk, as a consequence, that there would be a “gap” whereby each contractor could blame the others for delays and the construction risk cannot, in an economical manner, be fully allocated to one construction contractor. Obtaining a full “wrap” on the construction risks, which lenders would typically require, comes at a high cost (if it is available at all) and at times increases the overall cost to an unreasonable level.
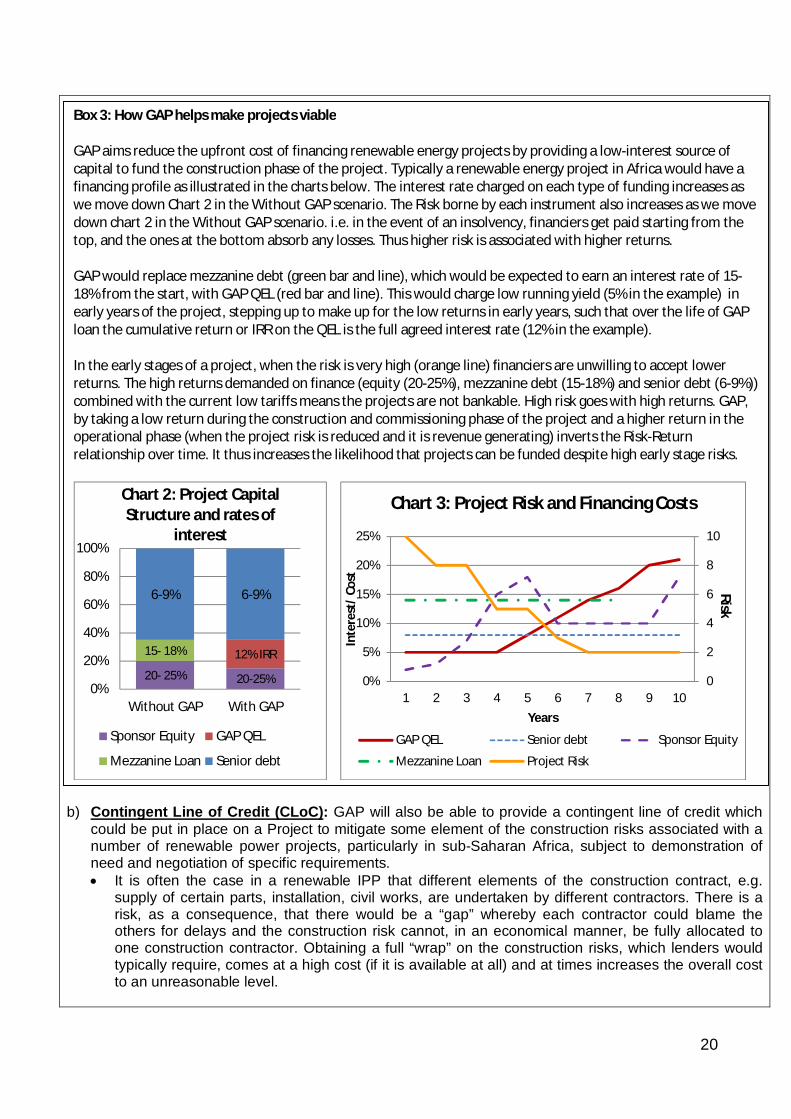
Box 3: How GAP helps make projects viable GAP aims reduce the upfront cost of financing renewable energy projects by providing a low-interest source of capital to fund the construction phase of the project. Typically a renewable energy project in Africa would have a financing profile as illustrated in the charts below. The interest rate charged on each type of funding increases as we move down Chart 2 in the Without GAP scenario. The Risk borne by each instrument also increases as we move down chart 2 in the Without GAP scenario. i.e. in the event of an insolvency, financiers get paid starting from the top, and the ones at the bottom absorb any losses. Thus higher risk is associated with higher returns. GAP would replace mezzanine debt (green bar and line), which would be expected to earn an interest rate of 15-18% from the start, with GAP QEL (red bar and line). This would charge low running yield (5% in the example) in early years of the project, stepping up to make up for the low returns in early years, such that over the life of GAP loan the cumulative return or IRR on the QEL is the full agreed interest rate (12% in the example). In the early stages of a project, when the risk is very high (orange line) financiers are unwilling to accept lower returns. The high returns demanded on finance (equity (20-25%), mezzanine debt (15-18%) and senior debt (6-9%)) combined with the current low tariffs means the projects are not bankable. High risk goes with high returns. GAP, by taking a low return during the construction and commissioning phase of the project and a higher return in the operational phase (when the project risk is reduced and it is revenue generating) inverts the Risk-Return relationship over time. It thus increases the likelihood that projects can be funded despite high early stage risks.
20- 25% 20-25%
12% IRR15- 18%
6-9% 6-9%
0%
20%
40%
60%
80%
100%
Without GAP With GAP
Chart 2: Project Capital Structure and rates of
interest
Sponsor Equity GAP QEL
Mezzanine Loan Senior debt
0
2
4
6
8
10
0%
5%
10%
15%
20%
25%
1 2 3 4 5 6 7 8 9 10
Inte
rest
/ Co
st
Years
Chart 3: Project Risk and Financing Costs
GAP QEL Senior debt Sponsor Equity
Mezzanine Loan Project Risk
Risk

21
Debt lenders to a project may perceive that the risk of a possible construction cost overrun or construction delay leading to late start of operation may mean that the cash flow will not be adequate to fund debt service and other required operational costs. Lenders would normally insist on a contingency being built into the financial model to cover a certain amount of overrun costs, but often this is assumed to be on the basis of a single point EPC Contract. Although a typical project would also have structured in it a debt service reserve account, in a situation where there is no single point construction responsibility, lenders would often require a further buffer, over and above the DSRA, and would normally require the project sponsors to provide this cash designated for this purpose (contingent equity). However, this additional requirement on equity can make the project so uneconomic in terms of equity returns and risk profile that the project does not achieve financial close.
The GAP line of credit would be an alternative funding source for the project sponsors to draw on to
make available this predetermined sum of contingent capital. GAP would receive an upfront fee for provision of the line of credit and would also receive a commitment fee for the duration of the lifetime of the line of credit.
If a call event occurs, i.e. the contingency is fully drawn (because of for example a cost overrun or a
construction delay), lenders could serve notice on GAP requiring it to disburse the CLoC to meet the cost of the overrun.
On any draw-down, the GAP finance applied to fund the cost overrun would constitute a GAP
Quasi-Equity Loan to the project company. When GAP extends a CLoC it would agree with the project company that the CLoC, if called, would mimic (or sometimes exceed) the terms associated with the GAP QEL. These would include a basic interest being paid on an ongoing basis, and start of repayment and a step up in interest rate when the agreed equity dividend has been paid to the sponsors’ equity.
GAP, when considering any application for this line of credit, would consider the nature of
construction risks being assumed and the overall risk profile of the project (in the same manner as any funded GAP QEL).
c) Policy Dialogue and Technical Assistance to encourage tariff reform: GAP will, in parallel with any
other intervention using either of the two instruments above, enter a policy dialogue with the relevant Government and Ministries, to encourage the country to
1. move towards cost-reflective tariffs and 2. put in place the legal and regulatory frameworks required for private sector financing of
Independent Power producers (IPPs) producing renewable energy.
There are a number of situations in Africa, in which financially challenged offtakers wish to introduce
Box 4: Example of a GAP Contingent Line of Credit A solar project with a capital cost of $20m has a construction package of solar panel supply combined with a separate civil works contract. The lenders to the project consider that the split contract approach is acceptable but only on the basis that the sponsors provide a $2m contingent amount to the extent there is a cost overrun. GAP could provide such $2m through its contingent line of credit. GAP would receive an upfront fee for provision of the line of credit and would also receive a commitment fee for the duration of the lifetime of the line of credit. In the event that the $2m line of credit was not called prior to commercial operations date, the line of credit would be cancelled and the liability for GAP to fund the $2m would cease. In the event that there is a delay in construction that neither contractor takes direct responsibility for, project lenders could ask GAP to pay the $2m into a designated Bank account. The $2m then becomes a loan similar to GAP Quasi-Equity Loan to the project company, on which it will pay a basic rate of interest immediately and a higher interest rate once the project starts to make returns.

22
renewable IPPs into their generation plans. These organisations understand the commercial dynamics and would like to be in a position to pay fully cost-reflective tariffs, but are unable to do so immediately, within their tariff settlements and current financial and political position. Given time, some of them would be willing to see tariffs rise gradually as this would give them time to build political and public support for it. This could include programming tariff rises into Ministry budgets for future years and building political support among the key stakeholders in Government including the opposition political parties and media. Eventually such a rise in tariffs, or at least a part of it, would need to be passed on to consumers in order to avoid an unsustainable burden on Government budgets as the consumption of energy increases. Thus they would also need to sensitise consumers to upcoming electricity price increases, work out a cross-subsidy mechanism for overall tariff reform, or simply move into the next electoral cycle when tariff reform might be more politically palatable. There are known policy options available to limit the negative impacts on poor people from tariff changes, for example, lower unit pricing for low volume use and lower tariffs for domestic compared with commercial use (with informal income generating activity benefiting from lower domestic unit prices).
Offtakers might be able to unlock alternative sources of funds to pay higher tariffs over time. For example, transmission and distribution losses are as high as 20% for some countries and reducing these would be another source to find funds for tariff increase. For example, Uganda has increased tariffs by almost 50% in 2012 and also has a large programme to reduce distribution losses. GAP would make it easier for the Government to achieve this by providing the funding now for the higher tariffs and upfront instalment costs in the early years, thus buying them time to implement these complementary reforms. GAP will charge a higher rate of interest in the medium to long term, thus benefitting from higher tariffs and increased revenues in future years.
In addition to a specific focus on tariffs, GAP will also assist Governments with undertaking broader power sector reform. This could include a range of activities including power sector regulation, achieving efficiency gains in distribution and cutting losses, improving or putting in place a PPP framework or IPP regulations, legal reform to facilitate IPPs, differentiated pricing mechanisms to enhance revenues, mapping of the countries renewable energy resources or potential for specific renewable technologies etc. It would be able to obtain concessional grants from the PIDG Technical Assistance Facility (TAF) in order to finance these.
In several African countries, the Work Bank and IMF are already working with Governments to help move them towards cost reflective tariffs. In some cases the IMF insists on such reform, e.g. Uganda. GAP would aim to coordinate with such agencies in each country it works in and to support and complement their efforts on tariff and broader power sector reform. Where possible, it will help build political momentum and facilitate on-going discussions using the instruments at GAP’s disposal.
While achieving tariff reform would be the ideal scenario there is a risk that while GAP undertakes
this dialogue with Governments, the reforms do not materialise. Governments might promise reforms upfront but fail to act. GAP is however not guaranteed to achieve this. Each individual transaction will need to be negotiated to fit its particular circumstances, and all the stakeholders persuaded to play their part. This will require: sensitivity, tact and ability to persuade, as well as deep knowledge of, and ability to communicate and build trust about, the commercial, regulatory and political aspects of renewable power and African infrastructure markets. These requirements would be taken into account during the selection of GAP Manager, as detailed in Commercial Case Section E Para 118.
An important risk for GAP is whether it will be possible to persuade the governments, regulators and power utilities in host countries of the benefits of GAP, and thus to agree to move towards cost- reflective tariffs. We believe that the first transactions concluded by GAP will be the most important. Once there are examples of how GAP participation is able to allow time for tariffs to move gradually
23
upwards, without sudden price or financial shocks for offtakers and their customers, it is more likely that others will be attracted to follow through the "demonstration effect" (See para 95, Appraisal case). This risk has been captured in the Risks section in the Management Case (Table 14).
This policy dialogue will also make it less likely that GAP interventions negatively distort power
markets by allowing tariffs to be too low indefinitely for better off users. In certain countries, where Governments and regulators are unable or unwilling to undertake long-term tariffs reform, or are unable to find the funds for it, even in the long term, GAP may not be able to assist.
59. Complementary financing instruments: Other PIDG facilities will complement GAP by potentially supporting specific projects: Emerging Africa Infrastructure Fund (EAIF) or Infrastructure Crisis Facility-Debt Pool would be able
to offer Senior or subordinated debt GuarantCo would be able to offer guarantees to catalyse local currency lending Infraco Africa would be able to offer project development expertise and supplement early stage
sponsor equity DevCo might be able to offer transaction advisory services Technical Assistance Facility (TAF) would be able to provide resources for related Technical
Assistance and Capacity Building for the relevant Government agencies. GAP will work in conjunction with other initiatives, such as Public Private Infrastructure Advisory
Facility (PPIAF), Investment Climate Facility (ICF), Climate Public Private Partnership Technical Assistance fund, the Climate Investment Funds (the Scaling Up Renewable Energy program (SREP) in particular), the Renewable Energy and Energy Efficiency Partnership (REEEP)and GetFit, among others, to further policy and regulatory arrangements and provide complementary forms of assistance to aim for a well-structured and well-coordinated form of assistance. Vivid Economics has undertaken a review of the additionality of GAP which concludes that none of the initiatives to support low-carbon investment in developing countries share all of the characteristics of GAP. This review is currently being refreshed given the evolution of the final design of GAP.
60. GAP will follow a rigorous Investment Policy agreed with its funding donors, which will, among other things limit GAP’s investment in any one project to a maximum of 20% of the Project’s capital costs, including both GAP QEL and GAP CLoC. For small projects in DAC I and II countries, investment in any one project could be up to 40%.
Interaction with the Carbon Market & GAP’s fit with the ICF Carbon Market Principles 61. As partly explained in paragraph 18 above, countries have undertaken certain commitments in climate
change negotiations. In addition to cutting or capping their own emissions, these include commitments to spend a certain amount of public money in developing countries for emission reductions. This commitment is referred to as “climate finance”. The rationale behind these is that if the UK’s climate finance, via ICF, supports projects that sell the resultant emission savings into the carbon market as CERs (supported through the CDM), then the emission savings cannot be attributed to the ICF intervention. This reduces the Value for Money case, as these ICF funds could have been spent on another intervention that produces net emission savings according to ICF methodology. It also potentially distorts the market as it displaces other projects that would have produced CERs, albeit at a different price and in a different region, to meet the developed countries’ emissions reduction targets.
ICF principles on carbon market interactions have been developed to provide a strategic steer to ICF investment decisions, and for the design and approval of future ICF projects in order to minimise these risks, market distortions and maximise the emission saving benefits and Value for Money of climate finance spend.
62. In summary these are:
i. Principle A: Require transparency from project developers on if and how a project is interacting with carbon markets, and require carbon market revenues to be outlined in the project’s financial

24
appraisal. ii. Principle B: Do not co-finance projects with carbon market revenues that are typically
funded by the CDM/ can obtain CERs, except projects which are: i. Supporting new technologies (within the relevant country), or ii. Deploying technologies at new scales (within the relevant country).
iii. Principle C: If principle B is satisfied, carbon market co-financing is supported in principle, but co-financing must be minimised to the point where a project is financially viable.
iv. Principle D: A project must demonstrate that minimum co-financing options have been considered and other sources of finance are not available to finance the project.
63. In order to be consistent with these ICF principles – GAP will be transparent about how the project is
interacting with carbon markets. The share of projects financed from UK ICF funds (£45m) will not be permitted to gain CDM accreditation (and thereby CERs) or projects do acquire CERs then GAP will ensure the CERs are cancelled. This enables GAP to maximise the climate benefits and net emission savings from its ICF spend. To achieve this specifically, for the share of ICF funds:
i. GAP will seek a legal written commitment from the project that it will not apply for Carbon Emission Reduction Certificates CERs. This will ensure that any carbon reductions that accrue to such projects are over and above the reductions already achieved via the CDM; Or,
ii. GAP will seek an assignment of any CERs generated by the project. When the project becomes operational and has the potential to generate CERs, the accreditation of CERs would be subject to GAP consent. HMG will have the right to cancel these CERs when accredited.
These conditions will be reflected in the legal agreement that will establish the GAP facility.
64. For the proportion of GAP projects financed by non- ICF funds (funded with other UK funds or other donors’ funds), GAP will seek assignment of any CERs as security for the advance made. Such CERs may then be sold or cancelled by GAP. Where CERS are delivered by the project, an upside sharing mechanism in respect of any appreciation in value of such CERs would be agreed between GAP and the sponsors to the Project Company. This would maintain an incentive for the sponsors to maximise CERs whilst allowing GAP an ability to benefit from the financial upside from the CERs, commensurate with the risks it is assuming. GAP Manager may sell some of the CERs for a profit that can be re-invested in further renewable energy projects. This will reduce the need for the UK to contribute further funds to GAP in a second Phase. GAP will at a minimum demonstrate clearly that net carbon emission reductions accrue to the proportion of its funding that comes from the ICF or other climate finance.
65. Decisions on which specific projects agree not to get CER accreditation and which projects assign CERs to GAP, will be taken by the GAP Manage. The GAP manager will work this out so as to ensure that CER requirements on ICF funds/non ICF funds are met. DFID and DECC will receive an annual report from the Manager outlining the CER treatment of each project and how on a portfolio basis, this meets the requirements imposed by ICF Principles.
3. OPTION 3: Increase funding to Multilateral Development Banks (MDBs) 66. The UK could increase funding to other Multilateral Development Banks (MDBs). In this case the
relevant MDBs would be the International Finance Corporation (IFC) and the Private Sector department
CERs Cancelled
Project produces
Net Carbon
Emission Reduction
s
ICF or other Climate Finance Funds in
GAP
Non-Climate Finance Donor Funds in GAP
Project produces CERs with
GAP consent
Project signs a legal
commitment to not apply
for CERs
Project produces CERs with
GAP consent
GAP sells CERs- No
net carbon
emission reductions
CERs Cancelled
25
of the African Development Bank (AfDB).
a. Core financing to MDBs: MDBs use their core capital to provide debt and equity to private companies, including renewable IPPs. In addition to this debt and equity finance, they can draw on sources of concessional funds for Technical Assistance (TA) to complement their financing. Such funding by MDBs is vital for renewable projects in Africa to move ahead and in fact, would be complementary to the instruments provided by GAP. The proposed GAP instrument differs from senior debt or equity provided by the MDBs as follows: The majority of debt provided by MDBs falls into the category of ‘Senior debt’, shown in blue in
Charts 2 and 3. In the event of insolvency, MDBs’ debt is paid out first. GAP quasi equity will be paid only after the senior debt is paid but before other equity so carries a higher risk that it will not get paid. MDB loans also carry an interest rate which may be lower than market but is relatively high compared to the interest to be demanded by GAP QEL during the construction phase of projects. In order to maintain their AAA Rating, MDBs use their cost of capital and risk- based pricing, leading to higher rates of interest for high risk projects, and are also inclined to avoid high-risk projects.
Equity provided by MDBs similarly comes with a higher return expectation. The African Development Bank has chosen not to invest directly in project level equity and only invests in Private Equity Funds which may invest in renewable energy in return. There are very few such funds in existence at the moment targeting African renewable energy which is why there is a need for additional finance which is more patient than the private equity. Private Equity investments demand a high rate of return (likely between 15% and 30%) and exit usually within 7 years. As illustrated in Box 3, these are high enough to make projects unviable. A combination of MDB senior debt/ equity, GAP QEL, which is patient and flexible, and private investor money may, however allow projects to become financially viable.
There are additional issues concerning the terms, effectiveness and transaction costs associated with MDB climate finance relative to private sources.
Transaction costs: The transaction costs of MDBs have been shown to be higher than those of PIDG. PIDG Administrative costs including GAP Manager Fees have been calculated as 1.9% of commitments by PIDG and 4.3% of accumulated disbursed contributions by PIDG members to PIDG. In comparison, IFC charges 5% of donor contributions for Advisory Services trust funds and 2% Administrative fees for donor investment Trust Funds (TF). However, management fees of the TF including staff and travel costs are additional to this.
Focus on LICs: IFC and AfDB's focus on LICs is much weaker than the 75% in LICs (DAC I and II countries) to be set for GAP. For example, the IFC only had 10% of its investments in LICs in 2010. While UK is a major shareholder of both the IFC and the AfDB, our influence on their policy and operations is weaker because of a more diverse shareholding structure and lower percentage of shares. Additionally, as MDBs are regulated Banks, they have financial management guidelines which limit the extent to which they can lend to more risky projects, both in terms of countries and sectors.
Focus on Renewables: IFC and AfDB's private sector operations invest across various sectors and renewables form a small proportion of these. The IFC aims to have at least 20% of its LT finance and 10% of its short term (ST) finance being climate friendly by 2013. The IFC is already investing in renewables in private equity and in partnership with the UK, Climate Public Private Partnership (CP3) is focusing on this area for private equity. Hence doing more in private equity would not be additional.
Core financing to MDBs would thus not be the optimal choice to address the need set out in the Strategic case in terms of Instrument, Transaction costs, LIC focus and Sector focus.
26
b. Climate Investment Funds (CIFs): The CIFs are a collaborative effort among the MDBs and developing countries to bridge the financing and learning gap between now and a post-2012 global climate change agreement. They support targeted programs with dedicated funding to pilot new approaches with potential for scaled-up, transformational action aimed at a specific climate change challenge or sectoral response. Two of the CIF Funds: the Clean Technology Fund (CTF) and the Strategic Climate Fund (SCF), through its Scaling-up Renewable Energy Programme (SREP) could potentially help scale up clean energy generation in target countries in Africa. Process: The CIFs Board (where donor and recipient countries are equally represented) agrees on
a list of Pilot Countries. Participating MDBs then undertake trips to the chosen countries to engage with stakeholders and develop a Country Investment Plan. Private sector projects must apply to the country Government in advance to be included in the country plan which makes it difficult for some IPPs to access this financing as there are not always clear advertisements (whereas GAP will be open to all projects on non-discriminatory basis). Once approved, the Investment Plans are difficult to change or to include new projects into. Typically only one or two private sector projects would be included in any country, across all climate relevant sectors.
Instruments: CIFs primarily use concessional senior loans for funding private sector projects. This brings down the cost of the project, but is senior to all other debt and equity and hence does not take as much risk as the GAP QEL would be able to take. The CIFs are also able to undertake policy dialogue with host Governments on moving the country towards cost-reflective tariffs and on broader power sector reform for greater private sector participation.
Geographical focus: Once the country programmes are decided, additional countries cannot join the CIFs until the next phase. Only 5 out a total of 22 countries are in SSA (Nigeria, Mali, Kenya, Ethiopia, South Africa) and the CIFs do not have an explicit focus on LICs. The number of countries can be increased through additional donor funding. However, potential recipients are selected by an independent expert panel and presented to the Board. As such UK’s ability for one donor to influence the geographical focus is limited.
Costs: The UK has contributed £735m to the CIFs from 2009-2012. Of this £385m was to the CTF and £50m to the SREP. A further £285m was approved by the ICF in November 2011, with £150m to CTF and £50m to SREP.
Benefits: The CTF has endorsed over 12 investment plans for funding, from which estimated annual emissions savings are 33 mtCO2/ year. These investments are expected to provide 18 million people with low carbon and affordable transport, and provide over 12 GW of clean electricity, equivalent to providing energy to 16 million households. DFID’s Multilateral Aid Review (MAR) rated the CIFs as good overall with satisfactory scores across organisational strengths and contribution to UK development objectives. Country leadership, results and speed of delivery were identified as areas for on-going improvement.
Thus while the CIFs could deliver strong benefits, financing via the CIFs would not be the optimal choice in terms of Private sector accessibility, Country focus and UK’s ability to influence outcomes.
4. OPTION 4: Support a Feed-in Tariff scheme, e.g. GET FiT 67. Support the establishment of renewable energy feed-in tariff programmes in partner countries, through
programs such as GET FiT. We have evaluated this Option by analysing the GET FiT programme in detail. DFID and DECC, via ICF are working on a Business Case for another project, GetFit which like GAP, seeks to make RE power plants in Sub-saharan Africa financially viable and thus bring them to completion, or completion earlier than might otherwise be the case. The GET FiT project comprises support to get some planned small-scale, private-sector, on-grid Renewable Energy (RE) projects (IPPs) in Uganda to completion. The support is in the form of:-
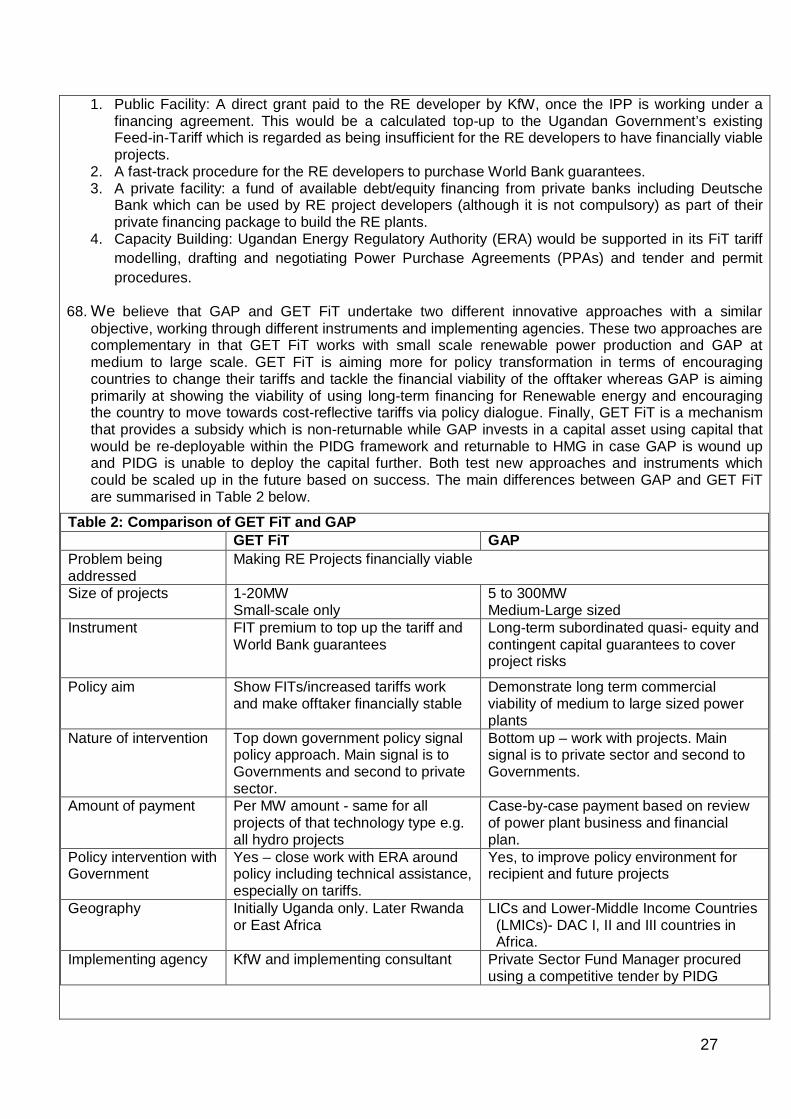
27
1. Public Facility: A direct grant paid to the RE developer by KfW, once the IPP is working under a financing agreement. This would be a calculated top-up to the Ugandan Government’s existing Feed-in-Tariff which is regarded as being insufficient for the RE developers to have financially viable projects.
2. A fast-track procedure for the RE developers to purchase World Bank guarantees. 3. A private facility: a fund of available debt/equity financing from private banks including Deutsche
Bank which can be used by RE project developers (although it is not compulsory) as part of their private financing package to build the RE plants.
4. Capacity Building: Ugandan Energy Regulatory Authority (ERA) would be supported in its FiT tariff modelling, drafting and negotiating Power Purchase Agreements (PPAs) and tender and permit procedures.
68. We believe that GAP and GET FiT undertake two different innovative approaches with a similar objective, working through different instruments and implementing agencies. These two approaches are complementary in that GET FiT works with small scale renewable power production and GAP at medium to large scale. GET FiT is aiming more for policy transformation in terms of encouraging countries to change their tariffs and tackle the financial viability of the offtaker whereas GAP is aiming primarily at showing the viability of using long-term financing for Renewable energy and encouraging the country to move towards cost-reflective tariffs via policy dialogue. Finally, GET FiT is a mechanism that provides a subsidy which is non-returnable while GAP invests in a capital asset using capital that would be re-deployable within the PIDG framework and returnable to HMG in case GAP is wound up and PIDG is unable to deploy the capital further. Both test new approaches and instruments which could be scaled up in the future based on success. The main differences between GAP and GET FiT are summarised in Table 2 below.
Table 2: Comparison of GET FiT and GAP GET FiT GAP Problem being addressed
Making RE Projects financially viable
Size of projects 1-20MW Small-scale only
5 to 300MW Medium-Large sized
Instrument FIT premium to top up the tariff and World Bank guarantees
Long-term subordinated quasi- equity and contingent capital guarantees to cover project risks
Policy aim Show FITs/increased tariffs work and make offtaker financially stable
Demonstrate long term commercial viability of medium to large sized power plants
Nature of intervention Top down government policy signal policy approach. Main signal is to Governments and second to private sector.
Bottom up – work with projects. Main signal is to private sector and second to Governments.
Amount of payment Per MW amount - same for all projects of that technology type e.g. all hydro projects
Case-by-case payment based on review of power plant business and financial plan.
Policy intervention with Government
Yes – close work with ERA around policy including technical assistance, especially on tariffs.
Yes, to improve policy environment for recipient and future projects
Geography Initially Uganda only. Later Rwanda or East Africa
LICs and Lower-Middle Income Countries (LMICs)- DAC I, II and III countries in Africa.
Implementing agency KfW and implementing consultant Private Sector Fund Manager procured using a competitive tender by PIDG
28
5. OPTION 5: Support a programme using Contracts for Difference 69. In a Contract for Difference (CfD) model, GAP would agree to pay the project the difference between
the power purchase price/ feed in tariff and a revenue stream that would make the project viable. This could either be a two way CfD model where GAP gets the financial benefit if the tariff rises above the strike price, or a one way CfD model where GAP effectively provides a minimum guarantee on the feed in tariff, in return for a fee. A Contract for Difference model could be similar to that being pursued in several European countries, such as in Denmark. In theory a key rationale for a CfD mechanism is that it provides stable financial incentives to invest in all forms of low-carbon electricity generation - and incentives are not uncertain or altered owing to uncertainty in future tariff levels. A two way model also avoids risks of over-subsidising.
70. In the context of the power markets in in SSA, a CfD is unlikely to work as the price of a Power Purchase Agreement (PPA) in these markets is in nearly all cases a fixed tariff as no power pool or open market exists, unlike developed markets. In Africa, in any one country, there is usually a single buyer of power which is almost always public-owned. As such any CfD would, if it is being proposed to allow a greater tariff than that provided for in the PPA, be loss- making in nearly all cases, at all times. This is because it would become a mechanism to top up the difference between the CfD price and the existing tariff, unless a change in the tariff is expected.
71. The only context in which such a structure would work is if the tariff is a variable one, perhaps linked to the actual retail tariff prevailing. A CfD could then be provided which mitigates the downside risk against an agreed price (what the lenders would need) with upside then being taken when the retail tariff increases beyond that point. The risk of capital outlay for the period of time when the CfD is out of the money could be significant. A high political risk would be imposed on GAP as, while GAP plans to enter a policy dialogue to encourage countries to move towards cost-reflective tariffs, in this case, such a rise would be essential for GAP to recover its investment. Ultimately a CfD in these circumstances is likely to become a grant mechanism. If a grant to top up tariffs is to be provided, alternatives would have to be considered to find the optimal way in which such a grant is applied.
72. Lenders will require that the tariff under the PPA, and the support being provided by GAP, to be sufficient to meet debt service as detailed in the financial model. To the extent that GAP is providing such support through a CfD, lenders would typically require that the intervention being proposed by GAP would be fully collateralised - GAP would need to demonstrate that it has capital available to it to meet any claim under the CfD, including any deterioration in the strike price under the CfD. It is likely that this collateral requirement would be significant. This would mean "tying up" significant amounts of cash within GAP.
73. A CfD would have a value only if its counterparty, the project company, remains able to meet its own obligations under the CfD. By participating in the capital structure of the underlying projects, GAP QEL would have a claim on the asset as a direct financier. This would allow GAP to have a greater level of certainty in respect of future revenues and repayments of capital for application to other projects.
74. A CfD on the carbon price would have some of the same problems as the CfD on the tariff described above. These include need for full collateralisation and high costs, high counterparty risk, and the lack of ownership of an asset with value.
75. Table 3 below summarises the key features, costs and effectiveness of each option in delivering on the need set out in the Strategic case:

29
Table 3: GAP Options Analysis: Key Features, Cost and Effectiveness Option 2: GAP Option 3: MDBs/
CIFs Option 4:GET FiT Option 5:
Contract for Difference
Instrument Long-term subordinated quasi- equity and contingent Line of Credit, Technical Assistance
Long term senior and subordinated debt, equity, guarantees, Technical Assistance
FiT premium to top up the tariff, Technical Assistance for regulator and World Bank guarantees
Contract for Difference
Nature of intervention
Project and Policy level Project and Policy level
Policy signal approach Project level
Amount of payment
Case-by-case payment based on review of IPP business and financial plan.
Case-by-case payment based on review of IPP business and financial plan.
Per MW amount - same for all projects of that technology type e.g. all hydro projects
Case-by-case payment based on review of IPP financial plan.
Policy intervention with Government
Yes, to encourage countries to move towards cost-reflective tariffs
Yes- the CIFs have the potential for a strong policy impact capitalising on the World Bank and AfDB’s political clout, although most advisory and TA has been project-specific rather than policy.
Yes – close work with ERA around policy including technical assistance on tariffs
No
Implementing agency
Private Sector Management Company procured using a competitive tender by PIDG
IFC/ AfDB/ WB KfW and implementation consultant.
To be designed
Cost PIDG: 4.3% of disbursed Donor contributions; 1.9% of donor commitments. GAP costs minimised via tender; expected to be ~10% of Donor commitments, for first phase reflecting start-up costs.
CIFs: 3.1% Admin costs, plus project preparation and implementation costs of MDBs.
Proposed ~8% of total donor commitments in Management and Implementation fees
Given the need to collateralise future payments on the difference between the CfD and the Tariff, the capital costs will be very high and money will sit idle for several years.
Alignment with DFID’s Country Focus
Sub-Sahara Africa:LICs and LMICs (DAC I, II and III countries only)
All Non Annex I countries for IFC and AfDB; selected countries for CIFs (5 in SSA)
Initially Uganda only. Might be extended later to other countries
To be designed
LIC Focus (% in DAC I and II countries)
75% IFC: 10% in FY 2010 100% To be designed
Sector Focus on Renewables
100% IFC: Target of $3bn in climate related investments by 2015; 20% of LT finance and 10% of ST Finance; CIFs: 100% Climate investments
100% 100%
Size of projects
5 to 200MW Medium-Large sized
Large projects only 5-20MW Small-scale only GET FiT recognises
N/A

30
that its approach would not work as well with larger projects.
Demonstration effect to private sector and Governments
Demonstrates to private sector long term commercial viability of Renewable energy and the importance and feasibility of cost- reflective tariffs to Governments
Demonstrates Long term viability of Renewable energy with DFI investment
Demonstrates to private sector long term commercial viability of renewable energy and the importance of cost-reflective tariffs to Ugandan and regional Governments
A CfD would only bridge the gap between the existing and cost-reflective tariffs for selected projects, without demonstrating broader viability of projects.
UK Influence As PIDG is a small grouping of like-minded donors, each donor has a strong influence on its strategy, direction and operations.
While the UK is an important and influential donor to the CIFs, its influence is limited compared to influence in the PIDG due to a larger number of Board members and the presence of both recipient and donor countries in an equal proportion on the CIFs Boards.
UK, Norway, European Commission and Germany are the key donors. Given the size of UK’s contribution it is likely to have a strong influence.
UK would be the only donor of a CfD model at start and would thus have a strong influence
Returnable Capital
GAP deploys UK funds into capital assets and when GAP received the capital or returns back, it can re-deploy them into other projects. If GAP is wound up, PIDG may re-deploy this capital into other developmental activities and in case it is unable to do so, the funds would be returnable to DFID.
MDBs re-deploy repayments and interest income into other projects. They can also recycle funds from a facility that is wound down into other development activities. While subscriptions to capital of MDBs are technically returnable, this is a highly unlikely event in the case that these institutions are wound up.
The FiT premium will be a non- returnable subsidy.
A non-returnable subsidy
Risks Medium- High: GAP introduces an innovative new financial instrument to markets and thus entails a high risk of implementation. Management and Governance risks are low due to use of PIDG. Risks are assessed in detail in the Management Case.
Low: MDBs, both via core funding and CIFs are a tried and tested channel to disburse donor funds.
High: GetFit is an innovative approach to catalysing renewables markets and entails a high risk in terms of continued Ugandan Government support and follow through on policy commitments.
High: CfDs would be a new instrument and given the rigidities in African power markets, the risk of the instrument being ineffective are high.
Option appraisal
GAP has the right Country Focus, Sector Focus, potential for Demonstration effect, appropriateness of instrument to address the need outlined in the Strategic Case, Cost
MDBs and CIFs are a Low Risk option with trusted delivery partners that deliver benefits broadly, but lack Country Focus and Sector Focus, have a weak
GetFit is a strong contender with the right Regional Focus and Sector Focus, potential for strong Demonstration effect and similar costs to GAP. It aims to
A CfDs approach would have little demonstration effect and would be a High cost and High Risk option, which is unlikely to work in African

31
control and Management arrangements of PIDG and UK Influence. It has a High Risk. GAP is thus considered the Preferred Option.
Demonstration effect, and unsuitable processes and instruments. UK Influence is also limited.
address the need outlined in the strategic case through a different instrument and approach and like GAP, has a High Risk.
markets.
76. Based on the above assessment,
1. Option 2, of setting up Green Africa power is a strong option, as it has a strong LIC focus, and the ability to use innovative instruments to cause transformative change in the market for financing of renewable energy. Its key downside is that it carries a high risk.
2. Option 3, of scaling up our financing to MDBs and CIFs is considered a potential safe option to scale up our financing of renewable energy. Its demonstration effect and ability to cause transformative change is considered weak as well as its focus on LICs. This reduces its ability to be effective in addressing the need outlined in the strategic case.
3. Option 4, of financing alternative Feed-in tariff programmes such as GET FiT is a strong option, which could effectively address the need set out in the Strategic case. The key downsides are that it targets smaller sized renewable energy projects and is limited to one country at the moment.
4. Option 5, of using Contracts for Difference is a weak option, as it’s unlikely to be effective given the current state of African power markets and also entails a high risk.
B. Assessing the strength of the evidence base for each feasible option 77. In Table 4 below the quality of evidence for each option is rated as either Strong, Medium or Limited
Table 4: Strength of Evidence for Options Option Evidence rating 1 - Do nothing N/A 2 – Green Africa Power Limited 3 – MDBs / CIFs Medium 4 – Feed-in-Tarrifs/GET FiT Limited/ Medium 5 – Contract for Difference Limited
The evidence rating noted for GAP is based on available knowledge of the intervention option and how such could meaningfully be applied to the underlying deficiencies perceived as impacting the development and financing of renewable IPP’s in SSA. The only evidence available in respect of GAP instruments is from consultations with private sector financiers and project developers, including via the discussion arranged by DFID on 6th September 2012 in London. There is limited evidence that policy reform would be credible or that any success of GAP projects will be replicated via a demonstration effect. Evidence is available that the lack of energy constraints growth and that growth is a key requisite for poverty reduction. The impact of energy on the MDGs is also evidenced. As CIFs are already in existence and have been operational for 4 years, evidence on some aspects of their performance and impact is available. While GET FiT is a new concept, consultant studies commissioned by KfW are available which provide credible evidence on the market and the expected first round impacts. The CfDs option would be a new product and evidence is available on the lack of flexibility in African energy markets which makes this option unfeasible. What is the likely impact (positive and negative) on climate change and environment for each feasible option? Categorise as A, high potential risk / opportunity; B, medium / manageable potential risk / opportunity; C, low / no risk / opportunity; or D, core contribution to a multilateral organisation.
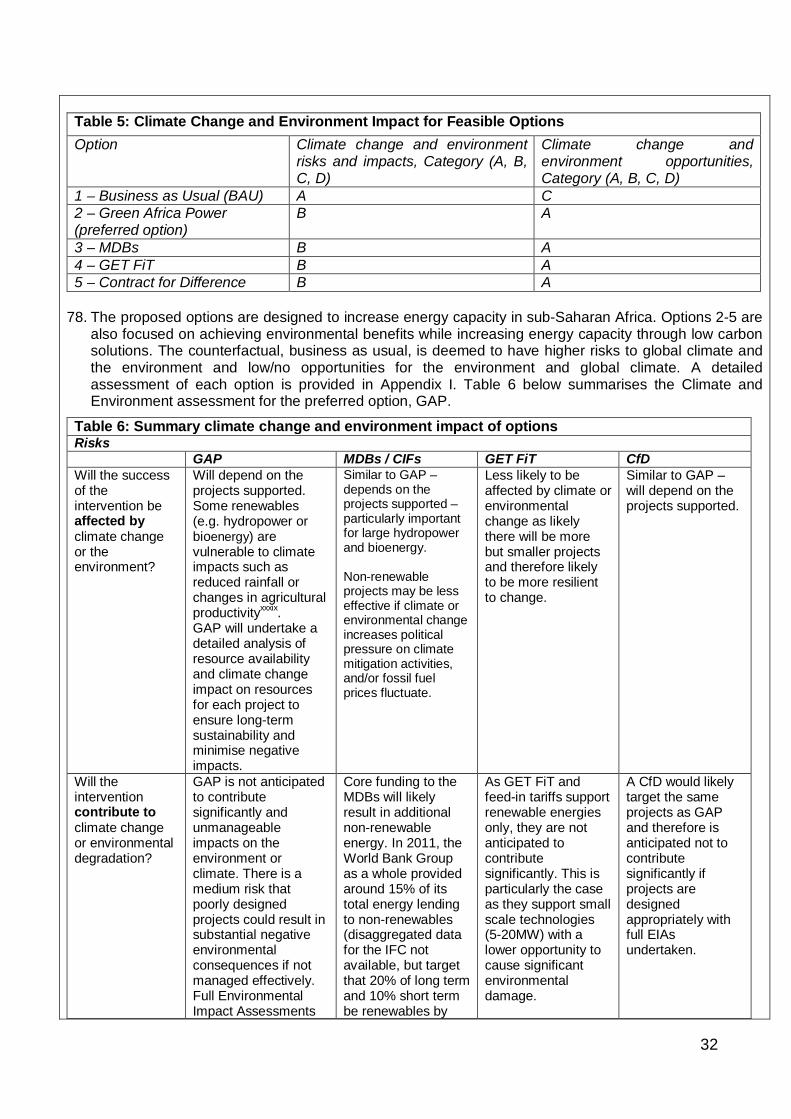
32
Table 5: Climate Change and Environment Impact for Feasible Options Option Climate change and environment
risks and impacts, Category (A, B, C, D)
Climate change and environment opportunities, Category (A, B, C, D)
1 – Business as Usual (BAU) A C 2 – Green Africa Power (preferred option)
B A
3 – MDBs B A 4 – GET FiT B A 5 – Contract for Difference B A
78. The proposed options are designed to increase energy capacity in sub-Saharan Africa. Options 2-5 are
also focused on achieving environmental benefits while increasing energy capacity through low carbon solutions. The counterfactual, business as usual, is deemed to have higher risks to global climate and the environment and low/no opportunities for the environment and global climate. A detailed assessment of each option is provided in Appendix I. Table 6 below summarises the Climate and Environment assessment for the preferred option, GAP.
Table 6: Summary climate change and environment impact of options Risks GAP MDBs / CIFs GET FiT CfD Will the success of the intervention be affected by climate change or the environment?
Will depend on the projects supported. Some renewables (e.g. hydropower or bioenergy) are vulnerable to climate impacts such as reduced rainfall or changes in agricultural productivityxxxix. GAP will undertake a detailed analysis of resource availability and climate change impact on resources for each project to ensure long-term sustainability and minimise negative impacts.
Similar to GAP – depends on the projects supported – particularly important for large hydropower and bioenergy. Non-renewable projects may be less effective if climate or environmental change increases political pressure on climate mitigation activities, and/or fossil fuel prices fluctuate.
Less likely to be affected by climate or environmental change as likely there will be more but smaller projects and therefore likely to be more resilient to change.
Similar to GAP – will depend on the projects supported.
Will the intervention contribute to climate change or environmental degradation?
GAP is not anticipated to contribute significantly and unmanageable impacts on the environment or climate. There is a medium risk that poorly designed projects could result in substantial negative environmental consequences if not managed effectively. Full Environmental Impact Assessments
Core funding to the MDBs will likely result in additional non-renewable energy. In 2011, the World Bank Group as a whole provided around 15% of its total energy lending to non-renewables (disaggregated data for the IFC not available, but target that 20% of long term and 10% short term be renewables by
As GET FiT and feed-in tariffs support renewable energies only, they are not anticipated to contribute significantly. This is particularly the case as they support small scale technologies (5-20MW) with a lower opportunity to cause significant environmental damage.
A CfD would likely target the same projects as GAP and therefore is anticipated not to contribute significantly if projects are designed appropriately with full EIAs undertaken.

33
(EIAs) must be completed for each project, with impacts avoided, reduced, mitigated against or compensated for; and included in the monitoring and evaluation of the project.
2015); AfDB provided over 30% to non-renewablesxl. Funding to the CIFs would not contribute significantly if projects are designed well and full EIAs are conducted and taken into account.
Opportunities GAP MDBs / CIFs GET FiT CfD Could the intervention help tackle climate change or build resilience to it; could it help improve the environment or its management?
GAP aims to install an additional 270MW of low carbon energy to sub-Saharan Africa – 50% of this is expected to displace non-renewable energy, saving up to 3.9 mtCO2. Other opportunities include: Reducing the need
for extracting, transporting and using fossil fuels
Avoiding carbon lock-in for the life of a power station
Catalysing more private investment in renewable energy in SSA
Reduced contamination of air and water sources
The new PIDG Code of Conduct also provides opportunities to raise environmental awareness through incorporating climate risks into project design and engaging with local communities.
Similar to GAP, the CIFs offer significant opportunities to tackle climate change as they also support renewable energy and energy efficiency. Additional core funding to the MDBs would not provide as many opportunities to tackle climate change and improve environmental management as some of this funding would likely go towards non-renewable energy, therefore contributing to climate change.
As feed-in tariffs are more suitable for smaller projects they could potentially provide less opportunities to tackle climate change, particularly if large power plants are still required to be built and the market failures described in the strategic case do not support these new plants being renewable. However, there may be more opportunities for greater environmental management as the risks and impacts may be easier to avoid, reduce and manage for smaller scale projects.
Similar to GAP, however, as a CfD approach provides non-returnable capital it is limited in its long term sustainability.
79. As indicated in Table 6 above, there is a range of climate and environment implications from this
intervention. Although identified risks are medium, these are manageable through the existing policy of ensuring all projects have full EIAs and robust and effective monitoring and evaluation procedures are in place and adhered to.

34
80. Option 2, GAP and Option 4, GET FiT are rated equally both in the Strength of evidence base and the Climate and Environment assessment. Option 3, scaling up financing to MDBs is also rated at par to these two options while Option 5, Contracts for Difference has a weak evidence base. Option 2 and Option 4 are thus the two potential preferred options. Given the ability of Option 2, GAP, to work with projects of a bigger scale and complementarities with GET FiT, this has been identified as the preferred option.
What are the costs and benefits of each feasible option? 81. Do Nothing: We have not tried to forecast exactly how much or what type of additional energy
generation would happen in the do-nothing scenario; rather we have made an assessment of the extent to which any generation that is delivered by GAP is considered additional generation. For the purpose of this analysis, we have assumed that 50% of the generation delivered by GAP will displace fossil fuel generation, while 50% of the generation is additional to what would have otherwise happened (annex II gives further details on this assumption). In the event that energy generation is not considered additional, we have looked at the likely cost and emissions of the alternative generation. Thus the benefits attributed to the preferred option are all relative to the do-nothing scenario.
GAP: Cost- Benefit analysis
82. GAP is likely to support projects that could be commercially viable in the medium to long term, but unlikely to be fully financed by the private sector due to one of the following factors:
i. Tariffs are below a level which allows for a sufficient return for both the debt and equity investors;
ii. Shortage of long-term or patient capital and inability of projects to meet short term high return expectations of projects
iii. Shortage of capital comfortable with the risks in Africa, in particular the risk of construction delays and cost over-runs
83. Illustrative portfolio: As part of programme design, a number of potential projects have been identified that may meet these criteria, some of which are summarised below. Note that this is only an illustrative pipeline:
Table 7: Illustrative pipeline of projects for GAP
GAP Project Country Capacity (MW) Annual Output (GWh) 1 Solar Burkina Faso 20 33 2 Wind Senegal 50 136 3 Bio-energy Tanzania 8.6 15 4 Hydro Zambia 40 228
84. A further 6 illustrative projects have been analysed in the financial model, such that an estimated 10 projects in total are assumed to be initially funded by GAP. A summary of results of the financial model is provided in Commercial Case, Section A. The actual number of projects funded by GAP may vary depending on the size and cost of projects financed. The illustrative projects have been modelled based on the solar and wind projects in Burkina Faso and Senegal respectively, although they vary in size from the projects above.
85. 9 out of the 10 modelled projects would receive quasi-equity capital. The contingent LoC has been modelled for 4 projects (totalling £31m across all of the projects). The above technologies offer a good spread of technologies, countries, and size of project. We have modelled sensitivities on CER prices, the Social value of carbon, Project delays and the percentage of energy that is additional vs. that which displaces fossil fuel fed energy. Below is a summary of both the quantified and un-quantified benefits of GAP.

35
86. This business case has looked at the costs and benefits of 10 projects, which can be funded through the initial finances of GAP. This analysis has not considered the costs and benefits of funding additional projects with revenues that GAP receives, as this is considered too speculative given the timeframe in which the second round of interventions would take place. Rather the revenues that GAP receives are considered a financial benefit, even though no revenues will be returned to the UK Government. As such, sensitivities around the carbon price are shown in the business case to affect the NPV of GAP through reducing the financial returns. In reality, they would also reflect the long term benefits of GAP as less projects could be refinanced if carbon prices are low.
87. Additional energy generation: This energy is valued by consumers at the Long Run Marginal Cost (LRMC) of generation. However much of this value to consumers is already reflected in the price they pay and the financial revenues to GAP. Therefore for this appraisal, the value of energy is determined by the difference between consumers' willingness to pay and prevailing tariffs, which are captured in the financial returns. This effectively represents the Consumer surplus of additional energy generation. Where electricity tariffs are set below the LRMC, we have assumed that energy generation is valued at LRMC rather than the tariff rates, and the difference between the two has been added as a 'social benefit'. Where tariffs are set in line with a cost-recovery level, we have assumed that there is no additional benefit (beyond the revenues) associated with any additional energy generation, although in the African context, supply may be constrained due to various other factors and this does not strictly hold. Annex II gives further details as to how benefits have been monetised.
88. All energy benefits, along with the financial benefits have been discounted at a 10% discount rate in line with current DFID guidance. In the sensitivity analysis, the benefits have been discounted at the 3.5% discount rate which HMT advocates using for benefits accruing in the UK (3.5%). As such, the total value of energy benefits for GAP interventions are as follows:
Table 8: Value of additional energy generation Capacity
increase
(MW)
Maximum Annual Energy generation (MWh)
Annual Energy generation considered additional (MWh)
Value of additional energy generation
(£m NPV)
10% social discount rate
3.5% social discount rate
Central scenario 274 760,000 380,000 4.9 8.6
All energy assumed additional
274 760,000 760,000 9.8 17.2
89. Avoided Emissions: Of the displaced energy generation, we have used the emission factors used in
the United Nations carbon finance Clean Development Mechanism (CDM) to estimate the avoided emissions as well as calculate the estimated CERs generated (where appropriate). Note in all instances, we have assumed that only 50% of the energy generated is considered to displace fossil fuel generation. This produces the following estimates of GHG savings for the different scenarios
Table 9: Estimates of GHG Savings Scenario Gross Carbon
Savings (MtCO2) CERs sold
(MtCO2)
Net carbon savings
(MtCO2)
NPV of GHG savings (£m)4
Central 7.7 3.9 3.9 139
Low social carbon values 7.7 3.9 3.9 76
High social carbon values 7.7 3.9 3.9 199
4 NPV of Carbon is derived from DECC Traded Carbon values

36
Delay to investments 7 2.9 2.9 127
No CERs generated/ sold 7.7 - - 277
If all electricity is considered to displace fossil fuel generation
12.9 6.5 6.5 230
90. Overall Net Present Value: The overall NPV and Benefit Cost Ratios are presented in Table 10.
Table 10: Overall NPV of GAP
All figures £m. NPV Financial NPV*
NPV of Social Benefits Overall NPV (£m)***
Scenario Energy CO2 NPV Variation from central scenario
Benefit Cost Ratio**
Central -10 5 139 134 N/A 2.7 Project delays -13 4 127 117 -17 2.5 High CER prices 1 5 139 145 11 2.8 Low CER prices -11 5 139 133 -1 2.7 High social carbon values -10 5 199 194 60 3.5
Low social carbon values -10 5 76 71 -63 1.9 No CERs generated -11 5 277 272 138 4.4 All energy considered additional -11 10 0 -1 -135 1.0 All energy considered displacement -7 0 231 223 89 3.8
* This represents the discounted flow of revenues received by GAP minus the discounted flow of costs. Revenues include those from CER sales (where appropriate). ** Benefit cost ratio is calculated as all benefits divided by the financial contribution from the UK Government ***Overall NPV= Financial NPV+ NPV of Social benefits. Numbers may not exactly add up because of rounding
91. Encouraging shift to Renewable Energy in SSA: Most of the SSA derives the bulk of its energy needs either from diesel fed generators or renewable energy sources such as hydropower (except for South Africa which has a lot of coal). There is considerable load-shedding in much of the continent, even in urban areas. Politicians are aware of the political dissatisfaction and even protests that result from power outages. When elections are pending, they have often reached for the quick- to- build solution of emergency diesel plants which can be built in often as little as two weeks with providers being ready to take upfront costs of leasing (and then taking back ownership after two years), rather than the longer-term Renewable Energy solution which costs more upfront and is more complex and time-consuming to scope and build even though it may often be cheaper in the long run. Recently, the installation of gas fed generation has been increasing. For example, Aggreko has just announced a 107MW gas power plan in Mozambique to be built in monthsxli. Countries such as Mozambique, Tanzania, Botswana, Zimbabwe and South Africa have large coal reserves and Kenya, Tanzania, Mozambique, Angola, Ghana, Nigeria and Gabon all have large gas resources. In addition, where countries rush to build the situation is often made worse because they often fail to run proper tenders and end up with expensive solutionsxlii.
92. Building low carbon power generation now will enable SSA to avoid turning to high carbon solutions and scale up its energy production using low carbon technologies alone. This can be financially beneficial for the public energy buyers as they are not susceptible to the risks of high and fluctuating oil prices and also promotes a virtuous circle that they can then ensure tariffs are cost-reflective but not excessive so bringing in more renewable energy providers. This is expected to lead to real carbon savings in the future but these cannot be valued quantitatively right now.
37
93. GAP will speed up the building of renewable power plants which is particularly important to avoid the above situation which is sometimes referred to as “high carbon lock-in”.
94. Transformative change: GAP aims to have a transformative impact on the energy sector in SSA: i. Tariff reform: GAP will seek commitments from Governments and relevant Ministries in
countries where it operates, to move towards cost- reflective tariffs and improve the country's renewable energy financing framework, providing a less challenging path for them to attract private sector investment. This is detailed in para 58.c of the Appraisal case.
ii. Use of Carbon Markets: GAP will facilitate the use of the CDM by LICs in sub-Saharan Africa. It should increase the total volume of LIC projects which qualify for CERs. In order to realise net emission reductions from ICF investment, we will enter an agreement with a number of the projects (equivalent to at least half the estimated emission reductions) not to generate CERs, or cancel CERs where generated.
iii. Technological Learning curve: GAP may help to build capacity and knowledge on specific technologies in some countries. However, given the relatively small size of GAP and the fact that most technologies being used are quite tried and tested, the technological effects are likely to be limited.
95. Demonstration Effect and Private investment: GAP will absorb some of the first mover
disadvantages associated with investing in a new technology or region and create a positive demonstration effect by illustrating the following::
i. success of a new business model, new technology or new scale of an existing technology in the region: GAP investment would reduce the risk for later projects as financiers, regulators and offtakers are more familiar and some of the supply chain arrangements have been out in place/ identified.
ii. Ability of projects to generate an acceptable financial return in the medium to long term: If, as expected, GAP investments earn an overall IRR of about 10-12%, this would demonstrate that the projects, are able to produce acceptable returns for patient investors or those willing to accept a small reduction in the interest rate.
iii. risks associated with renewable energy in Africa is lower than perceived: GAP being able to recover its investments would demonstrate this, with the expectation that the cost of subordinated debt and equity for such projects falls in the medium to long run.
iv. effectiveness of policy initiatives to move towards cost-reflective tariffs and regulatory reform: countries that implement these with the help of GAP will have demonstrated the success of such reforms in enabling renewable energy projects to get financed and in attracting private investments.
96. We thus expect that in the longer term, GAP would help reduce the cost and time taken to finance and build renewable energy IPPs in Africa. Commercial subordinated debt lenders are unlikely to mimic the time profile of GAP returns and defer them to a later stage of the project, i.e. to act as ‘patient lenders’. However, in the medium term, we would expect social impact funds and closed end long term funds to invest in the place of GAP. There are currently about 200 social impact funds that are struggling to find projects with a demonstrable social impact to invest in. GAP could potentially exit some investments by sale to such funds and encourage them to invest in other similar projects without GAP involvement. This would ensure sustainability of the GAP investment model beyond its own investments.
97. It is difficult to track or quantify the extent of this demonstration effect and the evidence of its positive impact is therefore weak (para 49). GAP will aim to track this demonstration effect through its knowledge management component (detailed in para 148). The extent of private sector finance invested in projects alongside GAP will be an indicator of GAP’s success at attracting other investors and this will be monitored in the project’s logframe. Given the relatively new and untested nature of the market, there is a risk that investments supported by GAP do not make the expected returns, creating a negative demonstration effect. In the medium to long run, the evidence of positive demonstration effect would be:

38
i. Increase in private investment in renewable energy: GAP expects to catalyse private investment of 1.5 to 2 times its investment, estimated at ~$270m for its initial funding.
ii. Increase in the number of renewable energy IPPs built in Africa: GAP expects to help bring to financial close ~10 renewable energy IPPs by 2016.
98. Benefits of increased reliability of power supply: The flagship report of the Africa Infrastructure Country Diagnosticxliii published in 2010, ‘Africa’s Infrastructure’, estimates that the immediate economic costs of power shortages, as gauged by the cost of running backup generators and forgoing production during power shortages typically ranges between 1% and 4% of GDP in SSA. For countries like Uganda and Malawi, these are as high as 5% and 6% respectively. The cost of individual units for backup power is estimated to easily run to $0.40 per KwH and that of emergency diesel generators used to fuel whole neighbourhoods or small cities, $0.20- $0.30 per KwH. GAP will finance projects that feed energy into the national or regional grid, thus increasing the supply available and hence the reliability of the grid. This will improve the reliability of supply of electricity to households and businesses, helping avoid economic losses. Use of such diesel generation also results in greater GHG emissions and greater local air quality pollutants.
99. Energy Security: A large proportion of energy production in several African countries is diesel oil based. As at 2010 emergency generation capacity which is mostly diesel or heavy fuel based, alone made up 35% of total generation capacity in Madagascar, 48% in Rwanda and 100% in Sierra Leone. According to the World Bank survey the costs of emergency heavy fuel/diesel generation used by the country supplier (even though more cost-effective than individual diesel generators) are high and can be up to 4% of a country’s GDP because of high purchase obligations (usually $0.20 to $0.30 per kwH). These put additional pressure on the country’s fiscal situation, potentially leading to higher borrowing to finance power generation and related debt service obligationsxliv. Oil and diesel prices have been very volatile in the last 5 years and when prices go up they put an additional strain on these countries’ budgets. Most African countries do not have financial buffers to absorb these shocks, which lead to overall economic instability. More reliance on renewable energy will provide a stable source of energy, immune to oil and other fossil fuel price shocks, improving overall energy security in SSA.
100. Job creation benefits: Evidence of job creation through expansion of renewable energy is inconclusive and we have not made an effort to quantify what the potential impact of GAP would be. According to a UNEP report (2008)xlv fossil fuel power plants in the US create one direct job per MW installed. A DFID financed report on Co-benefits of climate mitigation and adaptationxlvi suggests the following numbers for direct jobs created during manufacturing and installation of different technologies:
Table 11: Direct job creation estimates for Renewable Energy technologies
Technology Range of jobs during manufacturing and installation
Range of jobs created during operation and maintenance
Solar Photovoltaic 7.1- 36.4 0.1- 2.5
Solar thermal electricity 6.25- 22.4 0.7- 1.58
Wind power 2.6- 37.5 0.1- 5
Biomass 2- 8.5 0.32- 2.3
Small scale hydro 11.3 0.22
Geothermal 4- 17.5 1.7
101. These reports do not comment on the location of these jobs nor jobs destroyed in replaced diesel or coal power generation. As this is difficult to quantify, we have not valued these in the cost- benefit analysis. However we expect both direct and indirect jobs to be created through GAP financed projects.
102. Air quality and health benefits: Fossil fuel generation produces a large number of local air pollutants, notably Sulphur Oxide (SOx) and Nitrogen Oxide (NOx). Use of cleaner energy has a direct positive impact on air quality and health, notably reduced rates of respiratory disease. UK appraisal guidance advises that for generation in the UK such pollutants have a damage cost of around

39
0.11p/KWh generated. If such a figure was to be applied to GAP, then this would represent around £0.4m of avoided damage costs per annum, assuming that half of the energy generation was displacing fossil fuel generation. Cleaner domestic fuel has a strong health impact, particularly on women. The Bio-fuels ethanol project in Tanzania would potentially provide clean cooking fuel, displacing charcoal with strong health and social benefits.
103. Energy access: We expect a positive impact on energy access, through greater availability of energy for new connections, however we have not looked to estimate these or attribute these to GAP projects given that GAP will not directly engage in energy connections.
C. What measures can be used to assess Value for Money for the intervention? 104. Below is a summary of the key measures that illustrate Value for Money from funding GAP. In
addition to this, further details are provided in the Commercial case section A and B, on VfM throughout procurement and management of GAP. The below indicators will be built into the GAP Logframes where possible and monitored on an on-going basis.
i. GAP administration and management costs ii. Private Finance mobilised iii. Expected Emissions savings iv. Project Net Present Value (NPV) and Benefit Cost Ratio v. Expected increase in installed capacity of renewable energy vi. Additionality
D. Summary Value for Money Statement for the preferred option i. GAP administration and management costs: PIDG overall costs are currently 4.3% of disbursed
Donor contributions, or 1.9% of total donor commitments, including Fund Management costs. These vary substantially between different PIDG Facilities. Project developers like InfraCo Asia have costs of about 13% on donor commitments, reflecting the costs of developing some projects which may not make it to financial close in the higher risk project development business. EAIF, a debt fund has lower costs of about 4%. GAP costs will be minimised using a competitive public tender (See Commercial case Section A for details). These are currently expected to be ~10% of Donor commitments, for first phase reflecting higher costs in the start-up phase and will be monitored and reported on an on-going basis. We would expect these costs to be lower in a second phase, once GAP is fully operational.
ii. Private finance mobilised: GAP will limit its investment in any one project to a maximum of 20% of project value. This implies a minimum mobilization of 4 times as much external funding for all GAP projects (this might be MDB or national Government funding as well as private funding). It will aim however to maintain a minimum 1:2 ratio of GAP Investment: Commercial Private Sector investment on a portfolio basis, while individual projects might vary because the amount of private sector money that can be mobilized is usually lower in Lower Income Countries and in countries where the project is first of its kind and for development reasons it is important that the private sector leverage ratio is not set too high to enable some such projects to occur.
iii. Competitive procurement of a private sector Management Company: A management company for GAP will be procured via public competitive procurement, bringing in specialist private sector skills and maximising VfM.
iv. Expected Emissions savings: GAP projects net carbon emission savings of 3.9 MtCO2 using ICF methodology.
v. NPV and Benefit- Cost ratio: GAP has an overall NPV of £134m and a Benefit- Cost ratio of 2.7, in the central base case scenario.
vi. Expected increase in installed capacity of renewable energy: GAP expects to install ~270 MW of renewable energy capacity in SSA by 2018 (projects financed by 2016).
vii. Additionality: For each project supported, the GAP Manager will need to show without the

40
intervention, there is a high probability that without GAP’s involvement the project would not be able to proceed as quickly or at all.
105. The above VfM metrics and criteria will be included in the investment/operating policies and procedures of GAP, as well as donor logframes, to be monitored on an on-going basis.
41
Commercial Case Indirect procurement
A. Why is the proposed funding mechanism/form of arrangement the right one for this intervention, with this development partner? A.1: Why the proposed development partner is the right one Have you considered alternative delivery options? 106. Alternative delivery mechanisms including other multilaterals have been considered in the
Appraisal Case (Sections A and C) and were not found suitable to address the need set out in the Strategic Case. The concept of GAP was originally conceived by PIDG and presented to PIDG donors as an opportunity to scale up their interventions in the renewable energy space. The PIDG is thus a natural home for GAP. The PIDG has also been assessed to be the appropriate mechanism as detailed below.
Overview of Private Infrastructure Development Group (PIDG): 107. PIDG is a grouping of donors who see mobilising private investment for infrastructure
investment in developing countries as a priority. The PIDG aims to address market and institutional failures that constrain the private sector’s involvement in infrastructure development. DFID was a founding partner of the PIDG in 2002 and continues to be the largest supporter alongside a growing number of other donors. The PIDG catalyses private investment in infrastructure through a range of financing, technical assistance and project development facilities. DFID support to all the PIDG facilities from 2002 to 2011 was £257.4mxlvii. DFID has approved an additional round of funding for the PIDG, of up to £700m for 2012-2014. This includes £223 m of contestable funding, under which well performing PIDG Facilities will be able to bid for additional funds from DFID while poor performers might see their funding cut back. An overview of the PIDG and its existing PIDG facilities is provided in Appendix 3.
What are the institution's strengths and weaknesses as identified by the MARxlviii? 108. The PIDG was assessed as one of the top performing institutions in the Multilateral Aid
Review (MAR)xlix, offering very good value for money - delivering strong results, having tight cost controls and being well aligned with UK development objectives. The key reform areas identified were that it needs to pay more attention to gender issues and transparency. The MAR also recommended that PIDG continue to target low income countries and work for maximum value for money in countryl, by:
1. Developing strategies for targeting poorer and fragile states;
2. Setting targets for reaching more poor people with services, with an emphasis on girls and women;
3. Building evidence that prices charged are affordable; and
4. Developing targets for value for money. 109. Implementing MAR guidance: PIDG is improving its transparency and financial reporting. In
addition: Fragile states: The PIDG made ~70% of its investments in 2011 in fragile states5. It
scored 3 out of 4 on its Fragile Contexts focus.
Women and Girls: PIDG investments in energy sector, mobile phone access and transport have arguably delivered positive impacts for women and girls. However, the PIDG has not reported gender disaggregated data showing impact on women and girls.
5 According to the OECD/ DAC List of Fragile States

42
PIDG have now adopted a methodology to report gender disaggregated data.
110. The PIDG has also been reviewed in the Desk Review of DFID’s Private Sector Infrastructure Investment Facilities in 2008li and was recently favourably reviewed by the International Development Committeelii. A list of recent Evaluations is included in Annex 3, Evidence Underpinning the Intervention.
Do we have a strong Value for Money case for using the institution as a delivery channel? 111. PIDG has strong Management and Governance systems in place that ensure VfM, which are
set out in greater detail in the Management Case. These include:
1. Boards of Directors: The PIDG facilities that are corporate entities (e.g. EAIF, InfraCo Africa, InfraCo Asia and GuarantCo) have experienced Boards of Directors to review and approve all projects submitted to them by their management teams. Either the Board of Directors or a sub-committee of the Board acting as a Credit Committee undertake an in depth assessment of each project, to assess its financial viability, the risks associated with the project and its development impact. On an ongoing basis the Directors monitor the risk of financial loss for each investment and ensure the overall portfolio quality is maintained. Each PIDG company also has an Audit Committee to, amongst others, ensure and monitor the adequacy of the nature, extent and effectiveness of accounting and internal control systems; statutory accounts and financial statements and information; to review arrangements established by management for compliance with regulatory and financial reporting requirements and to review the policies and procedures for company expenditure. GAP will have a Board of Directors and an Audit Committee.
2. The Management of PIDG Facilities is outsourced to private sector service providers who are incentivised via the fee structures set out in the service contracts to ensure they deliver development impacts, while making commercially viable investments to the extent possible. This incentivisation structure requires the PIDG Facility Managers to finance the projects that are cost effective in delivering development results and thus provides an intrinsically incentive to ensure VfM.
3. High Development Value (HDV) Projects: The managers of InfraCo Africa are incentivised to undertake HDV projects. The boards have clear criteria for categorising each project including the impact on poorer consumers and the provision of essential services. Similar incentive criteria could be built in for GAP.
4. Additionality tests: The Board of each of the PIDG Facilities is accountable for ensuring that each of that facility’s investment must be “additional” to ensure that it is attracting in, and not crowding out, private investment. GAP finance will similarly be subject to stringent additionality tests.
5. Monitoring Systems: The PIDG PMU estimates impacts of projects at the time of financial close and then tracks these through its post-completion monitoring system. These arrangements are described in further detail in the Management Case.
6. Contestability Mechanism: GAP will become part of the PIDG performance framework and the recently launched ‘Contestability Framework’ will apply to GAP. UK funding for GAP, including disbursements from this proposed contribution that are scheduled in 2 years or later, will be subject to performance measurement and can be revised down or up. This is explained in detail in Appendix I.
7. Multilateral Aid Review (MAR) and Mid-Term Review (MTR): Para 108 summarises the MAR assessment of PIDG. The MTR of PIDG PMU, completed in June 2012 suggests that comparisons of the PIDG PMU with other Funds have limited value because of its particular structure, but indicate that PIDG operates with an average efficiency and that given the relatively small amount of the PMU cost, there are limited potential economies to be made

43
with a more efficient PMU.
8. Ability to attract other donors: The PIDG, as multilateral organisation has the ability to attract other donors into GAP. Switzerland, an existing PIDG donor and Norway which is currently not a PIDG donor, are considering contributing to GAP. This would also pave the way for Norway to join the PIDG.
9. Private Sector Mobilisation: PIDG has a good track record of using donor (including DFID) finance to mobilise funds from elsewhere. During 2011 the PIDG supported 25 projects that reached financial close attracting $6.9 bn of private investment commitments.
A.2 Why the proposed funding mechanism/form of arrangement is the right one for this intervention 112. The UK will provide £98m to capitalise Green Africa Power (GAP), a new company to be
established under the Private Infrastructure Development Group (PIDG) Trust. DFID’s Private Sector Department (PSD) will provide £50m of Capital Departmental Expenditure Limit (CDEL) and £3m of Resource Departmental Expenditure Limit (RDEL), DFID’s Climate and Environment Department (CED) will provide £20m CDEL and Department of Energy and Climate Change (DECC) will provide £25m CDEL. The latter two are from the International Climate Fund (ICF). We propose to use two funding mechanisms:
1. A Memorandum of Understanding (MoU) with the PIDG Trust for £73m. This is the right mechanism because:
Disbursements will be made upon the demonstration of need by GAP. This avoids building up of funds in GAP, allowing any unused funds to be diverted by HMG to other better performing Facilities.
It allows multiple donors to contribute to GAP, potentially enabling it to achieve better scale.
2. A Promissory Note (PN) with the PIDG Trust for £25m. DECC plan to discuss this with HMT together with other DECC projects in the coming month. This is the right mechanism because:
A legal promise to pay will give comfort to potential private sector managers that the PIDG and the UK have funds available and earmarked to implement GAP, and will thus encourage potential bidders to invest the time and resources required to put together a bid, which in itself can be a significant cost.
A promissory note from the UK is also a strong signal to other donors that GAP will move from concept to implementation and would encourage them to make firm contributions.
It will also enable GAP to engage credibly with project sponsors confident that it has the resources to make investments.
PIDG meets DFID and UK Treasury requirements for a promissory note as it is a multilateral over which the UK has a clear on-going governance and likely future donor role.
At the same time by not putting all our money within the PN, the UK Government is still retaining some leverage over PIDG and GAP and can hold money back for non-performance and divert elsewhere if PIDG or GAP is not appropriate or performing. The two instruments therefore enable the UK Government to meet Fast Start targets and send clear signals without undue risk.
113. Form of financing: DFID’s funding to the PIDG is non-returnable grant to the PIDG Trust. Donor funds are provided by the PIDG Trust to the Facilities as share capital, and not as grants, so that PIDG Trust retains ownership and influence over PIDG facilities.

44
B. Value for money through procurement 114. The roles for the GAP Board of Directors and the GAP Manager are set out in detail in the
Management Case. The manager for GAP will be selected via public competitive tender, conducted by the PIDG’s Programme Management Unit (PMU) on behalf of GAP in accordance with PIDG’s Procurement Policy and Procedures. The PIDG has been classified as a Multilateral by both DFID and the OECD and its procurement systems assessed to be robust. The section below draws on the observations made by the MAR with respect to procurement at the PIDG.
115. Procurement within PIDG: PIDG’s Procurement Policy and Procedures apply to the PIDG Trust and all the PIDG Facilities (except for DevCo, which follows World Bank procurement guidelines). The current policy and procedures are set out in the PIDG Handbook and set out that while the EU Procurement rules do not strictly apply to the PIDG Trust and the Facilities, the PIDG currently voluntarily chooses to conduct all procurement in line with the EU Procurement Directives where these are considered to be the most appropriate means of ensuring value for money, equality of treatment, non-discrimination and transparency. The current Procurement Policy and Procedures will shortly be superseded by a new PIDG Code of Conduct and Operating Policies and Procedures as recommended by the PIDG Governance Reviewliii completed in January 2011. Whilst the approach to procurement under the new Code of Conduct will remain broadly unchanged, the PIDG Procurement Policy and Procedures will be bought in line with either the procurement guidelines of the World Bank or another entity funded by donors, to streamline the procedures to reduce the time and cost of conducting procurement at the PIDG while maintaining the principles of transparency and cost-consciousness.
116. Procurement within PIDG takes place at 2 levels:
1. Procurement by the PIDG Trust – e.g. the appointment of the PMU is subject to open competitive tender, the next re-appointment scheduled in 2013/14 via a public tender.
2. Procurement by the PIDG Facilities: e.g. the procurement of a manager, whose fees and other terms will be determined by the competitive procurement process.
E. What is the intended Procurement Process to support contract award? 117. The selection of the Board of Directors for GAP will be made via a competitive recruitment
process managed by a professional search firm on behalf of the PIDG in accordance with the PIDG’s Appointment and Evaluation of Directors Policy and Procedures.
118. GAP will be managed by a private sector management company selected through a public competitive tender process in accordance with the PIDG’s Procurement Policy and Procedures. The procurement process will be launched by the PIDG PMU upon approval of funding by DFID. Trinity Consortium, the consulting firm advising the PIDG on GAP design, is also engaged to support the procurement process for GAP Management Company. This includes advising on the drafting of Terms of Reference (TORs), and bidding documents for the management company. Key criteria for the GAP Manager, among others, will include:
1. Experience with renewable energy technologies 2. Experience with project finance debt and equity markets 3. Successful track record in making investments in Africa 4. Familiarity with donor priorities and where possible with the PIDG 5. Strong relationships with DFIs, project sponsors and project developers active in Africa
and the ability to build strong partnerships. 6. Strong financial management and fiduciary controls and an absolute commitment to
transparency and strong governance 7. A thorough understanding of African energy and infrastructure markets and the
associated legal and regulatory framework 8. Ability to conduct policy dialogue with African Utilities and Regulators

45
Financial Case
A. What are the costs, how are they profiled and how will you ensure accurate forecasting? 119. Trinity Consortium, the consultants advising PIDG on GAP design have modelled projections of
GAP’s financial statements, including a Balance sheet, Income statements and cash flows. Fees for the GAP Management and Boards have been included as these will be capitalised in GAP Company. Phase I of GAP investments has been modelled. A second round of investments is expected to be undertaken using reflows from first phase investments, but has not been modelled.
120. Key features of the financial model are outlined below:
i. GAP is capitalised with $144m of UK funds (equivalent to £92m6).
ii. It makes investments worth $157m (including by using some reflows during investment period) in 10 renewable energy projects over 4 years, with a construction period of between 1 and 3 years. After this, it does not make any new investments and manages its portfolio of existing investments.
iii. It has a project life until 2033, with 20 years of operation starting in 20137.
iv. The staff and resources requirements of GAP reduce once all investments are made, during the Management and wind-down phase.
v. GAP QEL charges a 5% Running Yield and a 12% full IRR on the GAP Quasi-Equity loan.
vi. GAP charges fees of 2% on the Contingent Line of Credit.
vii. Management and operational costs are about 10% of GAP donor commitments.
viii. Portfolio and CER assumptions are in line with those for the economic appraisal.
ix. GAP’s overall Internal Rate of Return (IRR) is 3.82% in the central scenario.
121. GAP’s Operating cash flow for the first 10 years is shown below:
Table 12: GAP’s Operating Cash Flows and donor funding requirements
Total (USD '000) 2013 2014 2015 2016 2017 2018 2019 2020 2021 2022 2023
Operating cash flow (6,729) (74,036) (16,843) (35,306) (20,280) 16,691 17,900 18,791 19,685 21,087 19,916 Shareholders equity contributions
144,194 8,729 74,036 16,843 29,306 15,280 - - - - - -
Cash available for recycling - - - - - (25,316) (17,940) (18,868) (19,759) (21,208) (19,799)
*Bracketed numbers indicate outflows
122. Reflows into GAP could potentially start in year 4 or 5 and it becomes cash positive quickly after the investment phase, in year 6 or 7 of operation and can start re-investing in further projects. It generates cash of $114m in 2018- 2023, with inflows continuing into future years. Thus GAP is expected to recover the investments it makes. If it is assessed to be performing well and donors should like to step up their contributions, doing so in 2016/17 would enable GAP to continue to make meaningful
6 We have budgeted £98m for the intervention. £3m is RDEL for set-up costs, M&E and Knowledge management. We have budgeted £95m for investment costs against £92m in the financial model, which should be taken as an indicative amount, allowing for foreign exchange fluctuations and other variations in cost depending on the outcome of the procurement. 7 The model operates from 2012 to 2032 but because of delays in setting up and approval all calculations have been delayed by one year. All model assumptions are updated and current.

46
investments every year.
123. We have modelled additional sensitivities on the financial performance of GAP.
i. If 50% of GAP projects suffer from construction delays of 1-2 yrs, GAP’s IRR drops to 3.42%
ii. If GAP is only able to obtain a final project level IRR of 9- 11% rather than 12%, the overall GAP IRR drops to 2.35%
iii. If the construction delays on 5 projects and lower returns on all 10 projects happen simultaneously, the GAP IRR drops to 2.13%
iv. If the Plant load factor of several projects falls, i.e. the natural resource available to the project depletes or due to other factors the plant operates at less than expected capacity, most of the hit is taken by the project equity. The GAP QEL or CLoC remain in place for longer and continue to earn an interest rate and hence the GAP IRR rises. However if the plant load factor was to fall significantly, the project could potentially fail and would need an overall restructuring of its financing.
We would expect GAP to recover its investments and cover management costs. The low IRRs of between 2 and 4% suggest that the potential for profits to plough back into additional projects is limited. Any financial upside for GAP would depend on the state of carbon markets- whether carbon prices recover sufficiently for it to be profitable for GAP to accredit and sell the CERs pertaining to the non-ICF funds in GAP.
124. The UK intends to contribute £95m of CDEL (equivalent to $149m to allow a small buffer over the modelled estimates) and £3m of RDEL over the 2012 to 2015, the period for which UK spend was allocated by the Spending Review in 2010 (SR10 period) to the phased implementation of GAP. UK contributions will be provided by DFID’s Private Sector Department (PSD), DFID’s Climate and Environment Department (CED), and the Department for Energy and Climate Change (DECC). The latter two contributions will be from the UK’s £2.9 billion International Climate Fund. The proposed funding levels by year are indicated in Table 13 below.
Table 13: GAP Spending Profile £m 2012/13 2013/14 2014/15 Total DFID PSD CDEL 15.0 15.0 20.0 50.0 RDEL 0.0 1.5 1.5 3.0 DFID CED CDEL 0.0 10.0 10.0 20.0 DECC CDEL 5.0 10.0 10.0 25.0 Total 20.0 36.5 41.5 98.0
125. To ensure accurate forecasting throughout the year, we will take the following steps:
A payment schedule will be agreed with PIDG Trust and GAP for phased draw down of funds according to estimated funding needs and will be included in the MoU and Promissory Note between UK Government and the PIDG Trust.
An annual projection of spend will be obtained from GAP at the start of each financial year, based on its pipeline and funding needs.
The actual spend against forecast will be monitored and updated regularly by DFID and DECC, with support from the PIDG Programme Management Unit (PMU) and GAP.
B. How will it be funded: capital/programme/admin? 126. As outlined in Table 13 above, £95m will be from Programme capital budget and £3m will be from
the Programme Resource budget.
£95m will be used to capitalise the GAP Company. As an asset will be created, this has been budgeted from CDEL.

47
£3m will be used for set-up costs, M&E and knowledge management and has been budgeted from RDEL
C. How will funds be paid out? 127. HMG will enter into two funding instruments with the trustees of the PIDG Trust. Two funding
instruments will be used:
An MoU for £73m A Promissory Note for £25m
Each funding instrument will set out the disbursement schedule, conditions for disbursement, reporting requirements, bank account details and period of the funding instrument, amongst others.
128. HMG, the trustees of the PIDG Trust and GAP will also enter into a Funders’ Agreement which will set out the commitment of each funding entity (DFID and DECC) to the PIDG Trust to support GAP and the terms upon which the funds will be made available to the PIDG Trust. The Funder’s Agreement will also regulate the allocation of any proceeds from the PIDG Trust’s investment and the arrangements between the PIDG members funding GAP.
129. DFID provides grants to the PIDG Trust as an investment and there is no expectation of a return. The grants include a provision that if the PIDG Trust has not spent disbursed amounts of the grant by the time the grant expires, DFID can request the return of the unspent disbursed amounts. This would then be classified as negative Official Development Assistance whereas if it is kept within the PIDG then this is not the case.
130. Disbursements from the PIDG Trust to GAP will be made on the basis of need and will likely be in the form of share subscriptions. The PIDG Trust will not request funds from HMG to fund these share subscriptions until it has received a request from the GAP Board and any supporting documents required under the terms of the Funders’ Agreement. Disbursement requests will set out the amount requested and will attach supporting documents setting out the funding needs, cash balance and liquidity position of GAP to avoid payment being made in advance of need. HMG may raise questions or request further information before disbursement of funds if we are not satisfied that the conditions for disbursement have been met.
131. It is anticipated that UK funds will be disbursed to the PIDG Trust in two annual payments. The above flow of funds diagram shows the flow of UK funds through the PIDG Trust to GAP and repayments from GAP investments.
132. Repayments in the PIDG: In accordance with the Funders’ Agreement and the PIDG Constitution, if the PIDG Trust receives any proceeds from its shareholdings that are funded by DFID (i.e. the receipt of dividends or reimbursement of share capital if a PIDG company is wound up), the PIDG Trust may recycle these funds for other developmental purposes in consultation with DFID. The funds are therefore considered to be re-deployable capital. If such funds are not recycled within two years of the proceeds being received by the PIDG Trust, they (or any unspent portion thereof) will be returned to DFID. Such returns would not be treated as negative ODA if recycled within the PIDG.
Project 3
Project 2
Project 1
Project N
GAP Fund
PIDG Trust
GAP Donors, inclDFID, DECC
PIDG Programme
Management Unit
GAP Fund Manager
CERs
GAP Capital returns
CER buyer (non ICF Funds) CERs
CER Revenue
Secretarial, Management services
Fund Management
Equity
Grant

48
D. What is the assessment of financial risk and fraud? 133. GAP is proposed to be instituted as a new PIDG facility. The MAR assessed that the structure and
incentives for PIDG facilities ensure strong stewardship of the portfolio. GAP will be required to adopt, and confirm compliance with, the PIDG’s Anti-corruption and Integrity Policy and Procedures and any national and international legislation regarding fraud and corruption, money-laundering and the financing of terrorism, e.g. UK Bribery Act 2010.
134. Financial risks associated with UK support to GAP are mitigated by the strength of the PIDG financial systems and controls in respect to making bad business decisions and in preventing fraud and corruption. The PIDG systems were assessed by the MAR as strong. As noted above, each PIDG company has a Board of Directors and Audit Committee who are responsible for monitoring and managing the financial risks of the PIDG companies and for providing the PIDG Members with a copy of each company’s audited financial statements and auditor’s report on internal controls. GAP is expected to have the same governance structure. The GAP Board will have a credit committee which will reach an opinion on whether each new investment is commercially viable before funds are invested.
E. How will expenditure be monitored, reported, and accounted for? 135. DFID will undertake monthly monitoring of disbursements made and planned to the PIDG against
annual forecasts and will conduct Annual Reviews of project performance. Financial monitoring and reporting for GAP will be carried out in accordance with the reporting obligations set out in the Funders’ Agreement for GAP, which will be in line with the reporting obligations set out in DFID’s (or DECC’s) funding instrument for GAP.
The Boards of all PIDG companies have Audit Committees and each PIDG company and the PIDG
Box 5: PIDG’s fiduciary management and anti-corruption safeguards All PIDG participants
are subject to national and international laws and regulations regarding fraud, bribery, money laundering and the financing of terrorism (for example UK Bribery Act 2010);
must comply with the PIDG’s zero-tolerance policy to fraud and corruption (in the PIDG Code of Conduct and its Anti-Corruption and Integrity Policies and Procedures).
Management and reporting structures for fiduciary management
a) At PIDG level: PIDG’s principal anti-corruption control is its management and reporting structure, as detailed in the
Management Case. the PIDG Trust commissions regular reviews of each PIDG facility, which will include compliance
with PIDG Operating Policies and Procedures The PMU and principal trustee are subject to PIDG’s Anticorruption and Integrity Policies and
Procedures and the UK Bribery Act 2010.
b) PIDG facilities All PIDG facilities are required to report any allegations of anti-corruption and integrity violation issues
to the Governing Council via the PMU on a timely basis. The PIDG control framework includes the following key guidance for PIDG facilities
o PIDG code of conduct o Operating policies and procedures o Risk assessment & mitigation o Annual compliance sign off by each facility
If corruption is detected, any allegation of fraud must be reported to the board of the facility, the PMU and the chair of the Governing Council of PIDG Donors.

49
Trust is required to produce annual audited accounts. Annual audited accounts are circulated to donors for review and identify the amounts the PIDG Trust and the various PIDG facilities have received. The PIDG Trust’s audited accounts are published on the PIDG website (www.pidg.org).
The managers of each facility are required to report to the Directors of that facility, who in turn are responsible for ensuring that company investments are in line with the investment policy that donors set.
Management Case
A. Oversight 136. GAP will be incorporated as a company owned by the Private Infrastructure Development Group
Trust (PIDG Trust). This section provides an overview of the Governance and Management arrangements at the PIDG and how they will apply to GAP. Governance standards were found to be strong in the PIDG Governance Review (2011). Key findings are presented in Annex 3.
137. The PIDG was established in 2002 on the basis of a Memorandum of Understanding entered into between the members of the PIDG. Subsequently the members have adopted a Constitution and will shortly adopt a draft Code of Conduct which will govern how the PIDG operates. Each facility has a set of Operating Policies and Procedures which are available on the PIDG website. The entities below are key components of the PIDG management structure:
1. The Governing Council: The PIDG Governing Council which consists of a representative from each PIDG memberliv is the primary oversight body of the PIDG. The Governing Council sets the overall strategy of the PIDG and makes decisions on operational issues which affect the PIDG as a whole. Decisions relating to individual facilities are taken by representatives of the members funding that facility. The Governing Council meets twice every year, to review each Facility’s performance in the previous 6 months and to discuss any matters of strategic and operational importance.
2. PIDG PMU: The Governing Council is supported by the PIDG Programme Management Unit (PMU) which functions as the secretariat to the PIDG. 2.1. The PMU is the central contact point for the PIDG and coordinates activities between the PIDG
members and the individual facilities 2.2. It plays a pivotal role in strategy formulation, implementation and business development. 2.3. The PMU team also offers support to the PIDG members in discharging their responsibilities as
members of the Governing Council and as sponsors of individual facilities. The PIDG PMU function is contracted out to a service provider, currently MDY Legal. An independent review of the PIDG governance was carried out in 2011 and a mid-term Performance Review of the PMU is currently being finalised.
3. PIDG Trust: The GAP Donors (i.e. the PIDG Members funding GAP) will invest in GAP through the PIDG Trust, an independently managed trust, which allows flexibility in operations. The PIDG Trust’s principal trustee is SG Hambros Trust Company Limited, a professional trustee services provider based in the UK. The PIDG Trust, whilst being the shareholder of record, performs an administrative fiduciary function, and the trustees do not have any discretion in relation to the investment activities. This means that the PIDG members, through the Governing Council, and supported by the PMU, exercise the shareholder rights. The trust fund structure enables PIDG members to supply their funding in a flexible manner and to react quickly and flexibly towards changing market needs.
4. PIDG Company Boards: Each PIDG company has an independent Board of non-executive directors. The Boards are predominately private sector individuals with a detailed understanding and experience of both the operations of the underlying vehicles and the policy objectives of the PIDG members. The Boards have a responsibility for ensuring that the management companies deliver on the strategic goals set by the PIDG members. The chair of each board is responsible for

50
regular reporting to the members usually through quarterly meetings in accordance with the requirements of the Funders’ Arrangement. GAP will be established accordingly and the appointment of an independent Board will be the first step in setting up of the GAP company management structure.
5. Executive support to Boards: Recent evidence on the functioning of Boards in the PIDG indicates that the Board of Directors of GAP would benefit from executive support to help with the management of administrative and financial matters. GAP would be expected to have such executive support for its Board.
6. PIDG Facility Managers: Most PIDG Facilities are managed by commercial private companies,
with dedicated teams set up to deliver the services to the PIDG facilities. This enables the PIDG facilities to bring in specialist skillsets required for making investment proposals in often challenging and new businesses.
B. What are the Management Arrangements for implementing the intervention? 138. GAP will be managed through a contract with a private management company that will be overseen
by the GAP Board. It will have the ability to contract multiple management companies at the same time, to work on different regions or rectors within Africa, as needed. This would enable GAP to benefit from sector or region specific skills and maintain a healthy competition between managers within GAP. GAP would thus not have a non- exclusive contract with a single management company. At the start, GAP will appoint one management company, which will be selected through public competitive procurement, using the process described in Section A of the Commercial Case. GAP will retain the ability to appoint one or more management companies (perhaps covering different regions) should this be necessary. The facility will be managed as a commercial company within the parameters set by the GAP Donors and board and with a management company incentive structure designed to encourage delivery against the donors’ (‘shareholders’) priorities. The PIDG Programme Management Unit is managing the GAP concept design and implementation (funded by DFID and Norwegian Agency for Development Cooperation, Norad) on behalf of the PIDG.
139. DFID estimates that it will require 40% staff time of one Full time Adviser in the first year after GAP approval to monitor the establishment of GAP and initial investments made by it. In future years, 20% of one Full time Adviser/ Programme Manager would be dedicated for project management, in addition to 5% staff time of one Adviser/ Programme Manager from DECC.
C. What are the risks and how these will be managed? 140. GAP is an innovative project and thus entails high risk in certain areas. Table 14 below provides a
brief description of each risk, its possible impact on the project and measures proposed or already taken to mitigate the risk.
Table 14 : Risks and Mitigating measures
Risk Possible impact on Project Mitigating Measures
HIGH RISK
1
Slow implementation of GAP: Delays in setting up/ finding and structuring transactions lead to delay in closing deals.
Full implementation of GAP to achieve 273MW of installed annual generation capacity by 2018 is slower than expected.
1. HMG and other donors to be kept up to date on set-up and implementation progress through Quarterly reporting. 2. Strict logframe targets on set-up and deal-closure to incentivise GAP management to stay on track.
2
Project cost over-runs and time delays due to high construction risks, red tape and bureaucracy.
These delays could lead to portfolio losses for GAP.
1. A sensitivity with delays on 20% of the portfolio has been tested. 2. HMG will receive regular updates on pipeline and portfolio of PIDG during

51
implementation phase, to be able to address any risks.
3
Limited demonstration effect: GAP projects do not create a strong demonstration effect that leads to replication of the technology or the business model by other project financiers and developers.
GAP finances successful projects bur does not have a broader positive effect on the sector.
1. GAP will aim for project and policy additionality to ensure that projects financed by GAP have the potential to move the sector forward. 2. An explicit knowledge management component will aim to capture and document the demonstration effects of GAP.
4
Countries do not move towards cost reflective tariffs: Recipient countries may not make commitments to move towards cost-reflective tariffs or may not follow through on these commitments.
GAP finances successful projects but does not have a broader positive effect on the sector.
1. GAP FM will hold extensive policy dialogue with the recipient country to establish the feasibility of moving towards cost-reflective tariffs. 2. GAP will aim to set a mutually agreed timeline with the offtaker and the Government, on implementation of cost-reflective tariffs to avoid unrealistic targets and increase the likelihood of follow-through.
5
GAP interest rates and fees set at the wrong level: As this is a new instrument there is a possibility that the interest rates on GAP instruments are set too high or too low.
If charges are set too high, there may be low take-up of GAP instrument; If charged are set too low, GAP should see a high demand for its intervention and projects that benefit from it could make an excessive return.
1. GAP has the ability to continuously adjust its charges for new projects, in response to market needs. 2. Every project will undergo financial analysis and due diligence to ensure only appropriate returns accrue to the private sector sponsors and financiers. 3. GAP structure includes a payments waterfall such that any returns in excess of a minimum threshold will accrue to GAP until a pre-set limit.
6
Projects do not make adequate returns: GAP projects may fail to make a financial return or to deliver CERs, because of a range of underlying risks and changing market conditions.
GAP may become a loss- making entity that donors need to re-capitalise; Creates a weak or negative demonstration effect on viability of renewables technologies; Low development benefits and GHG Emission reductions.
1. GAP will make investments only after sufficient project due-diligence and will maintain close contact with the project companies during construction phase. 2. GAP donors may intervene to unblock any political or administrative blockages. 3. Lessons will be drawn from any such projects which would still be valuable learning for the sector.
7
Lack of impact on poor populations GAP may finance projects that benefit larger Commercial Businesses and elite consumers without increasing energy use for productive activities by poor people
GAP fails to achieve direct benefits to the poorest, and cannot track benefits delivered through economic growth.
1. GAP Managers may be incentivised to track 'High Development Value' approaches, which lead to benefits for poorer energy consumers. 2. GAP projects can be encouraged to coordinate with other donor initiatives that aim to extend energy access and improve affordability.

52
MEDIUM RISK
8
Lack of donor commitments: Other donors do not make commitments to GAP.
Scale up of GAP will be difficult to achieve and its transformative impact on the sector limited.
1. UK is working with Norway and Switzerland, who have expressed an interest in GAP, to ensure GAP meets their policy objectives. 2. The GAP model has been built only to reflect HMG funding.
9
No additionality/ crowding out of private sector: GAP uses HMG funds for projects that would be developed by the private sector anyway, without public funds.
UK ODA Funds which could have been used to finance alternative projects with high development impacts are not undertaken; In the worst case, GAP investments crowd out private sector investors and push the sector backwards in terms of private sector's ability to finance renewable projects.
1. In the current market, no renewable energy deals have closed in Africa without some nature of public finance and even these have been difficult in the last 2 years. 2. GAP's instruments become less competitive with the private sector in less risky environments. 3. GAP Donors, via the Governing Council, will monitor GAP's investments and can direct the Boards to avoid investments in sectors or countries that are deemed ready for stand-alone private sector investment.
10
Low take up of innovative instruments: GAP QEL and CLoC are innovative instruments which the market may not take up.
The structures embodied in GAP QEL and CLoC would have been demonstrated to not be appropriate for financing renewable energy in Africa.
1. GAP may consider alternative instruments to finance renewable energy projects and retains the flexibility to adopt these upon donor approval. 2. The demand for GAP instruments has been scoped out via detailed discussions with potential investee projects.
LOW RISK
11
Low Portfolio returns: All or most projects in the GAP project portfolio produce poor or negative returns.
GAP is likely to fail in its ambition to crowd in commercial players and may create a negative demonstration effect for financing of renewables or for specific technologies, depending on causes for failure. Re-capitalisation by donors is unlikely to be considered.
1. GAP Management will be incentivised via their remuneration structure to invest in projects that are commercially viable and make an acceptable return. 2. GAP is portrayed as an innovative instrument, the failure of which would add to the evidence and knowledge available on financing of renewable energy.
12
Resettlement of people, Environmental damage or public opposition to projects: Some renewable technologies such as hydropower, solar farms and bioenergy plants may involve resettlement of people and may cause other broader environmental damage.
Long term environmental damage; Reputation of GAP and Funding donors in the market is negatively damaged.
1. Environmental and Social Impact assessments in line with international standards will be undertaken by GAP in relation to all potential projects.
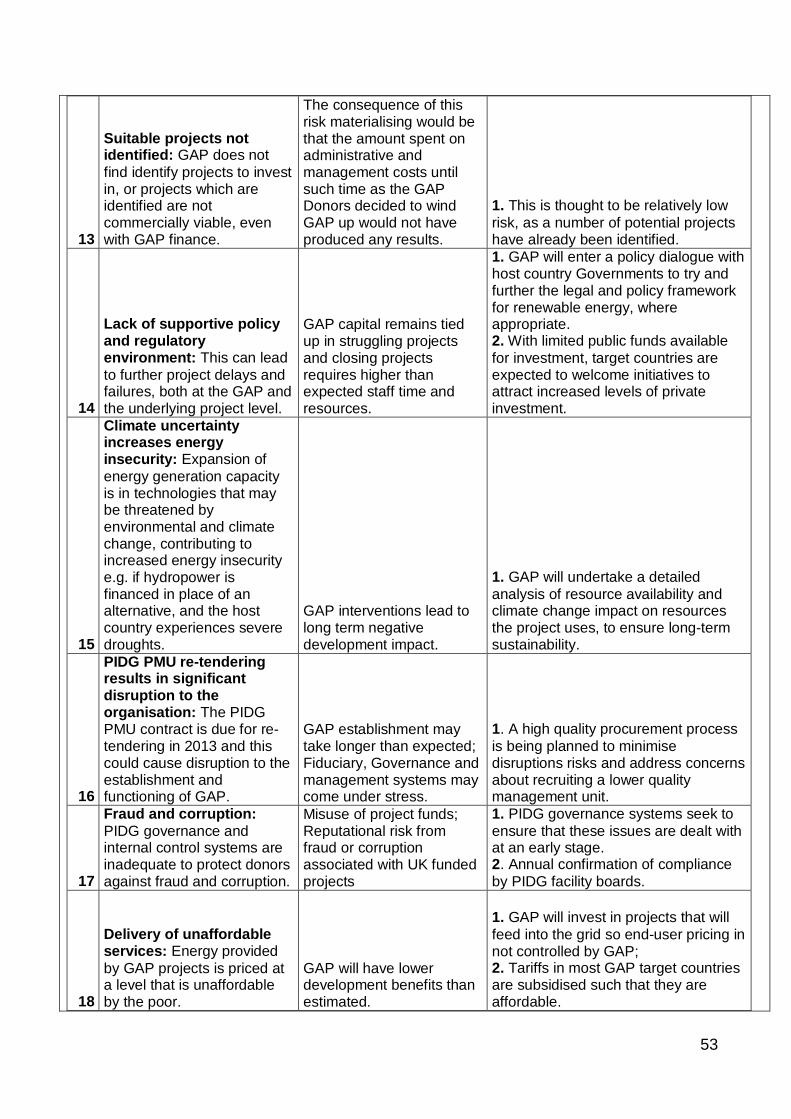
53
13
Suitable projects not identified: GAP does not find identify projects to invest in, or projects which are identified are not commercially viable, even with GAP finance.
The consequence of this risk materialising would be that the amount spent on administrative and management costs until such time as the GAP Donors decided to wind GAP up would not have produced any results.
1. This is thought to be relatively low risk, as a number of potential projects have already been identified.
14
Lack of supportive policy and regulatory environment: This can lead to further project delays and failures, both at the GAP and the underlying project level.
GAP capital remains tied up in struggling projects and closing projects requires higher than expected staff time and resources.
1. GAP will enter a policy dialogue with host country Governments to try and further the legal and policy framework for renewable energy, where appropriate. 2. With limited public funds available for investment, target countries are expected to welcome initiatives to attract increased levels of private investment.
15
Climate uncertainty increases energy insecurity: Expansion of energy generation capacity is in technologies that may be threatened by environmental and climate change, contributing to increased energy insecurity e.g. if hydropower is financed in place of an alternative, and the host country experiences severe droughts.
GAP interventions lead to long term negative development impact.
1. GAP will undertake a detailed analysis of resource availability and climate change impact on resources the project uses, to ensure long-term sustainability.
16
PIDG PMU re-tendering results in significant disruption to the organisation: The PIDG PMU contract is due for re-tendering in 2013 and this could cause disruption to the establishment and functioning of GAP.
GAP establishment may take longer than expected; Fiduciary, Governance and management systems may come under stress.
1. A high quality procurement process is being planned to minimise disruptions risks and address concerns about recruiting a lower quality management unit.
17
Fraud and corruption: PIDG governance and internal control systems are inadequate to protect donors against fraud and corruption.
Misuse of project funds; Reputational risk from fraud or corruption associated with UK funded projects
1. PIDG governance systems seek to ensure that these issues are dealt with at an early stage. 2. Annual confirmation of compliance by PIDG facility boards.
18
Delivery of unaffordable services: Energy provided by GAP projects is priced at a level that is unaffordable by the poor.
GAP will have lower development benefits than estimated.
1. GAP will invest in projects that will feed into the grid so end-user pricing in not controlled by GAP; 2. Tariffs in most GAP target countries are subsidised such that they are affordable.

54
D. What conditions apply (for financial aid only)? 141. The proposed contestable financing regime is set out in detail above in the Strategic and
Commercial cases. Future funding levels for GAP will be conditional upon achievement of stringent targets linked to development outcomes as measured in the log frame. No further conditions apply to UK funding of GAP.
E. How will progress and results be monitored, measured and evaluated? 142. GAP will be monitored, reported on and evaluated in accordance with the PIDG procedures. 143. Monitoring: DFID monitors PIDG’s performance through rigorous harmonised mechanisms.
a. Logframes: PIDG logframes report on PIDG development outcomes and DFID along with the other donors have agreed to use them as joint reporting frameworks. The attached GAP Logframe has been developed in consultation with the PIDG PMU Development Adviser. The logframes are all live documents which are annually updated and improved subject to the agreement of donors.
b. Business Plans: PIDG companies are required to submit an annual Business Plan to the PIDG members funding them.
c. Results Monitoring Framework: The PIDG operates a results monitoring system at the project, facility and PIDG levels, as outlined in its Results Monitoring Handbooklv.
d. Results database: All project level results are entered into a results monitoring database used for project tracking by the PMU. All donors have full access to this database.
e. Project result monitoring: At the project level, starting from project approval the facility manager tracks expected outputs and outcomes for the project, against an agreed list of targets including Logframe targets such as PSI committed, number of people benefitting from new or improved services etc. This tracking done via a PIDG standard Results Monitoring Sheet (RMS), which is presented in Appendix II. For GAP projects, the new Climate related indicators will be added to this sheet.
f. Post completion monitoring: Once a project is operational and delivering services on the ground, the project RMS is updated, comparing actual achievement against original expectations and highlighting areas that need to be addressed. Summary post completion monitoring results are reported quarterly for review by both facility boards and donors to enable adjustments to be made to policies/ strategies or other arrangements as necessary in order to address any areas highlighted.
g. The scope of the monitoring system has been increased over the past 12 months in response to donors’ concerns. This has included investigating mechanisms for improved gender disaggregated reporting of development impacts and the introduction of climate related categorisation of the PIDG portfolio of projects.
144. Reporting: The PMU and PIDG facilities report to donors in accordance with the reporting obligations agreed in the relevant Funders’ Agreement, but typically this will be as set out below. Additionally HMG will undertake its own independent reviews as indicated below: a. Statutory accounts: PIDG companies produce annual audited financial statements by a date
agreed in the Funders’ Agreement, typically within 120 days of the company’s financial year end, and audited financial statements are currently available 6 months after each year’s end. It is expected that GAP’s financial year will be the same as the PIDG Trust i.e 1 January – 31 December. We will consider the possibility for GAP to make its accounts available to donors 3 months after year end, in line with best practice.
b. Annual Report and Reviews: a. PIDG publishes an Annual Report, available on the PIDG website, which contains an
overview of the PIDG’s activities and results.

55
b. DFID will also undertake an Annual Review of GAP, reviewing progress against targets. This Annual Review will be undertaken jointly by DFID and DECC, with DFID’s PSD leading and CED and DECC leading on the ICF Indicators.
c. 6 monthly reports: a. At each twice-yearly PIDG meeting, GAP will report progress against its logframe targets.
The PIDG Executive Director also presents a 6-monthly report on the PIDG. b. HMG will undertake a 6 month review of GAP, which DECC will lead on with support from
DFID. This will assess whether target on setting up on GAP have been met in the first year and performance targets as detailed in the Logframe in later years.
d. Quarterly reports: GAP will provide quarterly management accounts and an update on activities to donors, followed by a teleconference where GAP will be available to answer any questions and take guidance from donors.
145. Evaluation: The PIDG also operates a well-established system for evaluating and reviewing all its
facilities on a regular basis. All PIDG facilities are subject to a three- to four- yearly mid-term review by independent reviewers who look at all aspects of operations, including an in-depth look at a selected group of projects. Evaluations are subject to detailed discussion at one of the twice-yearly meetings of donors and action is taken to address identified shortcomings or areas of concern. GAP will expect to undergo a first Evaluation in 2016/17.
146. In line with other PIDG facilities, the evaluation would be expected to adhere to DAC Quality Standards (relevance, effectiveness, efficiency, sustainability and impact) and address the key areas, structured within the five DAC criteria. The PIDG PMU would carry out an international competitive tender in line with PIDG procurement policies to select the evaluation review firm and would require the evaluation reviewers to have a thorough understanding of what each of the DAC evaluation criteria involves in the case of GAP, both the general technical issues involved with PSI in renewable energy infrastructure and the particular problems, options and approaches appropriate in facilitating the operations of the facility through the use of targeted grant funding. The PMU also requires the reviewers to have understanding of the PIDG mission and of political, social, economic, and financial issues and their impact on infrastructure project development, implementation and financing, together with specific proposals on how all the issues will be researched, data gathered will be analysed, and findings presented. In particular, the GAP review will seek to address the following issues of relevance to GAP:
1. Relevance and additionality: The evaluation will evaluate the extent to which the instruments provided by GAP and their application are relevant for achieving additional, pro-poor, clean energy generation, growth and poverty reduction and for moving forward the renewable energy financing frameworks in the target countries.
2. Demonstration effect: The demonstration effect of GAP and other investment funds is currently not well supported with evidence. The evaluation will seek to measure demonstration effect and as a minimum will seek to correlate in-country increases in renewable energy production following investments by GAP.
3. Comparison of funding mechanisms: The evaluation will seek to compare the different outcomes achieved by the different funding mechanisms in the GAP programme, namely contingent capital/ guarantees and quasi- equity capital and make recommendations for continuation of these instruments or adoption of alternative instruments based on evidence gathered in the first 4 years of functioning of GAP.
147. The development impacts of infrastructure investment programmes are difficult to calculate and to attribute to the programme using accepted scientific methods (e.g. through the use of a counterfactual). However, the evaluation will seek to assess the increase in private sector investment for clean energy leveraged by GAP and the benefits of the additional power generated by GAP funded projects in terms of environmental, economic and social benefits. In addition, PIDG as a whole might be subject to

56
independent reviews such as ICAI from time to time, which will cover GAP as one of the PIDG facilities.
148. Knowledge Management: GAP will incorporate an explicit knowledge management component to capture lessons learnt from GAP projects on an on-going basis. For example, the current evidence base linking energy and benefits for poor people largely overlooks the impact of reliable, on grid electricity supply on poor people’s productive activities. More useful lessons learnt will only come out after investments are made and the management will be fully focussed on getting the portfolio established in the earlier years thus knowledge management could increase during the fund's life as the portfolio becomes established and results and impact can be assessed. Also, there will be KM activities outside of the fund but at the PIDG level - an example of this is PIDG's recent systematic review of DFIs and other ad hoc thematic development impact studies carried out across the PIDG (e.g. the recently launched indirect job creation study) as well as the the cycle of 3-4 year facility reviews.
149. GAP will aim to produce one lessons-learnt paper per annum in years 2 and 3 after establishment, stepping up this component from year 4 onwards. The GAP budget includes costs to cover 10 days per year for a communications/ results adviser in years 2 and 3 to assist GAP to complete this component. Additional funds are available for a strengthened knowledge focus in later years. This might be via a higher number of papers or more in depth analysis of specific issues/ arranging workshops and dissemination activities. These are likely to be coordinated by the PIDG PMU as part of their overall knowledge management.
150. Since 2011, PIDG is a member of the Development Results Indicators Harmonisation working group and will be able to both feed lessons from GAP into this group and apply lessons to GAP. PIDG Members are currently anticipating establishing a budget window for further development impact measurement and analysis activities at the PIDG level.
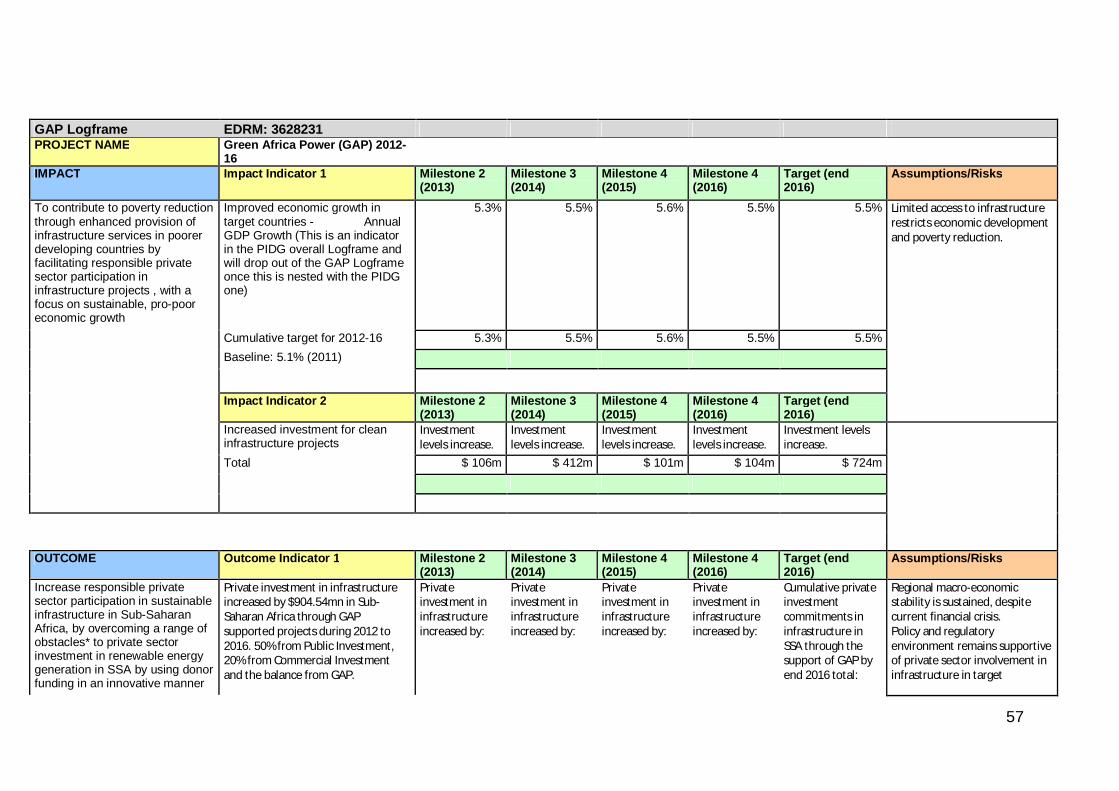
57
GAP Logframe EDRM: 3628231 PROJECT NAME Green Africa Power (GAP) 2012-
16
IMPACT Impact Indicator 1 Milestone 2
(2013) Milestone 3 (2014)
Milestone 4 (2015)
Milestone 4 (2016)
Target (end 2016)
Assumptions/Risks
To contribute to poverty reduction through enhanced provision of infrastructure services in poorer developing countries by facilitating responsible private sector participation in infrastructure projects , with a focus on sustainable, pro-poor economic growth
Improved economic growth in target countries - Annual GDP Growth (This is an indicator in the PIDG overall Logframe and will drop out of the GAP Logframe once this is nested with the PIDG one)
5.3% 5.5% 5.6% 5.5% 5.5% Limited access to infrastructure restricts economic development and poverty reduction.
Cumulative target for 2012-16 5.3% 5.5% 5.6% 5.5% 5.5% Baseline: 5.1% (2011)
Impact Indicator 2 Milestone 2
(2013) Milestone 3 (2014)
Milestone 4 (2015)
Milestone 4 (2016)
Target (end 2016)
Increased investment for clean infrastructure projects
Investment levels increase.
Investment levels increase.
Investment levels increase.
Investment levels increase.
Investment levels increase.
Total $ 106m $ 412m $ 101m $ 104m $ 724m OUTCOME Outcome Indicator 1 Milestone 2
(2013) Milestone 3 (2014)
Milestone 4 (2015)
Milestone 4 (2016)
Target (end 2016)
Assumptions/Risks
Increase responsible private sector participation in sustainable infrastructure in Sub-Saharan Africa, by overcoming a range of obstacles* to private sector investment in renewable energy generation in SSA by using donor funding in an innovative manner
Private investment in infrastructure increased by $904.54mn in Sub-Saharan Africa through GAP supported projects during 2012 to 2016. 50% from Public Investment, 20% from Commercial Investment and the balance from GAP.
Private investment in infrastructure increased by:
Private investment in infrastructure increased by:
Private investment in infrastructure increased by:
Private investment in infrastructure increased by:
Cumulative private investment commitments in infrastructure in SSA through the support of GAP by end 2016 total:
Regional macro-economic stability is sustained, despite current financial crisis. Policy and regulatory environment remains supportive of private sector involvement in infrastructure in target

58
in order to stimulate private sector investment in large-scale renewable energy generation and support low carbon, climate resilient growth in SSA (GAP).
Commercial Financing committed to GAP- backed projects (not including DFI)
$ 40m $ 155m $ 38m $ 39m $ 271m countries. Sufficient magnitude of funding raised for GAP to complete some of the landmark larger projects such as Turkana, Bagamoyo and Lake Kivu Phase 2. GAP Company established and Fund Manager procured on time.
Public Investment* $ 67m $ 258m $ 63m $ 65m $ 452m GAP $ 27m $ 103m $ 25m $ 26m $ 181m Total $ 133m $ 516m $ 127m $ 130m $ 905m * Public Investment for the purposes of this indicator
includes any financing from IFI's, and MDB's eg. IFC, KFW etc
Note*: These obstacles include problems related to the (i) General business framework and risk (or perception of risk); (ii) developers with risk capital and capability; (iii) Capacity and awareness within key stakeholders, host Governments and utility offtakers; (iv) Creditworthiness of offtakers; (v) Political risk issues; (vi) Availability of long term debt and/or equity; (vii) Supply of equipment and technology (viii) Tariffs and (ix) Challenges to accessing carbon financing as a support mechanism - Operational, institutional and financial risks to CER generation and revenues.
Outcome Indicator 2 Milestone 2 (2013)
Milestone 3 (2014)
Milestone 4 (2015)
Milestone 4 (2016)
Target (end 2016)
Minimum 75% of investment by value to be in DAC I and II countries of Sub-Saharan Africa
75% 75% 75% 75% 75%

59
Outcome Indicator 3 Milestone 2 (2013)
Milestone 3 (2014)
Milestone 4 (2015)
Milestone 4 (2016)
Target (end 2016)
Increased availability/quality of (renewable) power to approximately 9 million people during 2012-16, reported disaggregated by gender.
2m additional people expected to have improved or new access to infrastructure services
5m additional people expected to have improved or new access to infrastructure services
7m additional people expected to have improved or new access to infrastructure services
9m additional people expected to have improved or new access to infrastructure services
Cumulative 9 million people expected to be served with improved/increased access to power (through GAP supported projects) by end 2016 totalling:
2.0 m 5.3 m 7.3 m 9.2 m 9.2 m INPUTS (£) Grant
Requested ($) - 2012
Grant Requested ($) - 2013
Grant Requested ($) - 2014
Grant Requested ($) - 2015
Target Total Grant ($) - End 2016
$ 9m $ 74m $ 22m $ 35m $ 140m OUTPUT 1 Output Indicator 1.1 Milestone 2
(2013) Milestone 3 (2014)
Milestone 4 (2015)
Milestone 4 (2016)
Target (end 2016)
Assumptions/Risks

60
Strong and diverse portfolio of projects approved in line with operating policies and procedures.
Total of 10 projects totalling: Total of 2 projects totalling:
Total of 3 projects totalling:
Total of 3 projects totalling:
Total of 2 projects totalling:
Total of 10 projects totalling:
Sufficient magnitude of funding raised for GAP to complete some of the landmark larger projects. GAP Company established and Fund Manager procured on time. Cumulative Projects 2 5 8 10 10
OUTPUT 2 Output Indicator 2.1 Assumptions/Risks 765 GWh of power per annum to be generated from renewable sources by 2015
765 GWh of power expected to be generated per annum, distributed across 4 sub-sectors (eg solar, wind, hydro, geothermal etc) by 2016.
169 445 606 765 765 Sufficient magnitude of funding raised for GAP to complete some of the landmark larger projects. GAP Company established and Fund Manager procured on time.
OUTPUT 3 Output Indicator 3.1 Milestone 2
(2013) Milestone 3 (2014)
Milestone 4 (2015)
Milestone 4 (2016)
Target (end 2016)
Assumptions/Risks
200,000 thousands of tonnes of (net) CO2 saved per annum from using a renewable power that would otherwise have been procured using conventional thermal power, after accounting for the sale of CERs.
200,000 net tonnes of CO2 expected to be saved per annum through use of renewable power as opposed to conventional power by 2016, after accounting for the sale of CERs
Net Tonnes of CO2 committed to be saved per annum:
Net Tonnes of CO2 committed to be saved per annum:
Net Tonnes of CO2 committed to be saved per annum:
Net Tonnes of CO2 committed to be saved per annum:
Net Tonnes of CO2 committed to be saved per annum:
In the absence of more detailed information, we have assumed 50% of energy displaces fossil fuel generation, and that half of projects sell CERs thus reducing the net emission savings
30,000 140,000 167,000 195,000 195,000

61
OUTPUT 4 Output Indicator 4.1 Milestone 1 (2013)
Milestone 2 (2014)
Milestone 3 (2015)
Milestone 4 (2016)
Target (end 2016)
Assumptions/Risks
Self-sustaining renewable power financing company established.
GAP Company incorporated by end March 2013. GAP fund management team procured and in place by June 2013. By latest July 2013, GAP established, full Investment Approval for pathfinder project achieved and by end August 2013 funding in place for pathfinder project to close by the end of October 2013. By end 2016, 10 projects closed.
GAP Company incorporated by end March 2013. GAP fund management team procured and in place by June 2013. By latest July 2013, GAP established, full Investment Approval for pathfinder project achieved and by end August 2013 funding in place for pathfinder project to close
3 projects closed
3 projects closed
2 projects closed
GAP functioning smoothly with a portfolio of 10 projects that have reached financial close
Full funding profile requested for 2013 is achieved such that the landmark projects can be financed. Geopolitical and macro economic stability of the target countries and regions.

62
by the end of October 2013. 1 more project closed by year-end.
Note 1: In line with PIDG Policy, all Outcome and Output level milestones represent the "expected" (not actual) results associated with projects that have reached financial close; the expected results will translate into actual results once the project is fully constructed and operational, which is typically 2 years after a project reaches financial close. Sources: The source for each of the GAP Output and Outcome indicators would include the PIDG Results Monitoring Sheet (to be completed for all GAP projects), internal GAP documents including Board Submissions/Credit Committee papers. The source for the Impact level indicator would be the IMF's World Economic Outlook database.

63
Annex 1: The likely impact on climate change and environment for each feasible option Option 1 – BAU Risks The counterfactual (do nothing) option assume a business as usual (BAU) trajectory for increasing energy capacity in sub-Saharan Africa. The level of investment in renewable energy in 2011 in sub-Saharan Africa was low with only three countries with investment greater than £0.1bn (Nigeria, Gabon and Tanzania) and a decrease in investment across the Middle East and Africa by 18% from 2010 to 2011lvi. Given the already significant investment gap for energy in Africa, it could be assumed that the low investment in renewables continues. As such, it is assumed the BAU case would result in an increase in conventional, fossil fuel power generation in sub-Saharan Africa. The impacts on global warming from increased burning of fossil fuel for energy are well documented (IPCC, IEA), with the Royal Society concluding in 2010:
‘There is strong evidence that the warming of the Earth over the last half-century has been caused largely by human activity, such as the burning of fossil fuels and changes in land use…’lvii
Fossil fuel energy deployment in sub-Saharan Africa would increase greenhouse gas emissions, contributing to global climate change. The high growth rates in Africa lead to a growing demand for energy generation. Countries such as Mozambique, Tanzania, Botswana, Zimbabwe and South Africa have large coal reserves and Kenya, Tanzania, Mozambique, Angola, Ghana, Nigeria and Gabon all have large gas resources. This is in addition to vast oil reserves in countries like Uganda, Sudan and South Sudan. While most of energy generation in Africa now is reliant on emergency diesel generators, as demand for energy grows, it is likely these resources will get exploited to meet this demand. Options 1 – BAU Opportunities Assuming there continues to be low investment in renewables in sub-Saharan Africa, there are significantly low opportunities for more effective environmental management or combating climate change under this option. Options 2, 3, 4 & 5 – Risks The remaining options (2: GAP, 3:MDBs, 4:GET FiT, 5:CfD) are primarily focused on increasing energy capacity in sub-Saharan Africa, while mitigating and avoiding future greenhouse gas emissions. However, there is a risk that poorly designed projects will result in negative environmental, social or economic consequences throughout their lifecycles if not managed effectively. For example, ill-considered biofuels expansion could result in deforestation, food shortages and potentially causing poverty; solar photo-voltaic systems carry risks that solar cells and dry cell batteries are not disposed off properly, resulting in heavy metal contamination and major health and ecosystem impacts; and large hydro can divert scarce water resources from where it may be needed most by either, the local ecosystem or local communities. It will be necessary to undertake project specific environmental impact assessments (EIAs) before activities are approved. It is recommended that GAP consider a cumulative impact assessment during the course of the programme. This is because although an individual project may not be in itself significant, several of them together may add up to significant consequences. The responsibility for adequate EIA and management of each investment lies with the delivery partner for the alternate options. Each delivery partner will apply its own policies and procedures for investment project preparation, approval and implementation, including environmental safeguards. The level of safeguard in place for each of the partners has been

64
assessed below. These delivery partners will be held accountable for overall performance of the programmes in terms of environmental impact management. Private Infrastructure Development Group (PIDG) Green Africa Power (option 2) and
Contract for Difference (option 5) The PIDG scored a 3 – satisfactory in regards to climate change and environmental sustainability as part of DFID’s Multilateral Aid Review (MAR)lviii. Currently PIDG operations and facilities are guided by the PIDG Handbooklix, which includes various requirements, including that environmental standards and practices proposed for planned projects and achieved by operational projects must be assessed to meet relevant World Bank standards for the activity concerned, or local regulations if these are more stringent. The PIDG is currently in the process of agreeing a Code of Conduct which will continue to ensure that World Bank and IFC standards are adhered to as a minimum. In addition:
The PIDG Facilities themselves shall ensure that they have systems and processes in place to reduce their environmental and carbon footprints and build in climate change resilience. The Participants shall seek to raise environmental awareness when carrying out their business. This should include incorporating climate change risks in project designs, and collaborating with other stakeholders, such as clients and society at large, to manage their broader climate change risks. Facilities are expected to engage with affected communities through disclosure of information, consultation and informed participation, in a manner commensurate with the risks to and impacts on the affected communities. Facilities should maintain appropriate mechanisms or procedures to address project-related grievances or complaints from people in affected communities.
Multilateral Development Banks (MDBs) MDBs (option 3)
Funding for increased renewable energy deployment could be channelled via the MDBs, either through further core funding or through the Climate Investment Funds (CIFs). For this appraisal, we have chosen to look only at further funding via the CIFs, in particular to the Clean Technology Fund (CTF) and the Scaling-up Renewable Energy Program (SREP). The CIFs scored a 4 – strong in regards to climate change and environmental sustainability as part of DFID’s Multilateral Aid Review (MAR)lx. CIF documentation for each programme is clear that MDB procedures need to be followed at the project level. Project specific EIAs are undertaken when scoping studies indicate these are necessary. These are the responsibility of each implementing agency. Investment plans under the CIFs must:
o Provide evidence of environmental and social co-benefits, by prioritising activities that provide local or regional environmental benefits, such as improved air or water quality, or biodiversity benefits.
o Include a description of potential risk factors that might affect the implementation of proposed investments: country and sub-national level risks; sector policies and institutions; technology, environmental and social risks.
o Follow the MDB policies and procedures, including the relevant MDBs’ environmental and social safeguards, fiduciary, and disclosure policies, in all programming, approval and supervision processes.
In November 2011, a Strategic Environment, Social and Gender Assessment was undertaken on the CIFslxi as a whole and for each individual programme. It found:
o Environmental co-benefits tend to be closely correlated with greenhouse gas (GHG) reduction, suggesting that (in the case of the currently financed clean

65
technologies) it is sufficient to just measure greenhouse gas reductions as a proxy for environmental pollutants.
o There appears to be a potential for mal-adaptation linked with biofuel production and the reduction of deforestation and forest degradation. It will be important to monitor and report this for both CTF and SREP.
KfW GET FiT (option 4)
KfW assesses and categorises projects for their environmental and climate change impacts: category A and B represent projects that could have significant environmental impacts, therefore requiring an EIA to be completed by an independent engineer; category C comprises projects that cause no or minor impacts. All projects must be monitored for any relevant changes over their lifecycle. KfW’s investments decisions are aligned with internationally recognised environmental and social standards (e.g. World Bank Safeguard Policies, IFC Performance Standards, Environmental, Health and Safety Guidelines of the World Bank Group, ILO Core Labour Standards, EU Environmental Legislation).
Options 2, 3, 4 & 5 – Opportunities These options are directly concerned with incentivising and supporting low carbon energy deployment, displacing the need for conventional energy to power development and growth in developing countries. As such, these options are considered to have high opportunities for addressing global climate change. These opportunities have been documented throughout this business case and in further detail in the economic appraisal. They include: Reducing the need for importing and using fossil fuels to meet country’s
development goals Avoiding carbon lock-in for the life of the power station (construction locks-in future
carbon emissions and poor countries in to long term dependency on increasingly scarce fossil fuels)
Demonstration effects should increase the confidence of the private sector to invest in renewable energy in sub-Saharan Africa, catalysing investment in renewables beyond projects it supports directly
Diversifying energy supplies from fossil fuels to alternative sources of energy can reduce vulnerability of supplies and reduce the reliance and intensity required for any one individual source

66
Annex II: Detailed Economic appraisal of GAP’s quantifiable benefits 1. Assumptions: The following assumptions have been made.
i. Recycling of financial costs and revenues: No revenues received by GAP will be returned to the UK government. Instead they will be reinvested in further projects. For the purpose of this analysis we have not looked at a continuing flow of future investments and associated benefits as such analysis would be overly reliant on assumptions about future spending years into the future. Instead, the revenues received by GAP have been netted off the initial financial costs to simply show the net costs associated with the GAP intervention.
ii. Discount rate: GHG savings are valued in line with the DECC Traded (appraisal) Price Series and have been discounted in line with the HMT Green Book; using a 3.5% discount rate for the first 30 years and 3.0% for all following years. Economic benefits accruing to the country, (notably increased energy generation) have been discounted at 10% in line with DFID appraisal guidance.
iii. Provisioning for Contingent Facility: We have assumed that contingent funding is
not drawn down but that money is temporarily set aside with a view to providing such funding. The cost associated with this funding is estimated as the opportunity cost of setting aside the funding for a period of time before it is returned (similar to an interest-free loan). Through application of a 10% discount rate, this funding is therefore valued at £7.2m. Given that in practice, these funds when set aside, would earn an appropriate rate of interest and fees would be earned for the provision of this type of support, this approach overstates the cost of providing contingent funding. However as we have assumed that the funding is not drawn down, this may understate the economic costs of the funding.
2. The Central (or baseline) scenario modelled is labelled Scenario 1 and uses the following
assumptions: 1. For all electricity generation projects, 50% of energy produced is considered additional
relative to the business as usual and 50% replaces an alternative, high carbon (fossil-fuel) on-grid energy source. Hence only 50% of energy production by any project that applies for CERs, earns CERs
2. In addition, the bio-energy project in Tanzania will produce ethanol for use as a blend in gasoline and potentially a fuel-switch from charcoal, firewood & LPG for domestic lighting and cooking purposes. This ethanol production will entirely displace fossil fuel use and result in an estimated 126,000 tCO2 reduction per annum, all of which would be eligible for earning CERs or count towards net emission reductions attributed to GAP in the event that CERs are not generated or sold.
3. For the purpose of this scenario, all the CERs purchased by GAP are sold on and the revenues from the sale are used for GAP financing (including financing future projects which GAP invests in). The revenues from these CER sales are treated in the same way as other revenues (e.g loan repayments) and have been considered as a financial benefit in both the financial and economic analysis. The sale of CERs reduces the "net emission reductions" attributable to GAP.
4. Central estimates of CER prices according to DECC estimates, CER price forecasts are set out below and are in line with current HMG guidance. The central price is in line with the market forward curve. The low price is a forecast from Bloomberg New Energy Finance, while high price is based on DECC's central forecast of EU ETS prices with a 25% discount applied.

67
Table 15: Carbon Emission Reduction Certificate (CER) price scenarios CER Price Scenario: Nominal prices (€/tCO2) Price in 2013 Price in 2020 Low 3.2 2.5 Central 3.9 5.2 High 14.6 31.1
5. Where energy is additional to the business as usual scenario, it contributes to
development benefits of additional energy. The distributional impacts of these have not been estimated as reliable information on who will receive this additional energy is not available.
3. The below diagram shows where investments lead to additional energy benefits and where they displace carbon emissions, for the quantified benefits.
i. Financial flows from GAP are as follows;
Table 16: Financial NPV of GAP Undiscounted costs/
revenues (£m) Discounted costs/ revenues (£m)
Scenario 1 - Assuming 100% delivery to time and budget
Costs 93.1 79.0
Revenues 145.5 69.3
Net (financial) Value +52.4 -9.7
Scenario 2 - Assuming delivery delays and financing issues
Costs 90.5 77.9
Revenues 160.0 64.6
Net (financial) Value 69.5 -13.3
50% Projects earn CERs; CER fees
incurred
50% Projects sign a commitment not to
apply for CERs
50% Energy is additional-
No CERs
50% Energy replaces a
high carbon source- Earns
CERs
50% Energy is additional
50% Energy replaces a
high carbon source
Net Carbon Emissions
Reductions
No Direct Net Carbon Emissions Reductions; No direct additional energy benefits; Enables GAP
Financial Sustainability and contributes to
demonstration effects
Additional energy benefits
CERs Forfeited and
Cancelled?
Yes
No, sold in market
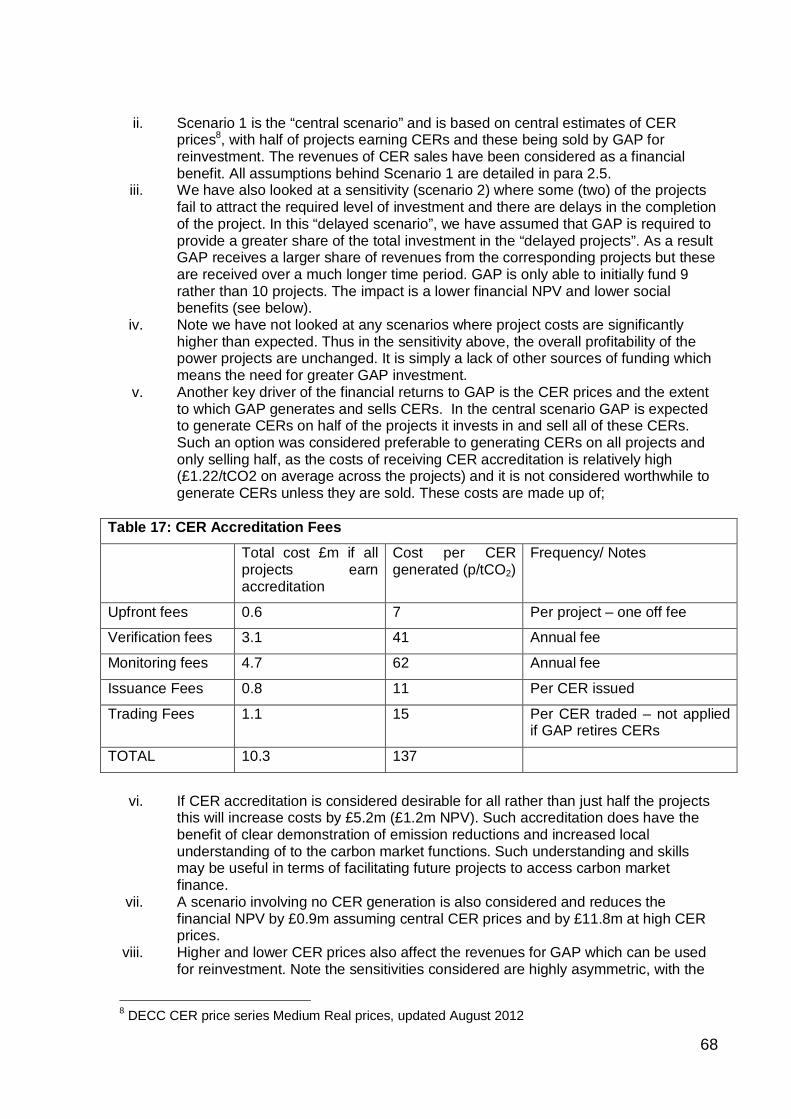
68
ii. Scenario 1 is the “central scenario” and is based on central estimates of CER
prices8, with half of projects earning CERs and these being sold by GAP for reinvestment. The revenues of CER sales have been considered as a financial benefit. All assumptions behind Scenario 1 are detailed in para 2.5.
iii. We have also looked at a sensitivity (scenario 2) where some (two) of the projects fail to attract the required level of investment and there are delays in the completion of the project. In this “delayed scenario”, we have assumed that GAP is required to provide a greater share of the total investment in the “delayed projects”. As a result GAP receives a larger share of revenues from the corresponding projects but these are received over a much longer time period. GAP is only able to initially fund 9 rather than 10 projects. The impact is a lower financial NPV and lower social benefits (see below).
iv. Note we have not looked at any scenarios where project costs are significantly higher than expected. Thus in the sensitivity above, the overall profitability of the power projects are unchanged. It is simply a lack of other sources of funding which means the need for greater GAP investment.
v. Another key driver of the financial returns to GAP is the CER prices and the extent to which GAP generates and sells CERs. In the central scenario GAP is expected to generate CERs on half of the projects it invests in and sell all of these CERs. Such an option was considered preferable to generating CERs on all projects and only selling half, as the costs of receiving CER accreditation is relatively high (£1.22/tCO2 on average across the projects) and it is not considered worthwhile to generate CERs unless they are sold. These costs are made up of;
Table 17: CER Accreditation Fees
Total cost £m if all projects earn accreditation
Cost per CER generated (p/tCO2)
Frequency/ Notes
Upfront fees 0.6 7 Per project – one off fee
Verification fees 3.1 41 Annual fee
Monitoring fees 4.7 62 Annual fee
Issuance Fees 0.8 11 Per CER issued
Trading Fees 1.1 15 Per CER traded – not applied if GAP retires CERs
TOTAL 10.3 137
vi. If CER accreditation is considered desirable for all rather than just half the projects
this will increase costs by £5.2m (£1.2m NPV). Such accreditation does have the benefit of clear demonstration of emission reductions and increased local understanding of to the carbon market functions. Such understanding and skills may be useful in terms of facilitating future projects to access carbon market finance.
vii. A scenario involving no CER generation is also considered and reduces the financial NPV by £0.9m assuming central CER prices and by £11.8m at high CER prices.
viii. Higher and lower CER prices also affect the revenues for GAP which can be used for reinvestment. Note the sensitivities considered are highly asymmetric, with the
8 DECC CER price series Medium Real prices, updated August 2012

69
high prices substantially further from the central scenario than the low price. This is because at the central estimates, there is much more potential for prices to rise than to fall. The impact of high/ low CER prices and the extent to which they are generated is as follows.
Table 18: Sensitivity of GAP Financial NPV to CER generation and prices
Scenario CER Price (€/tCO2 in 2020)
Impact on financial NPV relative to Central scenario (£m)
Central 5.2. N/A
Low CER prices 2.5 -1.2
High CER Prices 31.1 +10.9
No CERs generated N/A -0.9
No CERs sold N/A -2.1
3.2. Social benefits and costs 151. Additional Energy Generation:
ix. It is difficult to accurately assess the extent to which any energy generation financed by GAP is increasing the total energy generation capacity beyond what would have happened anyway. However the lack of projects (even fossil fuel powered plants) in a number of countries obtaining financial closure suggests that a large proportion of generation should be considered additional, at least in the short term. In support of this hypothesis, and a key driver behind projects not reaching financial close is that in all 4 of the countries in which potential projects have been identified and which have been used as illustrative examples, the tariff rate is currently set below the Long Run Variable Cost (LRVC) of generation (see table below). Thus it may be reasonable to expect a significant proportion of energy generation delivered through GAP is additional.
Table 19: Tariffs as a percentage of Long Run Variable Costs Country Tariff Rate as
% of LRVC* Tariff Rate as % of LRVC†
Average used for anaysis
Used as illustrative examples AIDC Estimates Inferred from other data
Burkino Faso 90% 55% 72% Senegal 53% 51% 52% Tanzania 64% 102% 83% Zambia 36% 100% 68% Other potential countries; Rwanda 121% N/A 121% Kenya 137% N/A 137%
* Source: AICD. Figures for 2008. † Source: Estimated by comparing tariff rates assumed by Trinity Consulting with AICD estimates of LRVC, adjusted for inflation
In the longer term, as policies slowly evolve we would expect new energy generation to come forward in the absence of GAP, and some of the GAP driven projects may in turn displace a proportion of what would have happened. Furthermore, it should be noted that not all countries in which GAP is likely to work in has tariff rates set below LRVC, so in these

70
countries a greater proportion of the energy coming forward is likely to be displacing existing energy generation.
x. Projects earning credits under the Clean Development Mechanism will generally assume that 80% of the energy generation is displacement, although such a higher figure is more credible in the context of commercial entities delivering infrastructure. With all of the above in mind, as a central assumption, we have assumed that 50% of the energy generation is additional, with the remaining 50% displacing either existing or more likely new electricity generation. This assumption determines the extent to which the benefits of this project are additional energy generation or reduced CO2 emissions. Given the social value of carbon used in the appraisal and the value of energy benefits, assuming a high level of displacement results in a greater social NPV. To test the robustness of the analysis, we have looked at sensitivities with all the generation being additional and all of it being displaced generation from other sources.
i. Valuing additional energy generation: The value of this energy generation can be determined by the difference between consumers' willingness to pay and prevailing tariffs, which are captured in the financial returns. This effectively represents the Consumer surplus of additional energy generation. In an efficient and developed country market, the electricity price would be closely aligned with the long run marginal/ variable cost of generation (LRVC). Thus where electricity tariffs are set below the LRVC, we have assumed that energy generation is valued at LRVC rather than the tariff rates, and the difference between the two has been added as a 'social benefit'. Where tariffs are set in line with a cost-recovery level, we have assumed that there is no additional benefit (beyond the revenues) associated with any additional energy generation, although in the African context, supply may be constrained due to various other factors and this does not strictly hold.
ii. Note this approach is likely to be a very conservative estimate of the social benefit of additional energy. For commercial and industrial users, rather than the consumer surplus, the value of additional energy generation could be estimated through either considering the cost of back-up generation or the forgone production or other economic output that would have occurred had the electricity been available. The East African Power Masterplan (EAPM) effectively took this approach, along with the costs associated with unplanned outages and produced the following estimates of the value of unserved energy
Table 20: Additional Value of each MW Energy Generation
Country Tariff Rate
($/MWh)
Value of energy generation†
(LRVC) - $/MWh
Additional value of energy generation not captured by revenues - $/MWh
Burkino Faso 160* 221 61
Senegal 140* 270 130
Tanzania 150* 181 31
Zambia 120* 176 56
Rwanda 146¥ 120 -
Kenya 164¥ 120 -
* Source: Trinity Consultant assumptions following discussion in relevant country.
† Source: Inferred from data in table 19.
¥ Source: AIDC

71
xi. Table 21 below presents a comparison of the value of additional energy generation according to the EAPM and the values used in this appraisal.
Table 21: Value of energy generation estimates Country EAPM estimates of value of
unserved energy ($/MWh) Estimates of value used in this appraisal ($/MWh)
Tanzania 1,100 181 Kenya 840 120 Uganda 300 Burkino Faso 221 Senegal 270 Zambia 176
xii. Thus the above suggests that the economic value of additional energy may actually be up to
7 times greater than used in this appraisal.
This approach effectively attributes all the “social benefit” of the additional energy generation to GAP. Such an approach is justified as such benefits would not have occurred in the absence of the GAP intervention. For the purpose of the analysis, GAP is the only non-commercial entity that is investing in the relevant projects and so fully attributing the social benefits to GAP is considered appropriate. As such, the total value of energy benefits for GAP interventions are as follows; Table 22: Value of Additional Energy Generation by GAP
Capacity increase
(MW)
Maximum Annual Energy generation
(MWh)
Annual Energy generation considered additional
(MWh)
Value of additional energy generation
(£m NPV)
10% social discount rate
3.5% social discount rate
Central scenario
274 760,000 380,000 4.9 8.6
If all energy is assumed additional
274 760,000 760,000 9.8 17.2
It should be noted that the above only captures the direct benefits of additional energy
generation. There are likely to be many significant indirect benefits. These include the fact that additional energy is likely to be a significant driver to economic growth, providing an improved working environment for businesses to thrive, which in turn will provide employment and increased income. These indirect benefits are difficult to quantify and thus have not been captured in the economic analysis.
xiii. Avoided Emissions
Of the displaced energy generation, we have used the emission factors used in the Clean Development Mechanism to estimate the avoided emissions as well as calculate the estimated CERs generated (where appropriate). An average of the factors used for Senegal, Rwanda and Kenya has been used (factors were not available for the other countries that were considered). This results in an average emissions factor of 0.654 tCO2/ MWh.

72
Note in all instances, we have assumed that only 50% of the energy generated is
considered to displace fossil fuel generation and thus where CERs are generated, they in practice only receive 0.327 tCO2/MWh. For CER generation, this is likely to be a conservative assumption, as in practice, CDM applications generally assume around 80%-100% of the energy displaces fossil fuel generation. However it is important that consistent assumptions are used in determining the number of CERs generated and the size of actual emission reductions. A sensitivity on this assumption is shown below
Valuing carbon savings: GHG savings have been valued in line with the DECC Traded (appraisal) Price Series and have been discounted in line with the HMT Green Book; using a 3.5% discount rate for the first 30 years and 3.0% for all following years. This produces the following estimates of GHG savings for the different scenarios Table 23: Value of GHG Savings by GAP Scenario Gross MtCO2
Savings CERs sold Net MtCO2
savings Value of GHG savings £m NPV (£m)
Central 7.7 3.9 3.9 139
Low social carbon values 7.7 3.9 3.9 76
High social carbon values 7.7 3.9 3.9 199
Delay to investments 7 2.9 2.9 127
No CERs generated/ sold 7.7 - - 277
If all electricity is considered to displace fossil fuel generation
12.9 6.5 6.5 230
Overall Net Present Value: Given the above costs and benefits, the overall NPV is as
follows; Table 24: GAP Overall Net Present Value (NPV)
(£ m) Financial NPV
Social Benefits Overall NPV
Scenario Energy CO2 Relative to central scenario
Benefit Cost Ratio**
Central -9.7 5 139 134.0 N/A 2.7 Project delays -13.3 4 127 117.4 -17 2.5 High CER prices 1.3 5 139 144.9 11 2.8 Low CER prices -10.9 5 139 132.8 -1 2.7
High social carbon values -9.7 5 199 194.4 60 3.5
Low social carbon values -9.7 5 76 70.9 -63 1.9
No CERs generated -10.5 5 277 271.9 138 4.4 All energy considered additional -10.5 10 0 -0.7 -135 1.0
All energy considered displacement -7.4 0 231 223.3 89
3.8

73
Appendix I: Impact of more reliable/ increased supply of Electricity on Economic Growth & Poverty GAP supported projects will generate clean power in poor, developing countries; all of the power generated is likely to be supplied to the national grid, thereby increasing the supply of clean, reliable power in the country.
Overview
“At a theoretical level, the relationship between electricity, economic growth and the elimination of deep poverty is obvious – no country has achieved a high level of per capita income and welfare without a functioning electricity system.” (Insitute for Development Studies, 2012)
Electricity provision can lead to impacts on poor people through growth outcomes made possible by electricity and through direct routes that change poor people’s choices as a result of having reliable electricity.
Adding additional generating capacity to the existing grid in GAP’s target countries, which are categorised by a severe gap between demand and supply, should lead to a “combination of improvement to the reliability of electricity supply, greater access to electricity or increased peak consumption of electricity per user, as long as that addition exceeds any increase in total peak demand.” (Insitute for Development Studies, 2012)lxii.
Energy, growth and productivity
At the macro level, Morimoto & Hope (2004)lxiii demonstrate that increased energy generation is associated with increased future economic output and estimate, for the example of Sri Lanka, that a 1 MWh increase in electricity supply is associated with extra economic output of 88000 to 137000 Rupees (approximately US$1120–1740). Research on Bangladesh over the period 1973-2006 also found similar evidence that increased energy generation is associated with increased economic output. (Sarker, A., & Alam, K. (2010). Nexus between Electricity Generation and Economic Growth in Bangladesh (Asian Social Science, 6(12), 16-22) Improving the reliability of electricity provided through the grid supports increased economic growth in the local, regional or national economy through increasing the productivity of both labour and capital by allowing the use of electricity-using technologies, enabling working hours to extend beyond dark, and reducing the costs of production. The results of unreliable power supply is that production volumes, manufacturing costs and output quality are all adversely affected; firms invest less or in less efficient technologies and have lower productivity growth (Alby, Dethier, & Straub,
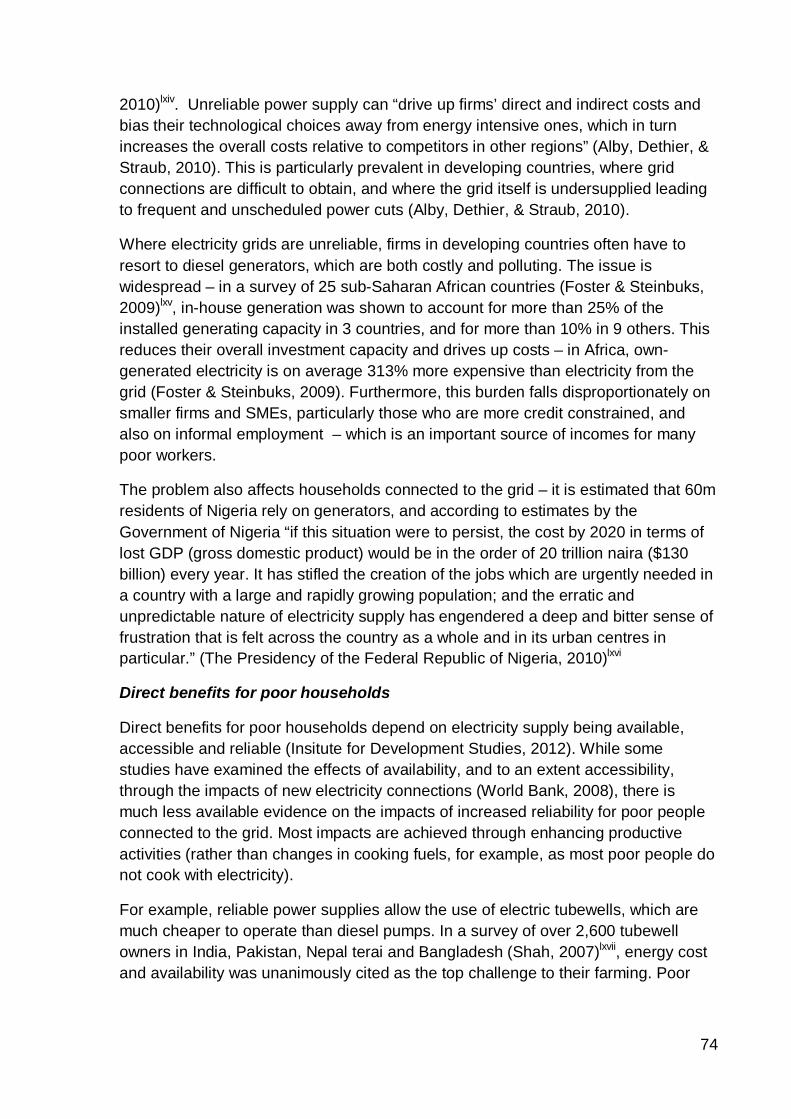
74
2010)lxiv. Unreliable power supply can “drive up firms’ direct and indirect costs and bias their technological choices away from energy intensive ones, which in turn increases the overall costs relative to competitors in other regions” (Alby, Dethier, & Straub, 2010). This is particularly prevalent in developing countries, where grid connections are difficult to obtain, and where the grid itself is undersupplied leading to frequent and unscheduled power cuts (Alby, Dethier, & Straub, 2010).
Where electricity grids are unreliable, firms in developing countries often have to resort to diesel generators, which are both costly and polluting. The issue is widespread – in a survey of 25 sub-Saharan African countries (Foster & Steinbuks, 2009)lxv, in-house generation was shown to account for more than 25% of the installed generating capacity in 3 countries, and for more than 10% in 9 others. This reduces their overall investment capacity and drives up costs – in Africa, own-generated electricity is on average 313% more expensive than electricity from the grid (Foster & Steinbuks, 2009). Furthermore, this burden falls disproportionately on smaller firms and SMEs, particularly those who are more credit constrained, and also on informal employment – which is an important source of incomes for many poor workers.
The problem also affects households connected to the grid – it is estimated that 60m residents of Nigeria rely on generators, and according to estimates by the Government of Nigeria “if this situation were to persist, the cost by 2020 in terms of lost GDP (gross domestic product) would be in the order of 20 trillion naira ($130 billion) every year. It has stifled the creation of the jobs which are urgently needed in a country with a large and rapidly growing population; and the erratic and unpredictable nature of electricity supply has engendered a deep and bitter sense of frustration that is felt across the country as a whole and in its urban centres in particular.” (The Presidency of the Federal Republic of Nigeria, 2010)lxvi
Direct benefits for poor households
Direct benefits for poor households depend on electricity supply being available, accessible and reliable (Insitute for Development Studies, 2012). While some studies have examined the effects of availability, and to an extent accessibility, through the impacts of new electricity connections (World Bank, 2008), there is much less available evidence on the impacts of increased reliability for poor people connected to the grid. Most impacts are achieved through enhancing productive activities (rather than changes in cooking fuels, for example, as most poor people do not cook with electricity).
For example, reliable power supplies allow the use of electric tubewells, which are much cheaper to operate than diesel pumps. In a survey of over 2,600 tubewell owners in India, Pakistan, Nepal terai and Bangladesh (Shah, 2007)lxvii, energy cost and availability was unanimously cited as the top challenge to their farming. Poor

75
farmers who are reliant on diesel powered pumps have seen the relative price of irrigation increase four-fold from 1990 to 2007 (Shah, 2007).
The Africa Infrastructure Country Diagnostic (AICD) paper found that informal workers suffered disproportionately from the effects of Sub-Saharan Africa’s unreliable and inadequate power supply. Losses from frequent power outages for enterprises (in foregone sales and damaged equipment), were equivalent, on average, to 6 percent of turnover for firms in the formal sector, and as much as 16 percent of turnover for informal sector enterprises that lack their own backup generation.
DFID has now commissioned research on the poverty impacts of on-grid electricity, from the Institute for Development Studies, as part of the Accountable Grant between IDS and DFID’s Policy Division (workstream 4). The scoping study for the research will take place in 2012/2013, with research studies identified as a result of the initial scoping.

76
Appendix II: PIDG Contestability Mechanism
Introduction In the Business Case for the uplift in funding for the PIDG it was proposed to introduce a “Contestability Mechanism” in order to create better Value for Money for DFID’s investments. This mechanism would introduce performance assessments for PIDG facilities in order that both the baseline funding (£357.1m for the period 1 April 2013 to 31 March 2015) and additional funding (£233m for the period 1 April 2013 to 31 March 2015) could be revised up or down based upon annual performance. This document sets out the criteria that will be used for defining performance and how the contestability mechanism will operate.
Mechanism Operation Each facility will be set weighted targets for development outcomes for each year as laid out below in ‘Targets for PIDG Facilities’, which are drawn from each facility’s agreed logframe. The targets for 2013 and 2014 will be revised annually in line with any revisions to the PIDG logframes agreed by the Members funding the particular facility, by the end of Q1 of the year n+1, i.e. 2013 targets will be circulated and agreed by the Members funding the particular facility by 31 March 2013. Base line finding Failure by a facility to reach its weighted targets in calendar year n may trigger a possible reduction by DFID of its commitment to the facility for DFID’s financial year starting in n+2 on 1 April. The amount of reduction will be determined by DFID’s Private Sector Department during DFID’s financial year starting in year n+1 on 1 April and approved by DFID’s International Director. The amount of the reduction will depend on the number of targets missed and by how much they are missed (and will be calculated using the formula below) and the extent of the reduction in funding will be capped at 5% of DFID’s indicative funding commitment for that facility for year n+2. DFID will receive and review any evidence of extenuating circumstances provided by the facility before deciding on any reduction. DFID will confirm within 30 days of receipt of the PIDG logframes (expected by end of Q1 of year n+1) whether the PIDG facilities have met their targets for each year n for the purposes of the contestability mechanism, whether the reasons for any failure to meet targets have been accepted and whether DFID intends to reduce the base line commitment for a facility and can pass through the Target Gate. The facility will review the impact of any reduction on its business plan and submit a revised business plan to the PIDG members funding that facility, if necessary. Funding = (Target 1 Achievement/target) x weighting + (Target 2 Achievement/target) x weighting + (Target 3 Achievement/target) x weighting + (Target 4 Achievement/target) x weighting

77
There will be no reduction in funding if weighted targets are missed by less than 2.5% overall i.e. if the value of the above formula is 97.5% or higher. If DFID’s baseline commitment for a facility is reduced as a result of the mechanism, it will not be rolled over to a future year but may be used by DFID for other purposes within or outside of PIDG. Additional contestable funding Where a facility passes the Target Gate, they will have the option of bidding for part of the additional contestable funding - (£233m). Success in year n, which will be a calendar year, will enable a facility to submit a proposal during the calendar year n+1 for funding for additional funding commitments starting on 1 April during year n+2. Any increase will not be automatic: the proposal will need to set out the business case for the need for these funds, confirmation of the approval of the funding members for the proposal and the development outcomes that could be expected from any increase in funding from DFID. See diagram attached as Annex 1. The first bids will be accepted in 2012 i.e. DFID will be looking at which facilities had met their targets for the year end 31 Dec 2011 to determine which facilities are eligible to apply for the additional contestable funding available to be committed in DFID’s financial year 1 April 2013 - 31 March 2014. These proposals will have to be in line with DFID priorities and set out clearly the development outcomes that will be delivered through this increased funding. This includes working in DAC I and II countries, Fragile States (see list below), setting out how the pipeline of projects that the additional funds will be used for will result in increased investment in DFID’s priority sectors and in all cases having a clear narrative about how the funds will generate benefits for poor people. The contestable funds are available for commitment during the year shown but can be disbursed over a number of years [last available date for disbursement and use of funds yet to be confirmed]. DFID would submit proposals as business cases to the appropriate level for approval depending on the amount of extra funds requested. There will also be the opportunity for the PMU, on behalf of the PIDG, to apply for funds should the PIDG approve the development of a new facility and for a new facility to apply for these funds should the PIDG members subsequently approve the establishment of the new facility. When considering whether funding will be available for the development or funding of a new facility, DFID will also take into consideration PIDG overall performance. Furthermore, if DFID considers that the PIDG as a whole has failed meet its targets, it may reallocate some or all of the additional contestable funding at any time for any other purpose outside of PIDG. The PIDG must demonstrate that it is using DFID’s money well and continuing to represent value for money in delivering development outcomes or the funds will be reallocated to better performing institutions. DFID will immediately notify the PMU of any decision to reallocate any PIDG funding.

78
The targets for the PIDG facilities for the purposes of this contestability mechanism have been set in line with DFID’s MAR priorities and the logframe targets agreed by the PIDG for the period 2012-2016.
PIDG Contestability Mechanism
Target Gate Based on
Development Outcomes
2011/12 Review
2013/14 DFID
support Funding Increased
within limits of Facility bid and Total Contestable Funds Available.
No Change in Funding from original agreed levels
Funding reduced by up to 5% linked to level of underperformance and any extenuating circumstances
Failure to pass Target Gate
Facility Passes (/Exceeds)
Target Gate
Facility submits proposal for increased funding through the PIDG
Facility does not apply for extra funding
PSD prepares bid for approval
Approved
Not Approved

Annex 3: Evidence underpinning the intervention: 1. PIDG Systematic Review, Spratt and Ryan- Collins, Jan 2012, “Development Finance
Institutions and Infrastructure: A Systematic Review of Evidence for Development Additionality”:
1. Evidence of development impact of infrastructure investment is scarce (p3)
2. DFIs like PIDG/GAP create financial additionality (p4)
3. Demonstration effects of DFIs like PIDG/GAP are hard to prove (p5)
2. Additionality Review of GAP, Vivid Economics, August 2012
3. GAP Inception Report and Addendum, Trinity Consortium, August 2012
4. GAP Financial Model, Trinity Consortium, August 2012
5. PIDG Governance Review, Richard Morse, 2011; Key findings:
i. The PIDG Programme Management Unit is operating efficiently but needs to operate under a simpler, principle based remit in place of the current task based system.
ii. The financial systems based on the PIDG Trust operate efficiently but boards need a clear mandate from donors about prioritising between financial performance of their companies against achieving development outcomes.
iii. There is an ongoing need for greater diversity at board level in the PIDG.
iv. A centralised Code of Conduct that applies across the entire PIDG system would enhance the PIDG governance system.
6. A Strategic Review of the PIDG has recently been undertaken by McKinsey. Key recommendations are summarised below:
i. PIDG should increase its capacity to support project development activities, particularly as a principal investor.
ii. It should scale up its capacity to provide local currency guarantees.
iii. Third, it should increase its capacity to invest equity after financial close in two broad categories: pre-commissioning equity for green field infrastructure and patient equity for highly developmental projects, whose business model requires complex arrangements and a long time horizon.
iv. PIDG should shift towards four sectoral plays: agricultural infrastructure, water services, renewable energy and low income housing development.
v. In the long term, PIDG should consider new partnerships as a means of raising capital and expanding its knowledge base, paying careful consideration of the trade-off against keeping decision making processes simple by limiting the number of voices within PIDG.
vi. Improve connectivity to facilitate strategic decision making by 1) holding regular facilitated strategy planning sessions attended by all PIDG stakeholders, 2) strengthening internal and external networking to build a common culture and set of values, and 3) introducing a PIDG initiation training programme for all new recruits.
vii. Formalise responsibility for strategic management to facilitate the strategic process including managing 1) the idea generation process, 2) the decision making process for new ideas, and 3) the decision making process for facility refocusing or exit.
viii. Improve performance management and people and talent management processes by 1) improving information collection, aggregation and analysis, 2) increasing the

diversity on facility boards, and 3) improving PIDG’s ability to use contestable markets when tendering for contracts.
7. A Mid-Term Review of the PIDG PMU was recently completed by two independent consultants. Recommendations made by the review are currently under discussion by PIDG donors.
1. Restructure the services covered by the PMU contract 1. Clarify an strengthen the role of Executive Director (ED) of PIDG with strategic
remit for PIDG directly attached to the PIDG Trust 2. Align the current PMU mandate to serve as a PIDG Secretariat with clear TORs 3. Contract legal services separately from the secretariat services 4. TAF Manager contracted by the PIDG Trust either as a separate facility
management service or as a consultant contract reporting to the ED as contractor to the Trust.
2. Strengthen performance, systems and policies
3. Strengthen oversight and performance management of PMU
4. The Secretariat, Legal Services and TAF services for the PIDG should continue to be tendered out, potentially as separate tenders.
These recommendations are currently under review by PIDG members, and decisions on implementation have not yet been taken.

Appendix III: PIDG Project Results Monitoring Sheet9
PIDG Facility Name: Name of Project: Date Form Completed: Amount (US$m) & Year: Country: Sector: Summary Project Description: Current Project Status: No. Indicator PSI
Commitment (US$m)
Additional Information
1) Total Project Investment
1a) Domestic PSI of which: i) Domestic Commercial Equity
ii) Domestic Commercial Loan
1b) Foreign PSI/FDI Debt of which: i) Foreign Commercial Equity
ii) Foreign Commercial Loan
1c) DFI Investment of which: i) DFI Equity
ii) DFI Loan
1d) Project Value generated through Grant (Foreign or Domestic)
2a) No. Of People Served Predicted
Nos. Additional Information
i) No. Of Additional People Served
ii) No. Below Poverty Line 2b) Improved Service Level Predicted
Nos. Additional Information
i) No. with Improved Quality of Service
ii) No. Below Poverty Line No. Indicator 3) Fiscal Impact
Predicted (US$m)
Additional Information
3a) Up- Front Fees to Government
3b) Subsidies Avoided (by
9 All figures are ex-ante projections; ex-post figures will be compiled and entered following physical completion and actual services being delivered on the ground.
Government) 3c) Total fees paid (including
corporate tax, VAT etc)
4) Direct Employment Effects Predicted Nos.
Additional Information
4a) Short Term Effects – During Construction
4b) Long Term Effects – During Operations
5) Developmental Impacts 5a) Overall Size of Impact on
Sector/National Economy
5b) Additionality Impacts separating out: Financial Additionality, Design/Efficiency Additionality & Policy Additionality
5c) Demonstration Effect 5d) Any Other Developmental
Impacts
6) Any Specific Support/Developmental Interventions Supported by TAF
7) Any Subsidies Associated with this Project
8) Other PIDG Facilities Involved 9) Alignment with National
Development Plans
10) Improve the Enabling Environment
National IFC ‘doing business’ index for the protection of investors
Upon submission of this completed form, this index and rank will be completed automatically for each project from the World Bank database, by the PIDG results monitoring database
National IFC ‘doing business’ ranking for enforcing contracts
11) Improve Government Capacity National Country Performance Rating
Upon submission of this completed form, this index and rank will be completed automatically for each project from the World Bank database, by the PIDG results monitoring database
12) Poverty Focus Specify Country Category from DAC List of ODA Eligible Countries
Upon submission of this completed form, this index and rank will be completed automatically for each project from the World Bank database, by the PIDG results monitoring database

Appendix IV: Overview of the PIDG The Private Infrastructure Development Group (PIDG) is a multi-donor organisation, set up by development agencies which are committed to tackling the major institutional and market obstacles hindering private participation in infrastructure in developing countries. PIDG Members invest public funds which are used to leverage private sector finance. PIDG-supported projects are designed to deliver transformational developmental, social and environmental benefits in poorer, developing countries.
Mission The mission of PIDG is to mobilise private sector investment to assist developing countries in providing infrastructure vital to boost their economic growth and combat poverty. Guided by this mission, its objectives are to:
Improve the provision of sustainable infrastructure services (both quality and quantity).
Make infrastructure services accessible to a greater number of poor people.
Increase flows of local, regional and international investor capital and expertise towards infrastructure.
Transfer skills and build domestic capacity to harness private investment in infrastructure for the benefit of the country.
Stimulate pro-poor economic growth.
PIDG Members Since 2002, PIDG has almost doubled the number of its Members which today stand at nine. These include: AusAID - Australia (funding expected to be approved in 2012) Austrian Development Agency - Austria (joined 2007) KfW - Germany (joined 2009) Irish Aid - Ireland (joined 2008) DFID - United Kingdom (joined 2002) DGIS / FMO10- The Netherlands (joined 2002) SECO - Switzerland (joined 2002) Sida - Sweden (joined 2002) The World Bank, currently represented by the International Financial Corporation (IFC) became a Member of PIDG in 2004.
10 As FMO provides funding to GuarantCo on behalf of DGIS, the PIDG Members have agreed that FMO shall have to right to participate in meetings of the Governing Council of PIDG concerning GuarantCo. DGIS and FMO have the right to exercise one vote on their joint behalf
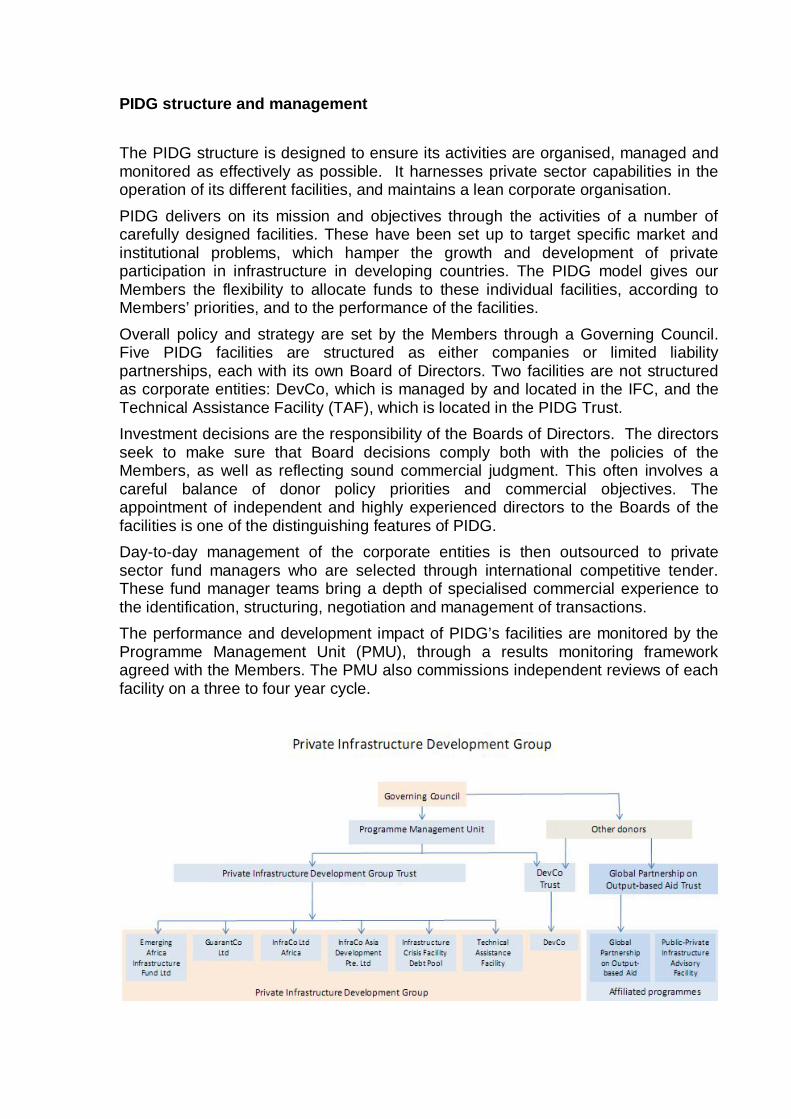
PIDG structure and management The PIDG structure is designed to ensure its activities are organised, managed and monitored as effectively as possible. It harnesses private sector capabilities in the operation of its different facilities, and maintains a lean corporate organisation. PIDG delivers on its mission and objectives through the activities of a number of carefully designed facilities. These have been set up to target specific market and institutional problems, which hamper the growth and development of private participation in infrastructure in developing countries. The PIDG model gives our Members the flexibility to allocate funds to these individual facilities, according to Members’ priorities, and to the performance of the facilities. Overall policy and strategy are set by the Members through a Governing Council. Five PIDG facilities are structured as either companies or limited liability partnerships, each with its own Board of Directors. Two facilities are not structured as corporate entities: DevCo, which is managed by and located in the IFC, and the Technical Assistance Facility (TAF), which is located in the PIDG Trust. Investment decisions are the responsibility of the Boards of Directors. The directors seek to make sure that Board decisions comply both with the policies of the Members, as well as reflecting sound commercial judgment. This often involves a careful balance of donor policy priorities and commercial objectives. The appointment of independent and highly experienced directors to the Boards of the facilities is one of the distinguishing features of PIDG. Day-to-day management of the corporate entities is then outsourced to private sector fund managers who are selected through international competitive tender. These fund manager teams bring a depth of specialised commercial experience to the identification, structuring, negotiation and management of transactions. The performance and development impact of PIDG’s facilities are monitored by the Programme Management Unit (PMU), through a results monitoring framework agreed with the Members. The PMU also commissions independent reviews of each facility on a three to four year cycle.

The development of PIDG’s multiple activities PIDG started with the Emerging Africa Infrastructure Fund Ltd (EAIF), set up in 2002 to provide long-term loans to finance infrastructure. This was a response to the gap between the huge demand for long term capital, and the poor supply of such capital from under-developed credit and capital markets in sub-Saharan Africa. Subsequently, additional facilities were established, each in response to specific challenges created by institutional and financial constraints to mobilising private participation in infrastructure. Today, the activities of the PIDG facilities fall into three broad categories:
Facilities that directly provide long-term debt finance both in foreign (EAIF, ICF-DP) and local currency (GuarantCo).
Facilities that provide early-stage project development capital and expertise in Africa and Asia (InfraCo Africa and InfraCo Asia).
Facilities that provide technical assistance, affordability and capacity-building support to PIDG projects (TAF) and to public authorities seeking to deliver projects with private sector involvement (DevCo).
Figure 2.1 – Development of PIDG Facilities by year of first operations
2002 2003 2004 2005 2006 2009 2010 TheEmerging
Africa Infrastructure Fund Ltd
DevCo Technical Advisory Facility
InfraCo Ltd GuarantCo Ltd11
Infrastructure Crisis Facility
- Debt Pool LLP
InfraCo Asia Development
Pte. Ltd
Market/policy Challenge
Shortage of long-term loans at sufficiently low interest rates due to perceived risks in developing countries
Insufficiently well prepared projects for private sector involvement due to lack of resource/capacity by public authorities
Shortage of public and private sector resources for project preparation, evaluation and affordability
Bankable projects not being developed in Africa due to high risk of early stage project development
Shortage of long-term, local currency-denominated funding to reduce exchange rate risk for projects
Reduced appetite of commercial banks to lend to infrastructure projects in developing countries due to the financial crisis.
Bankable projects not being developed in Asia due to high risk of early stage project development
PIDG Facility Response
Provides long-term loans to private sector infrastructure projects in sub-Saharan Africa
Provides advisory services to governments to help them deliver infrastructure projects
Provides grants to build capacity, support project preparation and delivery
Develops commercially viable infrastructure projects in Africa
Provides local currency guarantees to avoid exchange rate risks and stimulate local capital sources
Provides long term loans to projects to address financing gaps as a consequence of the financial crisis
Develops commercially viable infrastructure projects in Asia
Mobilising private sector finance While a number of PIDG facilities directly provide long-term finance to projects, they also act as a catalyst for mobilising further finance from commercial banking and development finance institutions, financial investors and infrastructure companies. 11 Although established in 2003, GuarantCo started full-scale operations in 2006, when it appointed a private sector fund manager.

PIDG facilities achieve this, first, through private commercial and DFI institutions lending directly to the PIDG facilities themselves and, second, through commercial and DFI lenders co-financing the individual infrastructure projects that are supported by the PIDG facilities. This is described in more detail in section 6. PIDG facilities now support projects under active development, financially closed or operating in over 50% of the countries in sub-Saharan Africa and have a growing portfolio of projects in the poorer regions of Asia.
Investing in early stage project development InfraCo Africa and InfraCo Asia develop infrastructure projects in situations where private sector companies are not willing or able to invest, because of the high upfront costs and the uncertainties, risks and delays associated with the operating environment in low income countries. Many commercial project development companies are not able or prepared to take these risks, and consequently projects with good potential fail to get off the ground. PIDG’s project development companies sponsor initiatives at the early stages of development. They work with public authorities or other project developers, providing development expertise to establish project viability and structure robust contractual arrangements. This is a vital development role that not only makes it possible to mobilise private sector capital but creates a pipeline of projects for greater investment and growth.
Supporting PPP delivery DevCo, TAF, InfraCo Africa and InfraCo Asia help investors and governments overcome hurdles in getting projects off the ground. These PIDG facilities provide technical support and expertise to help develop private sector solutions, in situations where the legal and regulatory frameworks are weak, or where the public sector is not organised or is ill-prepared to work with private investors or public-private partnerships on an equal footing. The TAF also provides grant funding for building local capacity in both the public and private sectors, to manage the demands of increased private sector investment.
Governance and financial reporting PIDG, and all its facilities, are required to operate to principles and rules that define financial and ethical conduct, procurement, transparency and performance standards in relation to environmental and social protection. The PIDG Trust annual financial statements are made available on the PIDG website - http://www.pidg.org/resource-library/key-documents/audited-accounts.
i Agence Française de Développement and the World Bank (2010) ‘Africa’s Infrastructure: A Time for Transformation’, the Africa Infrastructure Country Diagnostic (AICD). ii PPI Database iii IFC ‘Lighting Africa’ iv World Bank (2010) Addressing the Electricity Access Gap: Background Paper for the World Bank Group Energy Strategy. v The annual average per capita consumption in high-income countries is 10,198 kWh vi Agence Française de Développement and the World Bank (2010) ‘Africa’s Infrastructure: A Time for Transformation’. vii Foster, V., and J. Steinbuks. 2008. Paying the Price for Unreliable Power Supplies: In-House Generation of Electricity by Firms in Africa. AICD, World Bank, Washington, DC. viiiWorld Bank (2009). Africa Infrastructure Country Diagnostic: Background Paper 6, “Underpowered: The state of the power sector in Sub-Saharan Africa”.

ix World Bank’s Investment Climate Assessments x IPCC, ‘Climate Change 2007: Impacts, Adaptation and Vulnerability’, 2007. xi Africa Partnership Forum, ‘Climate Change and Africa’, 2007. xii For example see UK Energy Research Centre (2009), Heinberg R, Blackout (2009); Mohr S (2010); Patzek and Croft (2010). xiii Energy Sector Management Assistance Program (ESMAP) (2005), ‘Impact of higher oil prices on low income countries and on the poor’, ESMAP, Paper ESM299, publication of United Nations Development Program/World Bank, Washington D.C. xiv International Energy Agency (IEA) (2007), ‘Contribution of Renewables to Energy Security’, IEA Information Paper, publication of the Organisation for Economic Co-operation and Development/International Energy Agency, Paris, France. xvWorld Economic Forum (2009) Global Risks 2009: A Global Risk Network Report. xvi Rosnes, Orvika, Vennemo, Haakon, 2009. Powering Up: Costing Power Infrastructure Investment Needs in Southern and Eastern Africa. Background Paper 5. Africa Infrastructure Country Diagnostic, World Bank, Washington, DC. xvii Africa’s Infrastructure: A Time for Transformation, Vivien Foster and Cecilia Briceno- Garmendia xviii Anton Eberhard and Maria Shkaratan, Powering Africa:Meeting the financing and reform challenges, June 2011 xix PIDG Annual Report 2010 xx Anton Eberhard and Katharine Nawaal Gratwick, IPPs in Sub- Saharan Africa: Determinants of Success xxi The World Bank: http://papers.ssrn.com/sol3/papers.cfm?abstract_id=1602722 xxii Africa’s Infrastructure: A Time for Transformation 2010 Section 8 Power-Catching Up World Bank Editors – Vivien Foster and Cecilia Briceno-Garmendia xxiii Stern Review on the Economics of Climate Change, Sir Nicolas Stern, October 2006 The Stern Review xxiv World Bank (2010). "World Development Report 2010: Development and Climate Change". The International Bank for Reconstruction and Development / The World Bank, 1818 H Street NW, Washington DC 20433. See also Burniaux et al. (2009) – the assessment of additionality is a high transaction cost. xxv "Carbon Retirement report: The Efficiency of Carbon Offsetting through the Clean Development Mechanism". 2009-12-07. http://www.carbonretirement.com/project-offsetting-costs. ^Kahya, Damian (2009-12-07). "'30% of carbon offsets' spent on reducing emissions". BBC News. http://news.bbc.co.uk/1/hi/business/8399740.stm. xxvi Carbon prices tumble to record low July 18 2012 Financial Times http://www.ft.com/cms/s/0/22951a04-d0f8-11e1-8957-00144feabdc0.html xxvii UK Electricity Generation Costs Update, June 2010, Mott MacDonald xxviii ICF Board April 2012 Principles for ICF Public Funding interacting with Carbon Markets xxix Assessment of Relevance, Effectiveness and Reform Scope for the PIDG (Private Infrastructure Development Group), DFID 2010 xxx http://www.ausaid.gov.au/Publications/Pages/693_6999_8205_7111_6531.aspx xxxi http://www.dfid.gov.uk/Documents/DFID-business-plan.pdf xxxii DFID, ‘The Engine of Development: the Private Sector and Prosperity for Poor People’, 2011. xxxiii ICF Private Sector Strategy approved by ICF Board in April 2012 xxxiv www.faststartfinance.org/node/247 xxxv Castalia Strategic Advisors, commissioned and funded by the IFC and PIDG through DevCo, ‘The Evaluation of the Demonstration Effect of the IFC’s Involvement in Infrastructure in Africa’, 2011 xxxvi Diesel generator prices contained in Foster, V., and J. Steinbuks. 2008. Paying the Price for Unreliable Power Supplies: In-House Generation of Electricity by Firms in Africa. AICD, World Bank, Washington, DC. xxxvii IFC ‘Lighting Africa’ brochure xxxviii All PIDG projects report against ex ante projected impacts in terms of direct beneficiaries, fiscal impacts and employment benefits. GAP would report against these indicators and carbon emissions. xxxix Döll, P. (2009) Vulnerability to the impact of climate change on renewable groundwater resources: a global-scale assessment. Environmental Research Letters 4 035006 (12pp). xl Collected from MDBs by the Low Carbon Development team in DFID. xli http://africa.aggreko.com/news-events/press-releases/power-plant-mozambique/ xlii Africa’s Power Infrastructure - Investment, Integration and Efficiency 2010 Eberhard, Rosnes, Shkaratan, Vennemo page 10 The World Bank xliii ‘Africa’s Infrastructure – a time for transformation’, 2010 IBRD, Vivien Foster and Cecilia Briceno-Garmendia, ‘AICD’ xliv ‘Africa’s Infrastructure – a time for transformation’, 2010 IBRD, Vivien Foster and Cecilia Briceno-Garmendia, page 5 xlv UNEP, Green Jobs: towards decent work in a sustainable, low carbon world, 2008 xlvi Ecofys, Co-Benefits of Private Investment in Climate Mitigation and Adaptation, 2010 xlvii PIDG Annual Report 2011 xlviii DFID MAR- Multilateral Aid Review. xlix Assessment of Relevance, Effectiveness and Reform Scope for the PIDG (Private Infrastructure Development Group), DFID 2010 l Taking Forward the Findings of the UK Multilateral Aid Review, March 2011 li Desk Review of DFID’s Private Sector Infrastructure Investment Facilities in 2008, WSP International Management Consulting, March 2008 lii International Development Committee, 9th Report of Session 2010-12: ‘DFID’s Role in Building Infrastructure in Developing Countries’ liii PIDG Governance Review, 31 January 2011, Richard Morse liv The PIDG members are currently DFID, the Swiss State Secretariat for Economic Affairs, the Netherlands Ministry of Foreign Affairs, the Swedish International Development Cooperation Agency, the World Bank Group (currently represented by IFC), the Austrian Development Agency, Irish Aid, and KfW of Germany, on behalf of the German Government. lv PIDG Results Monitoring Handbook lvi UNEP, Global Trends in Renewable Energy Investment 2012. Available at: http://fs-unep-centre.org/publications/global-trends-renewable-energy-investment-2012 lvii The Royal Society (2010) Climate change: a summary of the science. The Royal Society, London. lviii QUEST file: 2931907 lix The Private Infrastructure Development Group Handbook (2007) The PIDG Handbook

lx QUEST file: 2932605 lxi Strategic Environment, Social and Gender Assessment of the Climate Investment Funds. Presented to the SCF Trust Fund Committee, Washington D.C. November 2010. http://www.climateinvestmentfunds.org/cif/node/2554 lxii Institute for Development Studies. (2012). The evidence of benefits for poor people of electricity provision: Scoping note and review protocol.
lxiii R Morimoto & C Hope (2004) The impact of electricity supply on economic growth in Sri Lanka
lxiv Alby, P., Dethier, J.-J., & Straub, S. (2010). Firms Operating under Infrastructure and Credit Constraints in Developing Countries. World Bank. lxv Foster, V., & Steinbuks, J. (2009). Paying the price for unreliable power supplies : in-house generation of electricity by firms in Africa. Policy Research Working Paper Series 4913.
lxvi The Presidency of the Federal Republic of Nigeria. (2010). Roadmap for Power Sector Reform.
lxvii Shah, T. (2007). Crop Per Drop of Diesel? Energy Squeeze on India’s Smallholder Irrigation. Economic and Political Weekly, 4002-4009.