Bus Stops Asset Management Plan (2015) - City of … · Bus Stops . Asset Management Plan (2015)...
71
Bus Stops Asset Management Plan (2015) Revision 4 Scenario 2 Version 2 August 2015 CITY OF CHARLES STURT– BUS STOP ASSET MANAGEMENT PLAN AUGUST 2015
Transcript of Bus Stops Asset Management Plan (2015) - City of … · Bus Stops . Asset Management Plan (2015)...
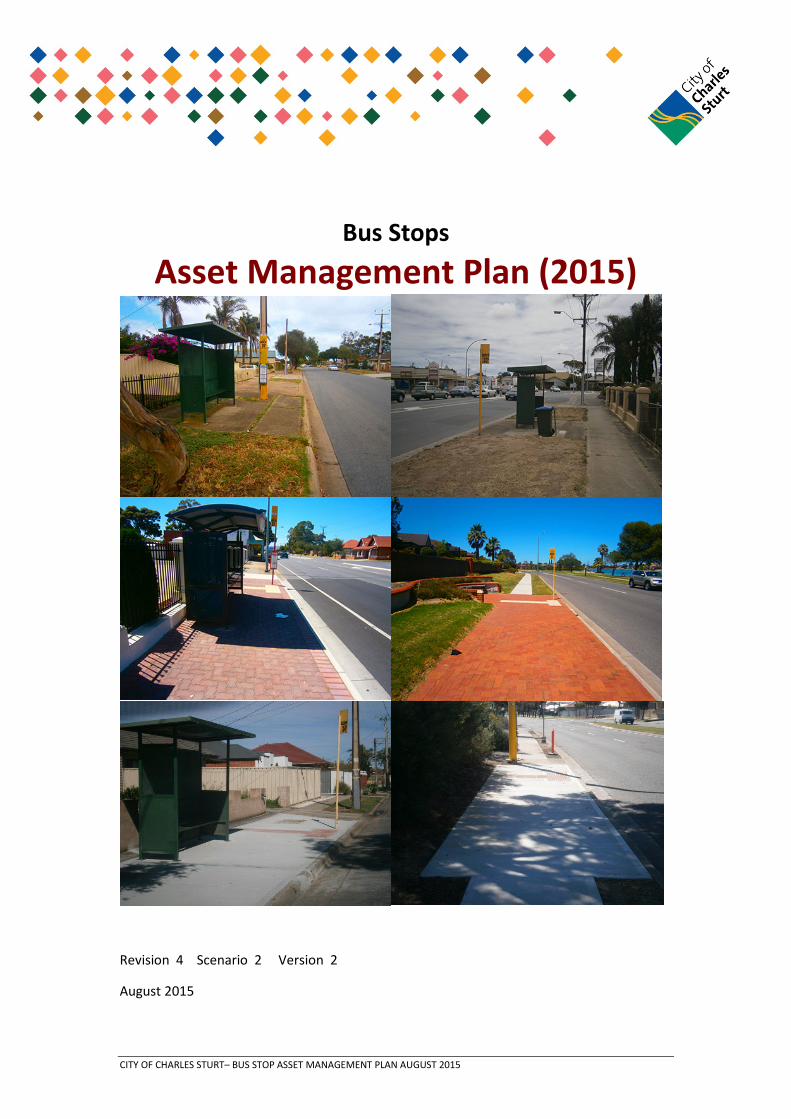
Bus Stops
Asset Management Plan (2015)
Revision 4 Scenario 2 Version 2
August 2015
CITY OF CHARLES STURT– BUS STOP ASSET MANAGEMENT PLAN AUGUST 2015

Document Control
Document ID: 59.299.120815 nams.plus2 amp template v2 15/235444
Rev No Date Revision Details Author Reviewer Approver 1 Aug 2008 First Edition TRIM 08/141799 AOS PHE JCO/BFI 2 Dec 2012 Revision 2 Version 2 TRIM 12/266137 (Draft) AGL PHE 2 Jan 2013 Revision 2 Version 3 TRIM 13/19169 (Draft) AGL PHE 2 Jan 2013 Revision 2 Version 4 TRIM 13/19169 (Draft) AGL PHE 2 Feb 2013 Revision 2 Version 5 TRIM 13/19169 (Draft) AGL PHE 2 Mar 2013 Revision 2 Version 6 TRIM 13/19169 (Draft) AGL PHE 2 Apr 2013 Revision 2 Version 7 TRIM 13/19169 (Draft) AGL PHE 2 May 2013 Revision 2 Version 8 TRIM 13/19169 AGL PHE AM Ctte
20 May 2013
3 June 2014 Revision 3 Version 1 14/34179 FD PHE AM Ctte 18 Aug 2014
4 Aug 2015 Revision 4 Version 1 TRIM Ref 15/235444 MBL PHE AM Ctte 21 Sept 2015
1 Revision 1 is a prior version of this document created outside of the NAMS.PLUS template system
© Copyright 2012 – All rights reserved.
The Institute of Public Works Engineering Australia.
www.ipwea.org.au/namsplus
CITY OF CHARLES STURT– BUS STOP ASSET MANAGEMENT PLAN AUGUST 2015
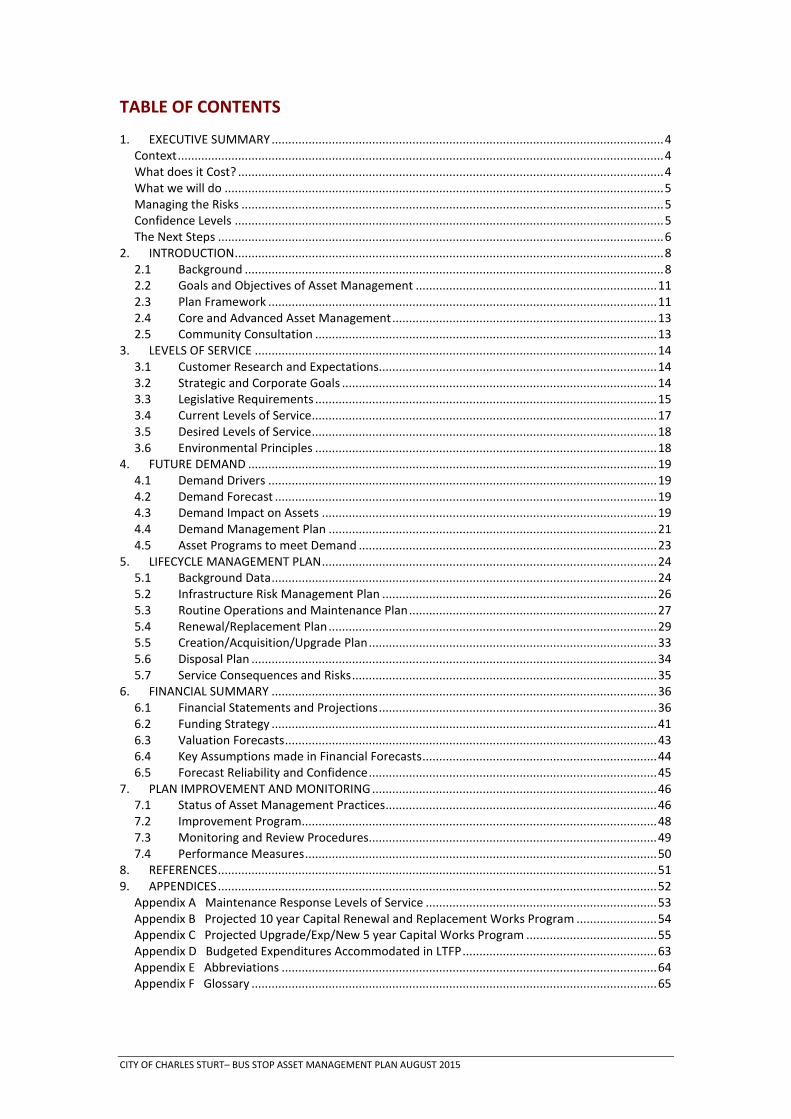
TABLE OF CONTENTS
1. EXECUTIVE SUMMARY ..................................................................................................................... 4 Context ................................................................................................................................................. 4 What does it Cost? ............................................................................................................................... 4 What we will do ................................................................................................................................... 5 Managing the Risks .............................................................................................................................. 5 Confidence Levels ................................................................................................................................ 5 The Next Steps ..................................................................................................................................... 6
2. INTRODUCTION ................................................................................................................................ 8 2.1 Background ............................................................................................................................. 8 2.2 Goals and Objectives of Asset Management ........................................................................ 11 2.3 Plan Framework .................................................................................................................... 11 2.4 Core and Advanced Asset Management ............................................................................... 13 2.5 Community Consultation ...................................................................................................... 13
3. LEVELS OF SERVICE ........................................................................................................................ 14 3.1 Customer Research and Expectations ................................................................................... 14 3.2 Strategic and Corporate Goals .............................................................................................. 14 3.3 Legislative Requirements ...................................................................................................... 15 3.4 Current Levels of Service ....................................................................................................... 17 3.5 Desired Levels of Service ....................................................................................................... 18 3.6 Environmental Principles ...................................................................................................... 18
4. FUTURE DEMAND .......................................................................................................................... 19 4.1 Demand Drivers .................................................................................................................... 19 4.2 Demand Forecast .................................................................................................................. 19 4.3 Demand Impact on Assets .................................................................................................... 19 4.4 Demand Management Plan .................................................................................................. 21 4.5 Asset Programs to meet Demand ......................................................................................... 23
5. LIFECYCLE MANAGEMENT PLAN .................................................................................................... 24 5.1 Background Data ................................................................................................................... 24 5.2 Infrastructure Risk Management Plan .................................................................................. 26 5.3 Routine Operations and Maintenance Plan .......................................................................... 27 5.4 Renewal/Replacement Plan .................................................................................................. 29 5.5 Creation/Acquisition/Upgrade Plan ...................................................................................... 33 5.6 Disposal Plan ......................................................................................................................... 34 5.7 Service Consequences and Risks ........................................................................................... 35
6. FINANCIAL SUMMARY ................................................................................................................... 36 6.1 Financial Statements and Projections ................................................................................... 36 6.2 Funding Strategy ................................................................................................................... 41 6.3 Valuation Forecasts ............................................................................................................... 43 6.4 Key Assumptions made in Financial Forecasts ...................................................................... 44 6.5 Forecast Reliability and Confidence ...................................................................................... 45
7. PLAN IMPROVEMENT AND MONITORING ..................................................................................... 46 7.1 Status of Asset Management Practices ................................................................................. 46 7.2 Improvement Program.......................................................................................................... 48 7.3 Monitoring and Review Procedures...................................................................................... 49 7.4 Performance Measures ......................................................................................................... 50
8. REFERENCES ................................................................................................................................... 51 9. APPENDICES ................................................................................................................................... 52
Appendix A Maintenance Response Levels of Service ..................................................................... 53 Appendix B Projected 10 year Capital Renewal and Replacement Works Program ........................ 54 Appendix C Projected Upgrade/Exp/New 5 year Capital Works Program ....................................... 55 Appendix D Budgeted Expenditures Accommodated in LTFP .......................................................... 63 Appendix E Abbreviations ................................................................................................................ 64 Appendix F Glossary ......................................................................................................................... 65
CITY OF CHARLES STURT– BUS STOP ASSET MANAGEMENT PLAN AUGUST 2015
- 4 -
1. EXECUTIVE SUMMARY
Context
The City of Charles Sturt embraces some of Adelaide’s oldest suburban developments with many housing and business facilities dating back many years. Over time and under current and previous organisation guidance the area has grown to include many diverse services utilising a mixture of infrastructure assets. For many years the City has grown both in size and demand with the coming years being no different in reflecting the State’s 30 year plan for Greater Adelaide for growth. Asset age and therefore intervening investment to ensure maintained condition and service continues to provide the organisation and its staff with a complex challenge. Asset Management Plans provide balance between investment and growth and maintenance.
This Bus Stop Asset Management Plan (AMP) contributes to achieving the appropriate balance of social, cultural, environmental and economic services; the keys to sustainability. Whilst asset planning is about the condition of assets, at the forefront to this planning is our community expectation of these assets, the current and future users.
The Metroticket Bus Stop network within the City of Charles Sturt comprises: • 585 Bus Stops
• Council own 582 of which 245 are currently DDA compliant.
• These Bus Stops have a replacement value of $3,718,630
Bus Shelters are managed under Open Space and Recreation Asset Management Plan.
What does it Cost?
The projected outlays necessary to provide the services covered by this Asset Management Plan (AMP) includes operations, maintenance, renewal and upgrade of existing assets over the 10-year planning period is $7,028,000 or $703,000 on average per year.
The annual approved expenditure on bus stop assets is summarised for 2015/16 as:
Operations
Management $23,000 Project manager $28,000
Total Operations $51,000
Maintenance Routine (Cleaning/Re-sand) $155,000 Reactive $6,000 Total Maintenance $161,000 Upgrades Bus Stop upgrades $250,000
Total Upgrades $250,000
New Total New (5 to 6 PA) $0 There are no new bus stops programed in
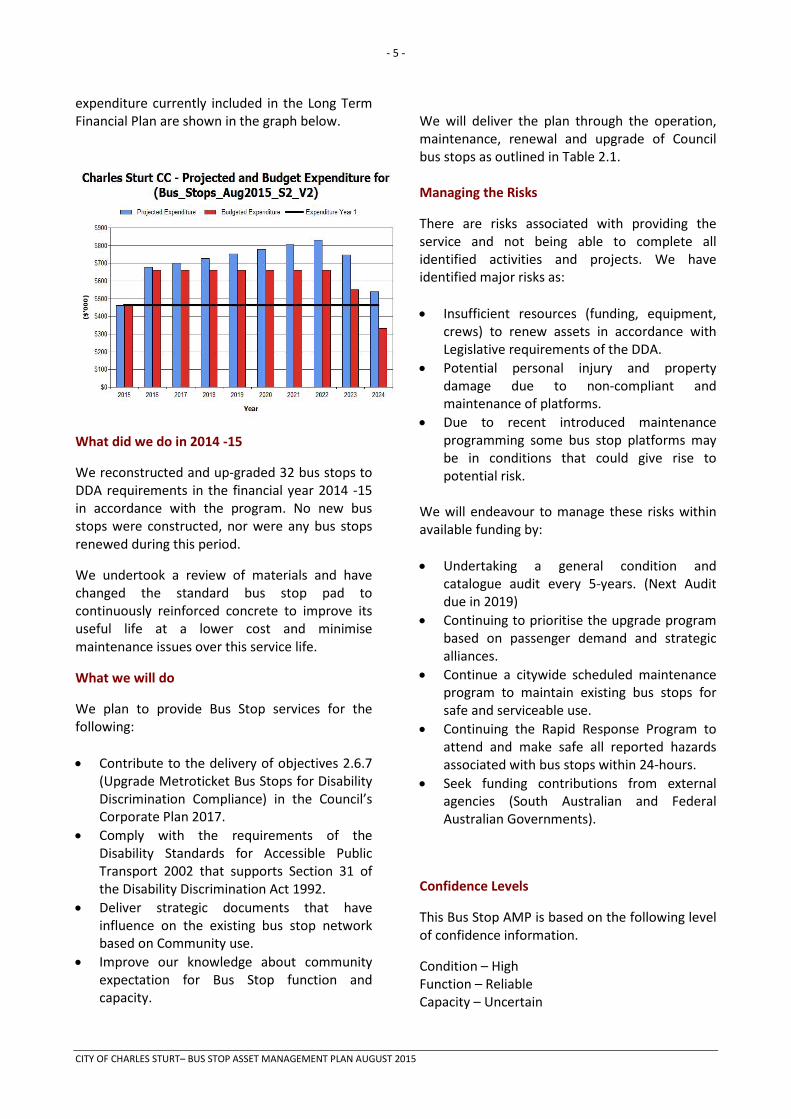
2015 -16 Total Annual Expenditure for 2015/16 $462,000 Estimated available funding (from current Long Term Financial Plan) for this period is $5,980,000 or $598,000 on average per year which is 85% of the cost to provide the service. This is a funding shortfall of $105,000 on average per year. This projected expenditure is high compared to the value of the assets and their useful life as we are required to comply with Australian Government Legislation to provide accessible Bus Stops for use by people with disabilities by 2022. Projected expenditure required to provide services in the Bus Stop AMP compared with planned
CITY OF CHARLES STURT– BUS STOP ASSET MANAGEMENT PLAN AUGUST 2015
- 5 -
expenditure currently included in the Long Term Financial Plan are shown in the graph below.
What did we do in 2014 -15
We reconstructed and up-graded 32 bus stops to DDA requirements in the financial year 2014 -15 in accordance with the program. No new bus stops were constructed, nor were any bus stops renewed during this period.
We undertook a review of materials and have changed the standard bus stop pad to continuously reinforced concrete to improve its useful life at a lower cost and minimise maintenance issues over this service life.
What we will do
We plan to provide Bus Stop services for the following: • Contribute to the delivery of objectives 2.6.7
(Upgrade Metroticket Bus Stops for Disability Discrimination Compliance) in the Council’s Corporate Plan 2017.
• Comply with the requirements of the Disability Standards for Accessible Public Transport 2002 that supports Section 31 of the Disability Discrimination Act 1992.
• Deliver strategic documents that have influence on the existing bus stop network based on Community use.
• Improve our knowledge about community expectation for Bus Stop function and capacity.
We will deliver the plan through the operation, maintenance, renewal and upgrade of Council bus stops as outlined in Table 2.1. Managing the Risks
There are risks associated with providing the service and not being able to complete all identified activities and projects. We have identified major risks as: • Insufficient resources (funding, equipment,
crews) to renew assets in accordance with Legislative requirements of the DDA.
• Potential personal injury and property damage due to non-compliant and maintenance of platforms.
• Due to recent introduced maintenance programming some bus stop platforms may be in conditions that could give rise to potential risk.
We will endeavour to manage these risks within available funding by: • Undertaking a general condition and
catalogue audit every 5-years. (Next Audit due in 2019)
• Continuing to prioritise the upgrade program based on passenger demand and strategic alliances.
• Continue a citywide scheduled maintenance program to maintain existing bus stops for safe and serviceable use.
• Continuing the Rapid Response Program to attend and make safe all reported hazards associated with bus stops within 24-hours.
• Seek funding contributions from external agencies (South Australian and Federal Australian Governments).
Confidence Levels
This Bus Stop AMP is based on the following level of confidence information.
Condition – High Function – Reliable Capacity – Uncertain
CITY OF CHARLES STURT– BUS STOP ASSET MANAGEMENT PLAN AUGUST 2015

- 6 -
In Table 6.5 the quality of the data is assessed as being Highly Reliable as the data set is small, the entire asset class was audited in 2014 and any changes are actioned by one person only. The Dataset is complete and estimated to be accurate ± 2%. The Next Steps
The actions resulting from this Asset Management Plan are: • Continue to undertake an annual review, and
revision as triggered, of the Asset Management Plan using condition based asset data.
• Continue to adopt auditing processes that will ensure the integrity of the Asset Management Plan so the Council can meet its legislative obligations.
• Continue to improve processes to keep the Asset Register and financial General Ledger consistent with each other and up to date using the Works and Assets system.
• Continue to introduce a process to write off assets due to strategic decision, or impacting works, causing need to bring forward the renewal of a bus stop.
• Continue to establish an Environmental Framework that reflects the objectives of ‘Living Green to 2020.
• Continue to work toward funding levels to allow us to comply with the Disability Standards for Accessible Public Transport by 2022.
• Continue to monitor and report progress toward establishing a fully disability compliant Bus Stop network on an annual basis.
• Continue to review the process for recording, monitoring, and actioning reported hazards for data integrity and improved responsiveness. From this review implement a management program to minimise hazards.
• Continue to review and, where possible, simplify the process for recording and actioning requests for Bus Stop maintenance/repairs.
• Continue to improve the recognition of public transport in our transport planning.
• Continue to improve the integration of Bus Stops in other projects.
• Continue to improve financial procedures that identify spending on maintenance, repairs and graffiti at bus stops.
Questions you may have What is this plan about? This asset management plan covers the infrastructure assets that serve the City of Charles Sturt communities for access to road based public transport (Bus Stops only). These assets include constructed areas across roadside verges made with concrete slabs, concrete and clay pavers throughout the community area that enable people to board and disembark metroticket bus services conveniently and safely. What is an Asset Management Plan? Asset management planning is a comprehensive process to ensure delivery of services from infrastructure is provided in a financially sustainable manner.
An asset management plan details information about infrastructure assets including actions required to provide an agreed level of service in the most cost effective manner. The plan defines the services to be provided, how the services are provided and what funds are required to provide the services.
Why there can be a funding shortfall? A funding shortfall occurs when the amount of money being allocated by the Council toward managing these assets is less than that needed to keep them in their current condition, function and capacity or in the case of Bus stops, meet legislative requirements of the DDA.
The reasons for this are many, but within any forecast period, Councils need to make decisions that reflect community aspirations and expectations for facilities, services, and operations that support their quality of life. Each Council must then balance its capacity to meet these aspirations and expectations with their ability to fund the assets, services and operations.
CITY OF CHARLES STURT– BUS STOP ASSET MANAGEMENT PLAN AUGUST 2015
- 7 -
As assets reach the end of their useful life, many show decreased service and function; and require increased maintenance. In many cases the cost of the additional maintenance escalates rapidly so that when the total amount of funds available for Council services and operations is capped, it means that there less money is available for renewal activity.
What options do we have? Resolving the funding shortfall involves several steps: 1. Improving asset knowledge so that data
accurately records the asset inventory, how assets are performing and when assets are not able to provide the required service levels,
2. Improving our efficiency in operating, maintaining, renewing and replacing existing assets to optimise life cycle costs,
3. Identifying and managing risks associated with providing services from infrastructure,
4. Making trade-offs between service levels and costs to ensure that the community receives the best return from infrastructure,
5. Identifying assets surplus to needs for disposal to make saving in future operations and maintenance costs,
6. Consulting with the community to ensure that bus stop services and costs meet community needs and are affordable,
7. Developing partnership with other bodies, where available to provide services,
8. Seeking additional funding from governments and other bodies to better reflect a ‘whole of government’ funding approach to infrastructure services.
What happens if we don’t manage the shortfall? A funding shortfall means that there will be a decrease in one, or more of the asset condition, function, or capacity. This may be acceptable to the community due to other priority. There is a limit to how far these can reduce before the asset becomes unserviceable and not fit for purpose. Continued degradation of assets leads to a ‘future generations can pay’ attitude, or a need to stop the service being provided by the asset and remove the asset, both options are not seen to be a sustainable long term outcome.
CITY OF CHARLES STURT– BUS STOP ASSET MANAGEMENT PLAN AUGUST 2015
- 8 -
2. INTRODUCTION
2.1 Background
This asset management plan is to demonstrate responsive management of assets (and services provided from assets), compliance with regulatory requirements, and to communicate funding needed to provide the required levels of service over a 20 year planning period.
The asset management plan follows the format for AM Plans recommended in Section 4.2.6 of the International Infrastructure Management Manual1.
The asset management plan is to be read with the organisation’s Asset Management Policy, Asset Management Strategy and the following associated planning documents:
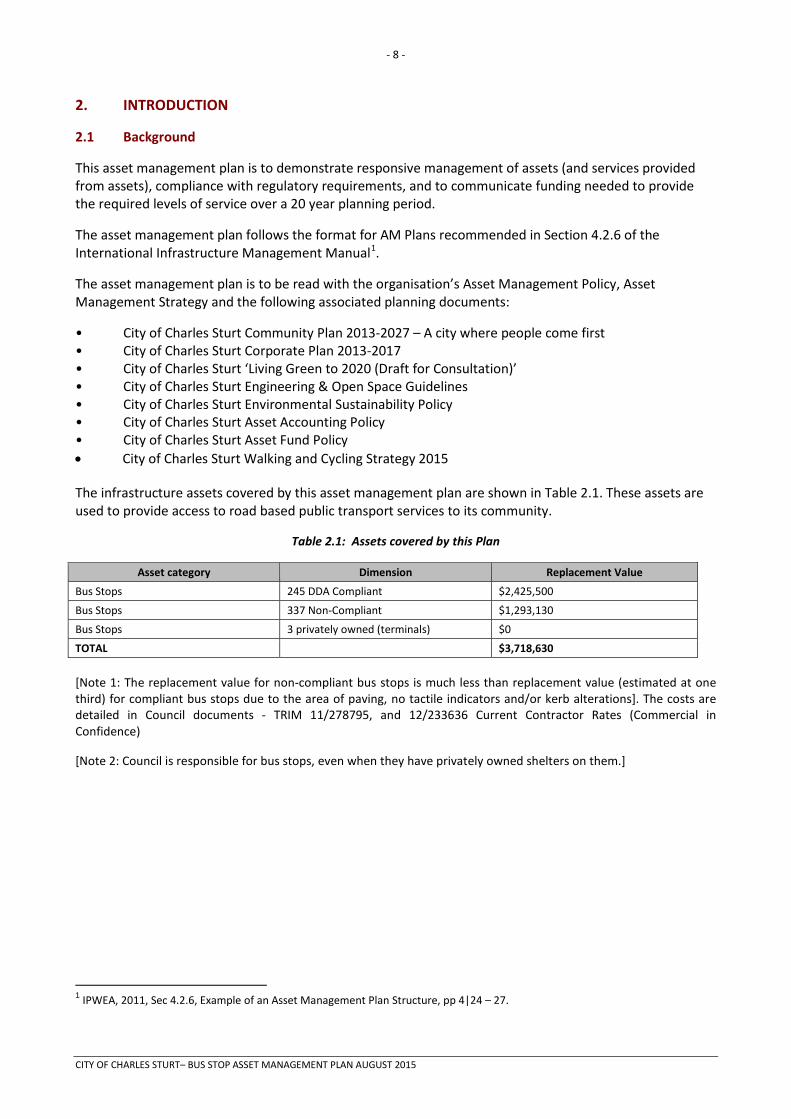
• City of Charles Sturt Community Plan 2013-2027 – A city where people come first • City of Charles Sturt Corporate Plan 2013-2017 • City of Charles Sturt ‘Living Green to 2020 (Draft for Consultation)’ • City of Charles Sturt Engineering & Open Space Guidelines • City of Charles Sturt Environmental Sustainability Policy • City of Charles Sturt Asset Accounting Policy • City of Charles Sturt Asset Fund Policy • City of Charles Sturt Walking and Cycling Strategy 2015 The infrastructure assets covered by this asset management plan are shown in Table 2.1. These assets are used to provide access to road based public transport services to its community.
Table 2.1: Assets covered by this Plan
Asset category Dimension Replacement Value
Bus Stops 245 DDA Compliant $2,425,500
Bus Stops 337 Non-Compliant $1,293,130
Bus Stops 3 privately owned (terminals) $0
TOTAL $3,718,630 [Note 1: The replacement value for non-compliant bus stops is much less than replacement value (estimated at one third) for compliant bus stops due to the area of paving, no tactile indicators and/or kerb alterations]. The costs are detailed in Council documents - TRIM 11/278795, and 12/233636 Current Contractor Rates (Commercial in Confidence)
[Note 2: Council is responsible for bus stops, even when they have privately owned shelters on them.]
1 IPWEA, 2011, Sec 4.2.6, Example of an Asset Management Plan Structure, pp 4|24 – 27.
CITY OF CHARLES STURT– BUS STOP ASSET MANAGEMENT PLAN AUGUST 2015

- 9 -
Key stakeholders in the preparation and implementation of this asset management plan are: Shown in Table 2.1.1.
Table 2.1.1: Key Stakeholders in the AM Plan
Key Stakeholder Role in Asset Management Plan
Councillors/Board Members • Represent needs of community/shareholders, • Allocate resources to meet the organisation’s objectives in providing services
while managing risks, • Ensure organisation is financial sustainable.
Chief Executive Officer (CEO) • Allocate resources to meet the organisation’s objectives in providing services while managing risks,
• Ensure organisation is financial sustainable.
General Manager of Asset Management Services
• Overall responsibility for Asset Management • Ensure funds are invested appropriately to ensure best value for money is
delivered to the community • Provide leadership in influencing decision making processes related to AM.
Asset Management Portfolio Managers • Provide Leadership for effective Asset Management. • Identify resource requirements for delivering various assets management
services to the community • Ensuring Asset Management services are provided in accordance with
Corporate Plan and organisation priorities. • Deliver services in a cost effective and sustainable manner.
Asset Managers of the Asset Classes • Identifying resource requirements for specific asset classes. • Responsible for reviewing and keeping AM plan up to date • Responsible for preparing budget submissions in accordance with the AM
plan • Delivering nominated renewal, upgrade projects. • Responsible for Asset Officer. • Coordinate with Asset officers and field workgroup leaders to identify areas
of need, process improvement.
Asset Officers and Data Owners • Custodian of Asset data • Responsible for keeping asset data up to date • Preparation of asset management Plan • Financial accounting for assets
Field workgroups and their leaders • Operation and Maintenance management to meet agreed levels of service. • Highlight issues requiring attention of senior management.
Internal users of Asset Services (e.g. Library and Community Servicers)
• Provide timely advice as to future asset usage and requirements • Communicate asset condition and maintenance requirements as needed
The community (residents, businesses, property owners)
• Be aware of service levels and costs. • Participate in consultation processes • Provide feedback on services.
State and Federal Government • Provide Leadership in promoting Best Practice Asset management • Facilitate Training and Education Re: Current AM Plan • Recognising the importance of LG Assets to community and provide funding
and other assistance to sustain
CITY OF CHARLES STURT– BUS STOP ASSET MANAGEMENT PLAN AUGUST 2015
- 10 -
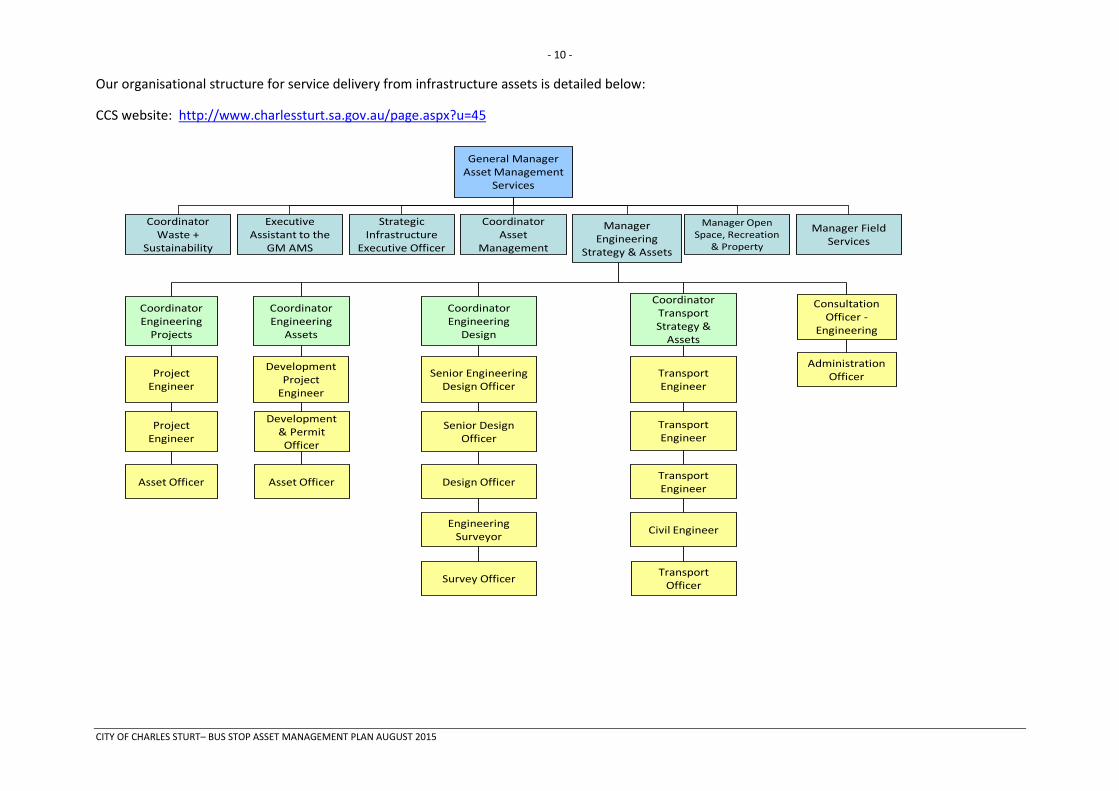
Our organisational structure for service delivery from infrastructure assets is detailed below:
CCS website: http://www.charlessturt.sa.gov.au/page.aspx?u=45
General Manager Asset Management
Services
Coordinator Waste +
Sustainability
Executive Assistant to the
GM AMS
Strategic Infrastructure
Executive Officer
Coordinator Asset
Management
Manager Open Space, Recreation
& Property
Manager Field Services
Manager Engineering
Strategy & Assets
Administration Officer
CoordinatorEngineering
Projects
Coordinator Engineering
Assets
Coordinator Engineering
Design
Coordinator Transport Strategy &
Assets
Consultation Officer -
Engineering
Development Project
Engineer
Development & Permit Officer
Asset Officer
Transport Engineer
Transport Engineer
Transport Engineer
Civil Engineer
Transport Officer
Project Engineer
Project Engineer
Asset Officer
Senior Engineering Design Officer
Senior Design Officer
Design Officer
Engineering Surveyor
Survey Officer
CITY OF CHARLES STURT– BUS STOP ASSET MANAGEMENT PLAN AUGUST 2015
- 11 -
2.2 Goals and Objectives of Asset Management
The organisation exists to provide services to its community. Some of these services are provided by infrastructure assets. We have acquired infrastructure assets by ‘purchase’, by contract, construction by our staff and by donation of assets constructed by developers and others to meet increased levels of service.
Our goal in managing infrastructure assets is to meet the defined level of service (as amended from time to time) in the most sustainable (including cost effective) manner for present and future consumers. The key elements of infrastructure asset management are:
• Providing a defined level of service and monitoring performance, • Managing the impact of growth through demand management and infrastructure investment, • Taking a lifecycle approach to developing cost-effective management strategies for the long-term that meet
the defined level of service, • Identifying, assessing and appropriately controlling risks, • Having a long-term financial plan which identifies required, affordable expenditure and how it will be
financed.2 • Sustainability - “meeting the needs of the present without compromising the ability of future generation to
meet their own needs.” (World Commission on Environment and Development. (1987). Our Common Future. The Bruntland Commission, UNESCO)
2.3 Plan Framework
Key elements of the plan are
• Levels of service – specifies the services and levels of service to be provided by the organisation, • Future demand – how this will impact on future service delivery and how this is to be met, • Life cycle management – how we will manage our existing and future assets to provide defined levels of
service, • Financial summary – what funds are required to provide the defined services, • Asset management practices, • Monitoring – how the plan will be monitored to ensure it is meeting the organisation’s objectives, • Asset management improvement plan.
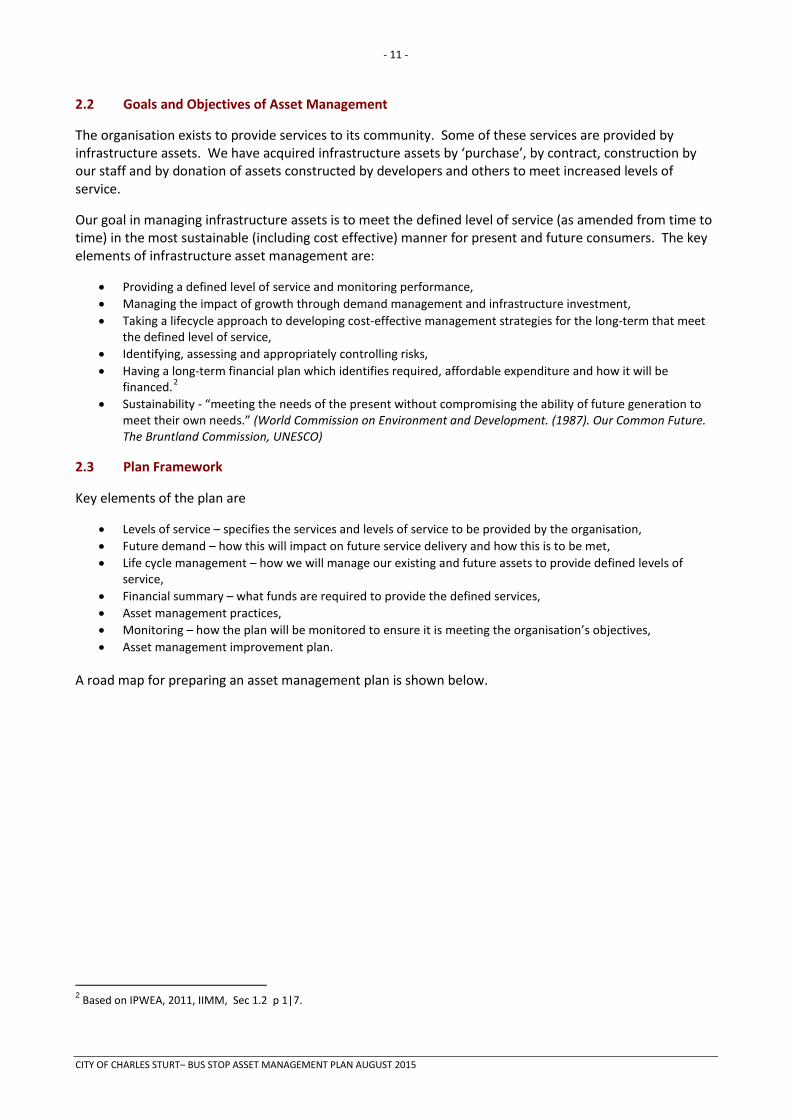
A road map for preparing an asset management plan is shown below.
2 Based on IPWEA, 2011, IIMM, Sec 1.2 p 1|7.
CITY OF CHARLES STURT– BUS STOP ASSET MANAGEMENT PLAN AUGUST 2015

- 12 -
Road Map for preparing an Asset Management Plan Source: IPWEA, 2006, IIMM, Fig 1.5.1, p 1.11.
IS THE PLAN AFFORDABLE?
CORPORATE PLANNINGConfirm strategic objectives and establish AM policies, strategies & goals. Define responsibilities & ownership.Decide core or advanced AM Pan.Gain organisation commitment.
REVIEW/COLLATE ASSET INFORMATIONExisting information sourcesIdentify & describe assets.Data collectionCondition assessmentsPerformance monitoringValuation Data
ESTABLISH LEVELS OF SERVICEEstablish strategic linkagesDefine & adopt statementsEstablish measures & targetsConsultation
LIFECYCLE MANAGEMENT STRATEGIESDevelop lifecycle strategiesDescribe service delivery strategyRisk management strategiesDemand forecasting and managementOptimised decision making (renewals, new works, disposals)Optimise maintenance strategies
FINANCIAL FORECASTSLifecycle analysisFinancial forecast summaryValuation DepreciationFunding
IMPROVEMENT PLANAssess current/desired practicesDevelop improvement plan
ITERATIONReconsider service statementsOptions for fundingConsult with CouncilConsult with Community
DEFINE SCOPE & STRUCTURE OF PLAN
INFO
RM
ATI
ON
MA
NA
GE
ME
NT,
and
DA
TA IM
PR
OV
EM
EN
T
AM PLAN REVIEW AND
AUDIT
IMPLEMENT IMPROVEMENT
STRATEGY
ANNUAL PLAN / BUSINESS PLAN
INFO
RM
ATI
ON
MA
NA
GE
ME
NT,
and
DA
TA IM
PR
OV
EM
EN
T
CITY OF CHARLES STURT– BUS STOP ASSET MANAGEMENT PLAN AUGUST 2015
- 13 -
2.4 Core and Advanced Asset Management
This asset management plan is prepared as a ‘core’ asset management plan over a 20 year planning period in accordance with the International Infrastructure Management Manual3. It is prepared to meet minimum legislative and organisational requirements for sustainable service delivery and long term financial planning and reporting. Core asset management is a ‘top down’ approach where analysis is applied at the ‘system’ or ‘network’ level.
Future revisions of this Asset Management Plan will move towards ‘advanced’ asset management using a ‘bottom up’ approach for gathering asset information for individual assets to support the optimisation of activities and programs to meet agreed service levels. The City of Charles Sturt has recently implemented a centralised Asset Management Information System that includes consolidated asset registers and a works planning system. It is envisaged that this system will be a pivotal tool in the journey from core to advanced Asset Management Planning.
3 IPWEA, 2011, IIMM.
CITY OF CHARLES STURT– BUS STOP ASSET MANAGEMENT PLAN AUGUST 2015

- 14 -
3. LEVELS OF SERVICE
3.1 Customer Research and Expectations
The organisation has not carried out any targeted research on customer expectations with regards to preparing this plan. This will be investigated for future updates of the asset management plan.
It should be noted however that initial outcomes from the community consultation surrounding the revised long term community plan revision has been incorporated where applicable.
The organisation uses this information in developing its Strategic Plan and in allocation of resources in the budget.
3.2 Strategic and Corporate Goals
This asset management plan is prepared under the direction of the organisation’s Community, Sustainability and Corporate Plans.Relevant organisation goals and objectives and how these are addressed in this asset management plan are:
Table 3.2: Organisation Goals and how these are addressed in this Plan
Goal Objective Strategy
• Liveability and Place
Create and maintain an integrated, attractive and safe transport network that emphasises and focuses on pedestrians and cyclists.
• Improved routine maintenance.
• Establish an integrated Transport Plan addressing future growth and community aspiration for safe transport networks with high level of transport choice.
• Implement Transport and Parking Plans and Local Area Traffic Management Plans.
Advocate for a connected, safe and well maintained major road network and public transport system.
Programmed renewal and upgrade of bus stops.
Create public places that add interest and vibrancy for residents and visitors to our city
Continued responsive safety and vandalism responses.
• Leadership Ensure finances and assets are managed to support changing community needs in a sustainable cost effective way.
• Develop and regularly review the Long Term Financial Plan to ensure long term financial sustainability.
• Regularly review asset management plans for council approval
• Implement asset renewals in line with asset management plans so that the condition of assets is not deteriorating.
• Manage the growth of new assets in response to community demand in a financially responsible way as forecast through the Long Term Financial Plan
CITY OF CHARLES STURT– BUS STOP ASSET MANAGEMENT PLAN AUGUST 2015
- 15 -
• Establish and monitor internal controls in accordance with legislative requirements,
The organisation will exercise its duty of care to ensure public safety in accordance with the infrastructure risk management plan prepared in conjunction with this AM Plan. Management of infrastructure risks is covered in Section 5.2
3.3 Legislative Requirements
We have to meet many legislative requirements including Australian and State legislation and State regulations. These include:
Table 3.3: Legislative Requirements
Legislation Requirement
South Australian Local Government Act 1999
Sets out role, purpose, responsibilities and powers of local governments including the preparation of a long term financial plan supported by asset management plans for sustainable service delivery.
South Australian State Records Act 1997
To ensure the City of Charles Sturt records and stores all relevant information as set out by the State Government of SA
Environment Protection Act 1993 To ensure that all reasonable and practicable measures are taken to protect, restore and enhance the quality of the environment having regard to the principles of ecologically sustainable development
Occupational Health, Safety and Welfare Act 1986
To take a constructive role in promoting improvements in occupational health, safety and welfare practices and assisting in the preservation of public health and safety in all undertakings of the organisation.
Development Act 1993 An act to provide for planning and regulate development in the state; to regulate the use and management of land and building and for other purposes
Public And Environmental Health Act 1987
An Act Dealing With Public And Environmental Health; To Repeal The Health Act 1935, The Noxious Trades Act 1934 And The Venereal Diseases Act 1947; And For Other Purposes.
Australian Road Rules An act which gives road authorities in each state delegated power to establish standards for all aspects of roadways, including paths and shared use paths.
Disability Discrimination Act 1992 Provides protection for everyone in Australia against discrimination based on disability. It encourages everyone to be involved in implementing the Act and to share in the overall benefits to the community and the economy that flow from participation by the widest range of people.
Disability Discrimination Act The Australian Government introduced the Disability Standards for Accessible Public Transport 2002 to support sub-section 31(1) of the Disability Discrimination Act 1992 requiring all public transport to be accessible to people with disabilities. The regulation nominates responsibility, details actions and schedules compliance targets. The standard nominates Local Government as being the authority responsible for bus stop infrastructure. Metropolitan councils have care and control of bus stops (even on arterial roads) and as such must provide for DDA compliance. The buses are operated by the “service operators” (Torrens Transit, etc) and these operators are responsible for altering buses so they can be accessed from kerbsides. Among other things, the Passenger Transport Division (PTD) of the Department of Planning Transport & Infrastructure manages the service providers and identifies service improvements such as service route alterations and bus stop locations.
CITY OF CHARLES STURT– BUS STOP ASSET MANAGEMENT PLAN AUGUST 2015
- 16 -
The requirement on Councils is compliance with the relevant Standard for bus stops in relation to: • Access paths (Part 1.9 and 2) • Handrails and grab rails (Part 11) • Manoeuvring areas (Part 3) • Stairs (Part 14) • Passing areas (Part 4) • Symbols (Part 16) • Ramps (Part 6) • Signs (Part 17) • Waiting areas (Part 7) • Tactile ground surface indicators
(Part 18) • Boarding (Part 8) • Lighting (Part 20) • Allocated Space (Part 9) • Street Furniture (Part 23) • Surfaces (Part 10) • Information (Part 27)
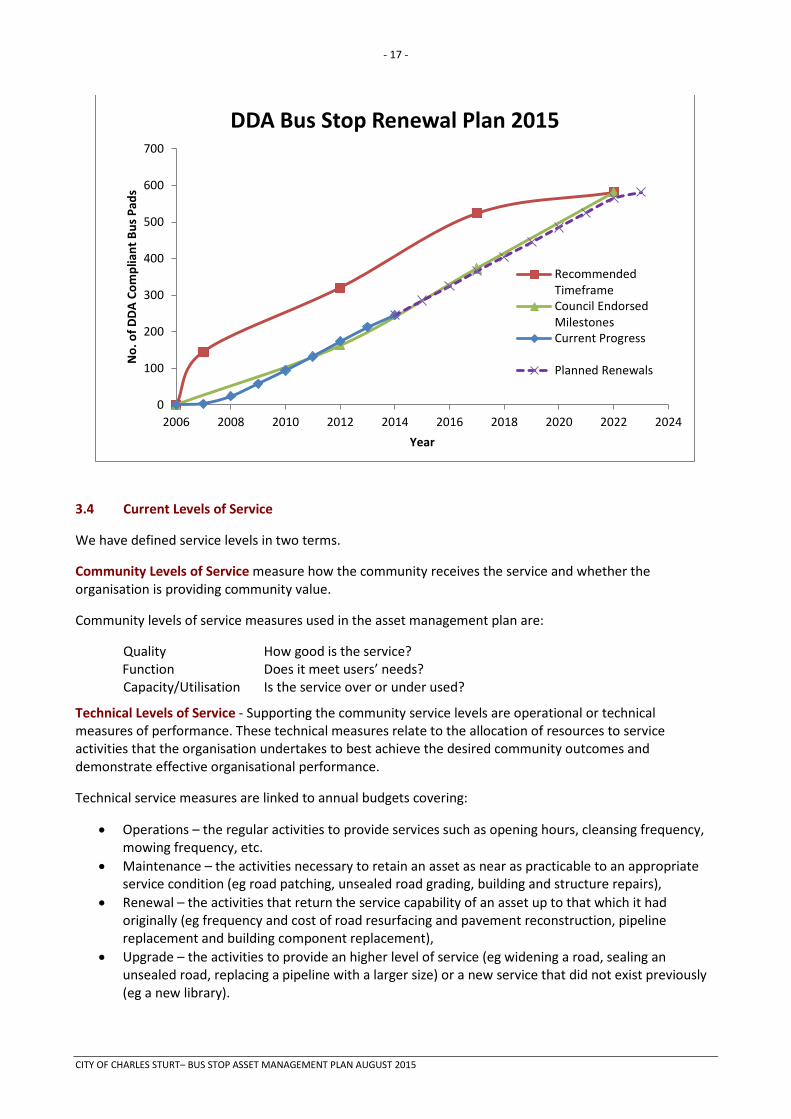
Note: DDA does not require a shelter or seat at a bus stop, but if these are provided they must be DDA compliant. The Disability Standards for Accessible Public Transport 2002 set out the following timeframes for compliance: 31 December 2007 - 25% of bus stops DDA compliant 31 December 2012 - 55% of bus stops DDA compliant 31 December 2017 - 90% of bus stops DDA compliant 31 December 2022 - 100% of bus stops DDA compliant In a report endorsed by the Asset Management Committee on 11th February 2008 ‘Metroticket Bus Stops – DDA Legislative Compliance and Bus Shelters’, B577,B719, Item 3.12, discussed the standard, Council’s responsibility, how the standard can be interpreted and Council capacity to fund asset renewal for compliance by 2022. The report nominated the following compliance milestones: 31 December 2012 - 28% of bus stops DDA compliant 31 December 2017 - 64% of bus stops DDA compliant 31 December 2022 - 100% of bus stops DDA compliant As at 31 December 2014, 245 or 42% of Bus Stops were DDA compliant. The progress of DDA compliant bus stop renewals has been monitored annually and is shown in the graph below. This shows that the first council agreed milestone has been achieved in 2012. The program is now marginally underfunded and will not meet the 2020 legislative timeframe for all Bus Stops to be DDA compliant by 12 months. The Long Term Financial Plan provided funding to meet the legislative requirement; however annual budgeting has reduced the required amount in the 2015 -16 financial year. If this reduced funding occurs in future budget cycles the program will be completed well beyond the Legislative requirements.
CITY OF CHARLES STURT– BUS STOP ASSET MANAGEMENT PLAN AUGUST 2015
- 17 -
3.4 Current Levels of Service
We have defined service levels in two terms.
Community Levels of Service measure how the community receives the service and whether the organisation is providing community value.
Community levels of service measures used in the asset management plan are:
Quality How good is the service? Function Does it meet users’ needs? Capacity/Utilisation Is the service over or under used?
Technical Levels of Service - Supporting the community service levels are operational or technical measures of performance. These technical measures relate to the allocation of resources to service activities that the organisation undertakes to best achieve the desired community outcomes and demonstrate effective organisational performance.
Technical service measures are linked to annual budgets covering:
• Operations – the regular activities to provide services such as opening hours, cleansing frequency, mowing frequency, etc.
• Maintenance – the activities necessary to retain an asset as near as practicable to an appropriate service condition (eg road patching, unsealed road grading, building and structure repairs),
• Renewal – the activities that return the service capability of an asset up to that which it had originally (eg frequency and cost of road resurfacing and pavement reconstruction, pipeline replacement and building component replacement),
• Upgrade – the activities to provide an higher level of service (eg widening a road, sealing an unsealed road, replacing a pipeline with a larger size) or a new service that did not exist previously (eg a new library).
0
100
200
300
400
500
600
700
2006 2008 2010 2012 2014 2016 2018 2020 2022 2024
No.
of D
DA C
ompl
iant
Bus
Pad
s
Year
DDA Bus Stop Renewal Plan 2015
RecommendedTimeframeCouncil EndorsedMilestonesCurrent Progress
Planned Renewals
CITY OF CHARLES STURT– BUS STOP ASSET MANAGEMENT PLAN AUGUST 2015
- 18 -
Asset managers plan, implement and control technical service levels to influence the customer service levels.4
3.5 Desired Levels of Service
At present, indications of desired levels of service are obtained from various sources including residents’ feedback to Councillors and staff, service requests and correspondence. We have yet to quantify desired levels of service beyond this. This will be done in future revisions of this asset management plan. 3.6 Environmental Principles
The general principles applying to this Asset Management Plan that assist to deliver the objectives of ‘Living Green to 2020 (Draft for Consultation)’are: Sourcing local materials, Using material sourced from recycled products, Selecting stable material with long EULs, Selecting material with lower carbon emission in production, Selecting material with high imbedded carbon content, Choosing to use energy efficient equipment, Choosing to use energy efficient construction techniques, Designing infrastructure to minimise the need to remove material, Selecting material that maximise absorption of rainwater, Using programmed periodic maintenance to optimise EULs.
The application of the above principles varies and is not documented. The principles need further consideration and will be included in future revisions of the CCS Bus Stop standards guideline as an environmentally focused framework for material selection and work practices.
4 IPWEA, 2011, IIMM, p 2.22
CITY OF CHARLES STURT– BUS STOP ASSET MANAGEMENT PLAN AUGUST 2015

- 19 -
4. FUTURE DEMAND
4.1 Demand Drivers
Drivers affecting demand include population change, changes in demographics, seasonal factors, vehicle ownership rates, consumer preferences and expectations, technological changes, economic factors, agricultural practices, environmental awareness, etc.
4.2 Demand Forecast
The present position and projections for demand drivers that may impact future service delivery and utilisation of assets were identified and are documented in Table 4.3.
4.3 Demand Impact on Assets
The impact of demand drivers that may affect future service delivery and utilisation of assets are shown in Table 4.3.
Table 4.3: Demand Drivers, Projections and Impact on Services
Demand drivers Present position Projection Impact on services
Population change Year Population
2015 112,714
Year Population 2016 115,037 2021 120,658 2026 125,889
Increased demand from the disabled and elderly.
Demographic change Age/Year 2015 0-4 6%
5-14 10% 15-24 13% 25-44 28% 45-64 26% 65-74 9% 75+ 10%
Age/Year 2016 2021 2026 0-4 6% 5% 5%
5-14 11% 11% 11% 15-24 12% 12% 12% 25-44 27% 26% 25% 45-64 25% 26% 25% 65-74 10% 10% 10% 75+ 9% 10% 11%
Marginally increased demand for greater public transport access, with compliance with DDA design and construction requirements.
Community expectation change
Community accepts bus stops without too much demand for cleaning and untidy edges.
Anticipate increased demand for clean and tidy areas reflection on the value and condition of properties.
Need to establish a scheduled bus stop maintenance program.
Legislative change Bus stops provided, constructed according to current legislation.
Bus stops provided, constructed (and possibly) maintained according to future legislative requirements.
Unknown, likely to be greater regulation.
More litigious society Claims against council for personal injury or discrimination are low.
Claims against council for personal injury and discrimination incidence that occur could increase.
Increased cost in defending council actions and payments to claimants.
Land use densification Much of the council area has low, or low/medium density land uses being residential and industry.
Delivery of the North West Growth Corridor in accordance with the ‘30-Year Plan for Greater Adelaide’ may replace industrial areas with mixed-uses including medium/high density residential.
Greater demand for public transport in the growth corridor.
CITY OF CHARLES STURT– BUS STOP ASSET MANAGEMENT PLAN AUGUST 2015
- 20 -
Demand drivers Present position Projection Impact on services
Urban consolidation Much of the council area has low, or low/medium density residential land uses with older housing stock not suited to current expectations.
Increasing demolition of houses and subdivision into 2-3 allotments, most applicable outside the growth corridor.
Installation of utility services through bus stop platforms causing loss of integrity of platform structure, damage, poor reinstatement, or not reinstated.
Telecommunication advances
Properties serviced primarily by the Telstra network with some other minor companies.
Installation of National Broadband Network.
Installation of utility services through bus stop platforms causing loss of integrity of platform structure, damage, poor reinstatement, or not reinstated.
Transport changes Very high use of motor vehicles for most trips.
High cost motor vehicle trips and parking in the Adelaide CBD , especially for commuter trips to work.
Increased demand for public transport.
Lifestyle changes Community just becoming aware of health benefits of physical activity such as walking and cycling starting to undertake more of these activities.
Increase in no, or 1 motor car families increases the demand for public transport.
Increased demand for responsive maintenance, repairs and establishing cleaning and tidying services.
Council financial sustainability
Council Long Term Financial Plan has been able to meet the required budgets to deliver most components to manage the bus stop assets.
Limited revenue growth in Council rates and reduced size of grants from other tiers of government not matching required asset expenditures.
Decreased ability to fund timely renewal and upgrade of poor/very poor condition asset, and Increased need for maintenance and repairs.
Council operational & services priority changes
Local government is inheriting services from State and Federal governments, and taking up new operations and services in response to community demand.
This trend is likely to accelerate, but there is limited revenue growth to fund them placing pressure on all operations and services including asset provision and maintenance.
Decreased ability to fund timely renewal and upgrade of poor/very poor condition asset, and Increased need for maintenance and repairs.
Ageing workforce CCS employs approximately 168 field staff with a median age of 47 years.
Many of these staff and their skills will be lost. Increased shortage of skilled people to replace them.
Inefficient operations and services decreasing responsiveness, and Increasing risk of poor workmanship requiring return visits.
Environmental sustainability
Bus Stops are constructed to withstand existing environmental conditions.
More frequent extreme weather events and increased exposure to radiation effects.
More rapid deterioration of platforms, increasing frequency of inspections and maintenance and repairs.
CITY OF CHARLES STURT– BUS STOP ASSET MANAGEMENT PLAN AUGUST 2015
- 21 -
4.4 Demand Management Plan
Demand for new services will be managed through a combination of managing existing assets, upgrading of existing assets and providing new assets to meet demand and demand management. Demand management practices include non-asset solutions, insuring against risks and managing failures.
Non-asset solutions focus on providing the required service without the need for the organisation to own the assets and management actions including reducing demand for the service, reducing the level of service (allowing some assets to deteriorate beyond current service levels) or educating customers to accept appropriate asset failures5. Examples of non-asset solutions include providing services from existing infrastructure such as aquatic centres and libraries that may be in another community area or public toilets provided in commercial premises.
Opportunities identified to date for demand management are shown in Table 4.4. Further opportunities will be developed in future revisions of this asset management plan.
Table 4.4: Demand Management Plan Summary
Demand drivers Impact on services Demand Management Plan
Population change Increased demand from the disabled and elderly
Negotiate with developers where a development affects bus stops so they are upgraded to DDA complaint standard. Review current development and transport documents for impacts on public transport system.
Demographic change Marginally increased demand for greater public transport access, with compliance with DDA design and construction requirements.
Determine the areas where these demographic changes are likely to be greatest and give priority to upgrading bus stops and walking routes to them in those areas.
Community expectation change
Need to establish a scheduled bus stop maintenance program.
Discuss options for greater provision for these services with Field Services Portfolio to develop a strategy to fund these additional services.
Legislative change Unknown, likely to be greater regulation.
Be aware of any proposed changes to legislation, or introduction of new legislation that may impact on bus stops, and advocate for reasonableness of intent and impact.
More litigious society Increased cost in defending council actions and payments to claimants.
Improve work recording and retrieval systems. Improve the responsiveness and timelines of maintenance and repair activities.
Land use densification Greater activity for all bus stops in the growth corridor.
Identify the increase in population and workplace opportunities in the growth corridor to determine likely increased demand for bus stop facilities and access (including associated safe crossing places over arterial roads).
Urban consolidation Installation of utility services through bus stop platforms causing loss of integrity of platform structure, damage, poor reinstatement, or not reinstated.
Work with developers and service authorities to make them aware of their responsibilities under the DDA 1992. Improve our monitoring of, and response to poor workmanship by contractors for service authorities including reinspection within 12 months.
5 IPWEA, 2011, IIMM, Table 3.4.1, p 3|58.
CITY OF CHARLES STURT– BUS STOP ASSET MANAGEMENT PLAN AUGUST 2015
- 22 -
Demand drivers Impact on services Demand Management Plan
Telecommunication advances
Installation of utility services through bus stop platforms causing loss of integrity of platform structure, damage, poor reinstatement, or not reinstated.
Work with developers and service authorities to make them aware of their responsibilities under the DDA 1992. Improve our monitoring of, and response to poor workmanship by contractors for service authorities including reinspection within 12 months.
Transport changes Increased demand for public transport.
Raise the priority of bus stop upgrades to areas of greatest demand.
Lifestyle changes Increased demand for responsive maintenance, repairs and establishing cleaning and tidying services.
Discuss options for greater provision for these services with Field Services Portfolio to develop a strategy to fund these additional services.
Council financial sustainability
Decreased ability to fund timely renewal and upgrade of poor/very poor condition asset, and Increased need for maintenance and repairs.
Advocate the importance of the public transport access to all members of the community.
Ageing workforce Inefficient operations and services decreasing responsiveness, and Increasing risk of poor workmanship requiring return visits.
Ensure that our Field Services are known for its ‘Constructive’ behavioural culture so we are a workplace of choice. Identify ways to improve employee training.
Environmental sustainability
More rapid deterioration of platforms, increasing frequency of inspections and maintenance and repairs.
Review material selection and work practices for higher standards offsetting these climatic effects.
CITY OF CHARLES STURT– BUS STOP ASSET MANAGEMENT PLAN AUGUST 2015
- 23 -
4.5 Asset Programs to meet Demand
Some new assets required to meet growth will be acquired free of cost from land developments and constructed/acquired by the organisation. New assets constructed/acquired by the organisation are discussed in Section 5.5. The cumulative value of new contributed and constructed asset values are summarised in Figure 1.
Figure 1: Upgrade and New Assets to meet Demand
Acquiring these new assets will commit the organisation to fund ongoing operations, maintenance and renewal costs for the period that the service provided from the assets is required. These future costs are identified and considered in developing forecasts of future operations, maintenance and renewal costs in Section 5.
CITY OF CHARLES STURT– BUS STOP ASSET MANAGEMENT PLAN AUGUST 2015
- 24 -
5. LIFECYCLE MANAGEMENT PLAN
The lifecycle management plan details how the organisation plans to manage and operate the assets at the agreed levels of service (defined in Section 3) while optimising life cycle costs.
5.1 Background Data
5.1.1 Physical parameters
The assets covered by this asset management plan are shown in Table 2.1.
The Australian Government introduced the Disability Standards for Accessible Public Transport 2002 (the Standards) requiring all public transport to be accessible to people with disabilities. The regulation nominates responsibility, details actions and schedules compliance targets. See 3.3 Legislative Requirements
Although the age profile information is currently available, it has not been used in this Asset Management Plan due to the need to further develop the spatial relationship of the data and family incomes to bus stop locations. The age and income data will be used in future revisions of the Asset Management Plan and is noted in the Improvements section of this plan.
5.1.2 Asset capacity and performance
The organisation’s services are generally provided to meet design standards where these are available.
Locations where deficiencies in service performance are known are detailed in Table 5.1.2.
Table 5.1.2: Known Service Performance Deficiencies
Service Deficiency
Restricted access for people using a mobility aid needing a DDA compliant Bus Stop.
Limited connections to modes of public transport and between public transport stops.
Bus stops constructed with widths and design that do not support current types of use (inappropriate function). The above service deficiencies were identified from;
• Known non-compliance with DDA requirements gathered from the 2013 condition audit, • Information from inspection reports and experienced field staff, • Feedback from residents via Customer Request Management System,
5.1.3 Asset condition
A general audit by persons trained in condition auditing is conducted regularly, every 5 years, the most recent in January 2014, for Asset Register reconciliation and updated bus stop condition assessment. A review of those assets with poor condition ratings, and that may need renewal, is undertaken by staff annually as part of the preparation of the bus stop upgrade capital works program and subsequent budget bid process.
Condition is measured using a 1 – 5 grading system6 as detailed in Table 5.1.3.
6 IPWEA, 2011, IIMM, Sec 2.5.4, p 2|79.
CITY OF CHARLES STURT– BUS STOP ASSET MANAGEMENT PLAN AUGUST 2015
- 25 -
Table 5.1.3: Simple Condition Grading Model
Condition Grading Description of Condition
1 Very Good: only planned maintenance required
2 Good: minor maintenance required plus planned maintenance
3 Fair: significant maintenance required
4 Poor: significant renewal/rehabilitation required
5 Very Poor: physically unsound and/or beyond rehabilitation
5.1.4 Asset valuations
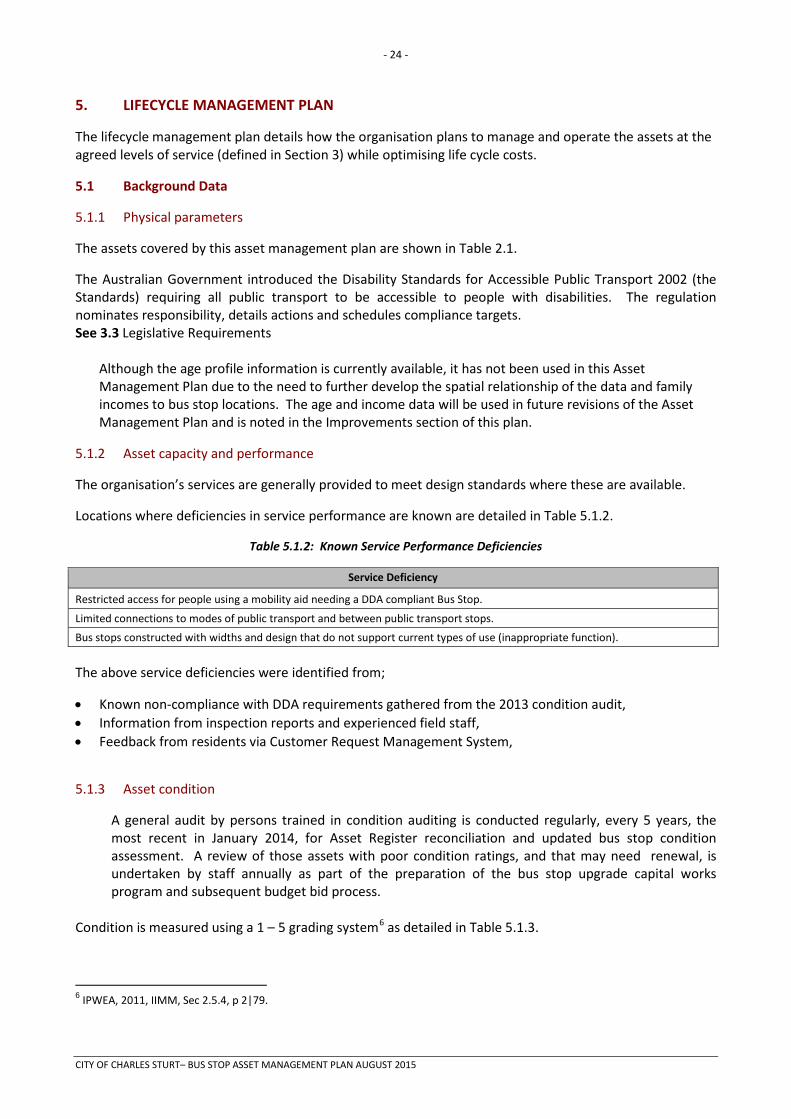
The value of assets recorded in the asset register as at June 30 2013, covered by this asset management plan is shown below. Assets were last revalued at June 30 2013. Assets are valued at current replacement costs.
Current Replacement Cost $3,718,000
Depreciable Amount $3,718,000
Depreciated Replacement Cost7 $349,000
Annual Depreciation Expense $149,000
Useful lives were reviewed in May 2014 by the Asset Managers
TRIM 13/173322.
Key assumptions made in preparing the valuations were:
• Valuation figures are based on 2013 construction values. • Straight line depreciation has been used. • Residual value of $3,300 based on path being still available.
Major changes from previous valuations are due to the collection of actual cost data incurred from projects undertaken since 2007/08 (5-years). In this Asset Management Plan the average cost per bus stop upgrade is determined from the 2013/14 Contract rates (details are available in Council document - TRIM 12/233636 which is Commercial in Confidence).
Various ratios of asset consumption and expenditure have been prepared to help guide and gauge asset management performance and trends over time.
Rate of Annual Asset Consumption 4% (Depreciation/Depreciable Amount)
Rate of Annual Asset Renewal 0% (Capital renewal exp/Depreciable amount)
Rate of Annual Asset Upgrade/New 6.7% (Capital upgrade exp/Depreciable amount)
Rate of Annual Asset Upgrade/New 6.8% (including contributed assets)
7 Also reported as Written Down Current Replacement Cost (WDCRC).
Residual Value
Depreciable Amount
Useful Life
Current Replacement
Cost
End of reporting period 1
Annual Depreciation
Expense
End of reporting period 2
Accumulated Depreciation
Depreciated Replacement
Cost
CITY OF CHARLES STURT– BUS STOP ASSET MANAGEMENT PLAN AUGUST 2015
- 26 -
Due to the requirement to comply with the Disability Standards for Accessible Public Transport 2002 (upgrades), in 2014 the organisation plans to renew assets at 0% of the rate they are being consumed for the next 10 years and will be increasing its asset stock by 6.8% in the year due to asset upgrade of existing bus stops under requirements of the DDA not by acquiring new stops..
5.1.5 Historical Data
Historical data regarding bus stop condition, useful lives and renewal forecasts can be found in the City of Charles Sturts previous Asset Management Plan for Bus Stops endorsed in 2014, TRIM reference 14/34179 while the Appendix 5 Asset Data Financial Forecast has been revised several times up to 2015. 5.2 Infrastructure Risk Management Plan
An assessment of risks8 associated with service delivery from infrastructure assets has identified critical risks that will result in loss or reduction in service from infrastructure assets or a ‘financial shock’ to the organisation. The risk assessment process identifies credible risks, the likelihood of the risk event occurring, the consequences should the event occur, develops a risk rating, evaluates the risk and develops a risk treatment plan for non-acceptable risks.
Critical risks, being those assessed as ‘Very High’ - requiring immediate corrective action and ‘High’ – requiring prioritised corrective action identified in the Infrastructure Risk Management Plan, together with the estimated residual risk after the selected treatment plan is operational are summarised in Table 5.2. These risks are reported to management and Council/Board.
Table 5.2: Critical Risks and Treatment Plans
Note * The residual risk is the risk remaining after the selected risk treatment plan is operational.
8 The City of Charles Sturt uses a framework that has been approved and is in accordance with International Standard ISO31000:2009
Service or Asset at Risk
What can Happen Risk Rating (VH, H)
Risk Treatment Plan Residual Risk *
Treatment Costs
Non Compliance to Legislation by 2022.
Potential litigation or penalty under the Act.
H Monitor progress toward the December 31 milestone dates in 2017 & 2022 and report progress annually as part of the budget bid process.
L $400,000 pa until 2022.
State Government change of bus routes needing new bus stops to be constructed.
Potential litigation, or penalty under the Act
H Work with the State Government to ensure that it makes provision for the construction of new DDA compliant bus stops.
M $50,000 pa.
CITY OF CHARLES STURT– BUS STOP ASSET MANAGEMENT PLAN AUGUST 2015
- 27 -
5.3 Routine Operations and Maintenance Plan
Operations include regular activities to provide services such as public health, safety and amenity, eg street sweeping, grass mowing and street lighting.
Routine maintenance is the regular on-going work that is necessary to keep assets operating, including instances where portions of the asset fail and need immediate repair to make the asset operational again.
5.3.1 Operations and Maintenance Plan
Operations activities affect service levels including quality and function through street sweeping and grass mowing frequency, intensity and spacing of street lights and cleaning frequency and opening hours of building and other facilities.
Maintenance includes all actions necessary for retaining an asset as near as practicable to an appropriate service condition including regular ongoing day-to-day work necessary to keep assets operating, eg road patching but excluding rehabilitation or renewal. Maintenance may be classifies into reactive, planned and specific maintenance work activities.
Reactive maintenance is unplanned repair work carried out in response to service requests and management/supervisory directions.
Planned maintenance is repair work that is identified and managed through a maintenance management system (MMS). MMS activities include inspection, assessing the condition against failure/breakdown experience, prioritising, scheduling, actioning the work and reporting what was done to develop a maintenance history and improve maintenance and service delivery performance.
Specific maintenance is replacement of higher value components/sub-components of assets that is undertaken on a regular cycle including repainting, replacing air conditioning units, etc. This work falls below the capital/maintenance threshold but may require a specific budget allocation.
Actual past maintenance expenditure on Bus Stops is currently not recorded as it is combined with the same service delivery budget line as paths.
Maintenance expenditure levels have been reviewed in 2014 and expected costs have been added to the overall expenditure of the Bus Stop service. It is anticipated that Bus Stop pads will be cleaned at least bi-annually and fully pressure cleaned on a 12 year cycle. The pavers are to be re-sanded at least every 5 years.
Reactive maintenance is carried out in accordance with response levels of service detailed in Appendix A.
5.3.2 Operations and Maintenance Strategies
The organisation will operate and maintain assets to provide the defined level of service to approved budgets in the most cost-efficient manner. The operation and maintenance activities include:
• Scheduling operations activities to deliver the defined level of service in the most efficient manner, • Undertaking maintenance activities through a planned maintenance system to reduce maintenance costs and
improve maintenance outcomes. Undertake cost-benefit analysis to determine the most cost-effective split between planned and unplanned maintenance activities (50 – 70% planned desirable as measured by cost),
• Maintain a current infrastructure risk register for assets and present service risks associated with providing services from infrastructure assets and reporting Extreme and High risks and residual risks after treatment to management and the Council.
• Review current and required skills base and implement workforce training and development to meet required operations and maintenance needs,
CITY OF CHARLES STURT– BUS STOP ASSET MANAGEMENT PLAN AUGUST 2015

- 28 -
• Review asset utilisation to identify underutilised assets and appropriate remedies, and over utilised assets and customer demand management options,
• Maintain a current hierarchy of critical assets and required operations and maintenance activities, • Develop and regularly review appropriate emergency response capability, • Review management of operations and maintenance activities to ensure the organisation is obtaining best
value for resources used. Asset hierarchy
An asset hierarchy provides a framework for structuring data in an information system to assist in collection of data, reporting information and making decisions. The hierarchy includes the asset class and component used for asset planning and financial reporting and service level hierarchy used for service planning and delivery. For Bus stops this has not yet been developed. In future a hierarchy will look at issues such as high usage and stops at critical locations such as hospitals, aged care homes and shopping centres.
The organisation’s service hierarchy is shown is Table 5.3.2.
Table 5.3.2: Asset Service Hierarchy
Service Hierarchy Service Level Objective
N/A N/A
N/A N/A
All assets in this group are serviced based on safety and risk, no hierarchy for service currently applies Critical Assets
Critical assets are those assets which have a high consequence of failure but not necessarily a high likelihood of failure. By identifying critical assets and critical failure modes, organisations can target and refines investigative activities, maintenance plans and capital expenditure plans at the appropriate time.
Operations and maintenances activities may be targeted to mitigate critical assets failure and maintain service levels. These activities may include increased inspection frequency, higher maintenance intervention levels, etc. Critical assets failure modes and required operations and maintenance activities are detailed in Table 5.3.2.1.
Table 5.3.2.1: Critical Assets and Service Level Objectives
Critical Assets Critical Failure Mode Operations & Maintenance Activities
What has been achieved since Bus Stop Asset Management
Plan 2014
Disability access Aged person mobility Regionally strategic routes Retail precincts Public transport connections Other higher activity paths
Failure resulting in inability for users to conduct daily business. Injury risk to elderly and people with reduced mobility.
Maintenance and repairs in accordance with agreed response and service levels
62 Access Ramps have been upgraded to Disability Discrimination Act compliance. 32 bus stops have been made Disability Discrimination Act compliant. 142 trip hazards on paths have been attended to
CITY OF CHARLES STURT– BUS STOP ASSET MANAGEMENT PLAN AUGUST 2015
- 29 -
Standards and specifications
Maintenance work is carried out in accordance with the following Standards and Specifications.
• AS1428.1 Design for Access and Mobility • AS1428.4 Design for Access and Mobility Tactile Indicators • Austroads ‘Guide to Road Design’ Parts 6, 6A & 6B • Disability Discrimination Act 1992 • Disability Standards for Accessible Public Transport 2002 • Councils Internal Standards including NATSPEC specification.
5.3.3 Summary of future operations and maintenance expenditures
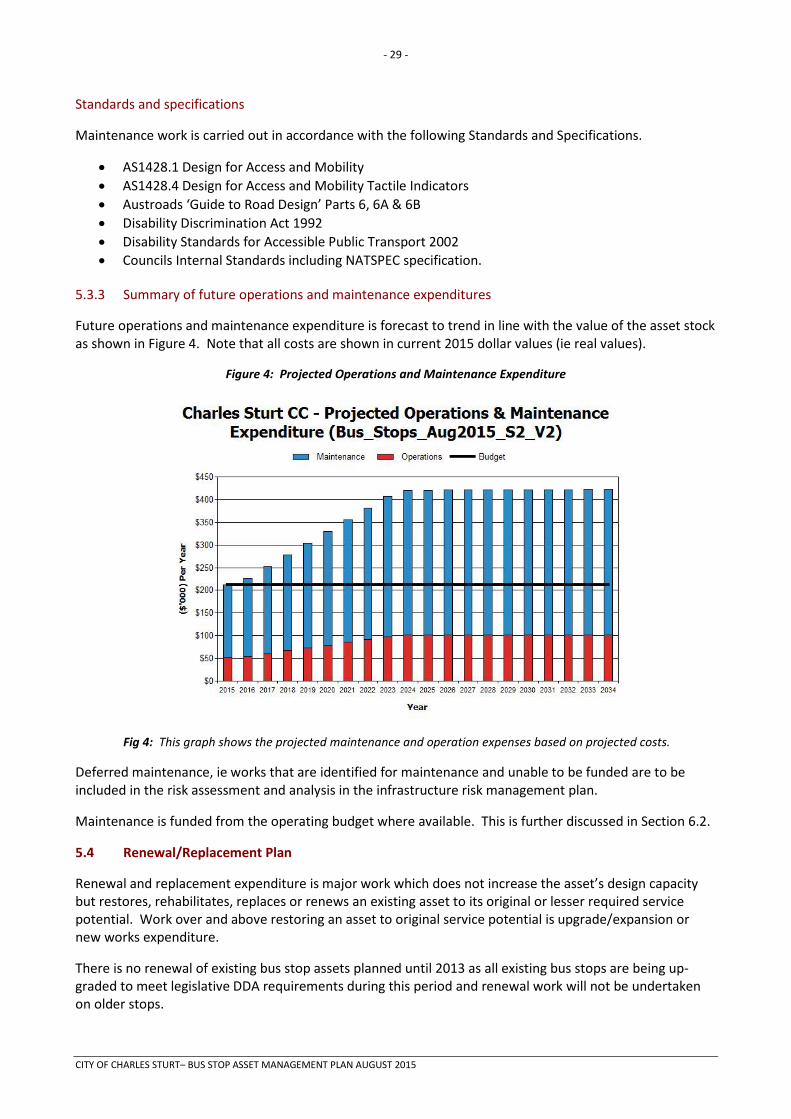
Future operations and maintenance expenditure is forecast to trend in line with the value of the asset stock as shown in Figure 4. Note that all costs are shown in current 2015 dollar values (ie real values).
Figure 4: Projected Operations and Maintenance Expenditure
Fig 4: This graph shows the projected maintenance and operation expenses based on projected costs.
Deferred maintenance, ie works that are identified for maintenance and unable to be funded are to be included in the risk assessment and analysis in the infrastructure risk management plan.
Maintenance is funded from the operating budget where available. This is further discussed in Section 6.2.
5.4 Renewal/Replacement Plan
Renewal and replacement expenditure is major work which does not increase the asset’s design capacity but restores, rehabilitates, replaces or renews an existing asset to its original or lesser required service potential. Work over and above restoring an asset to original service potential is upgrade/expansion or new works expenditure.
There is no renewal of existing bus stop assets planned until 2013 as all existing bus stops are being up-graded to meet legislative DDA requirements during this period and renewal work will not be undertaken on older stops.
CITY OF CHARLES STURT– BUS STOP ASSET MANAGEMENT PLAN AUGUST 2015
- 30 -
5.4.1 Renewal plan Assets requiring renewal/replacement are identified from one of three methods provided in the ‘Expenditure Template’.
• Method 1 uses Asset Register data to project the renewal costs using acquisition year and useful life to determine the renewal year, or
• Method 2 uses capital renewal expenditure projections from external condition modelling systems (such as Pavement Management Systems), or
• Method 3 uses a combination of average network renewals plus defect repairs in the Renewal Plan and Defect Repair Plan worksheets on the ‘Expenditure template’.
Method 2 was used for this asset management plan.
The useful lives of assets used to develop projected asset renewal expenditures are shown in Table 5.4.1. Asset useful lives were last reviewed in May 2015.9
Table 5.4.1: Useful Lives of Assets
Asset (Sub)Category Useful life
Platform (Pad) Block Paving 35 years
Platform (Pad) Reinforced Concrete 60 years
Tactile Ground Indicator (TGI) 20 years
An average overall life for Bus Stops was determined at
25 years (for majority of current block paver )
5.4.2 Renewal and Replacement Strategies
The organisation will plan capital renewal and replacement projects to meet level of service objectives and minimise infrastructure service risks by:
• Planning and scheduling renewal projects to deliver the defined level of service in the most efficient manner,
• Undertaking project scoping for all capital renewal and replacement projects to identify: o the service delivery ‘deficiency’, present risk and optimum time for renewal/replacement, o the project objectives to rectify the deficiency, o the range of options, estimated capital and life cycle costs for each options that could
address the service deficiency, o and evaluate the options against evaluation criteria adopted by the organisation, and o select the best option to be included in capital renewal programs,
• Using ‘low cost’ renewal methods (cost of renewal is less than replacement) wherever possible, • Maintain a current infrastructure risk register for assets and service risks associated with providing
services from infrastructure assets and reporting Extreme and High risks and residual risks after treatment to management and the organisation/Board,
• Review current and required skills base and implement workforce training and development to meet required construction and renewal needs,
• Maintain a current hierarchy of critical assets and capital renewal treatments and timings required , • Review management of capital renewal and replacement activities to ensure the organisation is
obtaining best value for resources used.
9 Based on Actual Scenarios and industry standards.
CITY OF CHARLES STURT– BUS STOP ASSET MANAGEMENT PLAN AUGUST 2015
- 31 -
Renewal ranking criteria
Asset renewal and replacement is typically undertaken to either:
• Ensure the reliability of the existing infrastructure to deliver the service it was constructed to facilitate (eg replacing a bridge that has a 5 t load limit), or
• To ensure the infrastructure is of sufficient quality to meet the service requirements (eg roughness of a road).10
It is possible to get some indication of capital renewal and replacement priorities by identifying assets or asset groups that:
• Have a high consequence of failure, • Have a high utilisation and subsequent impact on users would be greatest, • The total value represents the greatest net value to the organisation, • Have the highest average age relative to their expected lives, • Are identified in the AM Plan as key cost factors, • Have high operational or maintenance costs, and • Where replacement with modern equivalent assets would yield material savings.11
The ranking criteria used to determine priority of identified renewal and replacement proposals is detailed in Table 5.4.2.
Table 5.4.2: Renewal and Replacement Priority Ranking Criteria
Criteria Weighting*
When Road Reconstruction will excessively damage the existing bus stop 4
Addressing special needs of people with a disability; the aged; or others using mobility aids 4
Providing access to public transport 4
In land use areas/precincts generating high public transport demand (examples being near shops, schools and community facilities)
3
Located in areas where large crowds use bus stops occasionally (walking distance of large sporting and entertainment venues – examples being AAMI stadium, Hindmarsh Soccer stadium, Adelaide Entertainment Centre)
3
Near a regional facility used by many visitors (or in a State or Council strategy or Development Plan – examples being recreational areas, Coast Park, Sportsmans Drive)
3
Along arterial road, local distributors and collector streets 3
In, or next to precinct redevelopment areas 2
* This weighting is a level of importance, not a numerically applied number.
10 IPWEA, 2011, IIMM, Sec 3.4.4, p 3|60. 11 Based on IPWEA, 2011, IIMM, Sec 3.4.5, p 3|66.
CITY OF CHARLES STURT– BUS STOP ASSET MANAGEMENT PLAN AUGUST 2015
- 32 -
Renewal and replacement standards
Renewal work is carried out in accordance with the following Standards and Specifications.
• AS1428.1 Design for Access and Mobility • AS1428.4 Design for Access and Mobility Tactile Indicators • Austroads ‘Guide to Road Design’ Parts 6, 6A, 6B • Disability Discrimination Act 1992 • Disability Standards for Accessible Public Transport 2002 • Councils Internal Standards including NATSPEC specification.
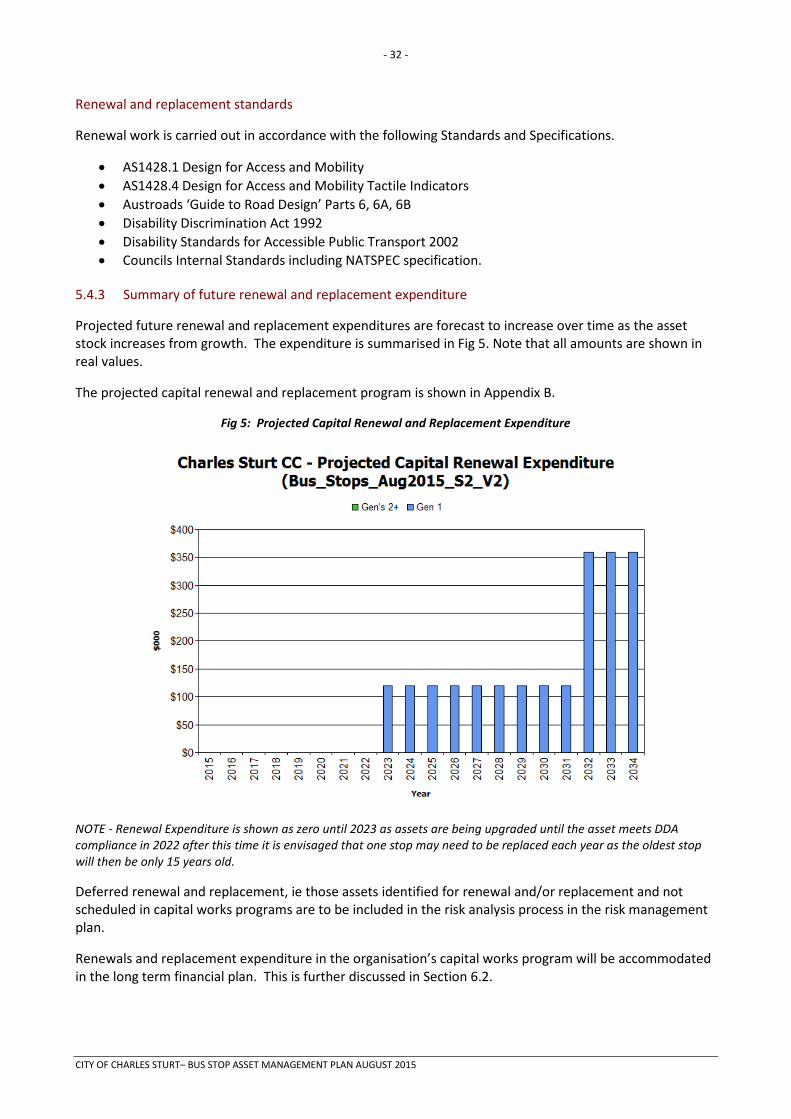
5.4.3 Summary of future renewal and replacement expenditure
Projected future renewal and replacement expenditures are forecast to increase over time as the asset stock increases from growth. The expenditure is summarised in Fig 5. Note that all amounts are shown in real values.
The projected capital renewal and replacement program is shown in Appendix B.
Fig 5: Projected Capital Renewal and Replacement Expenditure
NOTE - Renewal Expenditure is shown as zero until 2023 as assets are being upgraded until the asset meets DDA compliance in 2022 after this time it is envisaged that one stop may need to be replaced each year as the oldest stop will then be only 15 years old.
Deferred renewal and replacement, ie those assets identified for renewal and/or replacement and not scheduled in capital works programs are to be included in the risk analysis process in the risk management plan.
Renewals and replacement expenditure in the organisation’s capital works program will be accommodated in the long term financial plan. This is further discussed in Section 6.2.
CITY OF CHARLES STURT– BUS STOP ASSET MANAGEMENT PLAN AUGUST 2015
- 33 -
5.5 Creation/Acquisition/Upgrade Plan
New works are those works that create a new asset that did not previously exist, or works which upgrade or improve an existing asset beyond its existing capacity. They may result from growth, social or environmental needs. Assets may also be acquired at no cost to the organisation from land development. These assets from growth are considered in Section 4.4.
5.5.1 Selection criteria
New assets and upgrade/expansion of existing assets are identified from various sources such as community requests, or as instructed from state authorities, proposals identified by strategic plans or partnerships with other organisations. Candidate proposals are inspected to verify need and to develop a preliminary renewal estimate. Verified proposals are ranked by priority and available funds and scheduled in future works programmes. The priority ranking criteria is detailed below.
Table 5.5.1: New Assets Priority Ranking Criteria
Criteria Weighting
MetroTicket requests 100%
Total 100% 5.5.2 Capital Investment Strategies
The organisation will plan capital upgrade and new projects to meet level of service objectives by:
• Planning and scheduling capital upgrade and new projects to deliver the defined level of service in the most efficient manner,
• Undertake project scoping for all capital upgrade/new projects to identify: o the service delivery ‘deficiency’, present risk and required timeline for delivery of the
upgrade/new asset, o the project objectives to rectify the deficiency including value management for major
projects, o the range of options, estimated capital and life cycle costs for each options that could
address the service deficiency, o management of risks associated with alternative options, o and evaluate the options against evaluation criteria adopted by Council, and o select the best option to be included in capital upgrade/new programs,
• Review current and required skills base and implement training and development to meet required construction and project management needs,
• Review management of capital project management activities to ensure the organisation is obtaining best value for resources used.
Standards and specifications for new assets and for upgrade/expansion of existing assets are the same as those for renewal shown in Section 5.4.2.
CITY OF CHARLES STURT– BUS STOP ASSET MANAGEMENT PLAN AUGUST 2015

- 34 -
5.5.3 Summary of future upgrade expenditure
Projected upgrade expenditures are summarised in Fig 6. The projected upgrade works program is shown in Appendix C. All amounts are shown in real values.
Fig 6: Projected Capital Upgrade/New Asset Expenditure
Expenditure on new assets and services in the organisation’s capital works program will be accommodated in the long term financial plan. This is further discussed in Section 6.2.
5.6 Disposal Plan
Disposal includes any activity associated with disposal of a decommissioned asset including sale, demolition or relocation. Assets identified for possible decommissioning and disposal are shown in Table 5.6, together with estimated annual savings from not having to fund operations and maintenance of the assets. These assets will be further reinvestigated to determine the required levels of service and see what options are available for alternate service delivery, if any. Any revenue gained from asset disposals is accommodated in the organisation’s long term financial plan.
Where cash flow projections from asset disposals are not available, these will be developed in future revisions of this asset management plan.
Table 5.6: Assets Identified for Disposal
Asset Reason for Disposal Timing Disposal Expenditure Operations & Maintenance Annual
Savings
Redundant Bus Stops Change in Bus Route As notified $3300 based on footpath still being available for use
$0 as service is moved elsewhere
CITY OF CHARLES STURT– BUS STOP ASSET MANAGEMENT PLAN AUGUST 2015

- 35 -
5.7 Service Consequences and Risks
The organisation has prioritised decisions made in adopting this AM Plan to obtain the optimum benefits from its available resources. Decisions were made based on the development of 3 scenarios of AM Plans.
Scenario 1 - What we would like to do based on asset register data
Scenario 2 – What we should do with existing budgets and identifying level of service and risk consequences (ie what are the operations and maintenance and capital projects we are unable to do, what is the service and risk consequences associated with this position). This may require several versions of the AM Plan.
Scenario 3 – What we can do and be financially sustainable with AM Plans matching long-term financial plans.
The development of scenario 1 and scenario 2 AM Plans provides the tools for discussion with the Councillors and community on trade-offs between what we would like to do (scenario 1) and what we should be doing with existing budgets (scenario 2) by balancing changes in services and service levels with affordability and acceptance of the service and risk consequences of the trade-off position (scenario 3).
CITY OF CHARLES STURT– BUS STOP ASSET MANAGEMENT PLAN AUGUST 2015
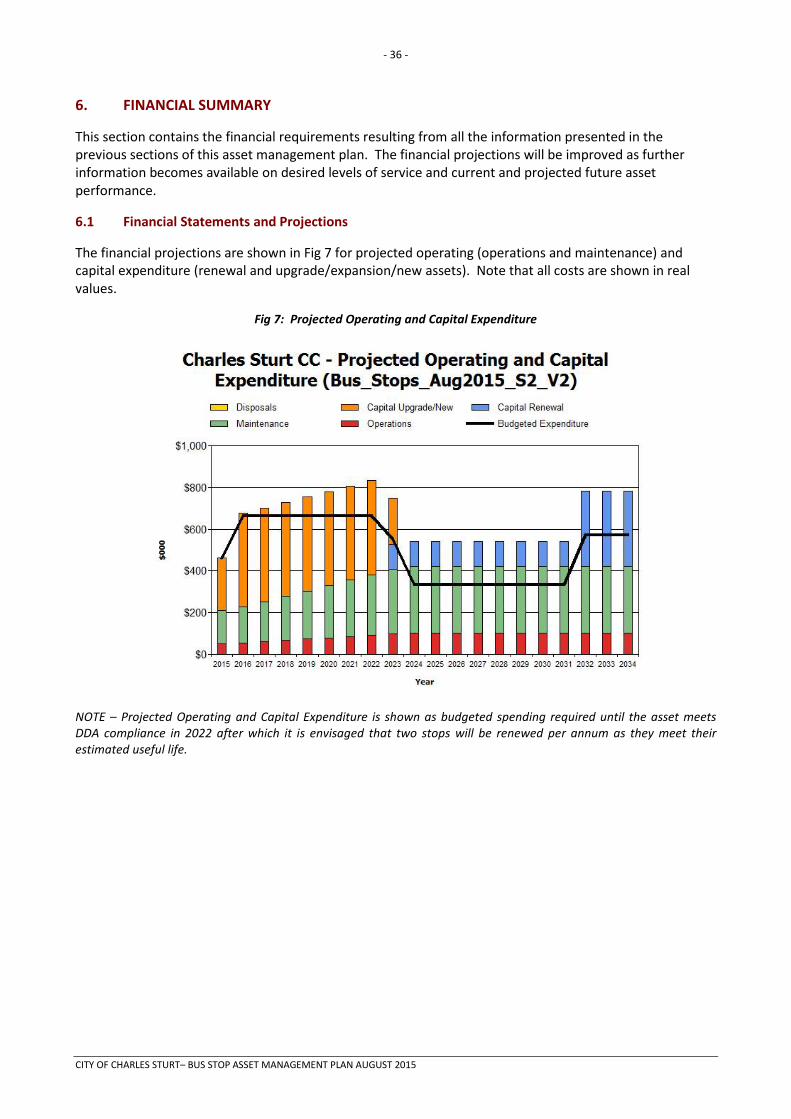
- 36 -
6. FINANCIAL SUMMARY
This section contains the financial requirements resulting from all the information presented in the previous sections of this asset management plan. The financial projections will be improved as further information becomes available on desired levels of service and current and projected future asset performance.
6.1 Financial Statements and Projections
The financial projections are shown in Fig 7 for projected operating (operations and maintenance) and capital expenditure (renewal and upgrade/expansion/new assets). Note that all costs are shown in real values.
Fig 7: Projected Operating and Capital Expenditure
NOTE – Projected Operating and Capital Expenditure is shown as budgeted spending required until the asset meets DDA compliance in 2022 after which it is envisaged that two stops will be renewed per annum as they meet their estimated useful life.
CITY OF CHARLES STURT– BUS STOP ASSET MANAGEMENT PLAN AUGUST 2015
- 37 -
6.1.1 Sustainability of service delivery
There are four key indicators for service delivery sustainability that have been considered in the analysis of the services provided by this asset category, these being the asset renewal funding ratio, long term life cycle costs/expenditures and medium term projected/budgeted expenditures over 5 and 10 years of the planning period.
Asset Renewal Funding Ratio
Asset Renewal Funding Ratio12 100%
The Asset Renewal Funding Ratio is the most important indicator and reveals that over the next 10 years, the organisation is forecasting that it will have 100% of the funds required for the optimal renewal and replacement of its assets.
Long term - Life Cycle Cost ( Excluding Upgrade Work)
Life cycle costs (or whole of life costs) are the average costs that are required to sustain the service levels over the asset life cycle. Life cycle costs include operations and maintenance expenditure and asset consumption (depreciation expense). The life cycle cost for the services covered in this asset management plan is $463,000 per year (average operations and maintenance expenditure plus depreciation expense projected over 10 years).
Life cycle costs can be compared to life cycle expenditure to give an initial indicator of affordability of projected service levels when considered with age profiles. Life cycle expenditure includes operations, maintenance and capital renewal expenditure. Life cycle expenditure will vary depending on the timing of asset renewals. The life cycle expenditure over the 10 year planning period is $236,000 per year (average operations and maintenance plus capital renewal budgeted expenditure in LTFP over 10 years).
A shortfall between life cycle cost and life cycle expenditure is the life cycle gap. The life cycle gap for services covered by this asset management plan is - $227,000 per year (-ve = gap, +ve = surplus).
Life cycle expenditure is 51% of life cycle costs. This is indicative of not renewing existing stops but upgrading as per DDA requirements.
The life cycle costs and life cycle expenditure comparison highlights any difference between present outlays and the average cost of providing the service over the long term. If the life cycle expenditure is less than that life cycle cost, it is most likely that outlays will need to be increased or cuts in services made in the future.
Knowing the extent and timing of any required increase in outlays and the service consequences if funding is not available will assist organisations in providing services to their communities in a financially sustainable manner. This is the purpose of the asset management plans and long term financial plan.
Medium term – 10 year financial planning period
This asset management plan identifies the projected operations, maintenance and capital renewal expenditures required to provide an agreed level of service to the community over a 10 year period. This provides input into 10 year financial and funding plans aimed at providing the required services in a sustainable manner.
12 AIFMG, 2009, Financial Sustainability Indicator 8, Sec 2.6, p 2.18
CITY OF CHARLES STURT– BUS STOP ASSET MANAGEMENT PLAN AUGUST 2015
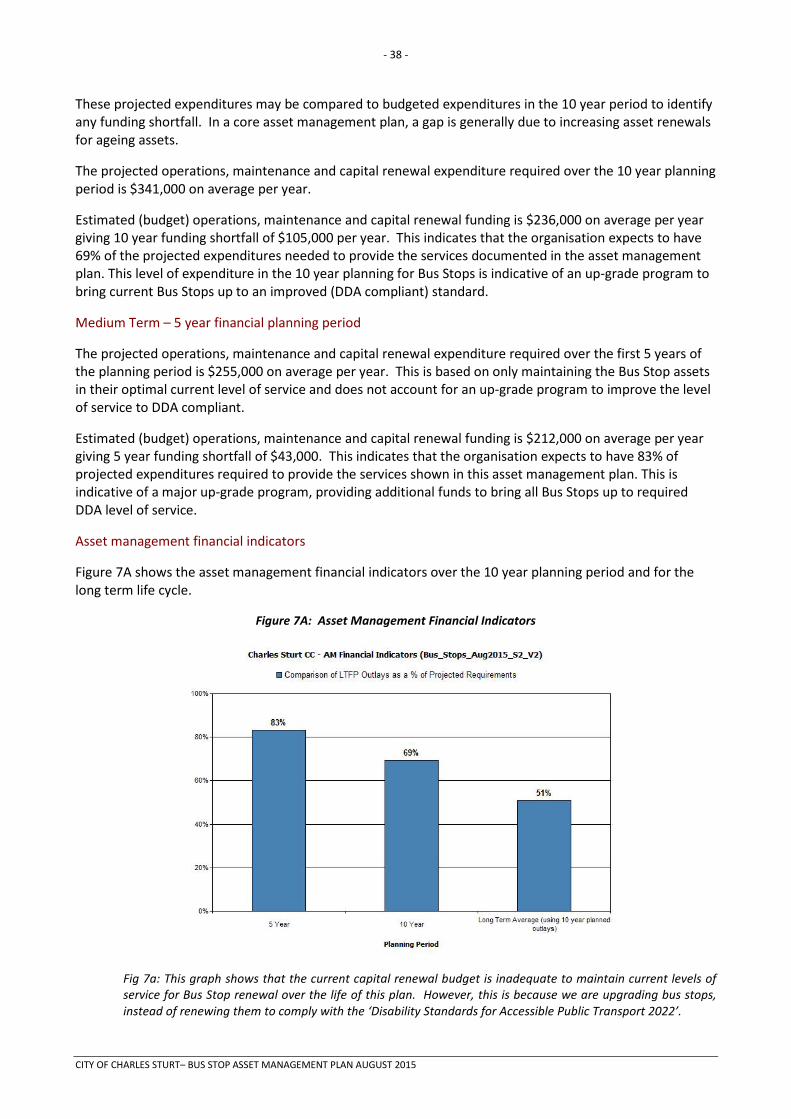
- 38 -
These projected expenditures may be compared to budgeted expenditures in the 10 year period to identify any funding shortfall. In a core asset management plan, a gap is generally due to increasing asset renewals for ageing assets.
The projected operations, maintenance and capital renewal expenditure required over the 10 year planning period is $341,000 on average per year.
Estimated (budget) operations, maintenance and capital renewal funding is $236,000 on average per year giving 10 year funding shortfall of $105,000 per year. This indicates that the organisation expects to have 69% of the projected expenditures needed to provide the services documented in the asset management plan. This level of expenditure in the 10 year planning for Bus Stops is indicative of an up-grade program to bring current Bus Stops up to an improved (DDA compliant) standard.
Medium Term – 5 year financial planning period
The projected operations, maintenance and capital renewal expenditure required over the first 5 years of the planning period is $255,000 on average per year. This is based on only maintaining the Bus Stop assets in their optimal current level of service and does not account for an up-grade program to improve the level of service to DDA compliant.
Estimated (budget) operations, maintenance and capital renewal funding is $212,000 on average per year giving 5 year funding shortfall of $43,000. This indicates that the organisation expects to have 83% of projected expenditures required to provide the services shown in this asset management plan. This is indicative of a major up-grade program, providing additional funds to bring all Bus Stops up to required DDA level of service.
Asset management financial indicators
Figure 7A shows the asset management financial indicators over the 10 year planning period and for the long term life cycle.
Figure 7A: Asset Management Financial Indicators
Fig 7a: This graph shows that the current capital renewal budget is inadequate to maintain current levels of service for Bus Stop renewal over the life of this plan. However, this is because we are upgrading bus stops, instead of renewing them to comply with the ‘Disability Standards for Accessible Public Transport 2022’.
CITY OF CHARLES STURT– BUS STOP ASSET MANAGEMENT PLAN AUGUST 2015
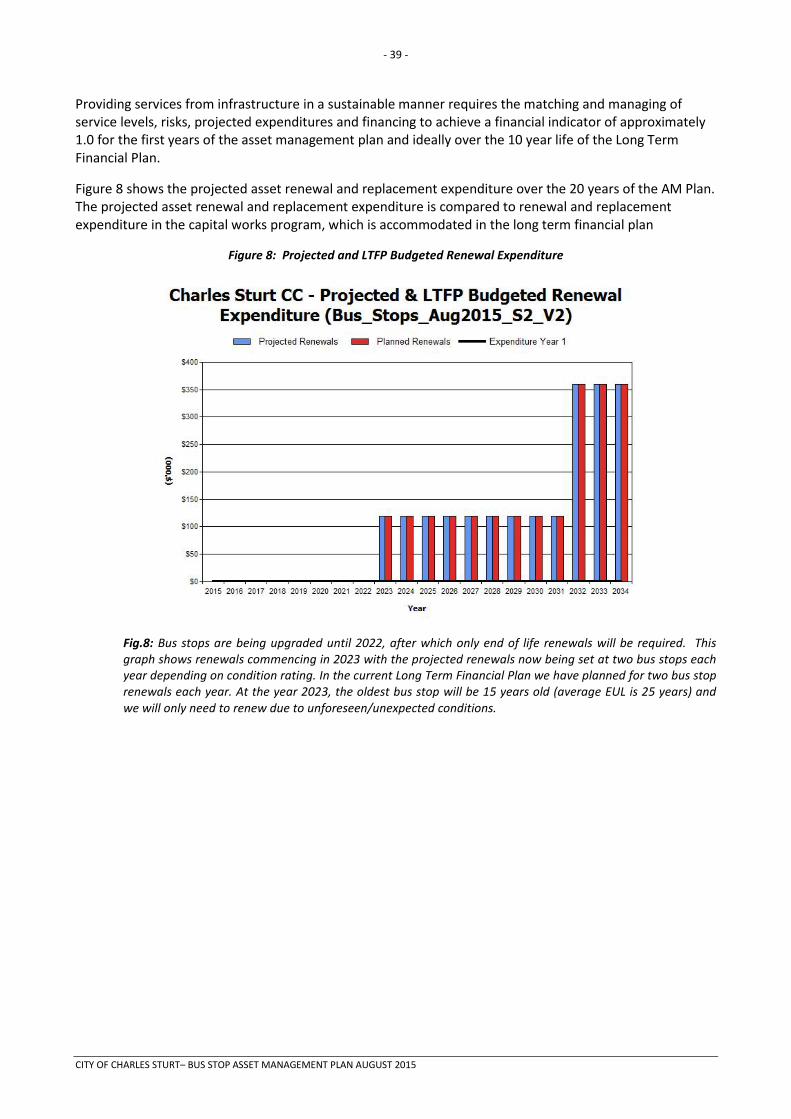
- 39 -
Providing services from infrastructure in a sustainable manner requires the matching and managing of service levels, risks, projected expenditures and financing to achieve a financial indicator of approximately 1.0 for the first years of the asset management plan and ideally over the 10 year life of the Long Term Financial Plan.
Figure 8 shows the projected asset renewal and replacement expenditure over the 20 years of the AM Plan. The projected asset renewal and replacement expenditure is compared to renewal and replacement expenditure in the capital works program, which is accommodated in the long term financial plan
Figure 8: Projected and LTFP Budgeted Renewal Expenditure
Fig.8: Bus stops are being upgraded until 2022, after which only end of life renewals will be required. This graph shows renewals commencing in 2023 with the projected renewals now being set at two bus stops each year depending on condition rating. In the current Long Term Financial Plan we have planned for two bus stop renewals each year. At the year 2023, the oldest bus stop will be 15 years old (average EUL is 25 years) and we will only need to renew due to unforeseen/unexpected conditions.
CITY OF CHARLES STURT– BUS STOP ASSET MANAGEMENT PLAN AUGUST 2015
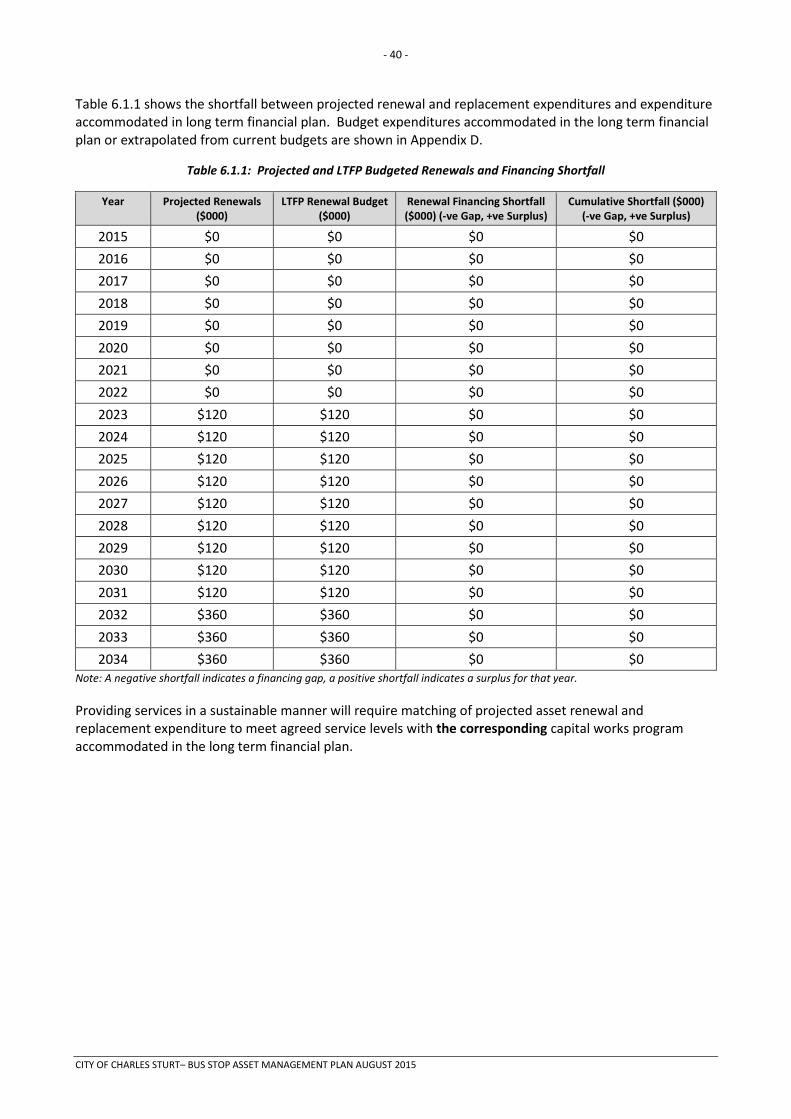
- 40 -
Table 6.1.1 shows the shortfall between projected renewal and replacement expenditures and expenditure accommodated in long term financial plan. Budget expenditures accommodated in the long term financial plan or extrapolated from current budgets are shown in Appendix D.
Table 6.1.1: Projected and LTFP Budgeted Renewals and Financing Shortfall
Year Projected Renewals ($000)
LTFP Renewal Budget ($000)
Renewal Financing Shortfall ($000) (-ve Gap, +ve Surplus)
Cumulative Shortfall ($000) (-ve Gap, +ve Surplus)
2015 $0 $0 $0 $0 2016 $0 $0 $0 $0 2017 $0 $0 $0 $0 2018 $0 $0 $0 $0 2019 $0 $0 $0 $0 2020 $0 $0 $0 $0 2021 $0 $0 $0 $0 2022 $0 $0 $0 $0 2023 $120 $120 $0 $0 2024 $120 $120 $0 $0 2025 $120 $120 $0 $0 2026 $120 $120 $0 $0 2027 $120 $120 $0 $0 2028 $120 $120 $0 $0 2029 $120 $120 $0 $0 2030 $120 $120 $0 $0 2031 $120 $120 $0 $0 2032 $360 $360 $0 $0 2033 $360 $360 $0 $0 2034 $360 $360 $0 $0
Note: A negative shortfall indicates a financing gap, a positive shortfall indicates a surplus for that year. Providing services in a sustainable manner will require matching of projected asset renewal and replacement expenditure to meet agreed service levels with the corresponding capital works program accommodated in the long term financial plan.
CITY OF CHARLES STURT– BUS STOP ASSET MANAGEMENT PLAN AUGUST 2015
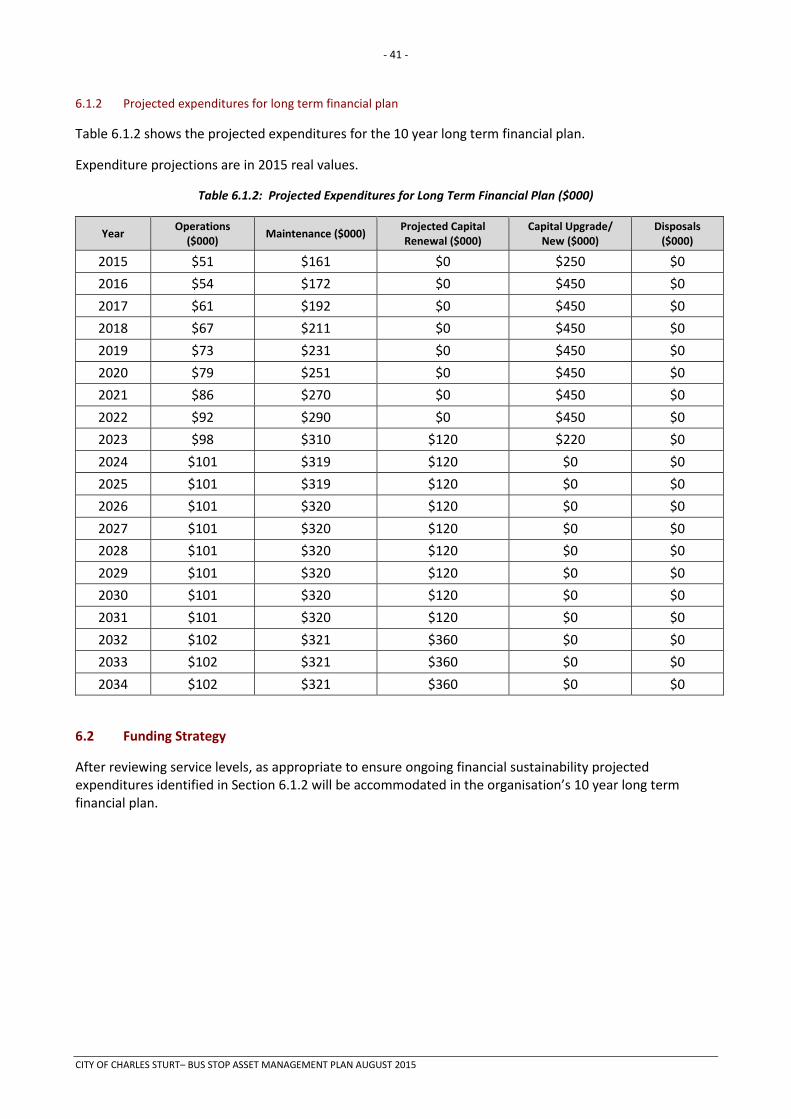
- 41 -
6.1.2 Projected expenditures for long term financial plan
Table 6.1.2 shows the projected expenditures for the 10 year long term financial plan.
Expenditure projections are in 2015 real values.
Table 6.1.2: Projected Expenditures for Long Term Financial Plan ($000)
Year Operations ($000) Maintenance ($000) Projected Capital
Renewal ($000) Capital Upgrade/
New ($000) Disposals
($000)
2015 $51 $161 $0 $250 $0 2016 $54 $172 $0 $450 $0 2017 $61 $192 $0 $450 $0 2018 $67 $211 $0 $450 $0 2019 $73 $231 $0 $450 $0 2020 $79 $251 $0 $450 $0 2021 $86 $270 $0 $450 $0 2022 $92 $290 $0 $450 $0 2023 $98 $310 $120 $220 $0 2024 $101 $319 $120 $0 $0 2025 $101 $319 $120 $0 $0 2026 $101 $320 $120 $0 $0 2027 $101 $320 $120 $0 $0 2028 $101 $320 $120 $0 $0 2029 $101 $320 $120 $0 $0 2030 $101 $320 $120 $0 $0 2031 $101 $320 $120 $0 $0 2032 $102 $321 $360 $0 $0 2033 $102 $321 $360 $0 $0 2034 $102 $321 $360 $0 $0
6.2 Funding Strategy
After reviewing service levels, as appropriate to ensure ongoing financial sustainability projected expenditures identified in Section 6.1.2 will be accommodated in the organisation’s 10 year long term financial plan.
CITY OF CHARLES STURT– BUS STOP ASSET MANAGEMENT PLAN AUGUST 2015
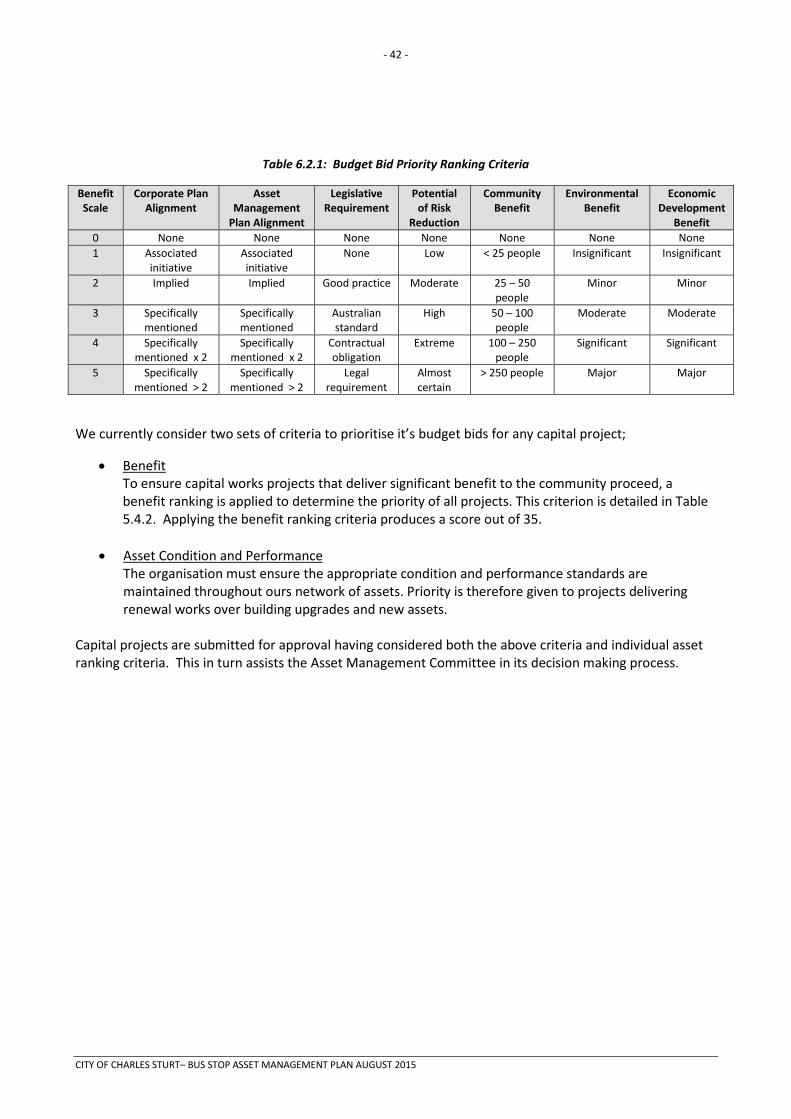
- 42 -
Table 6.2.1: Budget Bid Priority Ranking Criteria
Benefit Scale
Corporate Plan Alignment
Asset Management
Plan Alignment
Legislative Requirement
Potential of Risk
Reduction
Community Benefit
Environmental Benefit
Economic Development
Benefit 0 None None None None None None None 1 Associated
initiative Associated initiative
None Low < 25 people Insignificant Insignificant
2 Implied Implied Good practice Moderate 25 – 50 people
Minor Minor
3 Specifically mentioned
Specifically mentioned
Australian standard
High 50 – 100 people
Moderate Moderate
4 Specifically mentioned x 2
Specifically mentioned x 2
Contractual obligation
Extreme 100 – 250 people
Significant Significant
5 Specifically mentioned > 2
Specifically mentioned > 2
Legal requirement
Almost certain
> 250 people Major Major
We currently consider two sets of criteria to prioritise it’s budget bids for any capital project;
• Benefit To ensure capital works projects that deliver significant benefit to the community proceed, a benefit ranking is applied to determine the priority of all projects. This criterion is detailed in Table 5.4.2. Applying the benefit ranking criteria produces a score out of 35.
• Asset Condition and Performance The organisation must ensure the appropriate condition and performance standards are maintained throughout ours network of assets. Priority is therefore given to projects delivering renewal works over building upgrades and new assets.
Capital projects are submitted for approval having considered both the above criteria and individual asset ranking criteria. This in turn assists the Asset Management Committee in its decision making process.
CITY OF CHARLES STURT– BUS STOP ASSET MANAGEMENT PLAN AUGUST 2015
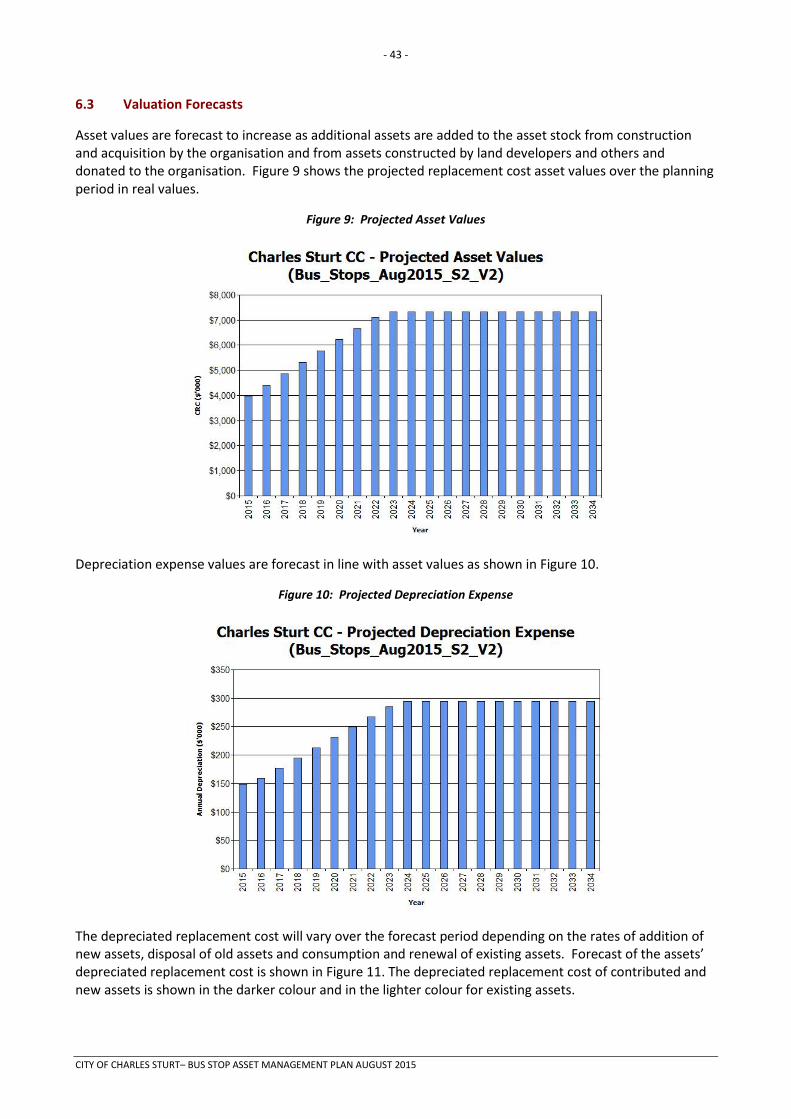
- 43 -
6.3 Valuation Forecasts
Asset values are forecast to increase as additional assets are added to the asset stock from construction and acquisition by the organisation and from assets constructed by land developers and others and donated to the organisation. Figure 9 shows the projected replacement cost asset values over the planning period in real values.
Figure 9: Projected Asset Values
Depreciation expense values are forecast in line with asset values as shown in Figure 10.
Figure 10: Projected Depreciation Expense
The depreciated replacement cost will vary over the forecast period depending on the rates of addition of new assets, disposal of old assets and consumption and renewal of existing assets. Forecast of the assets’ depreciated replacement cost is shown in Figure 11. The depreciated replacement cost of contributed and new assets is shown in the darker colour and in the lighter colour for existing assets.
CITY OF CHARLES STURT– BUS STOP ASSET MANAGEMENT PLAN AUGUST 2015
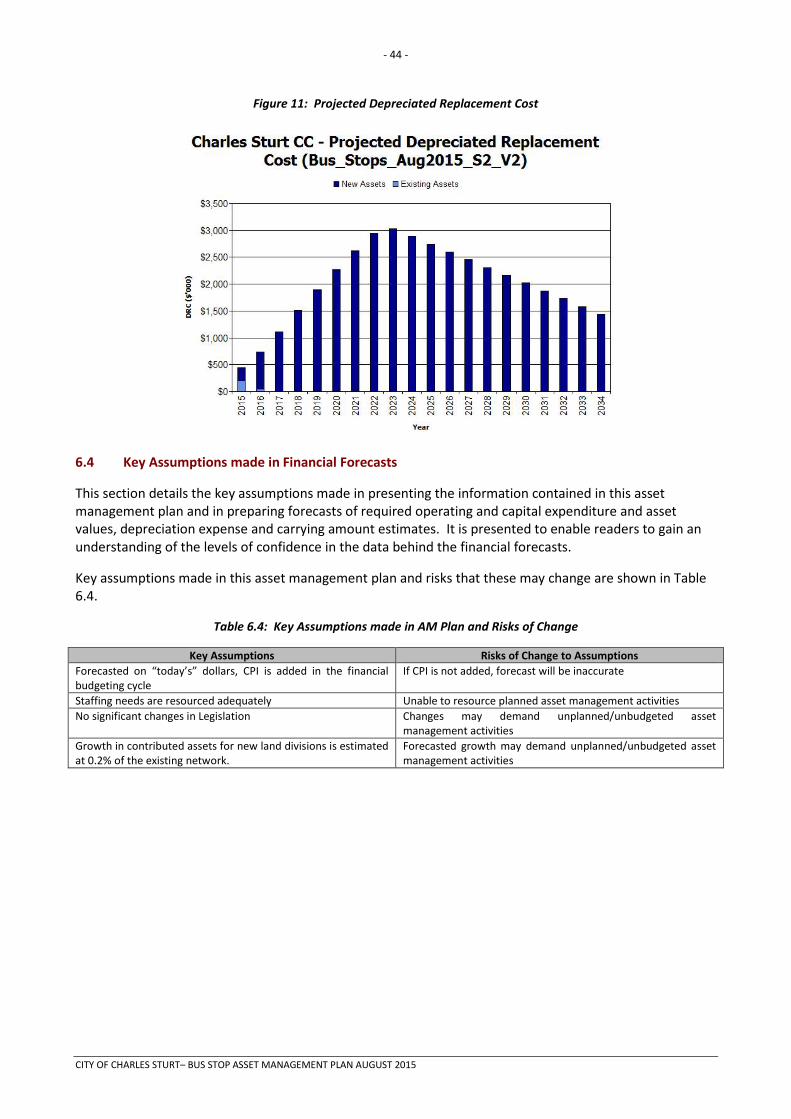
- 44 -
Figure 11: Projected Depreciated Replacement Cost
6.4 Key Assumptions made in Financial Forecasts
This section details the key assumptions made in presenting the information contained in this asset management plan and in preparing forecasts of required operating and capital expenditure and asset values, depreciation expense and carrying amount estimates. It is presented to enable readers to gain an understanding of the levels of confidence in the data behind the financial forecasts.
Key assumptions made in this asset management plan and risks that these may change are shown in Table 6.4.
Table 6.4: Key Assumptions made in AM Plan and Risks of Change
Key Assumptions Risks of Change to Assumptions Forecasted on “today’s” dollars, CPI is added in the financial budgeting cycle
If CPI is not added, forecast will be inaccurate
Staffing needs are resourced adequately Unable to resource planned asset management activities No significant changes in Legislation Changes may demand unplanned/unbudgeted asset
management activities Growth in contributed assets for new land divisions is estimated at 0.2% of the existing network.
Forecasted growth may demand unplanned/unbudgeted asset management activities
CITY OF CHARLES STURT– BUS STOP ASSET MANAGEMENT PLAN AUGUST 2015
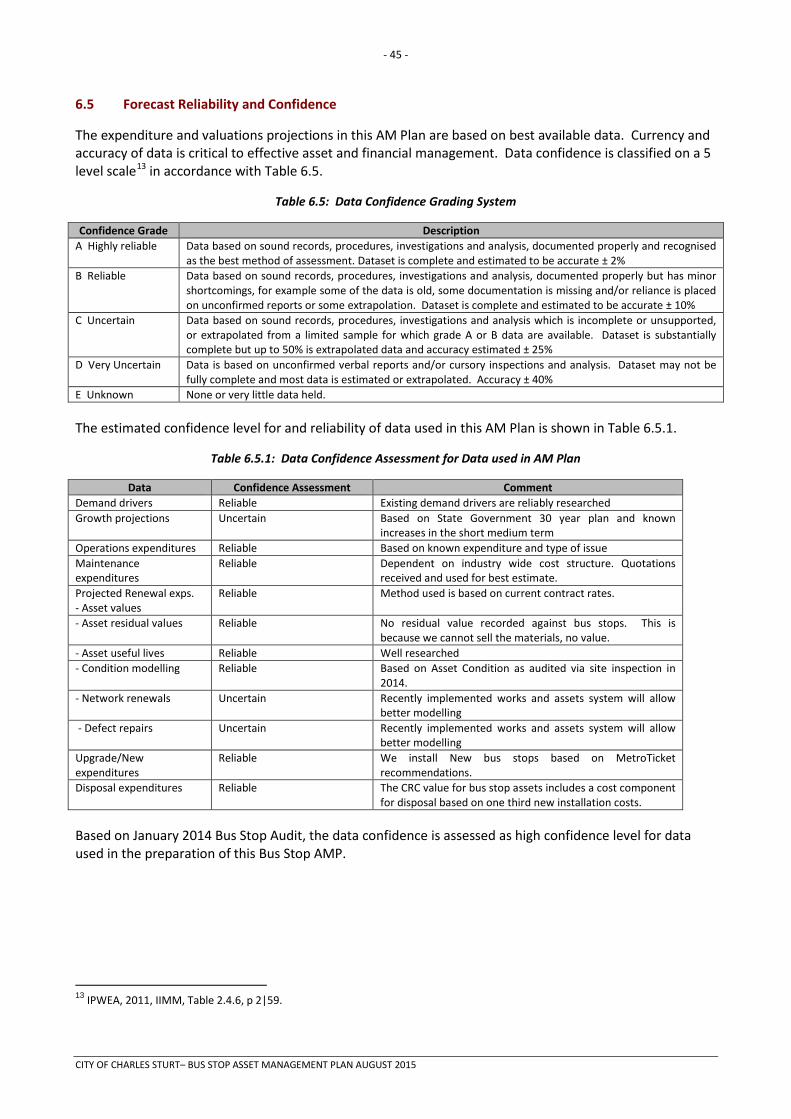
- 45 -
6.5 Forecast Reliability and Confidence
The expenditure and valuations projections in this AM Plan are based on best available data. Currency and accuracy of data is critical to effective asset and financial management. Data confidence is classified on a 5 level scale13 in accordance with Table 6.5.
Table 6.5: Data Confidence Grading System
Confidence Grade Description A Highly reliable Data based on sound records, procedures, investigations and analysis, documented properly and recognised
as the best method of assessment. Dataset is complete and estimated to be accurate ± 2% B Reliable Data based on sound records, procedures, investigations and analysis, documented properly but has minor
shortcomings, for example some of the data is old, some documentation is missing and/or reliance is placed on unconfirmed reports or some extrapolation. Dataset is complete and estimated to be accurate ± 10%
C Uncertain Data based on sound records, procedures, investigations and analysis which is incomplete or unsupported, or extrapolated from a limited sample for which grade A or B data are available. Dataset is substantially complete but up to 50% is extrapolated data and accuracy estimated ± 25%
D Very Uncertain Data is based on unconfirmed verbal reports and/or cursory inspections and analysis. Dataset may not be fully complete and most data is estimated or extrapolated. Accuracy ± 40%
E Unknown None or very little data held. The estimated confidence level for and reliability of data used in this AM Plan is shown in Table 6.5.1.
Table 6.5.1: Data Confidence Assessment for Data used in AM Plan
Data Confidence Assessment Comment Demand drivers Reliable Existing demand drivers are reliably researched Growth projections Uncertain Based on State Government 30 year plan and known
increases in the short medium term Operations expenditures Reliable Based on known expenditure and type of issue Maintenance expenditures
Reliable Dependent on industry wide cost structure. Quotations received and used for best estimate.
Projected Renewal exps. - Asset values
Reliable Method used is based on current contract rates.
- Asset residual values Reliable No residual value recorded against bus stops. This is because we cannot sell the materials, no value.
- Asset useful lives Reliable Well researched - Condition modelling Reliable Based on Asset Condition as audited via site inspection in
2014. - Network renewals Uncertain Recently implemented works and assets system will allow
better modelling - Defect repairs Uncertain Recently implemented works and assets system will allow
better modelling Upgrade/New expenditures
Reliable We install New bus stops based on MetroTicket recommendations.
Disposal expenditures Reliable The CRC value for bus stop assets includes a cost component for disposal based on one third new installation costs.
Based on January 2014 Bus Stop Audit, the data confidence is assessed as high confidence level for data used in the preparation of this Bus Stop AMP.
13 IPWEA, 2011, IIMM, Table 2.4.6, p 2|59.
CITY OF CHARLES STURT– BUS STOP ASSET MANAGEMENT PLAN AUGUST 2015
- 46 -
7. PLAN IMPROVEMENT AND MONITORING
7.1 Status of Asset Management Practices
7.1.1 Accounting and financial systems
The organisation implemented the TechnologyOne Finance One ERP module during 2002 and 2003. The system has been capturing all operating and capital expenses since that time. In the absence of a job costing application, the chart of accounts was developed to track all of the required information of a project as identified at the time by the project managers. The capital works chart structure identifies the project, subproject, object and activity codes, and contained within the project and subproject numbers are codes to identify the manager, asset category, new/renew/upgrade and the project objective. The project and subproject define the location and objective of the project, the object code identifies the inputs into it, and the activity code identifies the nature of work being carried out. The budgets for all our projects are also stored in Finance One at the project and subproject level. Reports are generated on a monthly basis from Finance One comparing actual to estimate. Once works have been completed, the subproject numbers are closed off, and the balance of the subproject is either capitalised into the Finance One Fixed Asset Register, or into a current Asset Management Services Fixed Asset Register, provided it meets the Threshold of Materiality.
Accountabilities for financial systems
The Finance One Fixed Asset Register stores all of the financial information relating to buildings, land, plant and equipment and furniture and fittings. It is used for the generation of depreciation, revaluations and disposal in these asset categories. Other asset categories including Roads, Drainage and Bridges were previously managed in stand-alone systems such as RoadPak, Excel, and GIS. A new consolidated Works and Assets system implemented during 2013 and 2014 has seen these assets consolidated to the one master register in Finance One
Finance One is also the organisation’s solution for Accounts Payable, General and Project Ledgers, Inventory Management and Purchasing. All Receipting, Accounts Receivable, Land Information and Bank Reconciliations are carried out in the Property and Rating solution. Human Resources is managed in the People One ERP module of the TechnologyOne application.
Infrastructure asset information in the Finance One application is managed by the Finance Department in conjunction with the Asset Management Planning team, and is done so based on information supplied by the asset managers and owners and in accordance with the Asset Accounting Policy.
Plant and Equipment, Land and Buildings, Furniture and Fittings asset information in the Finance One application is managed by the Finance Department, and is done so based on information supplied by the asset managers and owners and in accordance with the Asset Accounting Policy. All other assets are managed by the asset owners in their stand-alone systems. Accounting standards and regulations
There are many Regulations and Accounting Standards that we must comply with; however, those that are specifically related to Asset Management are:
• South Australian Local Government Act 1999 • AASB 116 Property Plant and Equipment • AASB 1021 Depreciation • AASB 1045 Land Under Roads
CITY OF CHARLES STURT– BUS STOP ASSET MANAGEMENT PLAN AUGUST 2015
- 47 -
Capital/maintenance threshold
The organisation has an Asset Accounting Policy that is reviewed annually by the Manager Financial Services. This policy details the expenditure that is to be capitalised, and the associated accounting treatment for non-current assets. It also sets the Threshold of Materiality for all asset categories; these values can be summarised as Land and Buildings at $5,000, Computer Equipment $1,000, Furniture and Fittings $500, Roads, Drains and Bridges $5,000, Mechanical Equipment $1,000 and Vehicles $5,000. Where an individual asset falls below the threshold, but the assets form part of a network, such as park furniture on a reserve, then consideration will be given to capitalising the aggregated value providing they exceed the threshold. Acquisition costs of less than these thresholds will be expensed. Required changes to accounting financial systems arising from this AM Plan
The preparation and ongoing review and maintenance of Asset Management Plans has highlighted the need for the organisation to implement an Asset Management System. A contract for the implementation of a system was released in August of 2012 The basic system has now been implemented and data up-loaded. To have the system fully operational is expected to take a further 12 months.
The Asset system data base has been integrated with the Financial database under the recently introduced Works and Asset system. This system is now operational and being monitored for performance and need for additional personnel training. Output of data regarding maintenance work on assets will allow fine tuning of the Long Term Financial Plan as well as regular up-dating of the Long Term Financial Plan.
CITY OF CHARLES STURT– BUS STOP ASSET MANAGEMENT PLAN AUGUST 2015
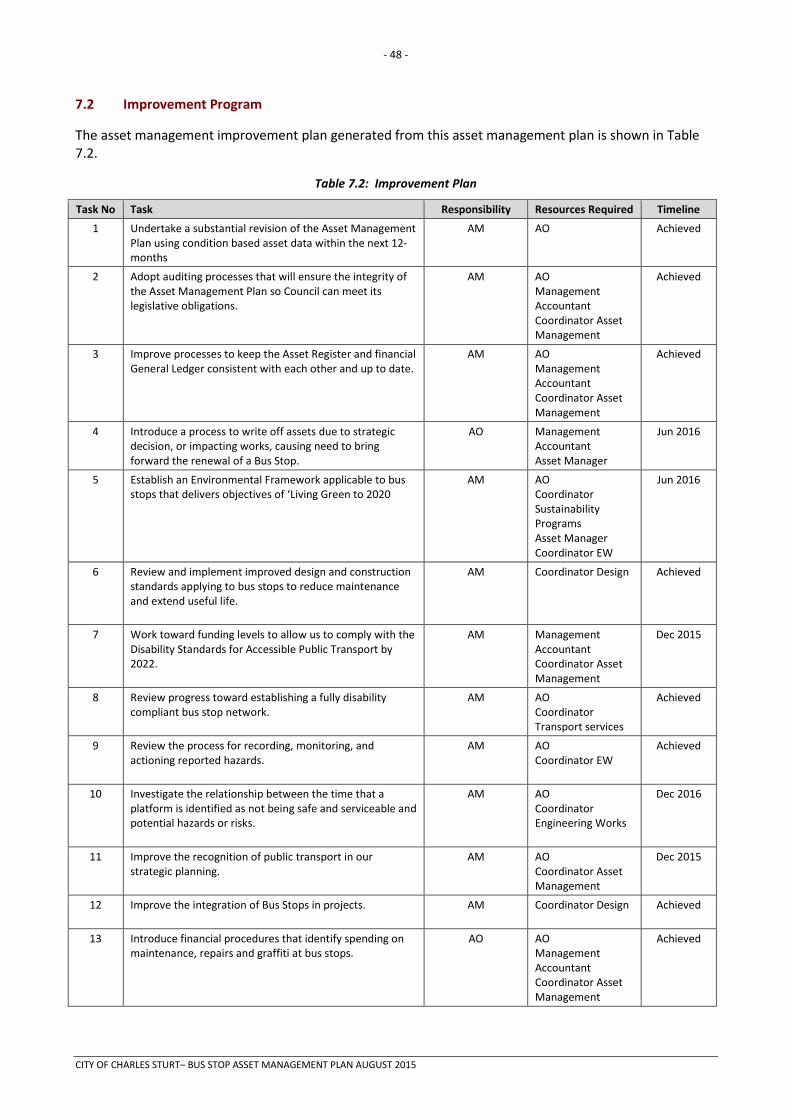
- 48 -
7.2 Improvement Program
The asset management improvement plan generated from this asset management plan is shown in Table 7.2.
Table 7.2: Improvement Plan
Task No Task Responsibility Resources Required Timeline
1 Undertake a substantial revision of the Asset Management Plan using condition based asset data within the next 12-months
AM AO Achieved
2 Adopt auditing processes that will ensure the integrity of the Asset Management Plan so Council can meet its legislative obligations.
AM AO Management Accountant Coordinator Asset Management
Achieved
3 Improve processes to keep the Asset Register and financial General Ledger consistent with each other and up to date.
AM AO Management Accountant Coordinator Asset Management
Achieved
4 Introduce a process to write off assets due to strategic decision, or impacting works, causing need to bring forward the renewal of a Bus Stop.
AO Management Accountant Asset Manager
Jun 2016
5 Establish an Environmental Framework applicable to bus stops that delivers objectives of ‘Living Green to 2020
AM AO Coordinator Sustainability Programs Asset Manager Coordinator EW
Jun 2016
6 Review and implement improved design and construction standards applying to bus stops to reduce maintenance and extend useful life.
AM Coordinator Design Achieved
7 Work toward funding levels to allow us to comply with the Disability Standards for Accessible Public Transport by 2022.
AM Management Accountant Coordinator Asset Management
Dec 2015
8 Review progress toward establishing a fully disability compliant bus stop network.
AM AO Coordinator Transport services
Achieved
9 Review the process for recording, monitoring, and actioning reported hazards.
AM AO Coordinator EW
Achieved
10 Investigate the relationship between the time that a platform is identified as not being safe and serviceable and potential hazards or risks.
AM AO Coordinator Engineering Works
Dec 2016
11 Improve the recognition of public transport in our strategic planning.
AM AO Coordinator Asset Management
Dec 2015
12 Improve the integration of Bus Stops in projects.
AM Coordinator Design Achieved
13 Introduce financial procedures that identify spending on maintenance, repairs and graffiti at bus stops.
AO AO Management Accountant Coordinator Asset Management
Achieved
CITY OF CHARLES STURT– BUS STOP ASSET MANAGEMENT PLAN AUGUST 2015
- 49 -
7.2.1 Asset management system Assets were previously managed using a variety of systems and tools. In 2012 we commenced a project to consolidate asset data and works scheduling to reduce the risk of using disparate systems and processes. This has now resulted in an asset database which has been “cleansed” of duplicate and out of date data. This will be an on-going process. Asset registers
The master asset data sits within the TechnologyOne works and assets system. The TechnologyOne core enterprise suite includes the existing Financials module resulting in a consolidated asset register. Linkage from asset management to financial system The consolidated asset register sits within the TechnologyOne core enterprise suite. The asset data is stored in the works and assets module with linked asset book data (financial data) in the financials module. Additional asset data, captured from activities such as condition audits, will be loaded and modelled against this core asset data in the Assetic predictive modelling tool. The results will then be loaded back to the consolidated register in the form of summary condition data, estimated useful lives and valuations. Linkage from asset management to financial system
The consolidated asset register sits within the TechnologyOne core enterprise suite. The asset data is stored in the works and assets module with linked asset book data (financial data) in the financials module. Additional asset data, captured from activities such as condition audits, will be loaded and modelled against this core asset data in the Assetic predictive modelling tool. The results will then be loaded back to the consolidated register in the form of summary condition data, estimated useful lives and valuations.
Accountabilities for asset management system and data maintenance
Asset Manager and Asset Officer (Data Owner) in liaison with the Asset Management Planning Business Unit. Works related data is the responsibility of the Field Service Manager and their respective business units.
Required changes to asset management system arising from this AM Plan Refinement of the Business Rules used in modelling may be required to help inform the management of a likely budget shortfall
CITY OF CHARLES STURT– BUS STOP ASSET MANAGEMENT PLAN AUGUST 2015
- 50 -
7.3 Monitoring and Review Procedures
This asset management plan will be reviewed during annual budget planning processes and amended to recognise any material changes in service levels and/or resources available to provide those services as a result of budget decisions.
The AM Plan will be updated annually to ensure it represents the current service level, asset values, projected operations, maintenance, capital renewal and replacement, capital upgrade/new and asset disposal expenditures and projected expenditure values incorporated into the organisation’s long term financial plan.
The Local Government Act 1999 sets out the requirements for the organisation in relation to preparing and reviewing its Asset Management Plans.
Chapter 8 – Administrative and financial accountability Part 1 Strategic management plans
‘(1a) A Council must, in conjunction with the plans required under subsection (1), develop and adopt –
a) A long term financial plan for a period of at least 10 years and
b) An infrastructure and asset management plan, relating to the management and development of infrastructure and major assets by the council for a period of at least 10 years.
(4) A council may review its strategic plans under this section at any time but must –
(a) Undertake a review of
(i) Its long term financial plan; and
(ii) Any other elements of its strategic management plans prescribed by regulations for the purposes of this paragraph,
As soon as practicable after adopting the council’s annual business plans for a particular financial year and
(b) In an event, undertake a comprehensive review of its strategic management plans witin 2 years after each general election cycle.’
Should the annual review cycle identify material changes that either have a significant financial or service delivery impact then the document will be resubmitted to the Asset Management Committee for review and update.
A comprehensive review of the AM Plan will be conducted every four years within 2 years of each general election cycle as prescribed in the LG Act 1999 unless required before that time.
7.4 Performance Measures
The effectiveness of the asset management plan can be measured in the following ways:
• The degree to which the required projected expenditures identified in this asset management plan are incorporated into the organisation’s long term financial plan,
• The degree to which 1-5 year detailed works programs, budgets, business plans and organisational structures take into account the ‘global’ works program trends provided by the asset management plan,
• The degree to which the existing and projected service levels and service consequences (what we cannot do), risks and residual risks are incorporated into the organisation’s Strategic Plan and associated plans,
• The Asset Renewal Funding Ratio achieving the target of 1.0.
CITY OF CHARLES STURT– BUS STOP ASSET MANAGEMENT PLAN AUGUST 2015
- 51 -
8. REFERENCES
IPWEA, 2006, ‘International Infrastructure Management Manual’, Institute of Public Works Engineering Australia, Sydney, www.ipwea.org.au/IIMM
IPWEA, 2008, ‘NAMS.PLUS Asset Management’, Institute of Public Works Engineering Australia, Sydney, www.ipwea.org.au/namsplus.
IPWEA, 2009, ‘Australian Infrastructure Financial Management Guidelines’, Institute of Public Works Engineering Australia, Sydney, www.ipwea.org.au/AIFMG.
IPWEA, 2011, ‘International Infrastructure Management Manual’, Institute of Public Works Engineering Australia, Sydney, www.ipwea.org.au/IIMM
TechnologyOne - FinanceOne, Corporate Financial System
City of Charles Sturt, Community Plan 2013-2027
City of Charles Sturt, Corporate Plan 2013-2017
City of Charles Sturt, ‘Living Green to 2020 (Draft for Consultation)’
City of Charles Sturt, Engineering & Open Space Guidelines
City of Charles Sturt, Environmental Sustainability Policy
City of Charles Sturt, Asset Accounting Policy
City of Charles Sturt, Asset Fund Policy
World Commission on Environment and Development. (1987). Our Common Future. The Bruntland Commission, UNESCO. Ajuntament de Barcelona and United Cities and Local Governments. (2004). Agenda 21 for culture. United Cities and
Local Government-Working Group on Culture. http://agenda21cultura.org/
CITY OF CHARLES STURT– BUS STOP ASSET MANAGEMENT PLAN AUGUST 2015
- 52 -
9. APPENDICES
Appendix A Maintenance Response Levels of Service
Appendix B Projected 10 year Capital Renewal and Replacement Works Program
Appendix C Projected 5 year Capital Upgrade/New Works Program
Appendix D Budgeted Expenditures Accommodated in LTFP
Appendix E Abbreviations
Appendix F Glossary
CITY OF CHARLES STURT– BUS STOP ASSET MANAGEMENT PLAN AUGUST 2015

- 53 -
Appendix A Maintenance Response Levels of Service
10005 Bus Stop Maintenance
Outcomes (at a corporate level) Customer Satisfaction Improved asset and financial management Maintain footpaths to a appropriate standard
Report Frequency: Calendar Month
Sub Activity Financial Performance Specification Performance
Budget Job No. Unit Rate Qty Intervention Criteria Scope of Work Response Times Outcomes (Unit Level)
024 Pad Repairs Concrete
Information to be Reported: • Quantity of Work
(m2); • Value of Work.
100050024 Monthly KPI reporting. • Request or referral through CRM, RRT or internal audit
• Vertical Displacement > 20mm; or • Failed Slabs > 30 % by area; or • Failed reinstatements.
• Reconstruct affected slabs including, Footpaths, Laneways, Bus Stops Walkways and Reserve Paths;
• Infill concrete to median islands, roundabouts etc.
Where RRT respond –RRT make safe within 3 days or RRT repair within 10 business days.
Where RRT have made the area safe and not repaired – place in program for repair within 21 days.
• Reduction in risk from hazards to pedestrians/path users;
• Improving integrity and condition of asset;
• Improved works programming.
020 Pad Repairs Brick Paving
Information to be Reported:
• Quantity of Work
(m2); • Value of Work.
100050020 Monthly KPI reporting. • Request or referral through CRM, RRT or internal audit
• Vertical Displacement > 20mm; or • Failed pavers > 30% by area; or • Failed reinstatements.
• Re lay affected area including Vehicular Pavements, Footpaths Bus Stops and Reserve Paths;
• (Includes brick, segmental and concrete pavers)
Where RRT respond –RRT make safe within 3 days or RRT repair within 10 business days.
Where RRT have barricaded area and not repaired – place in program for repair 12 to 18 months time.
• Reduction in risk from hazards to pedestrians/path users;
• Improving integrity and condition of asset ;
• Improved works programming.
006 Unmade Paths- Area Patching (Note Includes Footpaths & reserve paths)
Information to be Reported: • Quantity of Work
(m2); • Value of Work; • Number of days to
respond.
100050006
Not recorded separately. • Request or referral through CRM, RRT; or
• Any Holes; or • Undulating surface > 30mm under 3m
straight edge.
• Re-sheeting with imported granular material; • Repair potholes; • Undulations, water ponding & rutting - regrade
surface; • Spay or remove weeds; • Remove groundcover vegetation.
Where RRT respond –RRT make safe within 3 days. or RRT repair within 10 business days.
• Reduction in risk from hazards to pedestrians/path users;
• Improving integrity an condition of asset;
• Pavements uniform in shape with surface free from damage holes undulation, disruptions or displacements;
• Improved Works programming.
CITY OF CHARLES STURT– BUS STOP ASSET MANAGEMENT PLAN AUGUST 2015
- 54 -
Appendix B Projected 10 year Capital Renewal and Replacement Works Program
No Projected Renewals until 2023/24. This will be then determined on a Condition based criteria.
CITY OF CHARLES STURT– BUS STOP ASSET MANAGEMENT PLAN AUGUST 2015

- 55 -
Appendix C Projected Upgrade/Exp/New 5 year Capital Works Program
Frederick Road 35 East Frederick Road Royal Park $7,919.28 15/16
Frederick Road 34 East Frederick Road Royal Park $7,919.28 15/16
Frederick Road 34D East Frederick Road Royal Park $7,919.28 15/16
Frederick Road 34B West Frederick Road West Lakes $7,919.28 15/16
Frederick Road 34A East Frederick Road Royal Park $9,908.28 15/16
Frederick Road 34 West Frederick Road West Lakes $7,007.40 15/16
West Lakes Boulevard 29 North West Lakes Boulevard Hendon $7,919.28 15/16
Port Road 23 North East Port Road Woodville $10,316.28 15/16 Port Road 23 South West Port Road Woodville South $11,732.04 15/16 Port Road 22 North East (corner of Diana street) Port Road Woodville $9,908.28 15/16 Port Road 21 North East Port Road Woodville $12,140.04 15/16 Port Road 21 South West Port Road Woodville South $2,459.22 15/16 Port Road 20 North East(Corner of Hughes street south) Port Road Woodville $11,228.16 15/16 Port Road 20 South West (Corner of Oval Avenue) Port Road Woodville South $2,459.22 15/16 Port Road 19 North East Port Road Woodville Park $11,228.16 15/16 Port Road 19 South West (corner of Ledger road) Port Road Beverley $8,831.16 15/16 Port Road 18 North East (Corner of Marlborough Avenue) Port Road Woodville Park $12,140.04 15/16 Port Road 17 North East (corner of Balmoral Street) Port Road Woodville Park $11,228.16 15/16 Port Road 17 South West (Corner of William Street) Port Road Beverley $9,908.28 15/16 Port Road 16 North East Port Road Woodville Park $10,316.28 15/16
David Terrace Stop 14 West David Terrace Woodville Park $7,007.40 15/16
David Terrace Stop 13 West David Terrace Woodville Park $7,919.28 15/16
Frederick Road 34E East Frederick Road Royal Park $9,404.40 15/16
Port Road 29 North East Port Road Cheltenham $12,140.04 16/17 Port Road 32 South West Port Road Cheltenham $10,820.16 16/17 Port Road 27 North East Port Road Cheltenham $11,228.16 16/17 Port Road 27 South West Port Road Albert Park $2,276.64 16/17 Port Road 26 (Corner of High Street) Port Road Cheltenham $9,908.28 16/17 Port Road 26 (Corner of Glyde Street) Port Road Albert Park $8,327.28 16/17 Port Road 25 North East Port Road Cheltenham $9,908.28 16/17 Port Road 25 South West Port Road Albert Park $9,239.16 16/17 Port Road 24 North East Port Road Woodville $9,908.28 16/17 Port Road 18 South West (Corner of Howards Road) Port Road Beverley $8,831.16 16/17 Port Road 16 South Port Road Beverley $2,459.22 16/17 Port Road 15 N Port Road West Croydon $9,908.28 16/17
CITY OF CHARLES STURT– BUS STOP ASSET MANAGEMENT PLAN AUGUST 2015
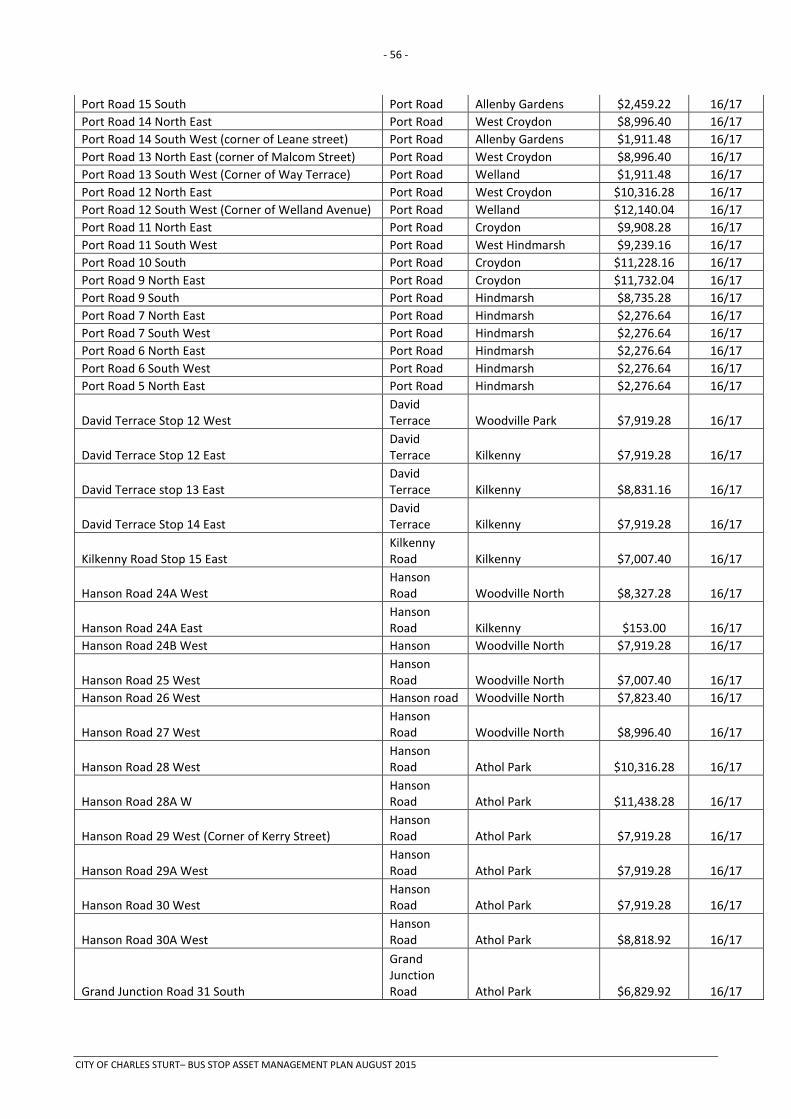
- 56 -
Port Road 15 South Port Road Allenby Gardens $2,459.22 16/17 Port Road 14 North East Port Road West Croydon $8,996.40 16/17 Port Road 14 South West (corner of Leane street) Port Road Allenby Gardens $1,911.48 16/17 Port Road 13 North East (corner of Malcom Street) Port Road West Croydon $8,996.40 16/17 Port Road 13 South West (Corner of Way Terrace) Port Road Welland $1,911.48 16/17 Port Road 12 North East Port Road West Croydon $10,316.28 16/17 Port Road 12 South West (Corner of Welland Avenue) Port Road Welland $12,140.04 16/17 Port Road 11 North East Port Road Croydon $9,908.28 16/17 Port Road 11 South West Port Road West Hindmarsh $9,239.16 16/17 Port Road 10 South Port Road Croydon $11,228.16 16/17 Port Road 9 North East Port Road Croydon $11,732.04 16/17 Port Road 9 South Port Road Hindmarsh $8,735.28 16/17 Port Road 7 North East Port Road Hindmarsh $2,276.64 16/17 Port Road 7 South West Port Road Hindmarsh $2,276.64 16/17 Port Road 6 North East Port Road Hindmarsh $2,276.64 16/17 Port Road 6 South West Port Road Hindmarsh $2,276.64 16/17 Port Road 5 North East Port Road Hindmarsh $2,276.64 16/17
David Terrace Stop 12 West David Terrace Woodville Park $7,919.28 16/17
David Terrace Stop 12 East David Terrace Kilkenny $7,919.28 16/17
David Terrace stop 13 East David Terrace Kilkenny $8,831.16 16/17
David Terrace Stop 14 East David Terrace Kilkenny $7,919.28 16/17
Kilkenny Road Stop 15 East Kilkenny Road Kilkenny $7,007.40 16/17
Hanson Road 24A West Hanson Road Woodville North $8,327.28 16/17
Hanson Road 24A East Hanson Road Kilkenny $153.00 16/17
Hanson Road 24B West Hanson Woodville North $7,919.28 16/17
Hanson Road 25 West Hanson Road Woodville North $7,007.40 16/17
Hanson Road 26 West Hanson road Woodville North $7,823.40 16/17
Hanson Road 27 West Hanson Road Woodville North $8,996.40 16/17
Hanson Road 28 West Hanson Road Athol Park $10,316.28 16/17
Hanson Road 28A W Hanson Road Athol Park $11,438.28 16/17
Hanson Road 29 West (Corner of Kerry Street) Hanson Road Athol Park $7,919.28 16/17
Hanson Road 29A West Hanson Road Athol Park $7,919.28 16/17
Hanson Road 30 West Hanson Road Athol Park $7,919.28 16/17
Hanson Road 30A West Hanson Road Athol Park $8,818.92 16/17
Grand Junction Road 31 South
Grand Junction Road Athol Park $6,829.92 16/17
CITY OF CHARLES STURT– BUS STOP ASSET MANAGEMENT PLAN AUGUST 2015
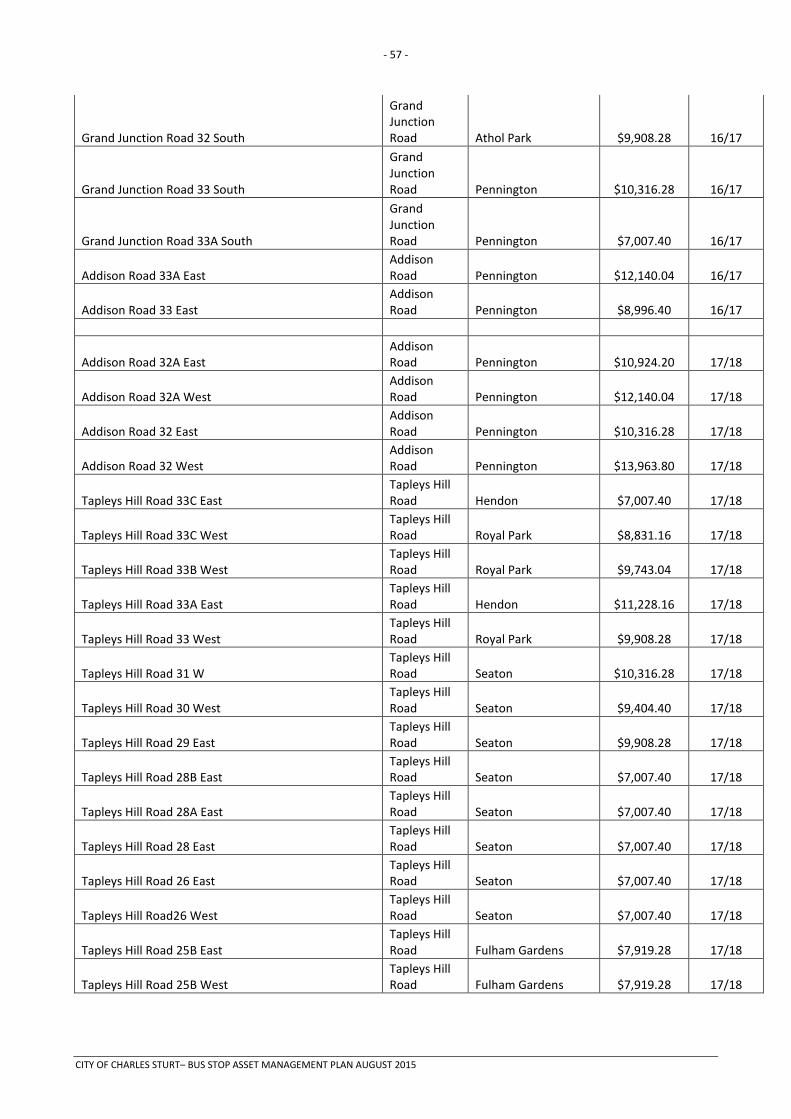
- 57 -
Grand Junction Road 32 South
Grand Junction Road Athol Park $9,908.28 16/17
Grand Junction Road 33 South
Grand Junction Road Pennington $10,316.28 16/17
Grand Junction Road 33A South
Grand Junction Road Pennington $7,007.40 16/17
Addison Road 33A East Addison Road Pennington $12,140.04 16/17
Addison Road 33 East Addison Road Pennington $8,996.40 16/17
Addison Road 32A East Addison Road Pennington $10,924.20 17/18
Addison Road 32A West Addison Road Pennington $12,140.04 17/18
Addison Road 32 East Addison Road Pennington $10,316.28 17/18
Addison Road 32 West Addison Road Pennington $13,963.80 17/18
Tapleys Hill Road 33C East Tapleys Hill Road Hendon $7,007.40 17/18
Tapleys Hill Road 33C West Tapleys Hill Road Royal Park $8,831.16 17/18
Tapleys Hill Road 33B West Tapleys Hill Road Royal Park $9,743.04 17/18
Tapleys Hill Road 33A East Tapleys Hill Road Hendon $11,228.16 17/18
Tapleys Hill Road 33 West Tapleys Hill Road Royal Park $9,908.28 17/18
Tapleys Hill Road 31 W Tapleys Hill Road Seaton $10,316.28 17/18
Tapleys Hill Road 30 West Tapleys Hill Road Seaton $9,404.40 17/18
Tapleys Hill Road 29 East Tapleys Hill Road Seaton $9,908.28 17/18
Tapleys Hill Road 28B East Tapleys Hill Road Seaton $7,007.40 17/18
Tapleys Hill Road 28A East Tapleys Hill Road Seaton $7,007.40 17/18
Tapleys Hill Road 28 East Tapleys Hill Road Seaton $7,007.40 17/18
Tapleys Hill Road 26 East Tapleys Hill Road Seaton $7,007.40 17/18
Tapleys Hill Road26 West Tapleys Hill Road Seaton $7,007.40 17/18
Tapleys Hill Road 25B East Tapleys Hill Road Fulham Gardens $7,919.28 17/18
Tapleys Hill Road 25B West Tapleys Hill Road Fulham Gardens $7,919.28 17/18
CITY OF CHARLES STURT– BUS STOP ASSET MANAGEMENT PLAN AUGUST 2015
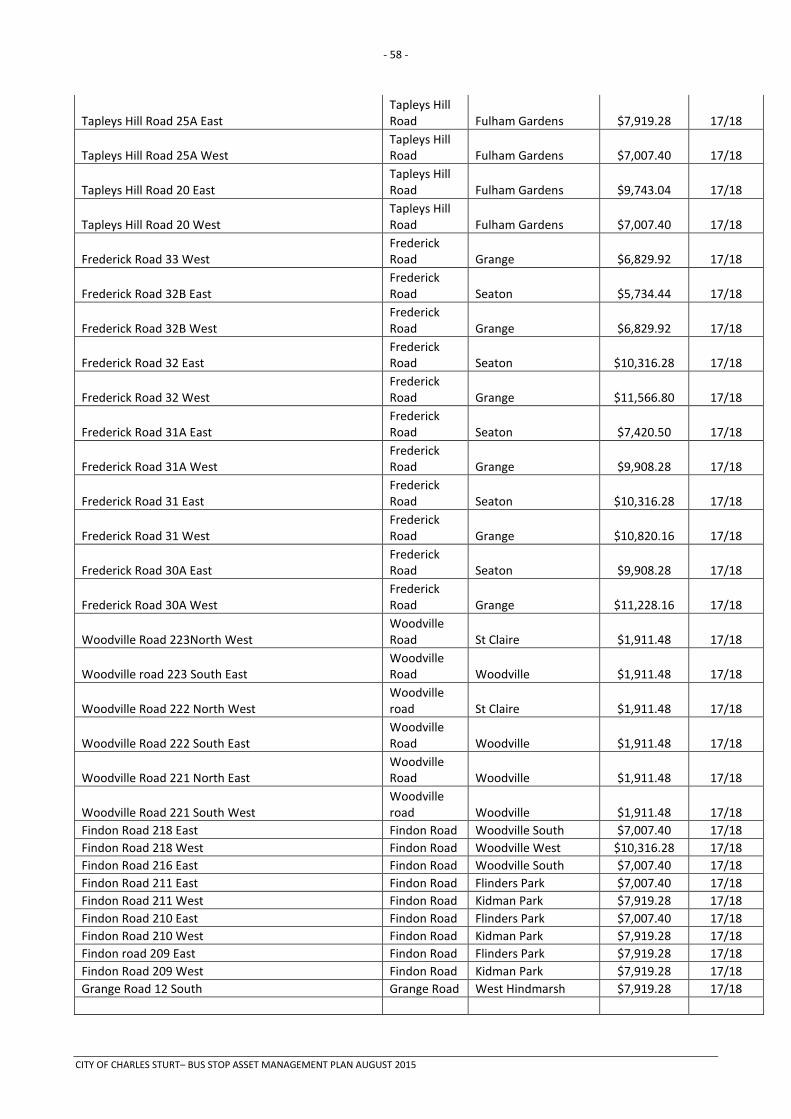
- 58 -
Tapleys Hill Road 25A East Tapleys Hill Road Fulham Gardens $7,919.28 17/18
Tapleys Hill Road 25A West Tapleys Hill Road Fulham Gardens $7,007.40 17/18
Tapleys Hill Road 20 East Tapleys Hill Road Fulham Gardens $9,743.04 17/18
Tapleys Hill Road 20 West Tapleys Hill Road Fulham Gardens $7,007.40 17/18
Frederick Road 33 West Frederick Road Grange $6,829.92 17/18
Frederick Road 32B East Frederick Road Seaton $5,734.44 17/18
Frederick Road 32B West Frederick Road Grange $6,829.92 17/18
Frederick Road 32 East Frederick Road Seaton $10,316.28 17/18
Frederick Road 32 West Frederick Road Grange $11,566.80 17/18
Frederick Road 31A East Frederick Road Seaton $7,420.50 17/18
Frederick Road 31A West Frederick Road Grange $9,908.28 17/18
Frederick Road 31 East Frederick Road Seaton $10,316.28 17/18
Frederick Road 31 West Frederick Road Grange $10,820.16 17/18
Frederick Road 30A East Frederick Road Seaton $9,908.28 17/18
Frederick Road 30A West Frederick Road Grange $11,228.16 17/18
Woodville Road 223North West Woodville Road St Claire $1,911.48 17/18
Woodville road 223 South East Woodville Road Woodville $1,911.48 17/18
Woodville Road 222 North West Woodville road St Claire $1,911.48 17/18
Woodville Road 222 South East Woodville Road Woodville $1,911.48 17/18
Woodville Road 221 North East Woodville Road Woodville $1,911.48 17/18
Woodville Road 221 South West Woodville road Woodville $1,911.48 17/18
Findon Road 218 East Findon Road Woodville South $7,007.40 17/18 Findon Road 218 West Findon Road Woodville West $10,316.28 17/18 Findon Road 216 East Findon Road Woodville South $7,007.40 17/18 Findon Road 211 East Findon Road Flinders Park $7,007.40 17/18 Findon Road 211 West Findon Road Kidman Park $7,919.28 17/18 Findon Road 210 East Findon Road Flinders Park $7,007.40 17/18 Findon Road 210 West Findon Road Kidman Park $7,919.28 17/18 Findon road 209 East Findon Road Flinders Park $7,919.28 17/18 Findon Road 209 West Findon Road Kidman Park $7,919.28 17/18 Grange Road 12 South Grange Road West Hindmarsh $7,919.28 17/18
CITY OF CHARLES STURT– BUS STOP ASSET MANAGEMENT PLAN AUGUST 2015
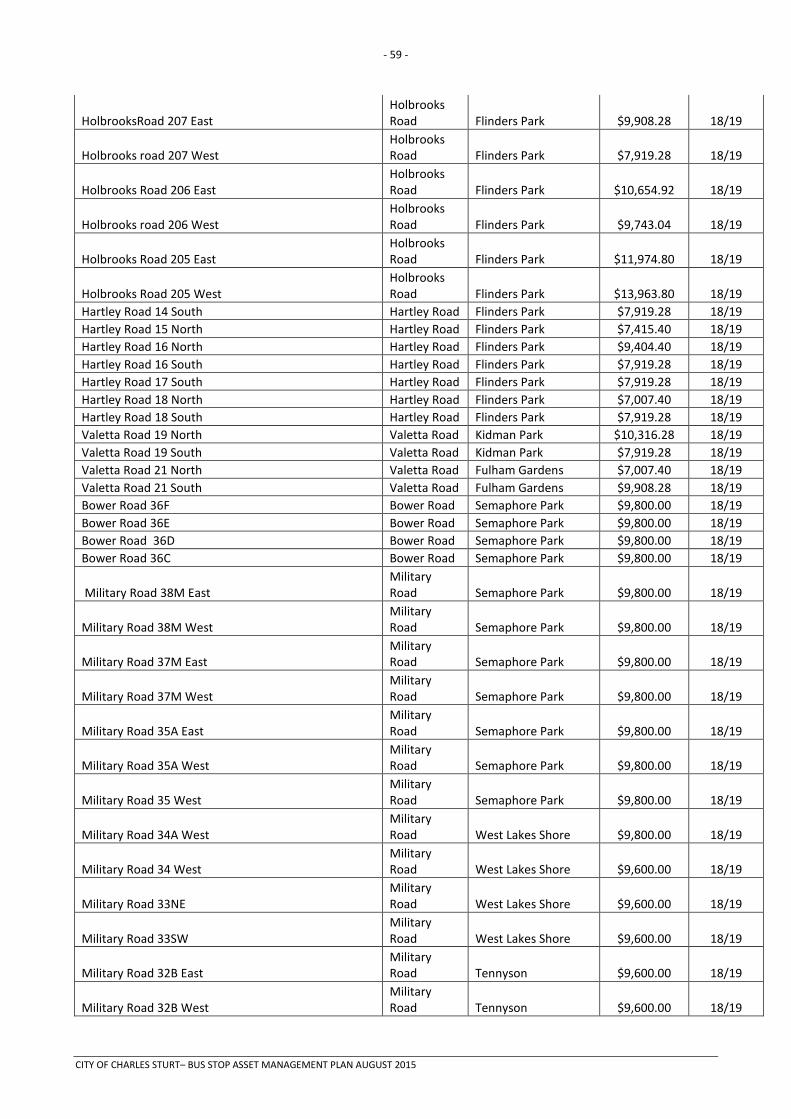
- 59 -
HolbrooksRoad 207 East Holbrooks Road Flinders Park $9,908.28 18/19
Holbrooks road 207 West Holbrooks Road Flinders Park $7,919.28 18/19
Holbrooks Road 206 East Holbrooks Road Flinders Park $10,654.92 18/19
Holbrooks road 206 West Holbrooks Road Flinders Park $9,743.04 18/19
Holbrooks Road 205 East Holbrooks Road Flinders Park $11,974.80 18/19
Holbrooks Road 205 West Holbrooks Road Flinders Park $13,963.80 18/19
Hartley Road 14 South Hartley Road Flinders Park $7,919.28 18/19 Hartley Road 15 North Hartley Road Flinders Park $7,415.40 18/19 Hartley Road 16 North Hartley Road Flinders Park $9,404.40 18/19 Hartley Road 16 South Hartley Road Flinders Park $7,919.28 18/19 Hartley Road 17 South Hartley Road Flinders Park $7,919.28 18/19 Hartley Road 18 North Hartley Road Flinders Park $7,007.40 18/19 Hartley Road 18 South Hartley Road Flinders Park $7,919.28 18/19 Valetta Road 19 North Valetta Road Kidman Park $10,316.28 18/19 Valetta Road 19 South Valetta Road Kidman Park $7,919.28 18/19 Valetta Road 21 North Valetta Road Fulham Gardens $7,007.40 18/19 Valetta Road 21 South Valetta Road Fulham Gardens $9,908.28 18/19 Bower Road 36F Bower Road Semaphore Park $9,800.00 18/19 Bower Road 36E Bower Road Semaphore Park $9,800.00 18/19 Bower Road 36D Bower Road Semaphore Park $9,800.00 18/19 Bower Road 36C Bower Road Semaphore Park $9,800.00 18/19
Military Road 38M East Military Road Semaphore Park $9,800.00 18/19
Military Road 38M West Military Road Semaphore Park $9,800.00 18/19
Military Road 37M East Military Road Semaphore Park $9,800.00 18/19
Military Road 37M West Military Road Semaphore Park $9,800.00 18/19
Military Road 35A East Military Road Semaphore Park $9,800.00 18/19
Military Road 35A West Military Road Semaphore Park $9,800.00 18/19
Military Road 35 West Military Road Semaphore Park $9,800.00 18/19
Military Road 34A West Military Road West Lakes Shore $9,800.00 18/19
Military Road 34 West Military Road West Lakes Shore $9,600.00 18/19
Military Road 33NE Military Road West Lakes Shore $9,600.00 18/19
Military Road 33SW Military Road West Lakes Shore $9,600.00 18/19
Military Road 32B East Military Road Tennyson $9,600.00 18/19
Military Road 32B West Military Road Tennyson $9,600.00 18/19
CITY OF CHARLES STURT– BUS STOP ASSET MANAGEMENT PLAN AUGUST 2015
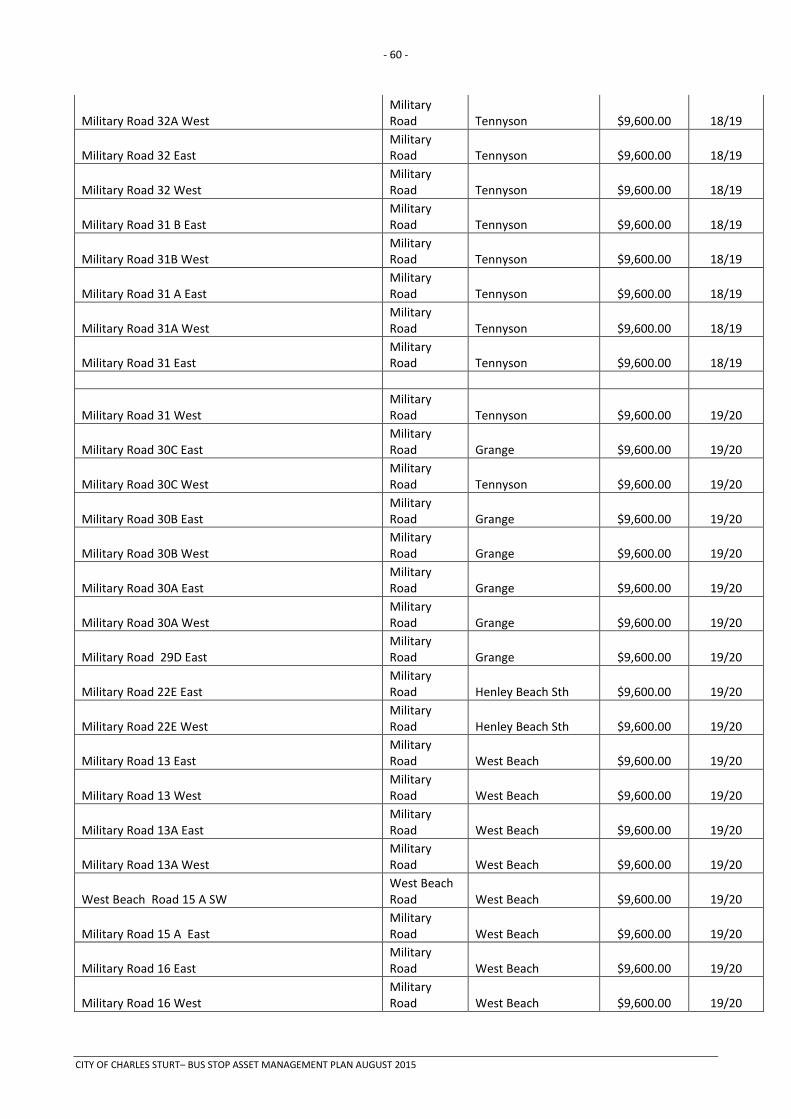
- 60 -
Military Road 32A West Military Road Tennyson $9,600.00 18/19
Military Road 32 East Military Road Tennyson $9,600.00 18/19
Military Road 32 West Military Road Tennyson $9,600.00 18/19
Military Road 31 B East Military Road Tennyson $9,600.00 18/19
Military Road 31B West Military Road Tennyson $9,600.00 18/19
Military Road 31 A East Military Road Tennyson $9,600.00 18/19
Military Road 31A West Military Road Tennyson $9,600.00 18/19
Military Road 31 East Military Road Tennyson $9,600.00 18/19
Military Road 31 West Military Road Tennyson $9,600.00 19/20
Military Road 30C East Military Road Grange $9,600.00 19/20
Military Road 30C West Military Road Tennyson $9,600.00 19/20
Military Road 30B East Military Road Grange $9,600.00 19/20
Military Road 30B West Military Road Grange $9,600.00 19/20
Military Road 30A East Military Road Grange $9,600.00 19/20
Military Road 30A West Military Road Grange $9,600.00 19/20
Military Road 29D East Military Road Grange $9,600.00 19/20
Military Road 22E East Military Road Henley Beach Sth $9,600.00 19/20
Military Road 22E West Military Road Henley Beach Sth $9,600.00 19/20
Military Road 13 East Military Road West Beach $9,600.00 19/20
Military Road 13 West Military Road West Beach $9,600.00 19/20
Military Road 13A East Military Road West Beach $9,600.00 19/20
Military Road 13A West Military Road West Beach $9,600.00 19/20
West Beach Road 15 A SW West Beach Road West Beach $9,600.00 19/20
Military Road 15 A East Military Road West Beach $9,600.00 19/20
Military Road 16 East Military Road West Beach $9,600.00 19/20
Military Road 16 West Military Road West Beach $9,600.00 19/20
CITY OF CHARLES STURT– BUS STOP ASSET MANAGEMENT PLAN AUGUST 2015
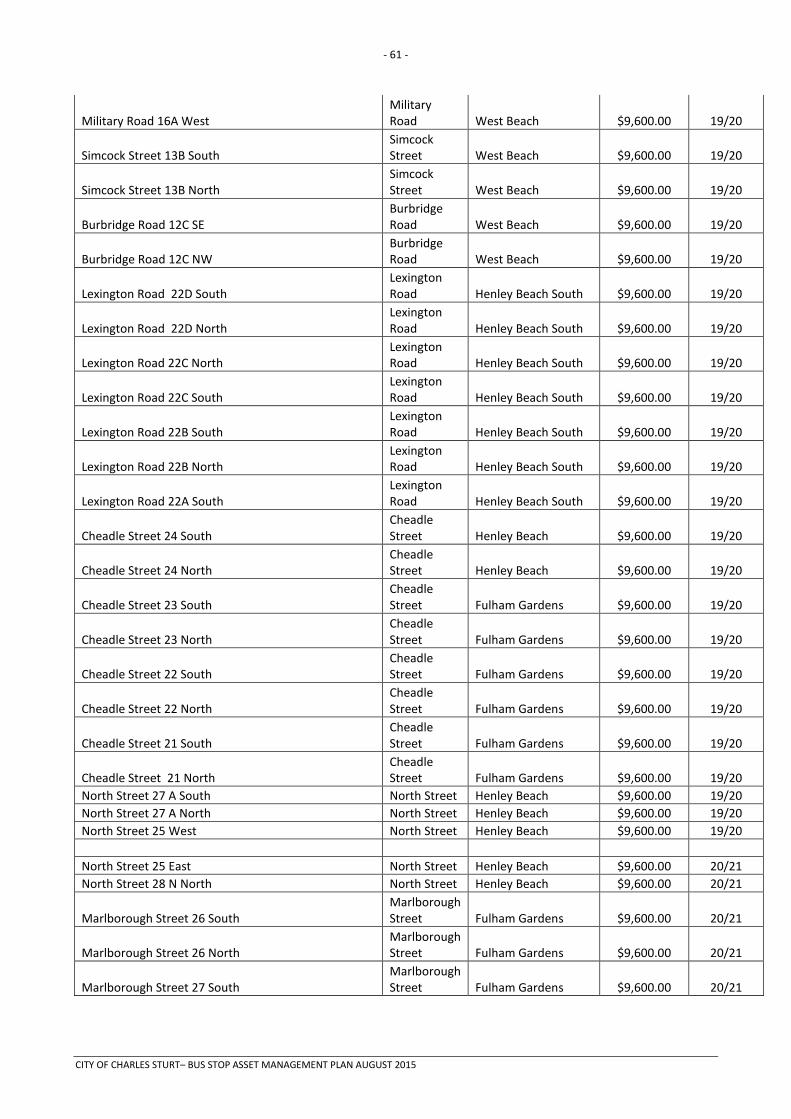
- 61 -
Military Road 16A West Military Road West Beach $9,600.00 19/20
Simcock Street 13B South Simcock Street West Beach $9,600.00 19/20
Simcock Street 13B North Simcock Street West Beach $9,600.00 19/20
Burbridge Road 12C SE Burbridge Road West Beach $9,600.00 19/20
Burbridge Road 12C NW Burbridge Road West Beach $9,600.00 19/20
Lexington Road 22D South Lexington Road Henley Beach South $9,600.00 19/20
Lexington Road 22D North Lexington Road Henley Beach South $9,600.00 19/20
Lexington Road 22C North Lexington Road Henley Beach South $9,600.00 19/20
Lexington Road 22C South Lexington Road Henley Beach South $9,600.00 19/20
Lexington Road 22B South Lexington Road Henley Beach South $9,600.00 19/20
Lexington Road 22B North Lexington Road Henley Beach South $9,600.00 19/20
Lexington Road 22A South Lexington Road Henley Beach South $9,600.00 19/20
Cheadle Street 24 South Cheadle Street Henley Beach $9,600.00 19/20
Cheadle Street 24 North Cheadle Street Henley Beach $9,600.00 19/20
Cheadle Street 23 South Cheadle Street Fulham Gardens $9,600.00 19/20
Cheadle Street 23 North Cheadle Street Fulham Gardens $9,600.00 19/20
Cheadle Street 22 South Cheadle Street Fulham Gardens $9,600.00 19/20
Cheadle Street 22 North Cheadle Street Fulham Gardens $9,600.00 19/20
Cheadle Street 21 South Cheadle Street Fulham Gardens $9,600.00 19/20
Cheadle Street 21 North Cheadle Street Fulham Gardens $9,600.00 19/20
North Street 27 A South North Street Henley Beach $9,600.00 19/20 North Street 27 A North North Street Henley Beach $9,600.00 19/20 North Street 25 West North Street Henley Beach $9,600.00 19/20 North Street 25 East North Street Henley Beach $9,600.00 20/21 North Street 28 N North North Street Henley Beach $9,600.00 20/21
Marlborough Street 26 South Marlborough Street Fulham Gardens $9,600.00 20/21
Marlborough Street 26 North Marlborough Street Fulham Gardens $9,600.00 20/21
Marlborough Street 27 South Marlborough Street Fulham Gardens $9,600.00 20/21
CITY OF CHARLES STURT– BUS STOP ASSET MANAGEMENT PLAN AUGUST 2015
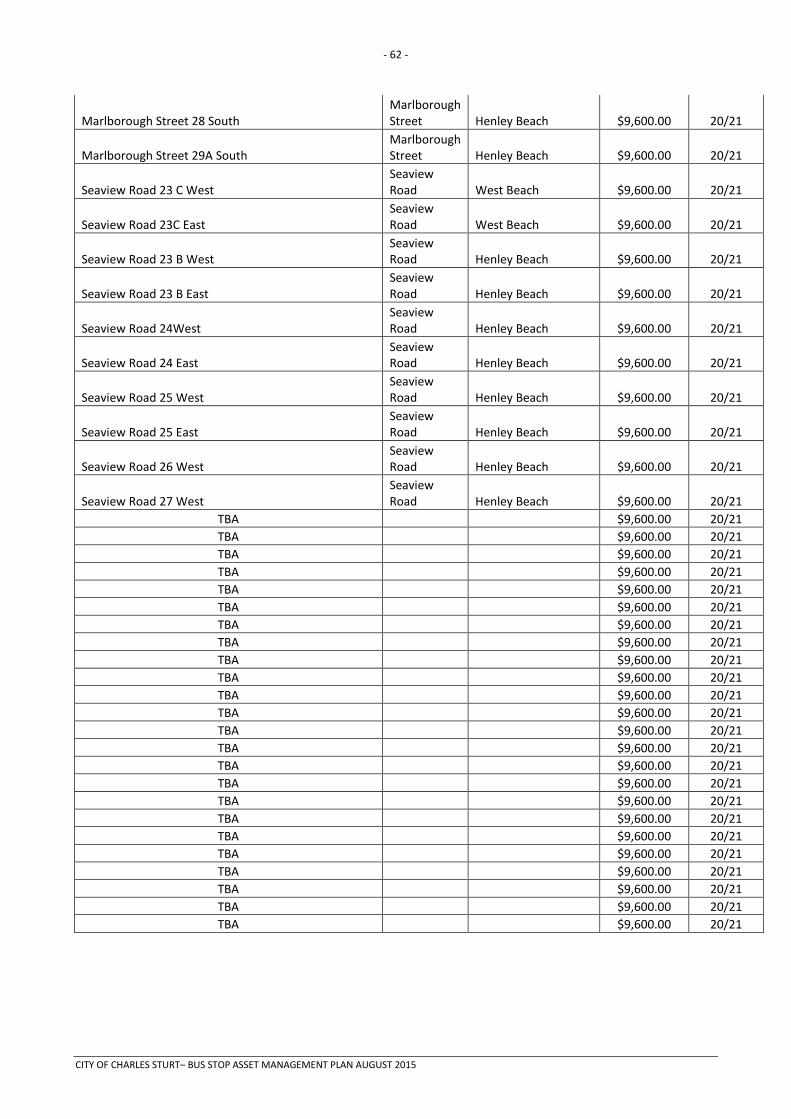
- 62 -
Marlborough Street 28 South Marlborough Street Henley Beach $9,600.00 20/21
Marlborough Street 29A South Marlborough Street Henley Beach $9,600.00 20/21
Seaview Road 23 C West Seaview Road West Beach $9,600.00 20/21
Seaview Road 23C East Seaview Road West Beach $9,600.00 20/21
Seaview Road 23 B West Seaview Road Henley Beach $9,600.00 20/21
Seaview Road 23 B East Seaview Road Henley Beach $9,600.00 20/21
Seaview Road 24West Seaview Road Henley Beach $9,600.00 20/21
Seaview Road 24 East Seaview Road Henley Beach $9,600.00 20/21
Seaview Road 25 West Seaview Road Henley Beach $9,600.00 20/21
Seaview Road 25 East Seaview Road Henley Beach $9,600.00 20/21
Seaview Road 26 West Seaview Road Henley Beach $9,600.00 20/21
Seaview Road 27 West Seaview Road Henley Beach $9,600.00 20/21
TBA $9,600.00 20/21 TBA $9,600.00 20/21 TBA $9,600.00 20/21 TBA $9,600.00 20/21 TBA $9,600.00 20/21 TBA $9,600.00 20/21 TBA $9,600.00 20/21 TBA $9,600.00 20/21 TBA $9,600.00 20/21 TBA $9,600.00 20/21 TBA $9,600.00 20/21 TBA $9,600.00 20/21 TBA $9,600.00 20/21 TBA $9,600.00 20/21 TBA $9,600.00 20/21 TBA $9,600.00 20/21 TBA $9,600.00 20/21 TBA $9,600.00 20/21 TBA $9,600.00 20/21 TBA $9,600.00 20/21 TBA $9,600.00 20/21 TBA $9,600.00 20/21 TBA $9,600.00 20/21 TBA $9,600.00 20/21
CITY OF CHARLES STURT– BUS STOP ASSET MANAGEMENT PLAN AUGUST 2015
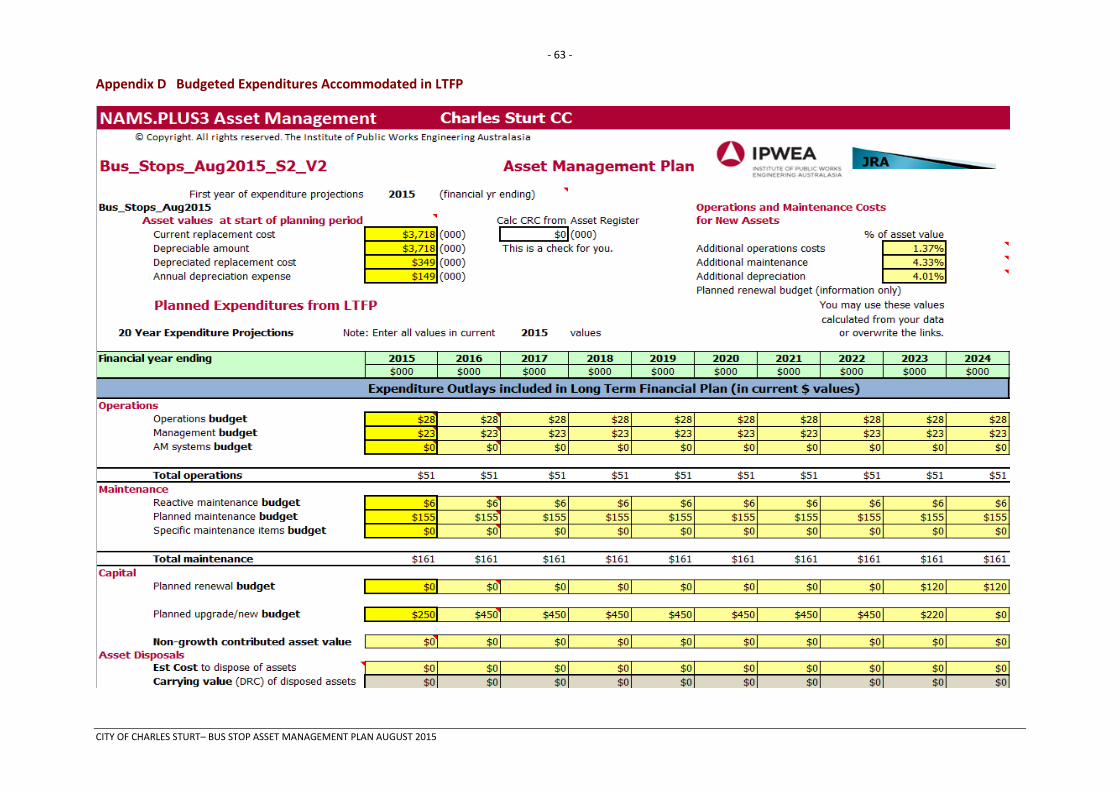
- 63 -
Appendix D Budgeted Expenditures Accommodated in LTFP
CITY OF CHARLES STURT– BUS STOP ASSET MANAGEMENT PLAN AUGUST 2015
- 64 -
Appendix E Abbreviations
AAAC Average annual asset consumption
AM Asset management
AM Plan Asset management plan
ARI Average recurrence interval
ASC Annual service cost
BOD Biochemical (biological) oxygen demand
CRC Current replacement cost
CWMS Community wastewater management systems
DA Depreciable amount
DRC Depreciated replacement cost
EF Earthworks/formation
IRMP Infrastructure risk management plan
LCC Life Cycle cost
LCE Life cycle expenditure
LTFP Long term financial plan
MMS Maintenance management system
PCI Pavement condition index
RV Residual value
SoA State of the Assets
SS Suspended solids
vph Vehicles per hour
WDCRD Written down current replacement cost
CITY OF CHARLES STURT– BUS STOP ASSET MANAGEMENT PLAN AUGUST 2015

- 65 -
Appendix F Glossary
Annual service cost (ASC) 1) Reporting actual cost The annual (accrual) cost of providing a service
including operations, maintenance, depreciation, finance/opportunity and disposal costs less revenue.
2) For investment analysis and budgeting An estimate of the cost that would be tendered,
per annum, if tenders were called for the supply of a service to a performance specification for a fixed term. The Annual Service Cost includes operations, maintenance, depreciation, finance/ opportunity and disposal costs, less revenue.
Asset A resource controlled by an entity as a result of past events and from which future economic benefits are expected to flow to the entity. Infrastructure assets are a sub-class of property, plant and equipment which are non-current assets with a life greater than 12 months and enable services to be provided.
Asset category Sub-group of assets within a class hierarchy for financial reporting and management purposes.
Asset class A group of assets having a similar nature or function in the operations of an entity, and which, for purposes of disclosure, is shown as a single item without supplementary disclosure.
Asset condition assessment The process of continuous or periodic inspection, assessment, measurement and interpretation of the resultant data to indicate the condition of a specific asset so as to determine the need for some preventative or remedial action.
Asset hierarchy A framework for segmenting an asset base into appropriate classifications. The asset hierarchy can be based on asset function or asset type or a combination of the two.
Asset management (AM) The combination of management, financial, economic, engineering and other practices applied to physical assets with the objective of providing the required level of service in the most cost effective manner.
Asset renewal funding ratio The ratio of the net present value of asset renewal funding accommodated over a 10 year period in a long term financial plan relative to the net present value of projected capital renewal expenditures identified in an asset management plan for the same period [AIFMG Financial Sustainability Indicator No 8].
Average annual asset consumption (AAAC)* The amount of an organisation’s asset base consumed during a reporting period (generally a year). This may be calculated by dividing the depreciable amount by the useful life (or total future economic benefits/service potential) and totalled for each and every asset OR by dividing the carrying amount (depreciated replacement cost) by the remaining useful life (or remaining future economic benefits/service potential) and totalled for each and every asset in an asset category or class.
Borrowings A borrowing or loan is a contractual obligation of the borrowing entity to deliver cash or another financial asset to the lending entity over a specified period of time or at a specified point in time, to cover both the initial capital provided and the cost of the interest incurred for providing this capital. A borrowing or loan provides the means for the borrowing entity to finance outlays (typically physical assets) when it has insufficient funds of its own to do so, and for the lending entity to make a financial return, normally in the form of interest revenue, on the funding provided.
Capital expenditure Relatively large (material) expenditure, which has benefits, expected to last for more than 12 months. Capital expenditure includes renewal, expansion and upgrade. Where capital projects involve a combination of renewal, expansion and/or upgrade expenditures, the total project cost needs to be allocated accordingly.
Capital expenditure - expansion Expenditure that extends the capacity of an existing asset to provide benefits, at the same standard as is currently enjoyed by existing beneficiaries, to a new group of users. It is discretionary expenditure, which increases future operations and maintenance costs, because it
CITY OF CHARLES STURT – BUS STOPS ASSET MANAGEMENT PLAN AUGUST 2015

- 66 -
increases the organisation’s asset base, but may be associated with additional revenue from the new user group, eg. extending a drainage or road network, the provision of an oval or park in a new suburb for new residents.
Capital expenditure - new Expenditure which creates a new asset providing a new service/output that did not exist beforehand. As it increases service potential it may impact revenue and will increase future operations and maintenance expenditure.
Capital expenditure - renewal Expenditure on an existing asset or on replacing an existing asset, which returns the service capability of the asset up to that which it had originally. It is periodically required expenditure, relatively large (material) in value compared with the value of the components or sub-components of the asset being renewed. As it reinstates existing service potential, it generally has no impact on revenue, but may reduce future operations and maintenance expenditure if completed at the optimum time, eg. resurfacing or resheeting a material part of a road network, replacing a material section of a drainage network with pipes of the same capacity, resurfacing an oval.
Capital expenditure - upgrade Expenditure, which enhances an existing asset to provide a higher level of service or expenditure that will increase the life of the asset beyond that which it had originally. Upgrade expenditure is discretionary and often does not result in additional revenue unless direct user charges apply. It will increase operations and maintenance expenditure in the future because of the increase in the organisation’s asset base, eg. widening the sealed area of an existing road, replacing drainage pipes with pipes of a greater capacity, enlarging a grandstand at a sporting facility.
Capital funding Funding to pay for capital expenditure.
Capital grants Monies received generally tied to the specific projects for which they are granted, which are often upgrade and/or expansion or new investment proposals.
Capital investment expenditure See capital expenditure definition.
Capitalisation threshold The value of expenditure on non-current assets above which the expenditure is recognised as capital expenditure and below which the expenditure is charged as an expense in the year of acquisition.
Carrying amount The amount at which an asset is recognised after deducting any accumulated depreciation / amortisation and accumulated impairment losses thereon.
Class of assets See asset class definition
Component Specific parts of an asset having independent physical or functional identity and having specific attributes such as different life expectancy, maintenance regimes, risk or criticality.
Core asset management Asset management which relies primarily on the use of an asset register, maintenance management systems, job resource management, inventory control, condition assessment, simple risk assessment and defined levels of service, in order to establish alternative treatment options and long-term cashflow predictions. Priorities are usually established on the basis of financial return gained by carrying out the work (rather than detailed risk analysis and optimised decision- making).
Cost of an asset The amount of cash or cash equivalents paid or the fair value of the consideration given to acquire an asset at the time of its acquisition or construction, including any costs necessary to place the asset into service. This includes one-off design and project management costs.
Critical assets Assets for which the financial, business or service level consequences of failure are sufficiently severe to justify proactive inspection and rehabilitation. Critical assets have a lower threshold for action than noncritical assets.
Current replacement cost (CRC)
CITY OF CHARLES STURT – BUS STOPS ASSET MANAGEMENT PLAN AUGUST 2015
- 67 -
The cost the entity would incur to acquire the asset on the reporting date. The cost is measured by reference to the lowest cost at which the gross future economic benefits could be obtained in the normal course of business or the minimum it would cost, to replace the existing asset with a technologically modern equivalent new asset (not a second hand one) with the same economic benefits (gross service potential) allowing for any differences in the quantity and quality of output and in operating costs.
Deferred maintenance The shortfall in rehabilitation work undertaken relative to that required to maintain the service potential of an asset.
Depreciable amount The cost of an asset, or other amount substituted for its cost, less its residual value.
Depreciated replacement cost (DRC) The current replacement cost (CRC) of an asset less, where applicable, accumulated depreciation calculated on the basis of such cost to reflect the already consumed or expired future economic benefits of the asset.
Depreciation / amortisation The systematic allocation of the depreciable amount (service potential) of an asset over its useful life.
Economic life See useful life definition.
Expenditure The spending of money on goods and services. Expenditure includes recurrent and capital outlays.
Expenses Decreases in economic benefits during the accounting period in the form of outflows or depletions of assets or increases in liabilities that result in decreases in equity, other than those relating to distributions to equity participants.
Fair value The amount for which an asset could be exchanged, or a liability settled, between knowledgeable, willing parties, in an arms length transaction.
Financing gap A financing gap exists whenever an entity has insufficient capacity to finance asset renewal and other expenditure necessary to be able to appropriately maintain the range and level of services its existing asset stock was originally designed and intended to deliver. The service capability of the existing asset stock should be determined assuming no additional operating revenue, productivity improvements, or net financial liabilities above levels currently planned or projected. A current financing gap means service levels have already or are currently falling. A projected financing gap if not addressed will result in a future diminution of existing service levels.
Heritage asset An asset with historic, artistic, scientific, technological, geographical or environmental qualities that is held and maintained principally for its contribution to knowledge and culture and this purpose is central to the objectives of the entity holding it.
Impairment Loss The amount by which the carrying amount of an asset exceeds its recoverable amount.
Infrastructure assets Physical assets that contribute to meeting the needs of organisations or the need for access to major economic and social facilities and services, eg. roads, drainage, footpaths and cycleways. These are typically large, interconnected networks or portfolios of composite assets. The components of these assets may be separately maintained, renewed or replaced individually so that the required level and standard of service from the network of assets is continuously sustained. Generally the components and hence the assets have long lives. They are fixed in place and are often have no separate market value.
Investment property Property held to earn rentals or for capital appreciation or both, rather than for: (a) use in the production or supply of goods or services
or for administrative purposes; or (b) sale in the ordinary course of business. Key performance indicator A qualitative or quantitative measure of a service or activity used to compare actual performance against a standard or other target. Performance
CITY OF CHARLES STURT – BUS STOPS ASSET MANAGEMENT PLAN AUGUST 2015
- 68 -
indicators commonly relate to statutory limits, safety, responsiveness, cost, comfort, asset performance, reliability, efficiency, environmental protection and customer satisfaction.
Level of service The defined service quality for a particular service/activity against which service performance may be measured. Service levels usually relate to quality, quantity, reliability, responsiveness, environmental impact, acceptability and cost.
Life Cycle Cost * 1. Total LCC The total cost of an asset throughout its
life including planning, design, construction, acquisition, operation, maintenance, rehabilitation and disposal costs.
2. Average LCC The life cycle cost (LCC) is average cost to provide the service over the longest asset life cycle. It comprises average operations, maintenance expenditure plus asset consumption expense, represented by depreciation expense projected over 10 years. The Life Cycle Cost does not indicate the funds required to provide the service in a particular year.
Life Cycle Expenditure The Life Cycle Expenditure (LCE) is the average operations, maintenance and capital renewal expenditure accommodated in the long term financial plan over 10 years. Life Cycle Expenditure may be compared to average Life Cycle Cost to give an initial indicator of affordability of projected service levels when considered with asset age profiles.
Loans / borrowings See borrowings.
Maintenance All actions necessary for retaining an asset as near as practicable to an appropriate service condition, including regular ongoing day-to-day work necessary to keep assets operating, eg road patching but excluding rehabilitation or renewal. It is operating expenditure required to ensure that the asset reaches its expected useful life. • Planned maintenance
Repair work that is identified and managed through a maintenance management system (MMS). MMS activities include inspection, assessing the condition against failure/breakdown criteria/experience, prioritising scheduling,
actioning the work and reporting what was done to develop a maintenance history and improve maintenance and service delivery performance.
• Reactive maintenance Unplanned repair work that is carried out in response to service requests and management/ supervisory directions.
• Specific maintenance Maintenance work to repair components or replace sub-components that needs to be identified as a specific maintenance item in the maintenance budget.
• Unplanned maintenance Corrective work required in the short-term to restore an asset to working condition so it can continue to deliver the required service or to maintain its level of security and integrity.
Maintenance expenditure * Recurrent expenditure, which is periodically or regularly required as part of the anticipated schedule of works required to ensure that the asset achieves its useful life and provides the required level of service. It is expenditure, which was anticipated in determining the asset’s useful life.
Materiality The notion of materiality guides the margin of error acceptable, the degree of precision required and the extent of the disclosure required when preparing general purpose financial reports. Information is material if its omission, misstatement or non-disclosure has the potential, individually or collectively, to influence the economic decisions of users taken on the basis of the financial report or affect the discharge of accountability by the management or governing body of the entity.
Modern equivalent asset Assets that replicate what is in existence with the most cost-effective asset performing the same level of service. It is the most cost efficient, currently available asset which will provide the same stream of services as the existing asset is capable of producing. It allows for technology changes and, improvements and efficiencies in production and installation techniques
Net present value (NPV) The value to the organisation of the cash flows associated with an asset, liability, activity or event calculated using a discount rate to reflect the time value of money. It is the net amount of
CITY OF CHARLES STURT – BUS STOPS ASSET MANAGEMENT PLAN AUGUST 2015

- 69 -
discounted total cash inflows after deducting the value of the discounted total cash outflows arising from eg the continued use and subsequent disposal of the asset after deducting the value of the discounted total cash outflows.
Non-revenue generating investments Investments for the provision of goods and services to sustain or improve services to the community that are not expected to generate any savings or revenue to the organisation, eg. parks and playgrounds, footpaths, roads and bridges, libraries, etc.
Operations Regular activities to provide services such as public health, safety and amenity, eg street sweeping, grass mowing and street lighting.
Operating expenditure Recurrent expenditure, which is continuously required to provide a service. In common use the term typically includes, eg power, fuel, staff, plant equipment, on-costs and overheads but excludes maintenance and depreciation. Maintenance and depreciation is on the other hand included in operating expenses.
Operating expense The gross outflow of economic benefits, being cash and non cash items, during the period arising in the course of ordinary activities of an entity when those outflows result in decreases in equity, other than decreases relating to distributions to equity participants.
Operating expenses Recurrent expenses continuously required to provide a service, including power, fuel, staff, plant equipment, maintenance, depreciation, on-costs and overheads.
Operations, maintenance and renewal financing ratio Ratio of estimated budget to projected expenditure for operations, maintenance and renewal of assets over a defined time (eg 5, 10 and 15 years).
Operations, maintenance and renewal gap Difference between budgeted expenditures in a long term financial plan (or estimated future budgets in absence of a long term financial plan) and projected expenditures for operations, maintenance and renewal of assets to
achieve/maintain specified service levels, totalled over a defined time (e.g. 5, 10 and 15 years).
Pavement management system (PMS) A systematic process for measuring and predicting the condition of road pavements and wearing surfaces over time and recommending corrective actions.
PMS Score A measure of condition of a road segment determined from a Pavement Management System.
Rate of annual asset consumption * The ratio of annual asset consumption relative to the depreciable amount of the assets. It measures the amount of the consumable parts of assets that are consumed in a period (depreciation) expressed as a percentage of the depreciable amount.
Rate of annual asset renewal * The ratio of asset renewal and replacement expenditure relative to depreciable amount for a period. It measures whether assets are being replaced at the rate they are wearing out with capital renewal expenditure expressed as a percentage of depreciable amount (capital renewal expenditure/DA).
Rate of annual asset upgrade/new * A measure of the rate at which assets are being upgraded and expanded per annum with capital upgrade/new expenditure expressed as a percentage of depreciable amount (capital upgrade/expansion expenditure/DA).
Recoverable amount The higher of an asset's fair value, less costs to sell and its value in use.
Recurrent expenditure Relatively small (immaterial) expenditure or that which has benefits expected to last less than 12 months. Recurrent expenditure includes operations and maintenance expenditure.
Recurrent funding Funding to pay for recurrent expenditure.
Rehabilitation See capital renewal expenditure definition above.
Remaining useful life
CITY OF CHARLES STURT – BUS STOPS ASSET MANAGEMENT PLAN AUGUST 2015
- 70 -
The time remaining until an asset ceases to provide the required service level or economic usefulness. Age plus remaining useful life is useful life.
Renewal See capital renewal expenditure definition above.
Residual value The estimated amount that an entity would currently obtain from disposal of the asset, after deducting the estimated costs of disposal, if the asset were already of the age and in the condition expected at the end of its useful life.
Revenue generating investments Investments for the provision of goods and services to sustain or improve services to the community that are expected to generate some savings or revenue to offset operating costs, eg public halls and theatres, childcare centres, sporting and recreation facilities, tourist information centres, etc.
Risk management The application of a formal process to the range of possible values relating to key factors associated with a risk in order to determine the resultant ranges of outcomes and their probability of occurrence.
Section or segment A self-contained part or piece of an infrastructure asset.
Service potential The total future service capacity of an asset. It is normally determined by reference to the operating capacity and economic life of an asset. A measure of service potential is used in the not-for-profit sector/public sector to value assets, particularly those not producing a cash flow.
Service potential remaining A measure of the future economic benefits remaining in assets. It may be expressed in dollar values (Fair Value) or as a percentage of total anticipated future economic benefits. It is also a measure of the percentage of the asset’s potential to provide services that is still available for use in providing services (Depreciated Replacement Cost/Depreciable Amount).
Specific Maintenance
Replacement of higher value components/sub-components of assets that is undertaken on a regular cycle including repainting, replacement of air conditioning equipment, etc. This work generally falls below the capital/ maintenance threshold and needs to be identified in a specific maintenance budget allocation.
Strategic Longer-Term Plan A plan covering the term of office of councillors (4 years minimum) reflecting the needs of the community for the foreseeable future. It brings together the detailed requirements in the Council’s longer-term plans such as the asset management plan and the long-term financial plan. The plan is prepared in consultation with the community and details where the Council is at that point in time, where it wants to go, how it is going to get there, mechanisms for monitoring the achievement of the outcomes and how the plan will be resourced.
Sub-component Smaller individual parts that make up a component part.
Sustainability Sustainable development is concerned not just with retaining local industries, services, and resources, but also with doing so in an environmentally, economically, and socially beneficial manner. It increasingly recognizes the need to incorporate culture and creativity in sustainable plans and strategies This model recognizes that a community’s vitality and quality of life is closely related to the its cultural engagement, expression, dialogue, and celebration. The four-pillars model further recognizes that the contribution of culture to building lively cities and communities where people want to live, work, and visit, plays a major role in supporting social, environmental and economic health
Useful life Either: (a) the period over which an asset is expected to be
available for use by an entity, or (b) the number of production or similar units expected
to be obtained from the asset by the entity. It is estimated or expected time between placing the asset into service and removing it from service, or the estimated period of time over which the future economic benefits embodied in a depreciable asset, are expected to be consumed by the organisation.
CITY OF CHARLES STURT – BUS STOPS ASSET MANAGEMENT PLAN AUGUST 2015
- 71 -
Value in Use The present value of future cash flows expected to be derived from an asset or cash generating unit. It is deemed to be depreciated replacement cost (DRC) for those assets whose future economic benefits are not primarily dependent on the asset's ability to generate net cash inflows, where the entity would, if deprived of the asset, replace its remaining future economic benefits.
Source: IPWEA, 2009, AIFMG Glossary
Additional and modified glossary items shown *
CITY OF CHARLES STURT – BUS STOPS ASSET MANAGEMENT PLAN AUGUST 2015