BURSA MALAYSIA BERHADbursa.listedcompany.com/misc/slides_20110517.pdf · Serve High Income...
42
Invest Malaysia New York Dato’ Tajuddin Atan, CEO 17 – 18 May 2011 BURSA MALAYSIA BERHAD Destination of choice for listings and investments in the region
Transcript of BURSA MALAYSIA BERHADbursa.listedcompany.com/misc/slides_20110517.pdf · Serve High Income...

Invest Malaysia New YorkDato’ Tajuddin Atan, CEO
17 – 18 May 2011
BURSA MALAYSIA BERHADDestination of choice for listings and investments in the region

Part I
Transforming Malaysia:
Drive for Private Sector Growth

3
Malaysian Market Liberalisation
Country
Recognition
& Competitiveness
Free Capital Mobility
& Improved Access to
Capital Market
New Economic Model - high value & high income
Increasing private sector role in driving business
Creating a conducive environment for entrepreneurship
Focus on developing Human Capital & Innovation
4th for Investor Protection
(World Bank)
10th for Resilience in crisis
(Sevcorp Int’l Business Confidence
Survey)
25th amongst 134 countries for
Corporate Governance Framework
(World Economic Forum)
10th on World Competitiveness
Scoreboard 2010
(IMD World Competitiveness Yearbook)
Access for Foreign Participation No restrictions on international
investments in Malaysia.
Free to repatriate capital, profits and
income.
Liberalised entry and ownership for
foreign players in the capital market.
Foreign Listings
3

4
Liberalising Access for Foreign Participation
Foreign shareholding for stockbroking firms, Islamic banks investment banks & insurance companies raised to 70%
New licenses for foreign brokers
30% bumi equity in 27 services subsectors dropped
Global players present in all segments of the Malaysian Capital Market
30% bumi equity for new IPOs liberalised
More foreign IPOs in the pipeline
Investors
Issuers
Participants
4

Sound Macro Environment
• Projected 5% - 6% for 2011F(Source: BNM)
GDP Growth
• > 90% of assets are RM denominated
• Non-performing loan at 2.3% @ end Feb 2011
(Source: BNM)
Strong Banking Sector & Ample
Liquidity
• Overnight policy rate: 3.0%Conducive Domestic Interest
Rates
• Modest 2.5% - 3.5% for 2011F(Source: BNM)
Manageable Inflation
• 2011F at RM 114.2 billion(Source: MOF)
Strong Current Account in the
Region
• > USD130 billion @ 29 April 2011(Source: BNM)
Healthy International Reserves
5

9. Create regional
champions
10. Global Islamic
Finance Hub
6
Changing Financial Services Landscapeunder the Economic Transformation Program (ETP)
1. Revitalise equity
markets
2. Deepen and
broaden bond
markets
3. Transforms DFIs
4. Create integrated
payment eco-
systems
Strengthen the
Core
Go on the
Offensive
5. Insure our
population
6. Develop private
pension industry
7. Spur growth of
wealth
management
8. Accelerate asset
management
Four Strategic Thrusts & Ten EPPs Identified to Grow Incremental Gross
National Income by RM28.8 billion by 2020
Note: Bursa Malaysia to co-lead item 1 and action/play a part in item 2/4/10 Entry Point Projects
alongside MoF, BNM, SC and other key organisations/ agencies/ companies.
Serve High Income
Population
Seed New
Growth
6

7
Bursa Malaysia’s Report Card Case for Change under the Economic Transformation Program (ETP)
Case for Change: Low liquidity as well as scale and growth
Aspirations: Vibrant Capital Markets that attracts quality listings
and investors
Revitalise the Equity Markets
1. Building Quality:
• Launched the Sustainability Programme
2. Enhancing Efficiency:
• Internet trading for futures products
3. Improving Liquidity:
• New CBBCs/ETFs/REITs issued
• Derivatives product migration to CME
Globex
4. Internationalising our Market:
• CME strategic partnership. CME’s KL Hub
is now a gateway for trading derivatives
products,
• Upgraded FTSE Advanced Emerging
Market Status
Status : Completed
1. Building Quality
• Enhancing standard of CG and
• Market engagement and education
2. Enhancing Efficiency
• Issuing of dual licenses
3. Improving Liquidity
• Increasing Proprietary Day Traders in the
market
4. Internationalising our Market
• Increased visibility through ASEAN
Exchanges
• Expanding reach and profile of Islamic
market
Status : Ongoing
7
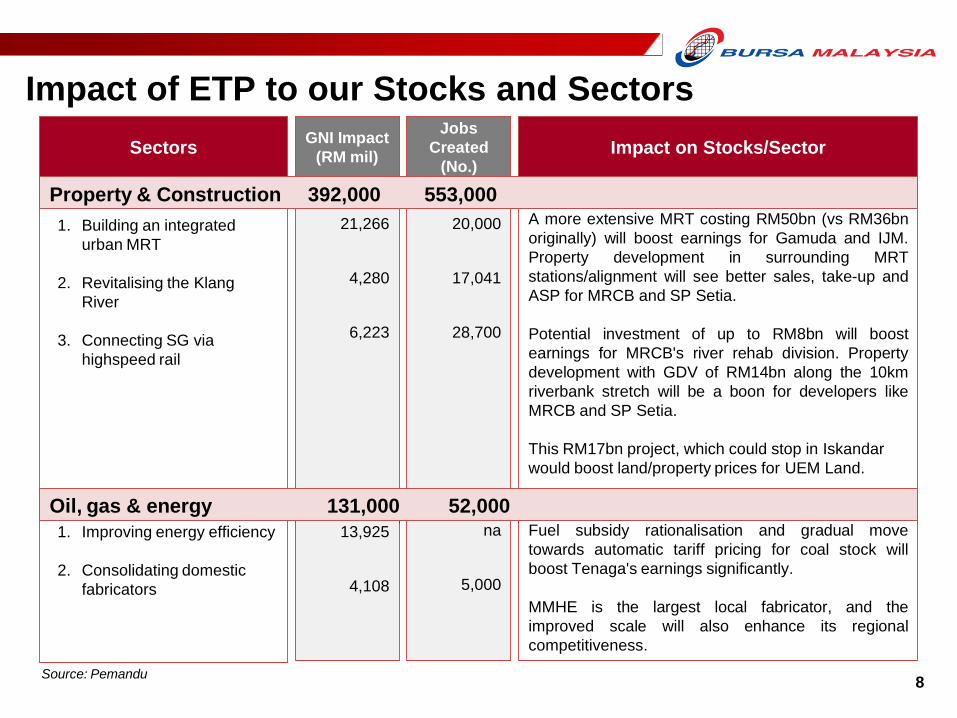
na
5,000
8
A more extensive MRT costing RM50bn (vs RM36bn
originally) will boost earnings for Gamuda and IJM.
Property development in surrounding MRT
stations/alignment will see better sales, take-up and
ASP for MRCB and SP Setia.
Potential investment of up to RM8bn will boost
earnings for MRCB's river rehab division. Property
development with GDV of RM14bn along the 10km
riverbank stretch will be a boon for developers like
MRCB and SP Setia.
This RM17bn project, which could stop in Iskandar
would boost land/property prices for UEM Land.
21,266
4,280
6,223
GNI Impact
(RM mil)
Jobs
Created
(No.)Impact on Stocks/SectorSectors
20,000
17,041
28,700
Fuel subsidy rationalisation and gradual move
towards automatic tariff pricing for coal stock will
boost Tenaga's earnings significantly.
MMHE is the largest local fabricator, and the
improved scale will also enhance its regional
competitiveness.
Source: Pemandu
Impact of ETP to our Stocks and Sectors
13,925
4,108
Oil, gas & energy 131,000 52,000
1. Building an integrated
urban MRT
2. Revitalising the Klang
River
3. Connecting SG via
highspeed rail
1. Improving energy efficiency
2. Consolidating domestic
fabricators
Property & Construction 392,000 553,000

Impact of ETP to our Stocks and Sectors (contd.)
GNI Impact
(RM mil)
Jobs
Created
(No.)Impact on Stocks/SectorSectors
Source: Pemandu 9
1. Broadband for all
2. Extending broadband reach
3. Extending regional telco
1,600
10,000
5,858
10,172
13,711
5,813
Enhances growth for TM, Maxis, Digi and Axiata
as players move towards quad play.
Increased market cap and trading velocity will
improve earnings for Bursa and stockbrokers.
Higher overseas contributions from Malaysian
banks. E.g CIMB, Maybank and RHB.
Stronger contributions for Banks with Islamic
arms.
1. A duty free shopping
destination
2. Improves rates, mix and
quality of hotels
3. Enhance connectivity to
medium-haul markets
This will improve productivity and revenue for
Sime, IOI, KLK and Genting Plant.1. Improving FFB yields
2. Increasing oil extraction
dates
3. Developing oleo derivatives
Palm Oil 125,000 42,000
Improves yield and load factor for Air Asia, as
well as hotel occupancy and yields for Genting
group.
Financial Services 121,000 275,000
1. Revitalising capital market
2. Developing regional
champions
3. Global hub for Islamic
Finance
3,325
5,564
7,242
8,598
(8,524)
11,644
7,838
5,528
3,310
3,325
5,564
7,242
Tourism 67,000 497,000
Comms, Content & Infra 36,000 43,000
7,155
3,135
1,220
2,160
2,688
2,289

Capital Market
StakeholdersDRIVERS
MOF, PEMANDU, BNM, SC, Bursa Malaysia
Our Assets PEOPLE MARKET FRAMEWORK LOCATION
Our Strengths
1) Stable Political
Environment
2) Multicultural:
Historical ties with
China,India, Indonesia and
the Developed World
3) New Corporate
Champions:
Highly educated business
leaders
4) Good Infrastructure & No
Barriers:
Open access & Business
friendly
5) Healthy Credit Market:
Globally respected agencies
in place
6) Expanding capital market:
QDII, US SEC Recognition &
FTSE Advance Emerging
Economy Status
7) Young Demographics:
Malaysia is situated at the
heart of ASEAN’s 590
million people. With a
population of 28 mil,
Malaysia’s labor force
stands high at 64%. Only
5% of population is above
age 65.
8) Abundant Resources:
Commodity Rich, Ample
Land
Our StoryThe Exchange is a conduit to ASEAN as many Malaysian companies
have regional growth and footprint.
Regional Champions
Strength of Our Market
Crossing Borders
10
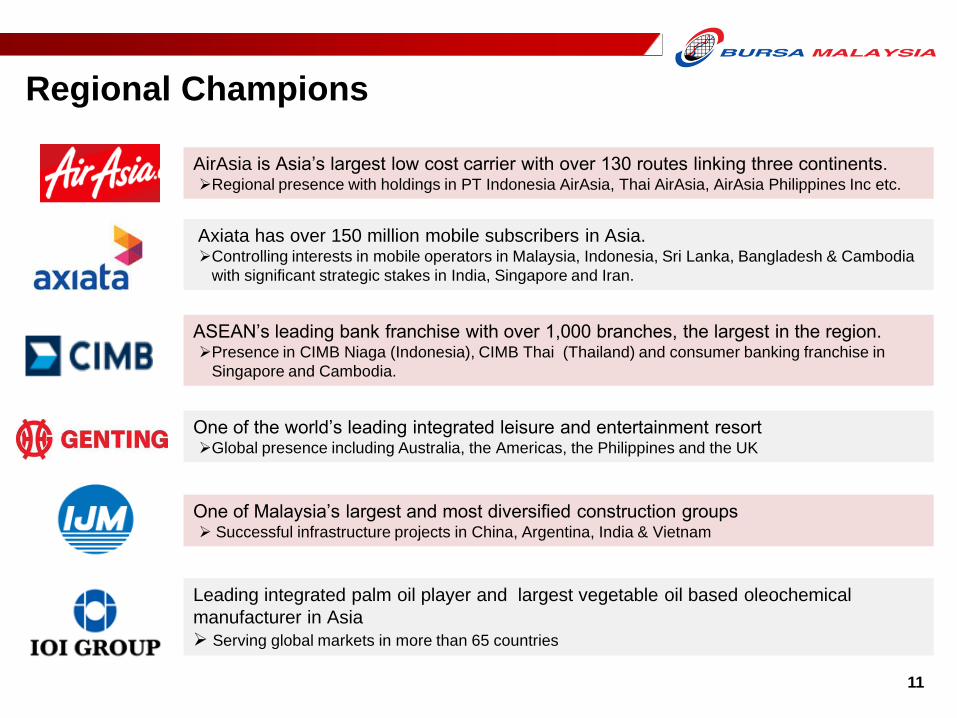
Regional Champions
ASEAN’s leading bank franchise with over 1,000 branches, the largest in the region.Presence in CIMB Niaga (Indonesia), CIMB Thai (Thailand) and consumer banking franchise in
Singapore and Cambodia.
AirAsia is Asia’s largest low cost carrier with over 130 routes linking three continents. Regional presence with holdings in PT Indonesia AirAsia, Thai AirAsia, AirAsia Philippines Inc etc.
One of Malaysia’s largest and most diversified construction groups Successful infrastructure projects in China, Argentina, India & Vietnam
Axiata has over 150 million mobile subscribers in Asia.Controlling interests in mobile operators in Malaysia, Indonesia, Sri Lanka, Bangladesh & Cambodia
with significant strategic stakes in India, Singapore and Iran.
One of the world’s leading integrated leisure and entertainment resortGlobal presence including Australia, the Americas, the Philippines and the UK
Leading integrated palm oil player and largest vegetable oil based oleochemical
manufacturer in Asia
Serving global markets in more than 65 countries
11

Regional Champions
Some of our companies are global leaders in their respective fields and others are making mark
around the region. They grow by leveraging on the country’s assets and pro-business policies.
These companies now spearhead Malaysia’s emergence as a dynamic advancing economy.
The world's largest rubber glove manufacturer Top Glove exports to more than 900 customers in over 180 countries through its sales and marketing
offices in Malaysia, the United States and Germany.
The Public Bank Group's regional network has been expanded to 109 branches in
countries outside of Malaysia. Banking operations presence in Hong Kong and China, Cambodia, Vietnam, Laos and Sri Lanka.
The leading integrated petrochemicals producer in Malaysia and one of the largest in
Southeast Asia.Production capacity in eastern Peninsular Malaysia as well as manufacturing complexes in Gurun,
Bintulu, Labuan and Vung Tau, Vietnam.
The world largest palm oil producer, and diversified multinational involved in property,
motors, industrial equipment and energy & utilities, with healthcare as a growing
business.
Workforce of over 100,000 employees in over 20 countries.
One of Malaysia’s leading banking group with a growing presence in South East Asia The Group has expanded internationally, with over 1,750 branches and offices in 14 countries and
serving over 18 million customers.
12

Ride Wave of Market Reform
Malaysia houses some of the biggest regional
players in ASEAN. With conducive macro
environment and the Economic Transformation in
full motion, more companies are positioned to take
giant leaps towards Malaysia’s 2020 high-income
economy aspiration.
Invest in Our Growth Story
GROWTH
13

Part II
Bursa Malaysia:
Conduit to Malaysian Growth

15
Diversified OfferingsStrong Niche In Islamic and Commodities
10 Derivatives Products:
Commodity futures
Equity futures
Equity options
Financial futures
Sukuk
Shari’ah compliant
equities
i-REITS
i-ETFs
Bursa Suq Al-Sila’
TRADING CLEARING SETTLEMENT DEPOSITORY
2 Markets:
Main Market : 840 cos
ACE Market : 116 cos
Market Cap @ 30 Apr 11 :
RM1,310 bil (USD442 bil)
Products : Shares, REITs,
Warrants, ETFs, CBBCs,
Loans & Bonds
Focus :
Drive Liquidity &
Vibrancy
Focus :
Leverage On Existing
Strategic Partnership
Focus :
Attract International
Investors & Issuers
SECURITIES DERIVATIVES ISLAMIC OFFERINGS OTHERS
Bond Market
Electronic trading
platform for :
Government Bonds
Corporate Bonds
Non-ringgit securities
Sukuk Listing
Offshore Market
LISTING
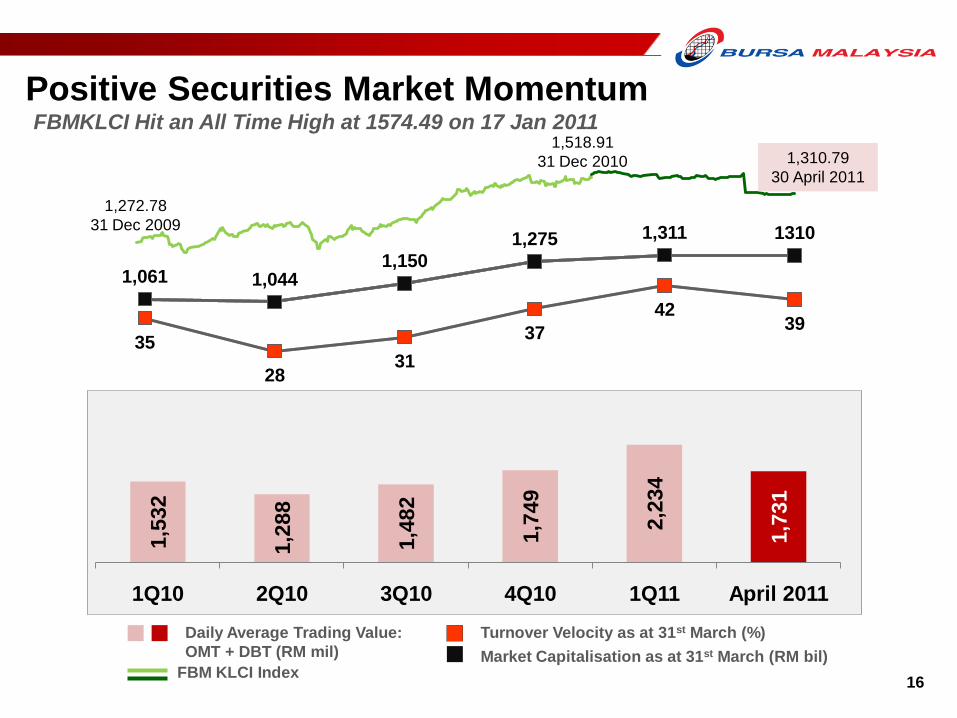
1,061 1,0441,150
1,275 1,311 1310
35
2831
37
4239
1,518.91
31 Dec 2010 1,310.79
30 April 2011
Positive Securities Market MomentumFBMKLCI Hit an All Time High at 1574.49 on 17 Jan 2011
1,5
32
1,2
88
1,4
82
1,7
49
2,2
34
1,7
31
1Q10 2Q10 3Q10 4Q10 1Q11 April 2011
Daily Average Trading Value:
OMT + DBT (RM mil)
Turnover Velocity as at 31st March (%)
Market Capitalisation as at 31st March (RM bil)FBM KLCI Index
1,272.78
31 Dec 2009
16
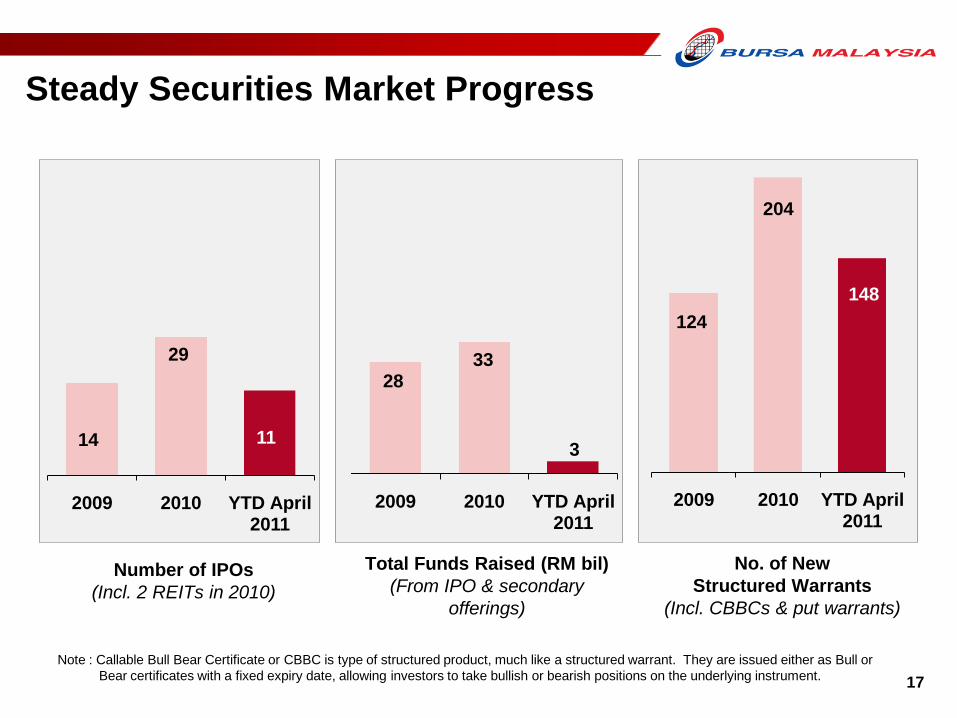
14
29
11
2009 2010 YTD April 2011
2833
3
2009 2010 YTD April 2011
124
204
148
2009 2010 YTD April 2011
Steady Securities Market Progress
No. of New
Structured Warrants
(Incl. CBBCs & put warrants)
Number of IPOs
(Incl. 2 REITs in 2010)
Total Funds Raised (RM bil)
(From IPO & secondary
offerings)
Note : Callable Bull Bear Certificate or CBBC is type of structured product, much like a structured warrant. They are issued either as Bull or
Bear certificates with a fixed expiry date, allowing investors to take bullish or bearish positions on the underlying instrument. 17

Increasing Interest in the Derivatives MarketFCPO open interest hits all-time high at 112,921 contracts on May 9
23,8
89
22,5
17
25,1
11
24,2
55
36,7
85
31,9
00
1Q10 2Q10 3Q10 4Q10 1Q11 April 2011
128,988
114,820 113,565
132,151 136,202
151,812
Daily Average Contracts 1Q11 1Q10 Δ% 4Q10 Δ%
FCPO 25,606 15,794 62 17,030 50
FKLI 10,274 7,316 40 7,065 45
Daily Average Contracts (Units) Open Positions
18

19
Strengthen
Equity Market
Expand
Derivatives
Market
Widen &
Internationalise
Islamic Market
TO REMAIN COMPETITIVE IN THE REGION
Key Focus for 2011
• Increasing PDTs
• Collaboration of
ASEAN Exchanges
• More BSAS
Participants
• Dual licensing
• New Derivatives
Clearing System
Other initiatives will be updated as we progress throughout the year
19

37
5 55
3
44
4
46
5
48
2 64
0
72
2
69
5 84
9 11
06
87
0
82
4 11
01 12
94
37
983
266
138
20
Securities Market Highlights
FBMKLCI Index & No. of PLCs
Finance
Consumer Products
Industrial Products
Infrastructure Project Cos.
Trading/Services
Diverse Sectors & Products
ETFs
REITs
Loans
Main Market
Call Warrants
ACE Market
14
As at 30 April 2011
5
13 New Listings YTD 15 May 2011
Average Market Capitalisation
Total Listed Companies
FMBKLCI Index
Construction
Plantation571.96
(1 Jan 1998)
1,310.79
(30 Apr 2011)
42%
28%
10%
7%
5%5%
3%
20
736 758798 816
865906
96310211027
987 977 960 957 956

21
Derivatives Market Highlights
25% Equity Stake in
Bursa Malaysia
Derivatives (BMD)
Licensing of FCPO
Prices to CME
Technology
Partnership
BMD will partner
CME in ASEAN in
market and
technology
development
Joint product
development and
marketing
Human capital
development
Strengthen
Malaysia’s position
as the global price
benchmark for CPO
Ensure price
discovery for palm
oil remains in
Malaysia
Global distribution of
Malaysian derivatives
products via Globex
TPs connected directly
to CME Globex® and
are able to trade CME
products*
TPs can now market
Malaysian derivatives
products in the US
Completed acquisition
and group
restructuring of BMD
CME USD Palm Oil
Contract launched 24
May 2010
Migrations of BMD’s products
to CME Globex® trading
platform in September 2010
* Subject to them having a clearing relationship with a CME Clearing Futures Commission Merchant (FCM)
21
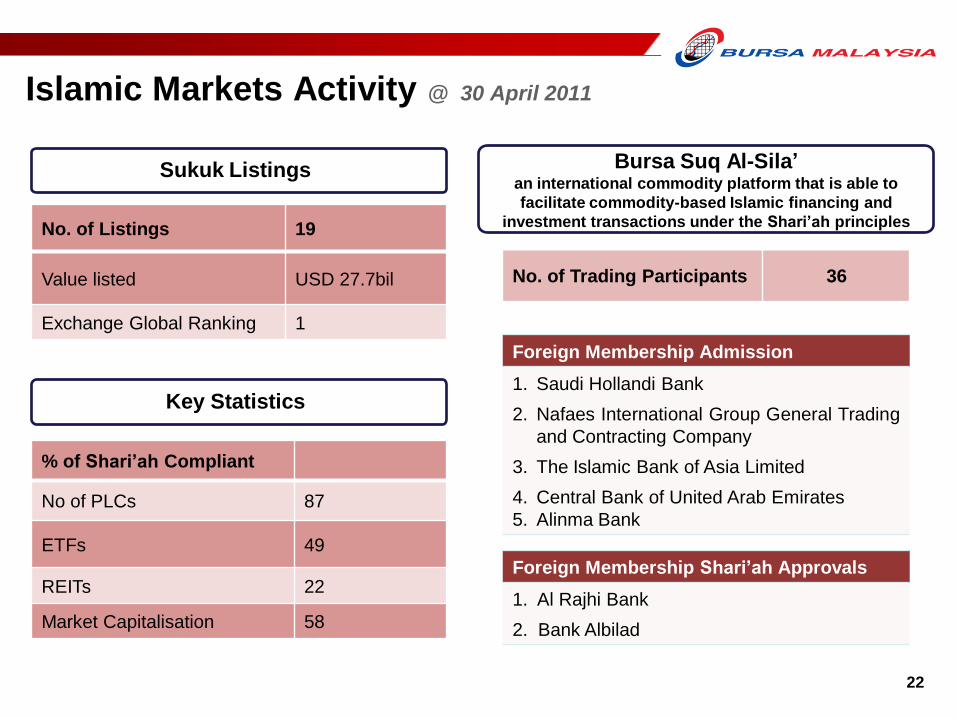
22
Bursa Suq Al-Sila’an international commodity platform that is able to
facilitate commodity-based Islamic financing and
investment transactions under the Shari’ah principles No. of Listings 19
Value listed USD 27.7bil
Exchange Global Ranking 1
Sukuk Listings
Foreign Membership Admission
1. Saudi Hollandi Bank
2. Nafaes International Group General Trading
and Contracting Company
3. The Islamic Bank of Asia Limited
4. Central Bank of United Arab Emirates
5. Alinma Bank
Foreign Membership Shari’ah Approvals
1. Al Rajhi Bank
2. Bank Albilad
% of Shari’ah Compliant
No of PLCs 87
ETFs 49
REITs 22
Market Capitalisation 58
Key Statistics
No. of Trading Participants 36
Islamic Markets Activity @ 30 April 2011
22

Solid
Foundation
People, Sound Regulatory Framework, Technologies
Strong Stakeholders’ Support
Five
Strategic
ThrustsRevitalising
the market
Improving the
Ecosystems
Development
of world class
workforce.
Improvement of
efficiency &
productivity
Inter-
nationalising
the Market
A preferred Partner in Asia for Fund Raising,
Trading and Investment
Vision
1 2 3 4 5
23
Setting Priorities and Areas for Growth

Global Recognition
Migration of Malaysian derivatives products to CME Globex®
QDII – Malaysia Investment destination for China investors
CBRC
Recognition
FTSE
Upgrade
CFTC
Approval
U.S. SEC
Approval
“Designated Offshore Securities
Market” recognition to ease
trading in Malaysian listed
securities & shelf listed bonds
by U.S. investors
CME
Partnership
Malaysia promoted to
Advanced Emerging Market
status in FTSE Global Equity
Index Series
24
Approval from US Commodity
Futures Trading Commission
(CFTC) to enable Malaysian
Futures brokers to deal with US
customers

25
Positive Prospect & Outlook
Barring any adverse developments, we expect improved level of activity in our markets
and financial results for the financial year ending 31 December 2011.
Potential Market
Catalysts
Acceleration in the implementation of various economic transformation
programmes.
Greater M&A activities & government transformation programmes.
Prospects for further divestments by government-linked companies.
Bursa remains committed in ensuring markets continues to be sustainable and vibrant
despite increasing volatility from external factors.
Malaysia’s strong economic fundamentals.
Liberalisation efforts by the government.
Sustained domestic corporate earnings growth attracting portfolio inflows.
Strong and Solid
System
Progressive
Developmental
Efforts
We continue to invest in the development of the capital market and the
regulatory environment.
And at the same time, putting a close watch on our expenditure.
25

Financial Review
Improved Financial Performance 27
Increased Revenue 28
Higher Operating Expenses 29
Sustainable Performance Ratios 30
Dividend Payout 31
Strong Reserves 32
26

Improved Financial Performance
Operating Revenue
(RM mil)
Other Income
(RM mil)
81.2 1
07.8
1Q10 1Q11
6.9 8.3
1Q10 1Q11
48.4 5
7.8
1Q10 1Q11
29.0
41.9
1Q10 1Q11
5.3
7.6
1Q10 1Q11
Operating Expenses
(RM mil)
PAT
(RM mil)
Earnings Per Share
(sen)
33%
20%
19%
44%
43%
27
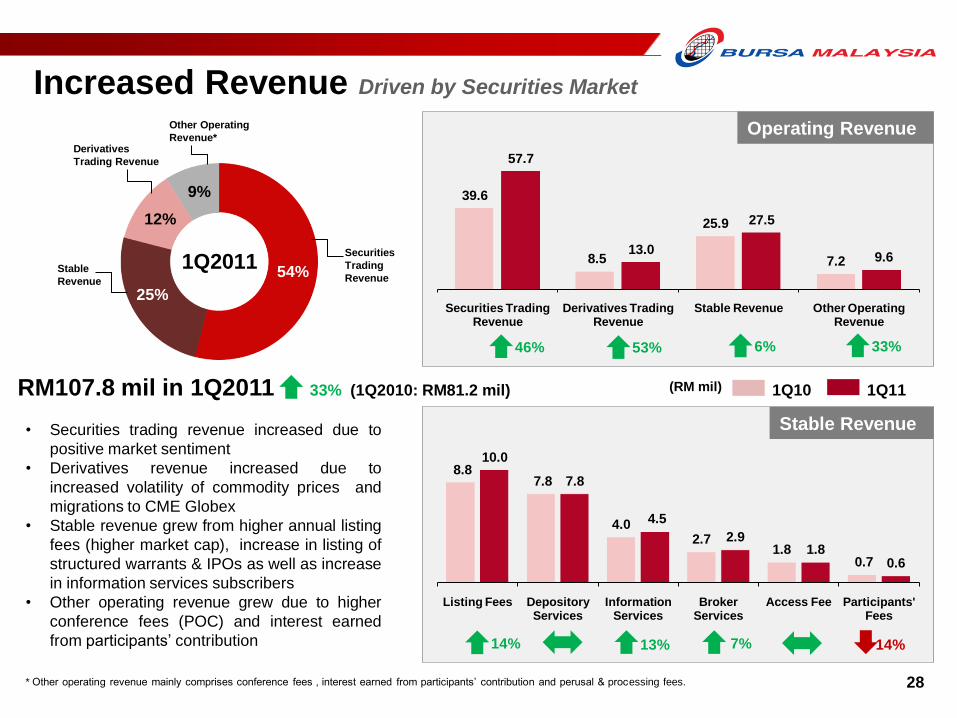
1Q10
54%
25%
12%
9% 39.6
8.5
25.9
7.2
57.7
13.0
27.5
9.6
Securities Trading Revenue
Derivatives Trading Revenue
Stable Revenue Other Operating Revenue
8.8 7.8
4.02.7
1.80.7
10.0
7.8
4.5
2.91.8
0.6
Listing Fees Depository Services
Information Services
Broker Services
Access Fee Participants' Fees
Operating Revenue
Increased Revenue Driven by Securities Market
28* Other operating revenue mainly comprises conference fees , interest earned from participants’ contribution and perusal & processing fees.
1Q2011
46% 6% 33%53%
RM107.8 mil in 1Q2011 33% (1Q2010: RM81.2 mil)
• Securities trading revenue increased due to
positive market sentiment
• Derivatives revenue increased due to
increased volatility of commodity prices and
migrations to CME Globex
• Stable revenue grew from higher annual listing
fees (higher market cap), increase in listing of
structured warrants & IPOs as well as increase
in information services subscribers
• Other operating revenue grew due to higher
conference fees (POC) and interest earned
from participants’ contribution
Stable Revenue
(RM mil) 1Q11
14% 7%13%
Other Operating
Revenue*
Securities
Trading
RevenueStable
Revenue
Derivatives
Trading Revenue
14%
28

`
45%
17%
9%
12%
4%
2%11%
29
21.5
11.1
4.83.6
2.50.5
4.4
25.9
9.9
5.46.8
2.61.0
6.2
• Other OPEX comprises administrative expenses, CDS consumables & other miscellaneous expenses..
1Q2011
Staff Cost
Depreciation & Amortisation
(D & A)
Market Development
Technology Charges
Building Management Costs
Professional Fees
Other OPEX
Higher Operating Expenses Talent Investment for Future Growth
(RM mil) 1Q10 1Q11
RM57.8 mil in 1Q2011 19% (1Q2010: RM48.4 mil)
Staff Cost D&A Market
DevelopmentTechnology
Charges
Building
Management
Costs
Professional
Fees
Other OPEX
20% 11% 12% 40%89% 3% 100%
• Higher staff costs due to increased headcount as well as talent attraction &
development.
• Higher technology charges due to Globex service fee charged by CME (RM3 mil) for
the use of Globex electronic trading platform which commenced in September 2010.
• Operating expenses increase was further attributable to a write off of computer
software, the postage hike in July 2010 which raised the cost of CDS consumables,
higher market development expenses and higher consultancy fees.
29

`
33.0
54.0
13.1
36.1
55.6
18.6
Net Profit Margin Operating EBITDA Margin
Return on Equity
30
Sustainable Performance Ratios
(%)
9%
1Q10 1Q11
42%3%
30
31 31
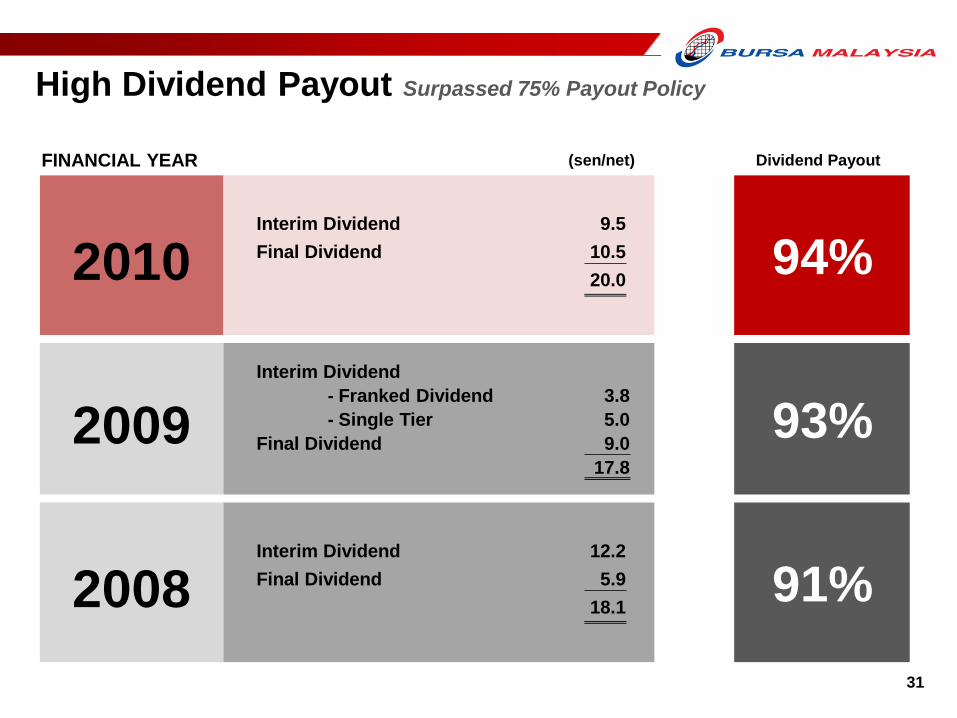
High Dividend Payout Surpassed 75% Payout Policy
(sen/net) Dividend Payout
2010 94%
FINANCIAL YEAR
2009
Interim Dividend 9.5
Final Dividend 10.5
20.0
Interim Dividend
- Franked Dividend 3.8
- Single Tier 5.0
Final Dividend 9.0
17.8
2008 91%Interim Dividend 12.2
Final Dividend 5.9
18.1
93%

`
870
886
1Q10 1Q11
(RM mil)
504
594
1Q10 1Q11
32
Strong Reserves
Shareholders’ Fund
Financial Resources
Available for Use
(RM mil)
2%
18%
`
`
The Company has sufficient financial resources to cover its Clearing
Guarantee Fund commitment, CAPEX and working capital requirements. 32

Additional Information
Board of Directors & Shareholdings Structure 34
Securities Market Trading Activity 35
Securities Market Trading Participation 36
Securities Market Foreign Ownership 37
Peer Comparison for 1Q 2011 38
Bursa’s Potential To Grow Its Velocity 39
Derivatives Market Activity 40
Derivatives Market Demography 41
Sound Macro Environment 40
34
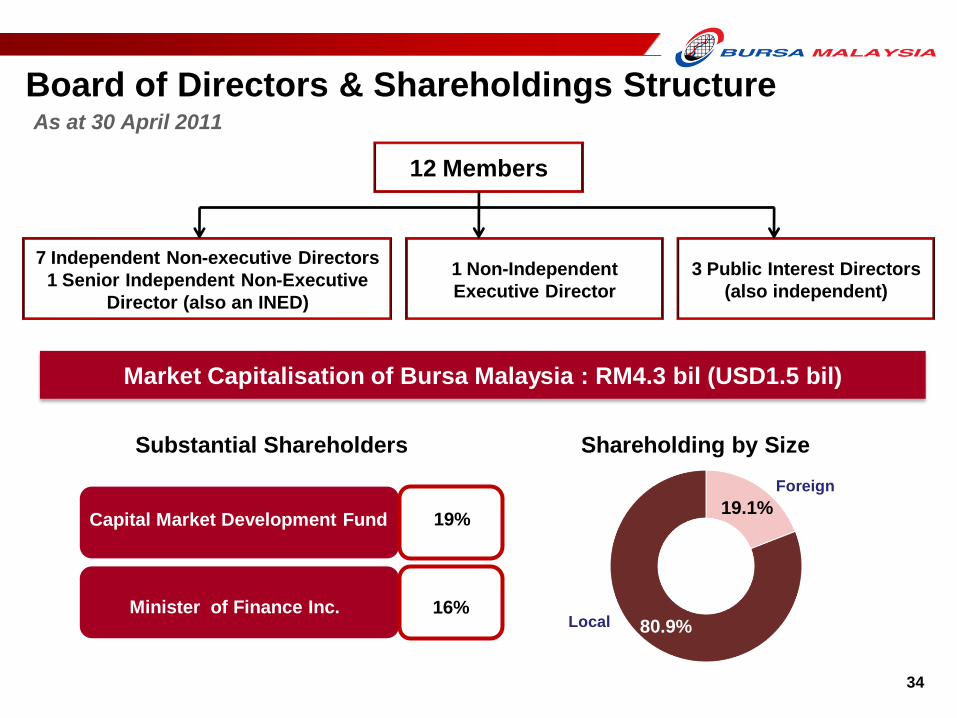
Board of Directors & Shareholdings StructureAs at 30 April 2011
12 Members
7 Independent Non-executive Directors
1 Senior Independent Non-Executive
Director (also an INED)
1 Non-Independent
Executive Director
3 Public Interest Directors
(also independent)
19.1%
80.9%
Foreign
Local
Substantial Shareholders Shareholding by Size
Minister of Finance Inc.
Capital Market Development Fund
16%
19%
Market Capitalisation of Bursa Malaysia : RM4.3 bil (USD1.5 bil)
34

1,924
497
805 911
350 472
748 874
718
1,019
2,179
1,181 1,129 1,403
2,032
-
400
800
1,200
1,600
2,000
2,400
1997 1998 1999 2000 2001 2002 2003 2004 2005 2006 2007 2008 2009 2010 YTD Apr
2011
RM mil
Annual DATV & Velocity57%
31%40% 39%
20%23%
34% 32%
25%
34%
53%
34% 34% 33%39%
68%
54%50%
41%46%
31%25%
32%
23%
48%
36%
28%
35%
28%31%
37%42%
2,610 2,303
2,069 1,751
1,907
1,187
823 854 615
1,490 1,266
1,099 1,435 1,209
1,387
1,566
2,161
-
400
800
1,200
1,600
2,000
2,400
2,800
1Q07 2Q07 3Q07 4Q07 1Q08 2Q08 3Q08 4Q08 1Q09 2Q09 3Q09 4Q09 1Q10 2Q10 3Q10 4Q10 1Q11
RM mil
Securities Market Trading Activity
Quarterly DATV & Velocity
Daily Average Trading Value (RM mil) Turnover Velocity
Daily Average Trading Value (RM mil) Turnover Velocity
35

346
806
283 373 378
569
34 37
24
3326 28
66 63 76 67 74 72
2006 2007 2008 2009 2010 YTD April 2011
Securities Market Trading Participation
From 2006 to 2009, the statistics were based on Brokers’ submission. From 2010 onwards statistics were based on Bursa’s internal system.
65 6358
73 7377
35 37 42 27 27 23
2006 2007 2008 2009 2010 YTD April 2011
Retail
(%)
Institutions
(%)Local
(%)
Foreign
(%)
Retail DATV
(RM mil)Foreign DATV
(RM mil)
357
806
496
305393
467
Retail vs Institutions Foreign vs Local
36

37
Securities Market Foreign Ownership
7.8%
1.9%
0.9%
0.4%
0.1%
13.2%
Singapore
Hong Kong
UK
USA
Mid-East
Others
25.8%
74.2%
Foreign Ownership by Nationality
Foreign Nominees
Based on Market Capitalisation
(as at month end)
26.5
25.7
24.1
21.7
20.9
20.7
20.7
20.9
20.4
20.4
20.6
20.8
21.8
21.9
22.0
21
.4
Mar
2011
%
1.6%China / Taiwan
37

-8%
-6%
-4%
-2%
0%
2%
4%
6%
8%
10%
Colo
mbo S
E
Shanghai S
E
Kore
a E
xchange
Thaila
nd S
E
Hong K
ong
Austr
alia
n S
E
Shenzhen S
E
Indonesia
SE
Phili
ppin
e S
E
Sin
gapore
…
Osaka S
E
Tokyo S
E G
roup
Taiw
an S
E C
orp
.
National S
tock …
Bom
bay S
E
-6
-4
-2
0
2
4
Shanghai S
E
Kore
a
Austr
alia
Thaila
nd
Hong K
ong
Shenzhen S
E
Indonesia
Osaka
Taiw
an
Colo
mbo
Sin
gapore
National S
E I
ndia
Bom
bay S
E
Tokyo S
E
Peer Comparison for 1Q 2011
Funds Raised
Asian Benchmark Index Growth % Asian Market Capitalisation Growth %
Source: World Federation Exchanges (WFE)
Mala
ysia
2%
Mala
ysia
2%
USD909 mil
Mala
ysia
0
5
10
15
20
25
30
Shenzhen S
E
Shanghai S
E
Hong K
ong …
Tokyo S
E G
roup
Sin
gapore
…
Austr
alia
n S
E
National S
tock …
Indonesia
SE
Thaila
nd S
E
Kore
a E
xchange
Taiw
an S
E C
orp
.
Colo
mbo S
E
Phili
ppin
e S
E
Bom
bay S
E
Osaka S
E
Billion
38

London SE
39
Hong Kong Exchanges
262%
182%
127%
126%
115%
106%
87%
75%
71%
58%
55%
50%
47%
38%
31%
16%
Source: World Federation Exchanges (WFE)
YTD April 2011
Philippine SE
Bursa Malaysia
Indonesia SE
Singapore SE
The Stock Exchange of Thailand
National Stock Exchange India
Taiwan SE Corp.
Tokyo SE
NYSE Euronext (Europe)
Australian SE
Shanghai SE
Korea Exchange
NYSE Euronext (US)
Shenzhen SE
Bursa’s Potential To Grow Its Velocity
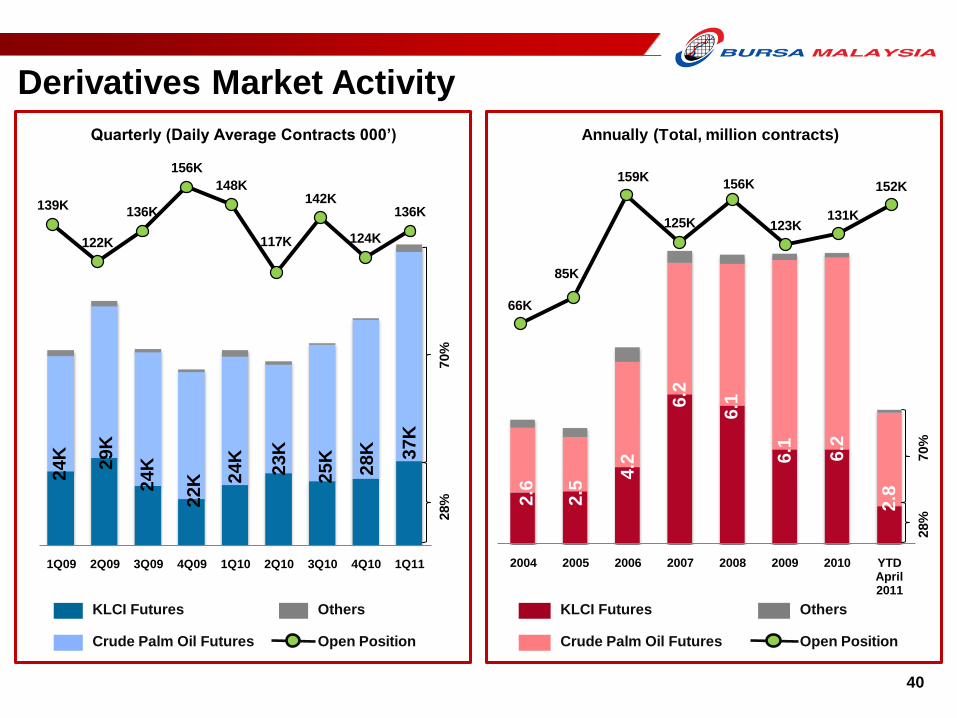
139K
122K
136K
156K
148K
117K
142K
124K
136K
1Q09 2Q09 3Q09 4Q09 1Q10 2Q10 3Q10 4Q10 1Q11 2004 2005 2006 2007 2008 2009 2010 YTD April 2011
66K
85K
159K
125K
156K
123K131K
152K
40
Derivatives Market Activity
2.6
2.5
4.2
6.1
6.1 6.2
Annually (Total, million contracts)
KLCI Futures
Crude Palm Oil Futures Open Position
Others
28%
24K
29K
24K
70%
Quarterly (Daily Average Contracts 000’)
KLCI Futures
Crude Palm Oil Futures Open Position
Others
22K
2.8
24K
28%
70%
25K
23K
28K 37K
6.2
40
Derivatives Market Demography
* Local - A local participant is an individual who has been admitted as a participant in accordance with The Rules, registered with SC and
has the right to trade for himself - all futures contracts listed on the Derivatives Exchange.
31 19 14 16 16 13 15 15 15 21 20
45
4845 43 40
40 41 46 45
44 41
3
6
53 3
2 22 2
22
14
23
3137
4045
4237 38
3337
2001 2002 2003 2004 2005 2006 2007 2008 2009 2010 YTD April 2011
%
FKLI
Locals
Domestic Retail
Domestic Institutions
Foreign Institutions
40 38 35 33 35 31 25 27 33 34 32
15 2126
24 2327
34 38
24 26 24
27
21 1820 22 25 22
14
2715
16
14 1417
2018
16 18 2016
2528
2001 2002 2003 2004 2005 2006 2007 2008 2009 2010 YTD April 2011
%
FCPO
Locals
Domestic Retail
Domestic Institutions
Foreign Institutions
41

KOAY LEAN LEE
603-2034 7306
Disclaimer :
Bursa Malaysia and its Group of Companies (the Company) reserve all proprietary rights to the contents of this Presentation.
Whilst the Company endeavours to ensure that the contents in the presentation booklet are accurate, complete or have been obtained from sources believed
by the Company to be accurate and reliable, neither the Company nor the Presenter make any warranty, express or implied, nor assume any legal liability or
responsibility for the accuracy, completeness or currency of the contents of this Presentation.
In no event shall the Company be liable for any claim, howsoever arising, out of or in relation to this presentation booklet to the recipient of this presentation
booklet and/or to any other third party.
© Bursa Malaysia 2011
INTAN DIYANA TAJUDIN
603-2034 7049
INVESTOR RELATIONS CONTACT INFORMATION
E-mail : [email protected]
Fax : 603-2026 3684
MUHAMMAD ALI
603-2034 7673


![Setia Insight Nov07-Part1[1]](https://static.fdocuments.in/doc/165x107/577d26f61a28ab4e1ea2ab8e/setia-insight-nov07-part11.jpg)