BURIED ALIVE IN THE CORONAL GRAVEYARD - JILA …jilajlinsky/57417.web.pdf · BURIED ALIVE IN THE...
16
BURIED ALIVE IN THE CORONAL GRAVEYARD Thomas R. Ayres, Alexander Brown, and Graham M. Harper Center for Astrophysics and Space Astronomy, 389 UCB, University of Colorado, Boulder, CO 80309-0389; [email protected], [email protected], [email protected] Received 2002 December 19; accepted 2003 July 22 ABSTRACT We have used the High Resolution Camera (HRC-I) of the Chandra X-Ray Observatory to search for coronal (T 10 6 K) emission from the archetype ‘‘ noncoronal ’’ red giants Arcturus ( Bootis=HD 124897, K1 III) and Aldebaran ( Tauri=HD 29139, K5 III). Our program follows up previous detections of ultra- violet coronal proxies such as C iv !1548 (T 1 10 5 K) and O vi !1031 (T 3 10 5 K). The deep (19 ks) HRC-I pointings obtained a tentative 3 ' detection of Arcturus, with f X ð0:2 2 keVÞ¼ 1:0 þ1:8 0:8 10 15 ergs cm 2 s 1 (95% confidence limits [CLs]), but failed to record Aldebaran, with an upper limit of d1:5 10 15 ergs cm 2 s 1 (also at 95% CL). The corresponding L X =L bol ratios are a factor of ten thousand less than the Sun, a low-activity coronal dwarf. At the same time, Hubble Space Telescope Imaging Spectrograph far-ultraviolet spectra suggest the presence of a ‘‘ cool absorber,’’ probably near the base of the red giant chromosphere, imprinting discrete low-excitation absorptions on top of highly ionized features such as Si iv !1393. The hot emission zones thus are at least partially buried under a large column of chromo- spheric material, which would severely attenuate any soft X-rays that might be emitted. The submerged hot structures presumably are magnetic because of their high temperatures and broad C iv profiles (FWHM 130 km s 1 ). Perhaps these structures are analogous to small-scale ephemeral bipolar regions seen ubiquitously on the Sun throughout the sunspot cycle and thought to be of direct convective origin. If small-scale magnetic fields indeed are present in the lower atmospheres of red giants such as Arcturus and Aldebaran, they might play a role in initiating the cool winds of such stars, perhaps through a mechanism similar to solar spicules. Subject headings: stars: coronae — stars: individual (Aldebaran, Arcturus) — ultraviolet: stars — X-rays: stars 1. INTRODUCTION Low-mass stars begin their lives as fast-spinning dwarfs that emit copious coronal (T 10 6 K) X-rays because of intense rotation-catalyzed dynamo-driven magnetic activity (see, e.g., Tuominen, Moss, & Ru ¨ diger 1991; Parker 1970). Such stars end their lives as bloated red giants that rotate slowly if at all (Gray & Pallavicini 1989), thanks to persis- tent angular momentum loss by the magnetized coronal wind during the long main-sequence phase. These old spun-down stars are expected to display only feeble mag- netic activity at best. Indeed, single red giants across the ‘‘ Linsky-Haisch dividing line ’’ near K1 III rarely were detected in early surveys of coronal proxy C iv (T 10 5 K) with the International Ultraviolet Explorer (Linsky & Haisch 1979), in X-rays initially with the Einstein Observatory (Ayres et al. 1981a), or later in very deep ROSAT pointings (e.g., Ayres, Fleming, & Schmitt 1991). Accordingly, the empty region of the X-ray H-R diagram across the Linsky- Haisch dividing line has come to be called the ‘‘ coronal graveyard.’’ There are other reasons—beyond the simple suppression of dynamo action by slow rotation—that explain the absence of X-ray sources in the coronal graveyard: (1) simu- lations of magnetic flux rope evolution in giant stars suggest that such structures will be trapped near the radiative core and not be buoyantly transported to the stellar surface (Holzwarth & Schu ¨ ssler 2001); (2) even if magnetic loops manage to rise to the surface, the low gravities of the evolved stars are thought to enforce a thermal instability that would prevent loop temperatures from exceeding a few times 10 4 K (Antiochos, Haisch, & Stern 1986); and (3) even if hot loops were possible on the old red giants, the Linsky- Haisch boundary coincides with the development of strong cool winds in such stars, suggesting that the energy that otherwise would heat the coronal loops somehow is being diverted to power the mass flux instead (Linsky & Haisch 1979). Observations by the Hubble Space Telescope (HST ) ultraviolet spectrographs Goddard High Resolution Spectograph (GHRS) and Space Telescope Imaging Spectrograph (STIS) have shown, however, that the earlier reports of the death of red giant coronae were premature and that magnetic activity might still be lingering on such stars. For example, the noncoronal giant Dra (K5 III) was not only detected at C iv in an early GHRS observation but also recorded as a faint X-ray source in a 19 ks pointing with the ROSAT Position Sensitive Proportional Counter (PSPC; Brown, Linsky, & Ayres 1993). Subsequent deep far-UV spectroscopy with GHRS by Ayres et al. (1997) clearly detected the coronal proxy Si iv (T 6 10 4 K) in other noncoronal red giants, at L(Si iv)/L bol levels only a few times lower than typical low-activity—but coronal—K0 giants such as Pollux ( Gem, K0 III). Inspired by these positive results we revisited the question of coronal activity on the noncoronal giants, using the sensi- tive ‘‘ solar-blind ’’ High Resolution Camera (HRC-I) of the Chandra X-Ray Observatory to search for 0.2–10 keV emis- sion from the two optically brightest K giants: Arcturus ( Boo, K1 III) and Aldebaran ( Tau, K5 III), both well- established members of the noncoronal class. As part of the Chandra program, HST STIS recorded the 1150–1710 A ˚ The Astrophysical Journal, 598:610–625, 2003 November 20 # 2003. The American Astronomical Society. All rights reserved. Printed in U.S.A. 610
Transcript of BURIED ALIVE IN THE CORONAL GRAVEYARD - JILA …jilajlinsky/57417.web.pdf · BURIED ALIVE IN THE...

BURIED ALIVE IN THE CORONAL GRAVEYARD
Thomas R. Ayres, Alexander Brown, and GrahamM. Harper
Center for Astrophysics and Space Astronomy, 389UCB, University of Colorado, Boulder, CO 80309-0389;[email protected], [email protected], [email protected]
Received 2002 December 19; accepted 2003 July 22
ABSTRACT
We have used the High Resolution Camera (HRC-I) of the Chandra X-Ray Observatory to search forcoronal (T � 106 K) emission from the archetype ‘‘ noncoronal ’’ red giants Arcturus (� Bootis=HD 124897,K1 III) and Aldebaran (� Tauri=HD 29139, K5 III). Our program follows up previous detections of ultra-violet coronal proxies such as C iv �1548 (T � 1� 105 K) and O vi �1031 (T � 3� 105 K). The deep (�19ks) HRC-I pointings obtained a tentative 3 � detection of Arcturus, with fXð0:2 2 keVÞ ¼ 1:0þ1:8
�0:8 � 10�15
ergs cm�2 s�1 (95% confidence limits [CLs]), but failed to record Aldebaran, with an upper limit ofd1:5� 10�15 ergs cm�2 s�1 (also at 95% CL). The corresponding LX=Lbol ratios are a factor of ten thousandless than the Sun, a low-activity coronal dwarf. At the same time, Hubble Space Telescope ImagingSpectrograph far-ultraviolet spectra suggest the presence of a ‘‘ cool absorber,’’ probably near the base of thered giant chromosphere, imprinting discrete low-excitation absorptions on top of highly ionized features suchas Si iv �1393. The hot emission zones thus are at least partially buried under a large column of chromo-spheric material, which would severely attenuate any soft X-rays that might be emitted. The submerged hotstructures presumably are magnetic because of their high temperatures and broad C iv profiles(FWHM � 130 km s�1). Perhaps these structures are analogous to small-scale ephemeral bipolar regionsseen ubiquitously on the Sun throughout the sunspot cycle and thought to be of direct convective origin. Ifsmall-scale magnetic fields indeed are present in the lower atmospheres of red giants such as Arcturus andAldebaran, they might play a role in initiating the cool winds of such stars, perhaps through a mechanismsimilar to solar spicules.
Subject headings: stars: coronae — stars: individual (Aldebaran, Arcturus) — ultraviolet: stars —X-rays: stars
1. INTRODUCTION
Low-mass stars begin their lives as fast-spinning dwarfsthat emit copious coronal (T � 106 K) X-rays because ofintense rotation-catalyzed dynamo-driven magnetic activity(see, e.g., Tuominen, Moss, & Rudiger 1991; Parker 1970).Such stars end their lives as bloated red giants that rotateslowly if at all (Gray & Pallavicini 1989), thanks to persis-tent angular momentum loss by the magnetized coronalwind during the long main-sequence phase. These oldspun-down stars are expected to display only feeble mag-netic activity at best. Indeed, single red giants across the‘‘ Linsky-Haisch dividing line ’’ near K1 III rarely weredetected in early surveys of coronal proxy C iv (T � 105 K)with the International Ultraviolet Explorer (Linsky &Haisch1979), in X-rays initially with the Einstein Observatory(Ayres et al. 1981a), or later in very deep ROSAT pointings(e.g., Ayres, Fleming, & Schmitt 1991). Accordingly, theempty region of the X-ray H-R diagram across the Linsky-Haisch dividing line has come to be called the ‘‘ coronalgraveyard.’’
There are other reasons—beyond the simple suppressionof dynamo action by slow rotation—that explain theabsence of X-ray sources in the coronal graveyard: (1) simu-lations of magnetic flux rope evolution in giant stars suggestthat such structures will be trapped near the radiative coreand not be buoyantly transported to the stellar surface(Holzwarth & Schussler 2001); (2) even if magnetic loopsmanage to rise to the surface, the low gravities of theevolved stars are thought to enforce a thermal instabilitythat would prevent loop temperatures from exceeding a few
times 104 K (Antiochos, Haisch, & Stern 1986); and (3) evenif hot loops were possible on the old red giants, the Linsky-Haisch boundary coincides with the development of strongcool winds in such stars, suggesting that the energy thatotherwise would heat the coronal loops somehow is beingdiverted to power the mass flux instead (Linsky & Haisch1979).
Observations by the Hubble Space Telescope (HST)ultraviolet spectrographs Goddard High ResolutionSpectograph (GHRS) and Space Telescope ImagingSpectrograph (STIS) have shown, however, that the earlierreports of the death of red giant coronae were prematureand that magnetic activity might still be lingering on suchstars. For example, the noncoronal giant � Dra (K5 III) wasnot only detected at C iv in an early GHRS observation butalso recorded as a faint X-ray source in a 19 ks pointing withthe ROSAT Position Sensitive Proportional Counter(PSPC; Brown, Linsky, & Ayres 1993). Subsequent deepfar-UV spectroscopy with GHRS by Ayres et al. (1997)clearly detected the coronal proxy Si iv (T � 6� 104 K) inother noncoronal red giants, at L(Si iv)/Lbol levels only afew times lower than typical low-activity—but coronal—K0giants such as Pollux (�Gem, K0 III).
Inspired by these positive results we revisited the questionof coronal activity on the noncoronal giants, using the sensi-tive ‘‘ solar-blind ’’ High Resolution Camera (HRC-I) of theChandra X-Ray Observatory to search for 0.2–10 keV emis-sion from the two optically brightest K giants: Arcturus(� Boo, K1 III) and Aldebaran (� Tau, K5 III), both well-established members of the noncoronal class. As part of theChandra program, HST STIS recorded the 1150–1710 A
The Astrophysical Journal, 598:610–625, 2003 November 20
# 2003. The American Astronomical Society. All rights reserved. Printed in U.S.A.
610

region of Aldebaran at medium echelle resolution(�=D� � 4� 104) to compare with existing STIS far-UVspectra of Arcturus. Aldebaran had been observedpreviously with GHRS but only in a few isolated spectralwindows (Robinson, Carpenter, & Brown 1998). Here wedescribe the new HRC-I pointings, supporting ultravioletspectra from HST and the Far-Ultraviolet SpectroscopicExplorer (FUSE), and the insights we have gained concern-ing the presence of hot emission regions on these old coldstars.
2. OBSERVATIONS
2.1. Chandra High Resolution Camera
The Chandra X-Ray Observatory has been described byWeisskopf, O’Dell, & van Speybroeck (1996) and the HRC-I by Murray et al. (1997). Chandra HRC-I has three impor-tant advantages for detecting weak X-ray emission fromoptically bright stars: (1) subarcsecond imaging and abso-lute astrometry minimize source confusion; (2) high spatialresolution also suppresses the cosmic background, byresolving the ubiquitous extragalactic point sources andspreading any truly diffuse component over many pixels;and (3) perhaps most importantly, HRC-I can observe visu-ally bright targets that nevertheless are X-ray faint, whereasthe CCD cameras of XMM-Newton EPIC and ChandraACIS have substantial ‘‘ red leaks ’’ that make such observ-ations problematic. The HRC-I is sensitive primarily to UVionizing photons, which generally are lacking in red stars,1
while the CCDs are most sensitive to optical photons, whichthe red stars produce in abundance.
The disadvantage of HRC-I is that, while optimized forhigh spatial resolution, the microchannel plate camera lacksinnate energy discrimination and thus is unable to spectrallycharacterize a source. Our intention, however, was toperform a simple detection experiment: to assess whethersufficient source counts were present to justify a subsequentmuch deeper exposure with one of the energy-resolvingCCD imagers, supposing that the red leak problem could besurmounted.
2.1.1. HRC-I Observations
Aldebaran was observed with HRC-I on 2001 December29 for 18.9 ks, and Arcturus on 2002 June 19 for 18.5 ks, assummarized in Table 1. Several prominent point sourcesappear in each field, as anticipated from earlier ROSATPSPC pointings, but nothing conspicuous near the center ofeither image at the predicted target position. We processedthe event lists by using custom software (in IDL).
The two HRC-I fields are depicted in Figure 1, super-posed on earlier ROSAT PSPC pointings. Only the innerportions of the 300 � 300 HRC-I frames are shown becausethe point-spread function (PSF) degrades rapidly off-axis.The vastly improved resolution of Chandra compared withROSAT is apparent, and there is a good correspondencebetween the detected sources in the overlapping portions ofthe HRC-I and PSPC images. Most of the sources probablyare extragalactic, certainly in the Arcturus field, which is athigh Galactic latitude. The one exception is source 3 in theAldebaran image that is the 11th magnitude Hyades Kdwarf BD +16�630 (VB 184). It originally was detected byEinstein at a coronal luminosity of LX ¼ 8� 1028 ergs s�1
(Micela et al. 1988).While the cited absolute astrometric precision of Chandra
imaging is excellent (0>6 at 90% confidence limits [CLs]2), itusually is possible to refine the pointing center of anobservation by matching the apparent sources with an opti-cal catalog such as the US Naval Observatory A2.0.Unfortunately, this is not practical for our particular obser-vations because the existing catalogs have significant‘‘ holes ’’ at the positions of our targets: the original surveyplates, on which the digital catalogs are based, are heavilyoverexposed in the vicinity of very bright stars, preventingthe detection of fainter objects nearby. The USNO A2 cata-log, for example, becomes significantly populated only atre100 from Aldebaran and Arcturus, the point wherethe Chandra PSF has degraded sufficiently that accurateastrometry of the X-ray sources is compromised. Fortu-nately, the normal astrometric pointing precision ofChandra is adequate for our purposes here.
2.1.2. X-RayMeasurements
To establish reliable X-ray detections in the HRC-I fields,one must choose an appropriate detect cell size. A larger cellpotentially collects more source photons but at the expenseof increased background counts. A smaller cell minimizesthe background but at the expense of requiring a larger cor-rection for the ‘‘ missed ’’ photons outside the particularencircled energy radius. In general, the optimum detect cellbalancing these two considerations corresponds to �75%encircled energy.
We determined the encircled energy profile of HRC-I byusing deep archival pointings on the calibration target ARLacertae, an X-ray–bright RS CVn binary. We obtained a75% encircled energy radius of r � 0>7. (Coincidentally, thisalso is comparable to the expected astrometric accuracy.) Asimilar analysis for ROSAT, by using AR Lac and thebright BL Lac object Mrk 421, indicated r � 2500 for the
2 See http://asc.harvard.edu/cal/ASPECT.
TABLE 1
Chandra HRC-I Observations
Name Sequence Observation ID UT Start
texp(ks)
CX
(counts s�1)
�Tau .............. 200162 2554 2001Dec 29.08 18.87 d2.3 � 10�4
�Boo.............. 200163 2555 2002 Jun 19.02 18.48 1:5þ2:7�1:2 � 10�4
Note.—Count ratesCX are for the 75% encircled energy detect cell, at 95%CL.
1 See http://cxc.harvard.edu/ccw/proceedings/02_proc/presentations/m_zombeck/index.html.
BURIED CORONAE 611
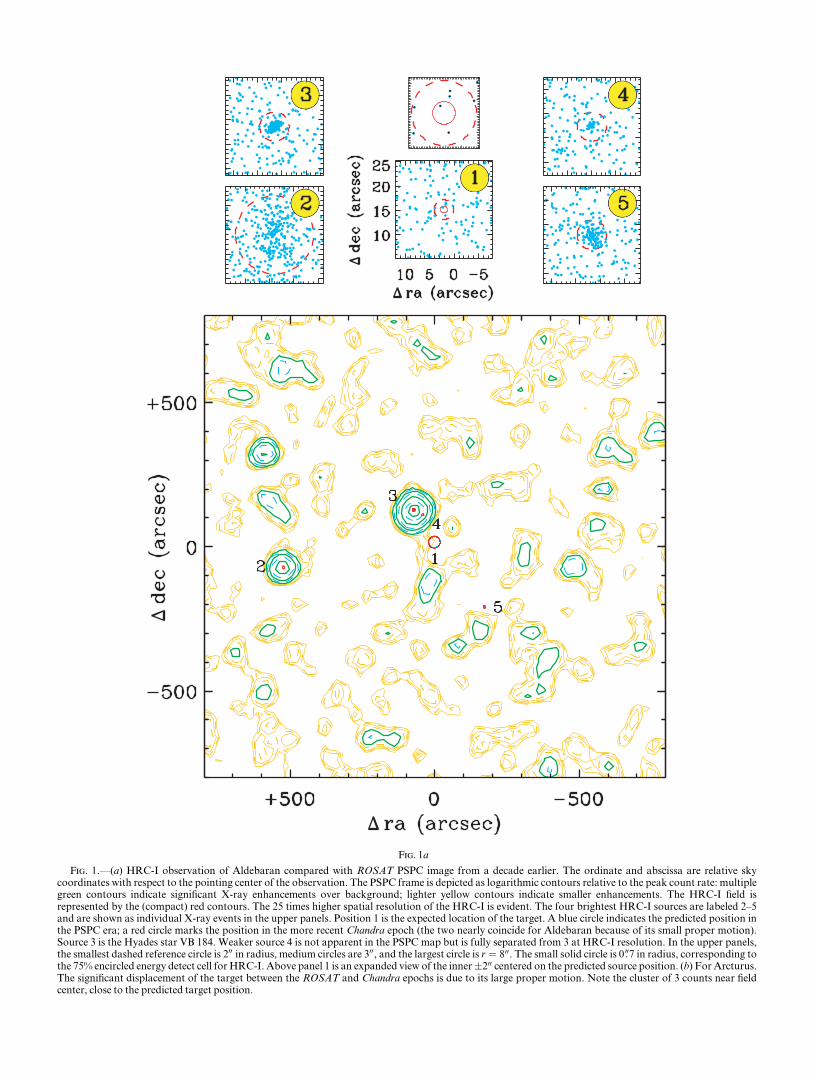
Fig. 1a
Fig. 1.—(a) HRC-I observation of Aldebaran compared with ROSAT PSPC image from a decade earlier. The ordinate and abscissa are relative skycoordinates with respect to the pointing center of the observation. The PSPC frame is depicted as logarithmic contours relative to the peak count rate: multiplegreen contours indicate significant X-ray enhancements over background; lighter yellow contours indicate smaller enhancements. The HRC-I field isrepresented by the (compact) red contours. The 25 times higher spatial resolution of the HRC-I is evident. The four brightest HRC-I sources are labeled 2–5and are shown as individual X-ray events in the upper panels. Position 1 is the expected location of the target. A blue circle indicates the predicted position inthe PSPC era; a red circle marks the position in the more recent Chandra epoch (the two nearly coincide for Aldebaran because of its small proper motion).Source 3 is the Hyades star VB 184. Weaker source 4 is not apparent in the PSPC map but is fully separated from 3 at HRC-I resolution. In the upper panels,the smallest dashed reference circle is 200 in radius, medium circles are 300, and the largest circle is r ¼ 800. The small solid circle is 0>7 in radius, corresponding tothe 75% encircled energy detect cell for HRC-I. Above panel 1 is an expanded view of the inner�200 centered on the predicted source position. (b) For Arcturus.The significant displacement of the target between the ROSAT and Chandra epochs is due to its large proper motion. Note the cluster of 3 counts near fieldcenter, close to the predicted target position.

PSPC (at 75% encircled energy for pulse height channels24–200). For typical background radiation conditions, thePSPC would accumulate about 10 counts in 20 ks in ther ¼ 2500 source circle, while HRC-I would record less than 1count in its detect cell. Adopting the optimum cells for thedifferent instruments ensures the fairest comparisonbetween the resulting measurements.
In addition to choosing an appropriate detect radius, onealso must establish scaling rules to determine the signifi-cance of an apparent count excess or to set upper limits,given the measured average background count rate. Weemployed Monte Carlo simulations of the Poisson countingprocess and determined that the 3 � detection threshold(corresponding to 0.13% probability of a false positive
Fig. 1b
BURIED CORONAE 613

detection in a one-sided Gaussian distribution; see, e.g.,Gehrels 1986) is 3
ffiffiffiffi
Bp
þ 1:6, where B is the average back-ground count in the detect cell. [Note that this result refersto the significance of a detection with respect to fluctua-tions in the background. Gehrels’ often-quoted formula,Cs � s N þ 1ð Þ1=2þðs2 þ 2Þ=3, where s ¼ 3 for the 3 � case,refers to the upper bound of possible source fluxes at that con-fidence level given a measured source count of N, assuminga negligible background. If Bd1, one can have a highly sig-nificant source detection with only a few counts in the cell,but, according to Gehrels’ formula, knowledge of the truesource flux will be very imprecise.]
Our measurements of the Aldebaran and Arcturus HRC-I images near the predicted target locations indicated back-grounds of 0.41 counts arcsec�2 in 18.9 ks for the formerand 0.13 counts arcsec�2 in 18.5 ks for the latter. TheAldebaran background is about twice the nominal quiescentrate of 9� 10�6 counts s�1 arcsec�2, while the Arcturusbackground is lower than the nominal value, probablymostly because of different solar activity conditions.
The Aldebaran image has a single count in the r � 0>7detect cell compared with an expected background of 0.6and thus is considered a nondetection. Using the count lim-its appropriate to this case from Table 2 of Kraft, Burrows,& Nousek (1991), we obtain an upper limit source countrate ofCXd2:3� 10�4 counts s�1 at 95%CL.
The Arcturus image, on the other hand, has a cluster of 3counts in the detect cell compared with an expected back-ground of 0.2. According to our criterion, above, thisrepresents a highly significant fluctuation at the 3 � level—very unlikely to occur by pure chance—and thus possibly isa valid detection. Applying the Kraft et al. (1991) count lim-its appropriate to this case yields CX ¼ 1:5þ2:7
�1:2 � 10�4
counts s�1 at 95% CL, in the 75% encircled energy detectcell. Again, although the source detection is at a very highconfidence level (>99.8%), the range of possible sourcefluxes consistent with the detected 3 counts is quite large.We also note that in X-ray astronomy it is common toreserve ‘‘ significant detections ’’ for those at the 4 � level orhigher (Hasinger et al. 1998). This conservative limit(1� CL � 3� 10�5 for a one-sided Gaussian distribution)comes about from ‘‘ blind ’’ identifications in an X-ray field,without regard to an input list of possible source positions,where there is a strong desire to minimize the number offalse positive detections (see, e.g., Watson et al. 2001). Ina typical case with, say, n � a few times 104 independentresolution elements in an X-ray image, one must set1 � CL d 1/n to minimize false positives in that field.However, here we are taking a more Bayesian viewpoint byintroducing prior knowledge (of the potential source posi-tion) and asking the question of how significant a countexcess might be located there.
Simulations with the WebPIMMS count rate tool3 usingsolar-abundance Raymond-Smith models at several tem-peratures between logT ¼ 5:8 and 6.8 K indicated anenergy conversion factor (ECF) of �5� 10�12 ergs cm�2
count�1 for Chandra HRC-I for the reference band 0.2–2keV, with an uncertainty of about �50% because of theunknown source temperature. Thus, the 95%CL limit fluxesfor Arcturus and Aldebaran are 1:0þ1:8
�0:8 � 10�15 andd1:5� 10�15 ergs cm�2 s�1, respectively, includingcompensation for the encircled energy factor.
The HRC-I detection thresholds are significantly lowerthan achieved previously with ROSAT. We remeasured theavailable PSPC event lists for Arcturus (data setrp150018n00: 18.1 ks) and Aldebaran (rp200073n00: 2.3 ks)from the ROSAT public archive at HEASARC. Ayres et al.(2003) describe the measurement strategy, although theyused a larger nominal encircled energy radius to capture thesoft counts used in determining a hardness ratio. Here weadopted the optimum PSPC detect cell and ECF �1� 10�11 ergs cm�2 count�1 to convert from channel 24–200 count rate to 0.2–2 keV flux. We found 95% CL upperlimits of fXd6� 10�15 for Arcturus andd1:7� 10�14 ergscm�2 s�1 for Aldebaran. The original PSPC upper limit forArcturus reported by Ayres et al. (1991) is a factor of 3smaller than the PSPC upper limit obtained here, mostlybecause of a correspondingly smaller ECF (3� 10�12 ergscm�2 count�1) used to convert channel 10–240 counts into0.1–2.4 keV flux, assuming a very soft source. The ECF forour more restricted reference energy band is much lesssensitive to the unknown source temperature. Again, theimportant consideration is that we compare the HRC-I andPSPC pointings on as similar a footing as possible.
The HRC-I 0.2–2 keV X-ray luminosities areLX ¼ 1:5þ2:6
�1:2 � 1025 ergs s�1 at the 11 pc distance ofArcturus and LXd7� 1025 ergs s�1 at the 20 pc distanceof Aldebaran. By way of comparison, the average LX of theSun in the same energy band is about 2 orders of magnitudelarger (Judge, Solomon, & Ayres 2003), despite the fact thatthe Sun has less than one-hundredth the surface area of ared giant. Because the Sun itself is considered a low-activityobject (Schmitt 1997) and given that even minuscule browndwarfs have already been detected in X-rays by ROSAT(e.g., Neuhauser & Comeron 1998; Rutledge et al. 2000),the two red giants must hold the record for coronal futilityamong all late-type stars.
Figure 2 summarizes these developments in an X-ray/C iv flux-flux diagram, including the new HRC-I measure-ments for � Boo and � Tau, the PSPC upper limits for thosestars, and additional PSPC detections for three comparisonred giants: ‘‘ noncoronal ’’ � Dra, low-activity Pollux, andhigh-activity � Cap (G8 III). The highlighted areas indicatewhere certain classes of stars tend to congregate, usually dis-playing power-law correlations between their X-ray andC iv activity indices (Ayres et al. 1995). Although active lateG and early K giants for the most part lie on or close to themain-sequence power-law wedge, the noncoronal K giantsclearly fall away from an extrapolation of region 4, possiblylying instead at the foot of the X-ray–deficient supergiantslocus, or simply displaying a break at LX/Lbol � L(C iv)/Lbol � 10�7.
To gain insight into possible causes of the depressedcoronal luminosities of the noncoronal giants, we turned tospectral observations by HST and FUSE. Together, theseobservatories allow access to diagnostics covering the broadtemperature range from molecules such as CO and H2 tohighly ionized species such as C iv, N v, and O vi.
2.2. Hubble Space Telescope: STIS and GHRS
HST STIS has been described by Woodgate et al. (1998).Observations of Aldebaran were carried out on 2002January 3 over four HST orbits. Arcturus was recordedpreviously, during early STIS operations in HST Cycle 7.3 See http://legacy.gsfc.nasa.gov/Tools/w3pimms.html.
614 AYRES, BROWN, & HARPER Vol. 598

Comparison star � Cap was observed by STIS during Cycle8. Table 2 summarizes the STIS pointings.
Initial acquisition of Aldebaran was performed by theSTIS CCD camera with neutral-density filter F25ND5,followed by a PEAKUP with the CCD+G430M gratingand 0>2 � 0>09 slit to accurately center the target. Scienceexposures were taken with the high-throughput 0>2 � 0>2slot, medium-resolution echelle grating E140M, and FUV/MAMA detector, covering the range 1150–1710 A withR � �=D� � 4� 104. The total E140M integration timewas 10.5 ks.
The E140M echellograms were processed with the IDL-based CALSTIS package developed by the STIS instrumentteam at Goddard Space Flight Center (Lindler 1999). It isdesigned to remove scattered light contributed by brightemission lines, which can affect fainter features in nearbyechelle orders. This is particularly important for the red
giants because their far-UV spectra are dominated byextremely bright H i �1215 Ly� and O i �1305 tripletemission (see, e.g., Ayres,Moos, & Linsky 1981b).
Zero-point corrections to the STIS wavelength scaleswere based on PtNe lamp exposures taken intermittentlyduring each observation. The first stellar exposure of thesequence has the most precise wavelength scale because thenarrow-aperture PEAKUP performed immediately prior toit accurately centered the target. Subsequent exposurescould deviate because of slow drifts of the target in the aper-ture. The first exposure therefore was adopted as a template,and the later spectra were cross-correlated against it todetect any systematic shifts. Each spectrum then wasadjusted to the reference wavelength scale and co-added.
Preliminary reconnaissance of the processed STIS spectraindicated that the Si iii �1206 resonance line was absent inthe E140M traces of Arcturus and Aldebaran, although
Fig. 2.—X-ray/C iv flux-flux diagram. Normalization by the bolometric fluxes removes the twin biases of different distances and diameters. Shadedzones represent (1) G–K dwarfs (the circled dot marks cycle-average solar ratio), (2) ‘‘ X-ray–deficient ’’ Hertzsprung gap giants (Simon & Drake 1989),(3) hyperactive RS CVn binaries, (4) active clump (G8–K0) giants, (5) inactive but still coronal K0 giants, (6) G–K supergiants, and (7) noncoronal (eK1) redgiants. Filled red circles mark � Boo (‘‘�’’), � Tau (‘‘ �’’), and three comparison stars: � Cap (‘‘ �’’), � Gem (‘‘�’’), and � Dra (‘‘ �’’). Vertical blue bars connectearlierROSAT upper limits with the newChandrameasurements.
No. 1, 2003 BURIED CORONAE 615

clearly visible in the GHRS G160M first-order gratingobservations of � Dra. The lack of �1206 in Arcturus, butpresence in � Dra, was surprising because both stars displaySi iii �1892 intersystem line emission of comparablestrength. (No observations of the 1900 A region are avail-able for Aldebaran, unfortunately.) However, a carefulexamination of the original STIS echellogram images ofArcturus and Aldebaran showed faint but definite emissionat �1206, which is 1 echelle order down from the bright redpeak of Ly�. The latter ‘‘ bleeds ’’ across the Si iii order inthe very deep exposures of the red giants. Apparently, theprocessing system overcorrects for the background Ly�intensity, thereby suppressing the Si iii feature. A compan-ion �1 A wide ‘‘ absorption feature ’’ appears �10 A long-ward of Ly� line center, where the red peak is affecting thenext order up in the echelle pattern. We examined E140Mechellograms of a number of other late-type giants, but withweaker Ly� emissions, and found no additional cases of theeffect. It presumably is most pronounced in very deep expo-sures of stars with very bright Ly� emissions, such as thetwo noncoronal giants here.
We developed a custom extraction of the region aroundSi iii, correcting for the Ly� background by fitting a simplefunction in the cross-dispersion direction to empiricallymatch the shape of the extended wings of the echelle profile.By this method, we found significant Si iii emission in bothArcturus and Aldebaran, consistent with that observed inPollux and � Dra (see Fig. 3).
Archival HST GHRS spectra of comparison stars Polluxand � Dra are summarized in Table 2. Unfortunately, therestricted free spectral range of GHRS often left importantwavelength intervals unobserved. This is much less of aproblem with STIS, since a single E140M echelle exposurecovers nearly 600 A. We dearchived the GHRS data sets,making use of the on-the-fly calibration system, and appliedthe reduction procedures outlined by Ayres et al. (1998).
2.3. Far-Ultraviolet Spectroscopic Explorer
FUSE and its in-flight performance have been describedby Moos et al. (2000) and Sahnow et al. (2000). FUSEpointings were available only for Aldebaran and Pollux, assummarized in Table 3. The data sets were retrieved fromthe Multimission Archive at Space Telescope (MAST) andrecalibrated with CalFUSE V2.1.64 by using the default‘‘ event burst ’’ and background options. The individualsubexposures were screened for orbital day and night: therespective exposure times are listed in Table 3. For the keyO vi ��1031, 1037 doublet, we considered only the mostsensitive channel (LiF1A). The individual (oversampled)spectra were rebinned by a factor of 4, cross-correlated toreduce global spectral drifts between subexposures, andco-added. Comparison of daytime and nighttime traces
TABLE 2
HST Observations
Data Set UT Start
texp(ks) Instrument
Aperture
(arcsec)
�start
(A)
�Cap:a
o5bn40010.............. 2000 Apr 15.39 1.86 STIS E140M 0.2 � 0.2 1140
o5bn40020.............. 2000 Apr 15.44 8.69 STIS E140M 0.2 � 0.2 1140
o5bn40030.............. 2000 Apr 15.65 1.10 STIS E140M 0.2 � 0.2 1140
o5bn41020.............. 2000May 04.02 1.90 STIS E230M 0.2 � 0.06 1720
�Gem:b
z2uz0107t ............... 1995 Sep 20.02 0.65 GHRSG200M 2.0 1879
z2uz010ft................ 1995 Sep 20.09 1.31 GHRSG160M 2.0 1531
z2uz010ht............... 1995 Sep 20.14 2.07 GHRSG160M 2.0 1383
z2uz010kt............... 1995 Sep 20.21 0.98 GHRSG160M 2.0 1203
z2uz010nt............... 1995 Sep 20.28 0.76 GHRSECH-A 2.0 1300
�Boo:c
o4y701020 .............. 1998 Aug 24.78 2.49 STIS E230M 0.2 � 0.06 1720
o4y701030 .............. 1998 Aug 24.85 5.21 STIS E140M 0.2 � 0.06 1140
�Dra:d
z0j7010lm............... 1991 Apr 18.87 3.59 GHRSECH-A 2.0 1301
z2r90108t ............... 1995 Jul 19.52 2.83 GHRSG200M 2.0 1878
z2r9010at ............... 1995 Jul 19.59 2.83 GHRSG160M 2.0 1529
z2r9010bt ............... 1995 Jul 19.70 2.39 GHRSG160M 2.0 1202
z2r9010et................ 1995 Jul 19.76 3.26 GHRSG160M 2.0 1374
�Tau:e
o6je01010 ............... 2002 Jan 03.43 1.82 STIS E140M 0.2 � 0.2 1140
o6je01020 ............... 2002 Jan 03.48 8.69 STIS E140M 0.2 � 0.2 1140
Note.—Stellar parameters are from SIMBAD; for definition of bolometric flux fbol see Ayreset al. (2003): units are 10�7 ergs cm�2 s�1 at Earth. Distances d are in parsecs.
a HD 203387, G8 III,V = +4.30,B�V = +0.88, fbol = 6.8, d = 66.b HD 62509, K0 III,V = +1.15,B�V = +1.00, fbol = 117, d = 10.c HD 124897, K1.5 III,V = �0.04,B�V = +1.23, fbol = 453, d = 11.d HD 164058, K5 III,V = +2.23,B�V = +1.52, fbol = 84, d = 45.e HD 29139, K5 III,V = +0.85,B�V = +1.54, fbol = 343, d = 20.
4 The CalFUSE Pipeline Reference Guide Version 1.3 (maintained byV. Dixon, J. Kruk, and E.Murphy; see http://fusegi.pha.jhu.edu.)
616 AYRES, BROWN, & HARPER

Fig. 3.—Selected ultraviolet emission lines of late-type giants. Features longward of 1200 A are from HST (STIS or GHRS); the O vi profiles are fromFUSE. ‘‘Missing ’’ lines are due to incomplete coverage. Species are arrayed from bottom to top in order of increasing formation temperature,ranging from about 104 K for O i up to 3� 105 K for O vi. A ‘‘ continuum ’’ level was subtracted from each segment on the basis of a broadband filtering of thesurrounding spectrum. The features have the proper relative strengths within each column, and the normalization between the stars was set by the apparentpeak flux of C iv �1548. Note that with such a normalization the O i triplet features (near 1305 A) of the three later K giants must be scaled down by an orderof magnitude or more to fit on the diagram. The velocity scale is relative to the mean chromospheric radial velocity established by weak narrow low-excitationemissions, typically indistinguishable from the optical �rad within measurement errors. Low-velocity narrow interstellar absorption components are visible inO i �1302 of all the stars except � Tau, and in C ii �1334 of � Cap and � Boo. For the three ‘‘ noncoronal ’’ giants (�K1), the solid shaded profiles of the Si ivand C iv doublets were obtained from a multiple-Gaussian modeling procedure, red curves represent the original features, and hatching highlights the blendswith fluoresced lines of H2 (at Si iv) and Fe ii (at C iv).

provided a check for airglow contamination. Scattered solarradiation is expected to be minimal in the LiF1A channel.
3. ANALYSIS
3.1. Ultraviolet Spectral Comparisons
Figure 3 illustrates selected ultraviolet emission lines ofArcturus, Aldebaran, and the three comparison giants.Table 4 lists fluxes of X-rays and representative hot lines forthese stars. The O i triplet at 1305 A is extremely bright inthe two archetypal noncoronal giants, displaying the typi-cal red asymmetric wind-scattered line shapes. C ii ��1334and 1335 also show prominent blueshifted wind absorption.
The figure demonstrates that the subcoronal lines of thered giants obey a curious pattern; namely, those fallinglongward of about 1500 A are easily recognized (e.g., theC iv doublet at 1549 A and Si iii �1892+C iii �1909 atlonger wavelengths; see Ayres 2000) and have similar lineshapes despite the wide gulf in L(C iv)/Lbol activity levelsseen in Fig. 2. Some of the key hot features falling shortwardof 1500 A, however, are weak or absent. For example, N v
�1238, although definitely present in Arcturus andAldebaran, is fainter than expected, say from the N v/C iv
ratios of Pollux. Furthermore, the �1242 component is notevident at all: the narrow peaks appearing at its wavelengthare C i recombination lines. The weakness of N v might beassociated with a more rapid decline in the subcoronal emis-sion measure distribution (the amount of material presentas a function of temperature) with increasing T comparedwith that of the low-activity, but still coronal, Pollux. Theweakness of N v probably is not due, however, to C i
continuum absorption (from a low-lying excited level withits edge at 1240 A), because such absorption usually either isunimportant (�C5 1) or complete (�C41), with a sharptransition between the two regimes in column densitybecause of the exponential nature of the extinction process.The presence of O vi also argues against an important rolefor C i continuum absorption because the strong C i
ground-state edge at 1100 A otherwise would obliterate the��1031, 1037 doublet.
Other hot lines appear to be present, but in reality the fea-tures are dominated by coincidental blends: for example, theSi iv ��1393, 1402 doublets of the main targets are stronglyaffected by unfortunately located narrow emissions of the H2
B–XLyman system, fluoresced byH i �1215 Ly� (McMurry,Jordan, & Carpenter 1999). In fact, the strong H2 B0–X5 P3transition completely dominates the apparent �1402 featuresof Arcturus and Aldebaran, although it is less prominent in �Dra. Removing the H2 blends in Si iv would allow us tomeasure the ‘‘ pristine ’’ profiles of these important hot linesfor comparison with low-activity—but neverthelesscoronal—objects such as Pollux, both in terms of emissionstrengths as well as line shapes (which encode globallyaverage dynamical properties of the subcoronal spectrum).
3.1.1. Deblending Si iv: Initial Approach
We began the deblending process by accurately determin-ing an intrinsic profile of the optically thin H2 features byscaling and combining B–X line shapes from other cleanmembers of the fluorescent cascades. The procedure is effec-tive thanks to the high internal precision of the STIS wave-length scales, the broad spectral coverage capturing the full
TABLE 3
FUSE Observations
Name Data Set Subexposures UT Start
texp (Day)
(ks)
texp (Night)
(ks)
Aperture
(arcsec)
�Tau ............... p1040901 8 2001 Jan 14.58 a 12 4 � 20
�Gem.............. p1180601 7 2000Nov 11.39 14 7 30 � 30
a Only minimal daytime exposure.
TABLE 4
Hot-Line and X-Ray Fluxes
X-Rays
[(1–10) � 106 K]
Star
Si iv
(6 � 104 K)
C iv
(1 � 105 K)
N v
(2 � 105 K)
O vi
(3 � 105 K) ROSAT Chandra
�Cap................ 21 29 23 . . . 900a . . .�Gem.............. 22 26 13b 16 30 � 4 . . .
�Boo............... 10c 17c 4b . . . d0.6 0:10þ0:18�0:08
�Dra ............... 5c 6c 1.8 � 0.4b . . . 0.8 � 0.4 . . .
�Tau ............... 5c 7c 3b 3.6 � 0.4b d1.7 d0.15
Note.—Fluxes at Earth, not corrected for interstellar reddening, in units of 10�14 ergs cm�2 s�1. Line fluxesrefer to the sum of the doublet components. X-ray fluxes refer to 0.2–2 keV band, derived either fromChandraHRC-I observations discussed here or material from the ROSAT archive as described by Ayres et al. (2003);limits are 95% CL. Errors are smaller than a unit increment in the least significant digit, unless statedexplicitly.
a Average between all-sky survey flux and off-axis PSPC pointing: the two fluxes are somewhat discrepant,probably because of source variability.
b Values obtained by scaling from the stronger member of the doublet to the sum by the effectively thinratio (1.5).
c Fluxes deduced fromH2 deblending andmultiple-Gaussianmodeling (see text).
618 AYRES, BROWN, & HARPER Vol. 598
range of the progressions, and the accurately knownmolecular wavelengths (Abgrall et al. 1993).
Ideally, next we would simply take the observed fluxes ofother lines in the fluorescence progressions, use the knownbranching ratios to predict the strengths of the three maintransitions that corrupt the Si iv doublet, and subtract theproperly flux-scaled intrinsic H2 profiles. We found, how-ever, a number of inconsistencies in the relative strengths ofB–X lines in the main progressions. In some cases, several ofthe potentially available H2 features were blended with eachother or unrelated species. In at least one case (B0–X6 R0,1454 A) an expected strong emission was completely absent.Here we take a brief aside to discuss the missing H2 linebecause our explanation of its absence will play animportant role later. We return to the deblending of theSi iv lines in x 3.1.3.
3.1.2. MissingH2 Line
Although a CO transition (A3–X0 P26) falls at the wave-length of the missing H2 B0–X6 R0 line, the identification isinconsistent with the general absence of other recognizableabsorption features from CO lines of similar excitation andoscillator strength. Instead, the absorption likely is from
Ni ii �1454.842, arising from the ground state (El ¼ 0cm�1). The excited state of Ni ii �1454 branches preferen-tially to lines in the � > 2000 A region. A search for thesefeatures in Arcturus (in an archival high signal-to-noiseratio E230H spectrum) was negative, but the elevated con-tinuum levels at those wavelengths would mask the pre-dicted decay lines in any event. All the other ground-stateNi ii lines in the 1200–1700 A region appear in absorption,including—importantly—�1393.324, which clips the bluewing of Si iv �1393.
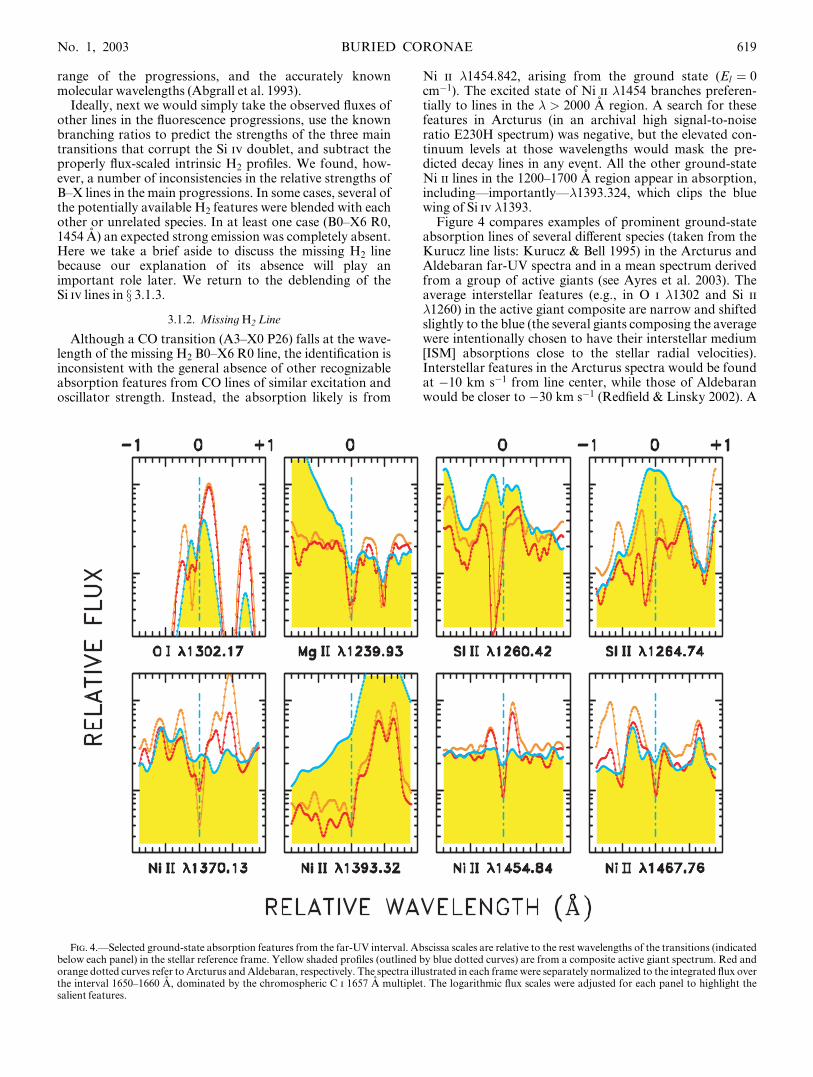
Figure 4 compares examples of prominent ground-stateabsorption lines of several different species (taken from theKurucz line lists: Kurucz & Bell 1995) in the Arcturus andAldebaran far-UV spectra and in a mean spectrum derivedfrom a group of active giants (see Ayres et al. 2003). Theaverage interstellar features (e.g., in O i �1302 and Si ii�1260) in the active giant composite are narrow and shiftedslightly to the blue (the several giants composing the averagewere intentionally chosen to have their interstellar medium[ISM] absorptions close to the stellar radial velocities).Interstellar features in the Arcturus spectra would be foundat �10 km s�1 from line center, while those of Aldebaranwould be closer to �30 km s�1 (Redfield & Linsky 2002). A
Fig. 4.—Selected ground-state absorption features from the far-UV interval. Abscissa scales are relative to the rest wavelengths of the transitions (indicatedbelow each panel) in the stellar reference frame. Yellow shaded profiles (outlined by blue dotted curves) are from a composite active giant spectrum. Red andorange dotted curves refer to Arcturus andAldebaran, respectively. The spectra illustrated in each frame were separately normalized to the integrated flux overthe interval 1650–1660 A, dominated by the chromospheric C i 1657 A multiplet. The logarithmic flux scales were adjusted for each panel to highlight thesalient features.
No. 1, 2003 BURIED CORONAE 619
distinct sharp O i �1302 ISM component is seen in Arcturus,but the corresponding feature in Aldebaran is obscured bywind absorption (the outflow coincidentally is at the samevelocity as the Local Interstellar Cloud in that direction).The strong O i and Si ii lines in the two red giants clearlyshow blueshifted wind absorption.
TheNi ii lines are prominent and appear close to their restwavelengths. These features are not interstellar, becausethey are not blueshifted by the (different) amounts expectedfor the two red giants, nor are they formed in the winds ofeither star, for the same reason. Instead, the Ni ii absorp-tions probably arise in cooler layers of the low chromo-sphere. Ni ii absorption of H2 B0–X6 R0 indicates that thecold molecule-rich fluorescing layer is relatively deep seated,probably immediately beneath the chromosphere (asopposed to, say, in a circumstellar shell), while Ni ii absorp-tion of the blue wing of Si iv �1393 indicates that the hot linealso forms below the cool region where Ni ii is able to scattereffectively.
Figure 4 also shows the absorption of the red wing of N v
�1238 by Mg ii �1239.925, and there is evidence of Fe ii
�1550.274 absorption (El � 2000 cm�1) in the blue wing ofC iv �1550 (see, e.g., Fig. 5, below), presumably from thesame layer responsible for the Ni ii features.
3.1.3. Deblending Si iv, Continued
Just as H2 B0–X6 R0 appears to have fallen victim tooptically thick absorption by Ni ii, additional H2 transitionsmight be similarly affected by other species, potentially con-fusing the simple branching-ratio approach. Thus, weemployed a more empirical strategy, as illustrated in Figure5.
The H2 B0–X5 P3 blend in �1402 is displaced about 30km s�1 shortward of the Si iv line center, revealing at leastthe long-wavelength portion of the hot-line wing. Si iv
�1393, on the other hand, is strongly affected by the B0–X5R0 and R1 transitions, particularly the former, which fallsclose to the Si iv line center. We modeled the combinedSi iv+H2 blends, using Gaussian profiles for the former andthe intrinsic mean line shape for the latter described previ-ously. We assumed that the reference Si iv profile applied tothe �1393 and �1402 components with a 2 : 1 (effectivelyoptically thin) line strength ratio. We also required that it beconsistent with the C iv lines, again assuming a 2 : 1 ratiobetween the �1548 and �1550 components, because the Si ivand C iv features of normal coronal red giants (e.g., Polluxin Fig. 3) are nearly identical in shape.
Single-component Gaussian reference profiles yielded apoor match to the Si iv+C iv system. However, a two-component line shape—consisting of a main Gaussian ofFWHM � 130 km s�1 combined with a narrow peak ofFWHM � 50 km s�1 contributing �20% of the total flux,both centered at the stellar rest velocity—produced accept-able fits to the Si iv features of Arcturus and Aldebaran, asillustrated in Figure 5 (also for � Dra, for which the H2
blends are much weaker; see Fig. 3) and reproduced the C iv
features, especially if one allows for additional emissionblends in the �1550 components. McMurry et al. (1999)described a Ly�–Fe ii fluorescence process, evident in theearlier GHRS observations of Aldebaran, that produces the�1550.501 emission excess in the blue wing of C iv �1550(near �50 km s�1): the pumping line is Fe ii �1214.398, justshortward of Ly� line center. In our higher quality STIS
profiles, a weaker fluorescent Fe ii feature is present at�1547.802 (�80 km s�1 from C iv �1548 line center),pumped by Fe ii �1214.735, with a secondary component at�1550.087 (�130 km s�1 from C iv �1550). Another com-plex of Fe ii lines, pumped by �1216.769, appears at1550.541, 1550.638, and 1551.107 A. The first two producethe redward bump on Fe ii �1550.501, while the thirdcomponent appears +60 km s�1 longward of C iv �1550.
The core/halo character of the reference hot-line profilesdeduced from the deblending strategy is reminiscent of thenarrow/broad component line shapes of Si iv and C iv seenin normal coronal stars (e.g., Wood, Linsky, & Ayres 1997).
3.2. Buried Coronae
In short, there is evidence from optically thick absorp-tions by singly ionized species in Si iv �1393, C iv �1550,and N v �1238 and C i recombination emission at N v
�1242 (with negligible N v emission, probably attenuatedby C i line absorption in deeper layers) that the hot linesform within or beneath the extended chromosphericenvelope in a layer capable of scattering radiation but oflow thermal emissivity: a ‘‘ cool absorber,’’ if you will. Fur-thermore, Ni ii absorption of H2 �1454 indicates that thecold fluorescing molecular layer lies beneath the coolabsorber. Lack of strong CO A–X attenuation of the Si ivand C iv line shapes indicates formation above the coldmolecular layer, and lack of Si i and C i continuum absorp-tion (for � < 1520 and 1240 A, respectively) suggests thatthese latter species are mostly ionized in the cool absorber(probably by Ly� photoionization). Taken together, theevidence suggests that the structures responsible for the hot-line emission are at least partially submerged in the red giantchromosphere but extend beyond the cold molecular layerjust above the stellar photosphere.
It seems then that the red giant coronae, metaphoricallyspeaking, are buried alive. Ironically, the situation is quali-tatively similar to the ‘‘ smothered coronae ’’ of classicalT Tauri stars (Walter & Kuhi 1981), at the youngest stagesof magnetic evolution.
Incidentally, the cold fluorescing layer in the red giantatmospheres might be related to an equally curious situa-tion in the solar outer atmosphere: intrusions of cool gasbetween the top of the photosphere and the midchromo-spheric ‘‘ canopy ’’ level. The ‘‘ COmosphere,’’ as it hascome to be called, is distinguished by T � 3500 K off-limbemissions in the 5 lm Dv ¼ 1 rovibrational bands of CO;temperatures are about 1000 K cooler than the Tmin of theVernazza, Avrett, & Loeser (1976, hereafter VAL) semi-empirical atmospheric models (see, e.g., Ayres 2002 andreferences to previous work therein).
3.3. Atmospheric Extension: Importance of thePressure Scale Height
In the red giants, apparently, the structures that give riseto the hot-line emissions mostly do not manage to penetratefar enough into the outer atmosphere to escape X-rayattenuation by the thick chromosphere. The proposedscenario is depicted in Figure 6. The cartoon is based on anillustrative atmospheric stratification for Aldebaran takenfrom the recent one-dimensional semiempirical chromo-spheric model of McMurry (1999) and for the Sun from theVAL models (and Ayres & Rabin 1996 for theCOmospheric component). Note that the atmospheres are
620 AYRES, BROWN, & HARPER Vol. 598

compared on an r=R� scale: in physical units (e.g., r in centi-meters), the red giant would be an additional factor of 40times more extended. The enormous bloating arises becausethe atmospheric thickness is established mainly by thepressure scale height, Hp � kT/lg, where l is the mean
molecular weight and the surface gravity g scales asM�=R2�. The chromospheric temperatures of a red giant aresimilar to the Sun’s, and the stellar mass also is close tosolar. The red giant radius, however, is R� � 40 in solarunits. With Hp=R� � R�, even on a relative r=R� scale the
Fig. 5.—Details of deblending corrections and profile modeling for the Si iv (and C iv) lines. The ordinate scale is the observed flux density normalized bythe bolometric flux, allowing a fairer comparison of the relative emission line strengths. In each panel, the shaded areas (outlined by black dot-dashed curves)are multiple-Gaussian profiles of the hot lines, while the red hatched line shapes in the Si iv panels are the best-fit H2 B0–X5 blends. Yellow dots are theobserved STIS line profiles, and the black solid curves are the total fits (i.e., Si iv plus H2 in the Si iv panels). Note also the Fe ii fluorescent blends present inboth components of the C iv doublet (particularly evident in Aldebaran).
No. 1, 2003 BURIED CORONAE 621

red giant outer atmosphere will be enormously extended.This also is a minimal estimate: if dynamical pressuresupport is important, the effective scale height will be evenlarger than in the purely thermal case.
Anticipating the discussion section below, we proposethat small-scale magnetic structures (as distinguished fromdynamo-generated large-scale active regions) on the redgiants, capable of supporting modest coronal activity, areproduced in the near-surface layers of the upper convectionzone (CZ) and have a scale length that is some fraction ofthe CZ thickness, say, 25% DrCZ. The cartoon depicts theCZ depth of the Sun (DrCZ � 0.3 R) and that of a red giant(inferred from the two-dimensional simulations of Asida2000), illustrating that they are similar fractions of therespective stellar radii. (Even if the red giant CZ is muchdeeper than indicated by the two-dimensional simulations,the contrast with the Sun still will be much smaller thanHp=R�, simply because the solar CZ depth already is a largefraction of 1 R.) This in turn suggests that the nondynamomagnetic loops will be similar in scale for dwarfs and giantsin terms of Dr/R*. Such loops will rise high above the com-pact solar atmosphere, but their cousins will be trappedwithin the extended red giant chromosphere.
3.4. X-Ray–Absorbing Columns
We can estimate the X-ray–absorbing columns in the redgiant chromosphere by appealing to semiempirical modelsdeveloped to explain the Ca ii H and K emission cores inArcturus (e.g., Ayres & Linsky 1975) andmore recent effortsto match a wider variety of UV lines in Aldebaran(McMurry 1999). These one-dimensional average modelsindicate a chromospheric column mass density (‘‘ over-burden ’’) of m � 0:3 g cm�2, corresponding to a hydrogencolumn density of NH � 1� 1023 cm�2 for a helium abun-dance of 10% (by number). The optically thick Ni ii absorp-tions provide a second constraint. Using log gf values fromthe Kurucz line list (Kurucz & Bell 1995), an Ni abundancefor mildly metal-depleted Arcturus of 5� 10�7 with respectto hydrogen (Peterson, Dalle Ore, & Kurucz 1993), and aline Doppler width of 5 km s�1, we obtain NH �2 � 1020�Ni ii, assuming that all the nickel is singly ionized.We do not know �Ni ii, however, except that it likely is41.
WebPIMMS simulations for ROSAT PSPC and ChandraHRC-I, using solar-abundance Raymond-Smith models atseveral temperatures between logT ¼ 5:8 and 6.8, showthat tenfold 0.2–2 keV X-ray absorption sets in at
Fig. 6.—Cartoon of the buried corona scenario. A red giant atmosphere (patterned after semiempirical models of Aldebaran; left) and the Sun (right) arecompared on an r=R� scale (the enormous extension of the low-gravity giant atmosphere would be even more exaggerated on a physical r scale). The closedmagnetic loop structures, depicted as similar in Dr=R� for the two stars, are assumed to have arisen from direct convective processes, thereby acquiring a scalelength equal to some fraction of the depth of the surface convection zone (here Drloop � 25% DrCZ). Coronal magnetic structures of that size would rise highabove the compact solar atmosphere and radiate X-rays freely to space but be trapped within the extended X-ray–absorbing chromospheric envelope of thered giant.
622 AYRES, BROWN, & HARPER Vol. 598

NH � 5� 1020 cm�2 on the cooler side of the temperaturerange and at NH � 5� 1021 cm�2 on the hotter side. TheNH estimated from the chromospheric models exceeds thesecritical-attenuation values, while that from the Ni ii
absorption constraint will be comparable if �Ni ii e 10.Plausibly, then, the thick chromospheres of the red giants
can provide an effective opacity barrier to prevent the escapeof coronal X-rays that might be produced in the lower at-mosphere. (Note, however, that Haisch, Schmitt, & Fabian1992 demonstrated that the extended winds of the red giantswould lack sufficient column densities to significantlyattenuate any X-rays emitted from the top of the chromo-sphere.) The likely situation is that most of the coronalloops are entirely buried in the red giant chromosphere andtheir X-rays severely degraded, while a few of the (longer)loops might penetrate into the X-ray–thin regime andthereby be detectable at kilovolt energies.
4. DISCUSSION
Although the ‘‘ coronal ’’ structures of the red giants areonly tentatively observed in X-rays, their existence is clearlyindicated indirectly by the hot-line emissions recorded byHST and FUSE. The submerged coronal zones are too hotand their emission line widths are too supersonic to beattributed to ordinary acoustic shock heating: the maximumtemperature excursions in the low chromosphere are lessthan 104 K in the one-dimensional hydrodynamical wave-heating simulations of giant stars by Cuntz, Rammacher, &Ulmschneider (1994). Instead, the hot zones likely arepowered by a magnetic process, perhaps related to thesmall-scale UV-bright points of the solar supergranulationnetwork. At the same time, the very large chromosphericradiative losses (primarily in atomic hydrogen and oxygen)compared with the small subcoronal emissions (e.g., in C iv
and O vi) suggest that the hot magnetic structures are arelatively minor contributor to the overall energy balance ofthe chromosphere (unless the hot-line emissions representonly a small fraction of the overall heating dissipated in themagnetic structures).
4.1. Dynamoless Fields?
Of course, assigning the hot-line structures to a magneticsource begs the fundamental question that fueled the origi-nal discussions of the noncoronal giants, namely, how canany magnetic dynamo action survive on ancient spun-downstars? Strong dynamo action is thought to require the shear-ing action of velocity fields in a thin zone—the tachocline(Spiegel & Zahn 1992)—separating the bottom of the differ-entially rotating convection zone from the rigidly rotatingradiative interior (e.g., Gilman 2000). The dynamo is heldresponsible for the decade-long cyclic ebb and flow of sun-spots, the most conspicuous signature of solar activity.Nevertheless, at the minimum of the activity cycle whenthere often are long intervals with few or no sunspots on thedisk, the solar corona does not simply vanish but in factmaintains a soft X-ray emission level that might be only afactor of 5 less than at cycle maximumwhen the disk is heav-ily spotted (Judge et al. 2003). EUV filtergrams taken inFe xii �195 (2� 106 K) by the Extreme-Ultraviolet ImagingTelescope (EIT) of the Solar and Heliospheric Observatory(SOHO) and by the Transition Region and Coronal Explorer(TRACE) show a haze of relatively low-altitude (hd50; 000
km) coronal emission nearly ubiquitously covering the disk,over a uniformly distributed sprinkling of compact X-ray‘‘ bright points,’’ seen throughout the cycle. The differencenear cycle maximum is the increased presence of ‘‘ activeregions ’’: sites of concentrated coronal emissions, oftendistinguished by extensive systems of bright loops risinghigh (he200; 000 km) above the solar surface.
The background corona in the relatively soft EIT andTRACE images appears to be persistent and nearly constantthroughout the sunspot cycle and thus perhaps arises from adifferent magnetic source than the active regions spawnedby the classical dynamo. Title & Schrijver (1998) concludedon the basis of SOHO Michelson Doppler Imager observ-ations of the recycling of surface fields that the magnetic fluxresponsible for small-scale ‘‘ ephemeral regions,’’ whichultimately populates the global supergranulation pattern,must have a source relatively close to the solar surface. Theyinvoked an ‘‘ �2 ’’ magnetic generation process, which reliespurely on convective turbulence and thus applies equallywell to nonrotating, noncycling stars.
Such a mechanism is an appealing explanation for thepresence of hot-line emission on noncoronal red giants. Ifsmall-scale magnetic fields indeed are present in the loweratmospheres of Arcturus and Aldebaran, it is natural to askwhether they might in some way be responsible for initiatingthe cool outflows of such stars. The wind-drivingmechanism in red giants has long been elusive, and viablecandidates are in short supply (e.g., Sutmann & Cuntz1995). At the same time, such winds arguably are importantin recycling nuclear-processed material in the galaxy, partic-ularly given the large population of �1 M stars thatbecome red giants, compared with the extremely rare mas-sive stars that ultimately disperse their chemically enrichedenvelopes in supernova events. While a full discussion of thewind-driving issue is beyond the scope of this paper, we notethat Rosner et al. (1995) argued that the magnetic looptopology on inactive red giants should favor open-fieldstructures, such as those in which the acceleration of thesolar wind is thought to occur (Withbroe, Feldman, &Ahluwalia 1991).
4.2. Opacity Holes
There are serious shortcomings in traditional one-dimensional model stratifications of red giant atmospheresfor explaining the observed rich fluorescence spectra of COand H2, simply because it is very difficult to irradiate thelower cooler layers of the atmosphere, where the moleculesin principle reside, all the way from the upper hotter layers,where the pumping emissions (O i and H i, respectively) arethought to form (Ayres 1986; McMurry & Jordan 2000). Inparticular, the large optical depths of the chromosphere inthese strong resonance lines will thermalize the radiationfields, thus producing a homogenization in frequency thatyields a very different and much weaker molecular fluores-cent pattern than observed. Furthermore, the large columnsof atomic carbon and silicon in the chromosphere also willdegrade downward, propagating Ly� and O i triplet (1305A) photons by photoionization, and the Si i continuumopacity likewise will attenuate any outward escaping fluores-cent radiation, at least shortward of the edge at 1520 A.Nevertheless, there is no obvious break in, say, the COfluorescent properties at that wavelength. These considera-tions point to a scenario in which the pumping radiation is
No. 1, 2003 BURIED CORONAE 623

produced in relatively close proximity to the cold moleculargas, where the fluorescent excitation is mainly horizontalrather than vertical (e.g., Ayres 1986).
An inhomogeneous scenario for the fluorescence isimportant, because it might tie closely into the buriedcorona hypothesis. In particular, the compact magnetic fluxtubes of the solar supergranulation pattern producestrongly elevated low-altitude chromospheric radiation (aswell as hotter lines such as C iv; see Reeves et al. 1974). Ifthe buried fields of the red giants are similar, they could actas strong local radiation sources along the full verticalextent of the structures. Ly� photons penetrating horizon-tally into the surrounding gas would photoionize both Siand C out to characteristic Stromgren radii but could notphotodissociate (or photoionize) CO or H2. Within thecylindrical ionization zone, Ly� and O i photons would beable to excite transitions of H2 and CO, respectively, andthe fluorescent emissions could escape vertically throughthe photoionized opacity hole.
If the horizontal extent of the ionization zone is muchlarger than the vertical thickness of the molecularCOmosphere, one can understand why CO fluorescencesimulations indicate a large molecular column density toproduce the observed fluorescence, but at the same time thered giant far-UV spectrum does not generally displayevidence for discrete strong CO absorption features: thestratified atmosphere outside the opacity holes would pro-duce its continuum emission spectrum from hotter layersabove the molecular zone, and only in the opacity holesthemselves would one be able to see down into theCOmosphere in the ultraviolet and thus record anypotential absorption (or emission) signatures. Since the hotmagnetic tubes with their associated opacity holes likely area sparsely distributed minority component on the surface,only species unique to them, such as the fluorescent emis-sions or the hot lines, would be able to display noticeablemolecular absorption effects in the spatially averagespectrum.
5. CONCLUSIONS
The tentative detection of X-rays from Arcturus indicatesthat the hot-line emission zones might be capable of attain-ing truly coronal temperatures (T � 106 K). This, with thedefinite presence of material at a few times 105 K, points to amagnetic origin for the hot structures and is sufficient toeliminate the other potential heating candidate, namely,acoustic shocks. The observed high temperatures alsogreatly exceed the ‘‘ cool loop ’’ equilibrium value of a fewtimes 104 K proposed by Antiochos et al. (1986), whosought to explain the Linsky-Haisch coronal dividing line interms of a bifurcated coronal loop solution that collapsesonto the cool branch when the stellar surface gravity dropsbelow a critical level.
The important conclusion is that the old red giants stillare able to sustain a modest level of magnetic activity com-plete with subcoronal structures perhaps analogous to themagnetic fragments of the solar supergranulation network(which radiate primarily in T < 106 K lines). The residual
surface magnetism might play an unforeseen role in theacceleration of the red giant winds: the solar network is thesite of spicules, transient jets of chromospheric-temperaturematerial that carry a substantial amount of mass into thecorona—10 times that lost in the solar wind—most of whichmust drain back to the surface (Beckers 1968). Solar spiculesvery likely are driven by magnetic reconnection, and per-haps there are analogous events on red giants that contrib-ute to their own mass loss. Indeed, the large nonthermal linewidths of the Si iv and C iv emissions of Arcturus andAldebaran point to a strongly dynamic formation mecha-nism, perhaps related to the ‘‘ explosive events ’’ seen in thesolar magnetic network dominantly at 105 K temperatures(Moses & Cook 1994).
6. FOR THE FUTURE
Given that Arcturus is tentatively detected as a weakcoronal source, can we hope to learn more about its coronalproperties by using one of the current generation of energy-resolving X-ray instruments? The best choice is the pncamera on XMM-Newton, which can be used with the thickfilter option and a partial window readout mode to suppressthe optical contamination from a mV � 0 red giant.5
Simulations with WebPIMMS for a range of coronal tem-peratures and absorption columns predict a total count rateof �1� 10�3 counts s�1 if the source is very soft(T � 1� 106 K), or about 100 counts in 105 s (for a 75%encircled energy radius of 2000 [Ed1:5 keV]; Fig. 6 in Ehleet al. 2003). The quiescent background in the detect circlefor the same exposure would be comparable, however. Thiscombination might be sufficient to determine a crude hard-ness ratio but not to spectrally distinguish unambiguouslybetween an unabsorbed—but faint—source or a strongerone, heavily absorbed. Thus, while the long-standing mys-tery of whether Arcturus is an X-ray source seems finally tohave been resolved, at least tentatively, the details of thephysical nature of the red giant corona appear destined toremain buried for some time to come.
This work was supported by Chandra grant G02-3014Xfrom the Smithsonian Astrophysical Observatory, HSTgrant GO-09273.01-A from the Space Telescope ScienceInstitute, and NASA grant NAG 5-13058. Observationsfrom the Chandra X-Ray Observatory were collected andprocessed at the Chandra X-Ray Observatory Center, oper-ated for NASA by Smithsonian Astrophysical Observatory.Observations from the NASA/ESA HST were collected atthe STScI, operated by AURA, under contract NAS5-26555. FUSE is operated for NASA by Johns HopkinsUniversity under contract NAS 5-32985. This research alsoutilized the SIMBAD database, maintained by CDS,Strasbourg, France, the ROSAT public archive, and theWebPIMMS count rate tool at HEASARC of the NASAGoddard Space Flight Center.
5 Seehttp://xmm.vilspa.esa.es/docs/documents/CAL-TN-0001-1-0.ps.
624 AYRES, BROWN, & HARPER Vol. 598
REFERENCES
Abgrall, H., Roueff, E., Launay, F., Roncin, J. Y., & Subtil, J. L. 1993,A&AS, 101, 273
Antiochos, S. K., Haisch, B.M., & Stern, R. A. 1986, ApJ, 307, L55Asida, S.M. 2000, ApJ, 528, 896Ayres, T. R. 1986, ApJ, 308, 246———. 2000, Sol. Phys., 193, 273———. 2002, ApJ, 575, 1104Ayres, T. R., Fleming, T. A., & Schmitt, J. H.M.M. 1991, ApJ, 376, L45Ayres, T. R., & Linsky, J. L. 1975, ApJ, 200, 660Ayres, T. R., Linsky, J. L., Vaiana, G. S., Golub, L., & Rosner, R. 1981a,ApJ, 250, 293
Ayres, T. R.,Moos, H.W., & Linsky, J. L. 1981b, ApJ, 248, L137Ayres, T. R., &Rabin, D. 1996, ApJ, 460, 1042Ayres, T. R., Simon, T., Stern, R. A., Drake, S. A., Wood, B. E., & Brown,A. 1998, ApJ, 496, 428
Ayres, T. R., et al. 1995, ApJS, 96, 223———. 1997, ApJ, 491, 876———. 2003, ApJ, 583, 963Beckers, J. M. 1968, Sol. Phys., 3, 258Brown, A., Linsky, J. L., & Ayres, T. R. 1993, in AIP Conf. Proc. 313, TheSoft X-Ray Cosmos, ed. E.M. Schlegel &R. Petre (NewYork: AIP), 36
Cuntz,M., Rammacher,W., &Ulmschneider, P. 1994, ApJ, 432, 690Ehle, M., et al., eds. 2003, XMM-Newton Users’ Handbook, Version 2.1(Vilspa:XMM-Newton Science Operations Center)
Gehrels, N. 1986, ApJ, 303, 336Gilman, P. A. 2000, Sol. Phys., 192, 27Gray, D. F., & Pallavicini, R. 1989, PASP, 101, 695Haisch, B., Schmitt, J. H.M.M., & Fabian, A. C. 1992, Nature, 360, 239Hasinger, G., Burg, R., Giacconi, R., Schmidt, M., Trumper, J., &Zamorani, G. 1998, A&A, 329, 482
Holzwarth, V., & Schussler, M. 2001, A&A, 377, 251Judge, P. G., Solomon, S. C., &Ayres, T. R. 2003, ApJ, 593, 534Kraft, R. P., Burrows, D. N., &Nousek, J. A. 1991, ApJ, 374, 344Kurucz, R. L., & Bell, B. 1995, CD-ROM 23, Atomic Line Data(Cambridge: SAO)
Lindler, D. 1999, STIS-IDT CALSTIS Manual, Version 1999 April(Greenbelt: NASA/LASP)
Linsky, J. L., &Haisch, B.M. 1979, ApJ, 229, L27
McMurry, A. D. 1999,MNRAS, 302, 37McMurry, A. D., & Jordan, C. 2000,MNRAS, 313, 423McMurry, A. D., Jordan, C., & Carpenter, K. G. 1999,MNRAS, 302, 48Micela, G., et al. 1988, ApJ, 325, 798Moos,W. H., et al. 2000, ApJ, 538, L1Moses, D., & Cook, J.W. 1994, Space Sci. Rev., 70, 81Murray, S. S., et al. 1997, Proc. SPIE, 3114, 11Neuhauser, R., & Comeron, F. 1998, Science, 282, 83Parker, E. N. 1970, ARA&A, 8, 1Peterson, R. C., Dalle Ore, C.M., &Kurucz, R. L. 1993, ApJ, 404, 333Redfield, S., & Linsky, J. L. 2002, ApJS, 139, 439Reeves, E.M., et al. 1974, ApJ, 188, L27Robinson, R. D., Carpenter, &K. G., Brown, A. 1998, ApJ, 503, 396Rosner, R., Musielak, Z. E., Cattaneo, F., Moore, R. L., & Suess, S. T.1995, ApJ, 442, L25
Rutledge, R. E., Basri, G., Martın, E. L., & Bildsten, L. 2000, ApJ, 538,L141
Sahnow,D. J., et al. 2000, ApJ, 538, L7Schmitt, J. H.M.M. 1997, A&A, 318, 215Simon, T., &Drake, S. A. 1989, ApJ, 346, 303Spiegel, E. A., & Zahn, J.-P. 1992, A&A, 265, 106Sutmann, G., & Cuntz,M. 1995, ApJ, 442, L61Title, A. M., & Schrijver, C. J. 1998, in ASP Conf. Ser. 154, TenthCambridge Workshop on Cool Stars, Stellar Systems and the Sun, ed.R. A. Donahue& J. A. Bookbinder (San Francisco: ASP), 345
Tuominen, I., Moss, D., & Rudiger, G., eds. 1991, IAU Colloq. 130, TheSun and Cool Stars: Activity, Magnetism, Dynamos (New York:Springer)
Vernazza, J. E., Avrett, E. H., & Loeser, R. 1976, ApJS, 30, 1 (VAL)Walter, F.M., &Kuhi, L. V. 1981, ApJ, 250, 254Watson,M. G., et al. 2001, A&A, 365, L51Weisskopf, M. C., O’Dell, S. L., & van Speybroeck, L. P. 1996, Proc. SPIE,2805, 2
Withbroe, G. L., Feldman, W. C., & Ahluwalia, H. S. 1991, inSolar Interior and Atmosphere, ed. A. N. Cox, W. C. Livingston, &M. S.Matthews (Tucson: Univ. Arizona Press), 1087
Wood, B. E., Linsky, J. L., &Ayres, T. R. 1997, ApJ, 478, 745Woodgate, B. E., et al. 1998, PASP, 110, 1183
No. 1, 2003 BURIED CORONAE 625