Bureau W O 2018/039643 A l W !P O PCT
123
(12) INTERNATIONAL APPLICATION PUBLISHED UNDER THE PATENT COOPERATION TREATY (PCT) (19) World Intellectual Property Organization International Bureau (10) International Publication Number (43) International Publication Date W O 2018/039643 Al 01 March 2018 (01.03.2018) W!PO PCT (51) International Patent Classification: VARD COLLEGE [US/US]; 17 Quincy Street, Cam- C12Q 1/68 (2018.01) C40B 40/06 (2006.01) bridge, MA 02138 (US). C12Q 1/70 (2006.01) G06F 19/22 (201 1.01) (72) Inventors; and (21) International Application Number: (71) Applicants: SABETI, Pardis [US/US]; 17 Quincy Street, PCT/US20 17/048749 Cambridge, MA 02138 (US). BANIECKI, Mary, Lynn [US/US]; 415 Main Street, Cambridge, MA 02142 (US). (22) International Filing Date: 25 August 2017 (25.08.2017) (72) Inventor: METSKY, Hayden; 77 Massachusetts Avenue, Cambridge, MA 02139 (US). (25) Filing Language: English (74) Agent: NIX, F., Brent; Johnson, Marcou & Isaacs, LLC, (26) Publication Language: English 27 City Square, Suite 1, Hoschton, GA 30548 (US). (30) Priority Data: (81) Designated States (unless otherwise indicated, for every 62/380,352 26 August 2016 (26.08.2016) kind of nationalprotection available): AE, AG, AL, AM, 62/459,578 15 February 2017 (15.02.2017) AO, AT, AU, AZ, BA, BB, BG, BH, BN, BR, BW, BY, BZ, 62/507,619 17 May 2017 (17.05.2017) CA, CH, CL, CN, CO, CR, CU, CZ, DE, DJ, DK, DM, DO, (71) Applicants: THE BROAD INSTITUTE, INC. [US/US]; DZ, EC, EE, EG, ES, FI, GB, GD, GE, GH, GM, GT, HN, 415 Main Street, Cambridge, MA 02142 (US). HR, HU, ID, IL, IN, IR, IS, JO, JP, KE, KG, KH, KN, KP, MASSACHUSETTS INSTITUTE OF TECHNOLO¬ KR, KW, KZ, LA, LC, LK, LR, LS, LU, LY, MA, MD, ME, GY [US/US]; 77 Massachusetts Avenue, Cambridge, MA MG, MK, MN, MW, MX, MY, MZ, NA, NG, NI, NO, NZ, 02139 (US). PRESIDENT AND FELLOWS O F HAR¬ OM, PA, PE, PG, PH, PL, PT, QA, RO, RS, RU, RW, SA, (54) Title: NUCLEIC ACID AMPLIFICATION ASSAYS FOR DETECTION OF PATHOGENS ATLANTIC P ! SA . OCEAN ¾. ,» EC P cases n Brazil D A Ja . 30 "> Ro e ja eir 10 100 Confirmed cssss s l 5a ls si ¾i FIG. 1 (57) Abstract: The present invention relates to a method for generating primers and/or probes for use in analyzing a sample which may © comprise a pathogen target sequence comprising providing a set of input genomic sequence to one or more target pathogens, generating 00 a set of target sequences from the set of input genomic sequences, identifying one or more highly conserved target sequences, and o generating one or more primers, one or more probes, or a primer pair and probe combination based on the one or more conserved target sequences. [Continued on next page]
Transcript of Bureau W O 2018/039643 A l W !P O PCT

(12) INTERNATIONAL APPLICATION PUBLISHED UNDER THE PATENT COOPERATION TREATY (PCT)
(19) World Intellectual Property
Organization
International Bureau (10) International Publication Number
(43) International Publication Date W O 2018/039643 A l01 March 2018 (01.03.2018) W ! P O PCT
(51) International Patent Classification: VARD COLLEGE [US/US]; 17 Quincy Street, Cam-C12Q 1/68 (2018.01) C40B 40/06 (2006.01) bridge, MA 02138 (US).C12Q 1/70 (2006.01) G06F 19/22 (201 1.01)
(72) Inventors; and
(21) International Application Number: (71) Applicants: SABETI, Pardis [US/US]; 17 Quincy Street,PCT/US20 17/048749 Cambridge, MA 02138 (US). BANIECKI, Mary, Lynn
[US/US]; 415 Main Street, Cambridge, MA 02142 (US).(22) International Filing Date:
25 August 2017 (25.08.2017) (72) Inventor: METSKY, Hayden; 77 Massachusetts Avenue,Cambridge, MA 02139 (US).
(25) Filing Language: English(74) Agent: NIX, F., Brent; Johnson, Marcou & Isaacs, LLC,
(26) Publication Language: English27 City Square, Suite 1, Hoschton, GA 30548 (US).
(30) Priority Data:(81) Designated States (unless otherwise indicated, for every
62/380,352 26 August 2016 (26.08.2016)kind of national protection available): AE, AG, AL, AM,
62/459,578 15 February 2017 (15.02.2017)AO, AT, AU, AZ, BA, BB, BG, BH, BN, BR, BW, BY, BZ,
62/507,619 17 May 2017 (17.05.2017)CA, CH, CL, CN, CO, CR, CU, CZ, DE, DJ, DK, DM, DO,
(71) Applicants: THE BROAD INSTITUTE, INC. [US/US]; DZ, EC, EE, EG, ES, FI, GB, GD, GE, GH, GM, GT, HN,415 Main Street, Cambridge, MA 02142 (US). HR, HU, ID, IL, IN, IR, IS, JO, JP, KE, KG, KH, KN, KP,MASSACHUSETTS INSTITUTE O F TECHNOLO¬ KR, KW, KZ, LA, LC, LK, LR, LS, LU, LY, MA, MD, ME,G Y [US/US]; 77 Massachusetts Avenue, Cambridge, MA MG, MK, MN, MW, MX, MY, MZ, NA, NG, NI, NO, NZ,02139 (US). PRESIDENT AND FELLOWS O F HAR¬ OM, PA, PE, PG, PH, PL, PT, QA, RO, RS, RU, RW, SA,
(54) Title: NUCLEIC ACID AMPLIFICATION ASSAYS FOR DETECTION OF PATHOGENS
ATLANTICP ! S A . OCEAN
¾ . ,»
EC P
cases n Brazil D A
Ja .30" >
R o e j a eir
10 100
Confirmed
cssss
s l 5a l s si¾i
FIG. 1
(57) Abstract: The present invention relates to a method for generating primers and/or probes for use in analyzing a sample which may©
comprise a pathogen target sequence comprising providing a set of input genomic sequence to one or more target pathogens, generating0 0 a set of target sequences from the set of input genomic sequences, identifying one or more highly conserved target sequences, ando generating one or more primers, one or more probes, or a primer pair and probe combination based on the one or more conserved
target sequences.
[Continued on nextpage]

WO 2018/039643 Al llll I I I I 11III II I llll 11II III! Ill II I II
SC, SD, SE, SG, SK, SL, SM, ST, SV, SY, TH, TJ, TM, TN,
TR, TT, TZ, UA, UG, US, UZ, VC, VN, ZA, ZM, ZW.
(84) Designated States (unless otherwise indicated, for everykind of regional protection available): ARIPO (BW, GH,
GM, KE, LR, LS, MW, MZ, NA, RW, SD, SL, ST, SZ, TZ,
UG, ZM, ZW), Eurasian (AM, AZ, BY, KG, KZ, RU, TJ,
TM), European (AL, AT, BE, BG, CH, CY, CZ, DE, DK,
EE, ES, FI, FR, GB, GR, HR, HU, IE, IS, IT, LT, LU, LV,
MC, MK, MT, NL, NO, PL, PT, RO, RS, SE, SI, SK, SM,
TR), OAPI (BF, BJ, CF, CG, CI, CM, GA, GN, GQ, GW,
KM, ML, MR, NE, SN, TD, TG).
Published:— with international search report (Art. 21(3))— before the expiration of the time limit for amending the
claims and to be republished in the event of receipt ofamendments (Rule 48.2(h))
— with sequence listing part of description (Rule 5.2(a))

NUCLEIC ACID AMPLIFICATION ASSAYS FOR DETECTION OF PATHOGENS
CROSS REFERENCE TO RELATED APPLICATIONS
[0001] This application claims the benefit of U.S. Provisional Application No. 62/380,352,
filed August 26, 2016, U.S. Provisional Application No. 62/459,578, filed February 15, 2017,
and U.S. Provisional Application No. 62/507,619, filed May 17, 2017. The entire contents of the
above-identified applications are hereby fully incorporated herein by reference.
STATEMENT REGARDING FEDERALLY SPONSORED RESEARCH
[0002] This invention was made, in whole or in part, with government support under grant
number U19AI1 108 18 granted by the National Institute of Allergy and Infectious Diseases,
National Institutes of Health, Department of Health and Human Services. The government has
certain rights in the invention.
FIELD OF THE INVENTION
[0003] The present invention provides a combination of genomic and computational
technologies to provide rapid, portable sample analysis for identifying a target sequence.
BACKGROUND OF THE INVENTION
[0004] Infectious diseases cause tremendous morbidity and mortality in tropical developing
countries, and the need for a holistic approach to their detection and diagnosis is increasingly
clear. The full range and prevalence of pathogens in such settings is not well understood, and the
capacity to detect new or infrequent threats, like Ebola, is often lacking. The ability to diagnose
a broad spectrum of pathogens is vital, since infection with multiple pathogens and resulting
misdiagnoses are common.
[0005] First, there is a need in patient care for more comprehensive diagnostic tests. Many
pathogens produce non-specific symptoms like fever, headache, and nausea, making them
difficult to distinguish clinically. For example, 30% - 90% of hospitalized patients with acute
fever in tropical Africa are diagnosed with malaria and treated accordingly, while only 7% -
45% of them actually have laboratory-confirmed malaria. Better tests for individual diseases
will be useful, but will not fully solve the problem: e.g., many patients with detectable malaria

are actually sick because of other infections. Such misdiagnoses can be fatal, as in a 1989
outbreak of Lassa fever in two Nigerian hospitals, where 22 people died. Thus, Applicants have
developed a low-cost PCR-based panel for a range of infectious diseases as a routine diagnostic
procedure for febrile patients.
[0006] Second, there is a need to better understand the array of existing pathogens and to
detect emerging threats. Lassa virus, once thought to be a novel cause of sporadic disease
outbreaks, has turned out to be endemic in much of West Africa, and there is even evidence that
Ebola circulates undetected more widely than is supposed. Any samples that fail Applicants'
diagnostic panel, therefore, are sent for deep metagenomic sequencing to detect other pathogens.
A random selection of other samples is treated the same way, to provide a broad picture of the
range of pathogens in the region, which in turn will enable early detection of new or increasing
pathogens.
[0007] Technological advances in sequencing and analyzing the genomes of a wide variety
of microbes, including the costs of implementing genomic approaches at scale, make it possible
to address these needs. However, to fulfill that promise, the tools must be delivered to
researchers and clinicians on the ground. Empowering local health care clinics and their
communities, in turn, will help motivate patients to seek care at the clinic. In addition to saving
lives, this enables us to continually monitor patients with unexplained fever, capturing diseases
that previously went undiagnosed or misdiagnosed. After local diagnosis, samples can then be
sent to advanced laboratories in the US ~ and hopefully soon Africa too ~ for in-depth analysis
using high-throughput metagenomic sequencing. Discoveries of new pathogens can then be
converted into affordable, field-deployable diagnostics to inform health care workers and the
populations they serve, reducing the burden of disease, and improving local capacity to detect
and treat at the earliest possible stages. Robust data systems are needed to connect sample
collections, the process of pathogen identification, and candidates for developing diagnostics
and treatments. By comprehensively identifying pathogens circulating in the population this new
infrastructure serves as an early warning for emerging and persistent diseases. With their own
diagnostic capacity for a wide range of infectious agents, sites throughout Africa are able to
support their communities and help to detect, monitor and characterize emerging diseases before
they become global threats.

SUMMARY OF THE INVENTION
[0008] Embodiments disclosed herein are directed to methods of identifying highly
conserved regions among pathogen variants and/or pathogen species and use of primers and
probes directed to such regions for t e development and use of nucleic acid-based detection
assays for detection of pathogens.
[0009] In one aspect, the invention provides a method for developing probes and primers to
pathogens, comprising: providing a set of input genomic sequences to one or more target
pathogens; generating a set of target sequences from the set of input genomic sequences;
applying a set cover solving process to the set of target sequences to identify one or more target
amplification sequences, wherein the one or more target amplification sequences are highly
conserved target sequences shared between the set of input genomic sequences of the target
pathogen; and generating one or more primers, one or more probes, or a primer pair and probe
combination based on the one or more target amplification sequences. In one embodiment, the
set of input genomic sequences represent genomic sequences from two or more variants of the
one or more target pathogens. In another embodiment, the set of input genomic sequences are
obtained from a metagenomic sample. In another embodiment, the metagenomic sample is
obtained from one or more vector species of the one or more target pathogens. In another
embodiment, the one or more vector species are one or more species of mosquito. In another
embodiment, the one or more target pathogens is one or more viral pathogens. In another
embodiment, the viral pathogen is Zika, Chikungunya, or Dengue. In another embodiment, the
one or more viral pathogens is Zika, Chikungunya. In another embodiment, the one or more
target pathogens is a parasitic pathogen. In another embodiment, the target sequences are
fragmented to a size that is approximately equal to a size of an amplicon for detection using a
nucleic acid amplification assay, such as a target sequence size of 100 to 500 base pairs. In
another embodiment, each nucleotide of the set of input genomic sequences is considered an
element of universe of the set cover solving process and wherein each element is considered
covered if the target sequence aligns to some portion of a genomic reference sequence.
[0010] In another aspect, the invention provides a method for detecting one or more
pathogens comprising: contacting a sample with one or more primers and/or probes generated
using a method as described herein; detecting amplification of one or more pathogen target
sequences using a nucleic acid amplification method and the one or more primers and/or probes,

wherein detection of t e target sequence indicates a presence of the one or more pathogens in
the sample. In one embodiment, the nucleic acid amplification method is quantitative PCR and
the one or more primers and/or probes comprise a forward and reverse primers and a probe
modified with a detectable label. In one embodiment, the forward primer comprises one of SEQ
ID NOs: 3, 7, 11, 15, 19, 23, 27, 31, 35, 39, or 43, t e reverse primer comprises one of SEQ ID
NOs: 4, 8, 12, 16, 20, 24, 28, 32, 36, 40, or 44, and the probe comprises one of SEQ ID NOs: 5,
9, 13, 17, 2 1, 25, 29, 33, 37, 4 1, 45, or 47. In another embodiment, the one or more primers
and/or probes are configured to detect one or more non-synonymous single nucleotide
polymorphisms (SNPs) listed in Tables 4 or 8 .
[0011] In another aspect, the invention provides a method for detecting Zika, Chikungunya,
Dengue, or a combination thereof in samples, comprising contacting a sample with a forward
and reverse primer and a probe with a detectable label, wherein the forward primer comprises
one or more of SEQ ID NOs: 3, 7, 11, 15, 19, 23, 27, 31, 35, 39, or 43 the reverse primer
comprises one of more of SEQ ID NOs: 4, 8, 12, 16, 20, 24, 28, 32, 36, 40, or 44 and the probe
comprises one or more of 5, 9, 13, 17, 2 1, 25, 29, 33, 37, 4 1, 45, or 47.; and detecting
amplification of one or more target sequences through a quantitative PCR assay using the
forward and reverse primers and the probe, wherein detection of the one or more target
sequences indicates the presence of Zika, Chikungunya, or both. In another example
embodiment, a method for detecting Zika and/or Chikungunya in samples comprises contacting
a sample with a forward and reverse primer and a probe with a detectable label, wherein the
forward primer, reverse primer, and probe are each configured to hybridize to at least a portion
of one or more of the target sequences of SEQ ID NOs: 6, 10, 14, 18, 22, 26, 30, 34, 38, 42, or
46; and detecting amplification of the one or more target sequences through a quantitative PCR
assay using the forward and reverse primers and the probe, wherein detection of the one or more
target sequences indicates the presence of Zika, Chikungunya, Dengue or a combination thereof
in the sample.
[0012] In another aspect, the invention provides a method for detecting Dengue
[0013] In another aspect, the invention provides a kit comprising the primers and/or probes
as described herein.
[0014] These and other aspects, objects, features, and advantages of the example
embodiments will become apparent to those having ordinary skill in the art upon consideration
of the following detailed description of t e illustrated embodiments.
BRIEF DESCRIPTION OF THE DRAWINGS
[0015] FIG, 1 - Shows the background of Zika virus
[0016] FIG. 2 Shows the global health perspective of Zika virus.
[0017] FIG. 3 Shows an overview of the diagnostics of Zika virus.
[0018] FIG. 4 - Shows a diagram of the Zika virus genome.
[0019] FIG. 5 - Shows a plot of the percent genomic identity of all global Zika vims strains.
[0020] FIG. 6 - Shows Zika RT-qPCR assays and nucleotide mismatches across Zika
strains.
[0021] FIG. 7 - Shows performance data for Zika RT-qPCR assays.
[0022] FIG. 8 Show's standard curves for three Zika assays, FAYE, Pyke E, and NS .
[0023] FIG. 9 - Shows a workflow for RT-qPCR diagnostic development.
[0024] FIG. 1 - Shows design for ne Zika RT-qPCR assays.
[0025] FIG. 11 - Shows results from newly designed assays against NS1, NS3, NS5 regions
of Zika virus.
[0026] FIG, 12 - Shows the limit of detection of Zika RT-qPCR assays. The NS5 assay-
was found to be the most robust.
[0027] FIG. 13 - Shows results of Zika S5 probe-based diagnostic assay.
[0028] FIG. 14 - Shows results of Zika NS5 probe-based diagnostic assay with
concentration values.
[0029] FIG. 15 - Shows primers and probes for detection of Zika virus.
[0030] FIG. 16 - Shows sequencing data generated directly from clinical samples. 200
clinical and mosquito pool samples were sequenced using amplicon and/or hybrid capture
sequencing methods, generating 100 ZIKV genomes (a) For each country, the number of
genomes generated by each sequencing method; each genome counted is from a sample that has
at least one "positive" assembly, i.e. a replicate passes thresholds in (b). The "Other" category
includes all samples from countries that did not produce a positive assembly. In the final
column, genomes are counted only once if both methods produced a positive assembly (b)

Thresholds used to select samples for downstream analysis. Each point is a replicate. Red and
blue shading: regions of accepted amplicon sequencing and hybrid capture genome assemblies,
respectively; purple: positive assemblies by either method. Not shown: hybrid capture positive
controls with depth >10,000x. (c) Amplicon sequencing coverage by sample across the ZIKV
genome. Red indicates sequencing depth >500x, and the heat map (bottom) sums coverage
across all samples; white horizontal lines indicate amplicon locations (d) Relative sequencing
depth across hybrid capture genomes (e) Within-sample variant frequencies across methods.
Each point is a particular variant in an individual sample and points are plotted on a log-log
scale. Green points represent "verified" variants detected by hybrid capture sequencing that pass
strand bias and single-library frequency fi lters (f) Within-sample variant frequencies across
replicate libraries per method. Red points are variants identified using amplicon sequencing;
blue points are variants identified using hybrid capture. Light colored points do not pass a strand
bias filter; dark points do. In (e-f), frequencies <0.5% are shown at 0%.
[0031] FIG. 17 - Shows the relationship between metadata and sequencing outcome. The
significance of the site where a sample was collected, patient gender, patient age, sample type,
and days between symptom onset and sample collection ("collection interval") were tested as
predictors of sequencing outcome (a) To predict whether a sample is positive by sequencing, a
full model was constructed with all predictors and likelihood ratio tests were performed on each
predictor by subtracting it from the full model. Sample site and patient gender improved the
model (b) For each of six sample sites, division was done by gender and a point was shown for
each sample at its response value in the model. Shaded region below dotted line shows
sequencing-negative values used in this model; region above is positive. The discrepancy in
positivity between females and males is driven largely by Sample sites 2, 5, and 6 . (c) Using
only the observed positive samples, percent genome identified was predicted. Likelihood ratio
tests were performed, as in (a), and it was found that collection interval improved the model (d)
Sequencing outcome for each sample by collection interval, separated by sample site. Samples
collected 7+ days after symptom onset produced, on average, the fewest unambiguous bases,
though these observations were based on a limited number of data points. While the sample site
variable accounted for differences in the composition of cohorts, the effects of gender and
collection interval might be due to confounders in composition that span multiple cohorts.

[0032] FIG. 18 - Shows Zika virus spread throughout t e Ameri cas (a) Samples were
collected in each of the colored countries or territories. Darker regions indicate t e specific state,
department, or province of sample origin, if known (b) Maximum clade credibility tree
generated using BEAST shows Zika virus introductions from Brazil and into various South and
Central American countries and regions. Tips with bolded branches and labels correspond to
sequences generated in this study. Grey violin plots denote probability distributions for the time
of the most recent common ancestor of four major clades. (c) Principal component analysis of
variants between samples shows geographic clustering. Circular points represent data generated
in this study; diamond points represent published genomes from this outbreak.
[0033] FIG. 19 - Shows maximum likelihood tree and root-to-tip regression (a) Tips are
colored by sample collection location. Bolded tips indicate those generated in this study; all
other colored tips are published genomes from the outbreak in the Americas. Grey tips are
samples from Zika virus cases in Southeast Asia and the Pacific (b) Linear regression of root-
to-tip divergence on dates supports a molecular clock hypothesis. The substitution rate for the
full tree, indicated by the slope of the black regression line, is consistent with rates of Asian
lineage ZIKV estimated by molecular clock analyses (Faria et al. 2016). The substitution rate
for sequences within the Americas outbreak only, indicated by the slope of the green regression
line, is consistent with rates estimated by BEAST [1.04xl0 3 ; 95% CI interval (8.54xl0 4,
1.21xl0 3)] for this data set.
[0034] FIG. 20 - Shows geographic and gene-level distribution of Zika virus vari ation (a)
Location of variants in ZIKV genome. The minor allele frequency is the proportion of genomes
out of the 100 reported in this study sharing a vari ant (b) Phylogenetic distribution of non-
synonymous variants that have derived frequency >5% (of the 164 samples in the tree), shown
on the branch where the mutation most likely occurred. A white asterisk indicates the variant
might be on the next-most ancestral branch (in one case, 2 branches upstream), but the exact
location was unclear because of missing data. Square shape denotes a variant occurring at more
than one location in the tree (c) Conservation of the ZIKV envelope gene. Left: non-
synonymous variants per genome length for the envelope gene (dark grey) and the rest of the
coding region (light grey). Middle: proportion of non-synonymous variants resulting in negative
BLOSUM62 scores, which indicate unlikely or extreme substitutions (p < 0.038, χ2 test). Right:
average of BLOSUM62 scores for non-synonymous variants (p < 0.029, 2-sample t-test). Error

bars are 95% confidence intervals derived from binomial distributions (left, middle) or Student's
t-distributions (ri ght) (d) Constraint in the ZIKV 3' UTR and transition rates over t e ZIKV
genome. Error bars are 95% confidence intervals derived from binomial distri butions (e) ZIKV
diversity in diagnostic primer and probe regions. Top: locations of published probes (dark blue)
and primers (cyan) (Pyke e t al., 20 14; Lanciotti e t al., 2008; Faye e t al., 2008; Faye e t al., 20 13;
Balm e t al., 2012; Tappe e t al., 2014) on ZIKV genome. Bottom: each column represents a
nucleotide position in the probe or primer and each row one of t e 164 ZIKV genomes on the
tree. Cell color indicates that a sample's allele matches the probe/primer sequence (grey), differs
from it (red), or has no data for that position (white).
[0035] FIG. 21 - Shows multiple rounds of Zika hybrid capture. Genome assembly
statistics of samples prior to hybrid capture (grey), and after one (blue) or two (red) rounds of
hybrid capture. 9 individual libraries (8 unique samples) were sequenced all three ways, had > 1
million raw reads in each method, and generated at least one positive assembly. Raw reads from
each method were downsampled to the same number of raw reads (8.5 million) before genomes
were assembled (a) Percent of the genome identified, as measured by number of unambiguous
bases (b) Median sequencing depth of Zika genomes, taken over the assembled regions.
[0036] FIG. 22 - Shows experimental methods to predict sequencing outcome. cDNA
concentration of amp icon pools (as measured by Agilent 2200 Tapestation) is highly predictive
of amplicon sequencing outcome . On each axis, 1+primer pool concentration is plotted on a og
scale. A sample is considered positive if at least one primer pool concentration is >0.8 ng/uL;
sensitivity==98.58% and specificity===9 .47%.
[0037] FIG. 23 - Analysis of possible predictors of sequencing outcome: the site where a
sample was collected, patient gender, patient age, sample type, and days between symptom
onset and sample collection ("collection interval") (a) Prediction of whether a sample passes
assembly thresholds by sequencing. Rows show results of likelihood ratio tests on each
predictor by omitting the variable from a full model that contains all predictors. Sample site and
patient gender improved model fit, but sample type and collection interval did not. (b)
Proportion of samples that pass assembly thresholds by sequencing, divided by sample type,
across six sample sites (c) Same as (b), except divided by collection interval (d) Prediction of
the genome fraction identified, using samples passing assembly thresholds. Rows show results
of likelihood ratio tests, as in (a). Collection interval improved the model, but sample type did

not. (e) Sequencing outcome for each sample, divided by sample type, across six sample sites
(f) Same as (e), except divided by collection interval. Samples collected 7+ days after symptom
onset produced, on average, the fewest unambiguous bases, although these observations are
based on a limited number of data points. While the sample site variable accounts for
differences in cohort composition, the observed effects of gender and collection interval might
be due to confounders in composition that span multiple cohorts. These results illustrate t e
effect of variables on sequencing outcome for the samples in this study; they are not indicative
of ZIKV titer more generally. Other studies67'68 have analyzed the impact of sample type and
collection interval on ZIKV detection, sometimes with differing results.
[0038] FIG. 24 - Maximum likelihood tree and root-to-tip regression (a) Tips are colored
by sample collection location. Labeled tips indicate those generated in this study; all other
colored tips are other publicly available genomes from the outbreak in the Americas. Grey tips
are samples from ZIKV cases in Southeast Asia and the Pacific (b) Linear regression of root-to-
tip divergence on dates. The substitution rate for the full tree, indicated by the slope of the black
regression line, is similar to rates of Asian lineage ZIKV estimated by molecular clock
analyses 12 . The substitution rate for sequences within the Americas outbreak only, indicated by
the slope of the green regression line, is similar to rates estimated by BEAST [1.15xl0 ; 95%
CI (9.78xl0 4 , 1.33xl0 3)] for this data set.
[0039] FIG. 25 - Substitution rate and tMRCA distri butions (a) Posterior density of the
substitution rate. Shown with and without the use of sequences (outgroup) from outside the
Ameri cas (b-e) Posterior density of the date of the most recent common ancestor (MRCA) of
sequences in four regions corresponding to those in FIG. 2c. Shown with and without the use of
outgroup sequences. The use of outgroup sequences has little effect on estimates of these dates
(f) Posterior density of the date of the MRCA of sequences in a clade consisting of samples
from the Caribbean and continental US. Shown with and without the sequence of
DOM 2016 MA-WGS16-020-SER, a sample from the Dominican Republic that has only 3037
unambiguous bases; this was the most ancestral sequence in the clade and its presence affects
the tMRCA. In (a-f), all densities are shown as observed with a relaxed clock model and with a
strict clock model.
[0040] FIG. 26 - Substitution rates estimated with BEAST. Substitution rates estimated in
three codon positions and non-coding regions (5' and 3' UTRs). Transversions are shown in

grey and transitions are colored by transition type. Plotted values show the mean of rates
calculated at each sampled Markov chain Monte Carlo (MCMC) step of a BEAST run. These
calculated rates provide additional evidence for the observed high C-to-T and T-to-C transition
rates shown in FIG. 25d.
[0041] FIG. 27 - cDNA concentration of amplicon primer pools predicts sequencing
outcome. cDNA concentration of amplicon pools (as measured by Agilent 2200 Tapestation)
was highly predictive of amplicon sequencing outcome. On each axis, 1+primer pool
concentration is plotted on a log scale. Each point demonstrates a technical replicate of a sample
and colors denote observed sequencing outcome of the replicate. If a replicate was predicted to
be passing when at least one primer pool concentration is >0.8 ng/µΕ , then sensitivity=98.7 1%
and specificity=90.34%. An accurate predictor of sequencing success early in the sample
processing workflow can save resources.
[0042] FIG. 28 - Evaluating multiple rounds of Zika virus hybrid capture. Genome
assembly statistics of samples prior to hybrid capture (grey), and after one (blue) or two (red)
rounds of hybrid capture. 9 individual libraries (8 unique samples) were sequenced all three
ways, had > 1 million raw reads in each method, and generated at least one passing assembly.
Raw reads from each method were downsampled to t e same number of raw reads (8.5 million)
before genomes were assembled (a) Percent of the genome identified, as measured by number
of unambiguous bases (b) Median sequencing depth of ZIKV genomes, taken over the
assembled regions.
DETAILED DESCRIPTION OF THE INVENTION
General Definitions
[0043] Unless defined otherwise, technical and scientific terms used herein have the same
meaning as commonly understood by one of ordinary skill in the art to which this disclosure
pertains. Definitions of common terms and techniques in molecular biology may be found in
Molecular Cloning: A Laboratory Manual, 2nd edition (1989) (Sambrook, Fritsch, and
Maniatis); Molecular Cloning: A Laboratory Manual, 4th edition (20 12) (Green and Sambrook);
Current Protocols in Molecular Biology (1987) (F.M. Ausubel et al. eds.); the series Methods in
Enzymology (Academic Press, Inc.): PCR 2 : A Practical Approach (1995) (M.J. MacPherson,
B.D. Hames, and G.R. Taylor eds.): Antibodies, A Laboraotry Manual (1988) (Harlow and

Lane, eds.): Antibodies A Laboraotry Manual, 2nd edition 2013 (E.A. Greenfield ed.); Animal
Cell Culture (1987) (R.I. Freshney, ed.); Benjamin Lewin, Genes IX, published by Jones and
Bartlet, 2008 (ISBN 0763752223); Kendrew et al. (eds.), The Encyclopedia of Molecular
Biology, published by Blackwell Science Ltd., 1994 (ISBN 063202 1829); Robert A . Meyers
(ed.), Molecular Biology and Biotechnology: a Comprehensive Desk Reference, published by
VCH Publishers, Inc., 1995 (ISBN 9780471 1857 10); Singleton et al., Dictionary of
Microbiology and Molecular Biology 2nd ed., J . Wiley & Sons (New York, N.Y. 1994), March,
Advanced Organic Chemistry Reactions, Mechanisms and Structure 4th ed., John Wiley & Sons
(New York, N.Y. 1992); and Marten H . Hofker and Jan van Deursen, Transgenic Mouse
Methods and Protocols, 2nd edition (201 1) .
[0044] As used herein, the singular forms "a", "an", and "the" include both singular and
plural referents unless the context clearly dictates otherwise.
[0045] As used herein t e term "hybridize" or "hybridization" refers to ability of
oligonucleotides and their analogs to hybridize by hydrogen bonding, which includes Watson-
Crick, Hoogsteen, or reversed Hoogsteen hydrogen bonding, between complementary bases,
Generally nucleic acid consists of nitrogenous bases that are either either pyrimidines (cytosine
(C), uracil (U), and thymine (T)) or purines (adenine (A) and guanine (G)). These nitrogenous
bases form hydrogen bonds between a pyrimidine and a purine, and the bonding of the
pyrimidine to the purine is referred to as "base pairing." More specifically, A will hydrogen
bond to T or U, and G will bond to C . "Complementary" refers to the base pairing that occurs
between two distinct nucleic acid sequences or two distinct regions of the same nucleic acid
sequence.
[0046] "Specifically hybridizable" and "specifically complementary" are terms that indicate
a sufficient degree of complementarity such that stable and specific binding occurs between the
oligonucleotide (or it's analog) and the DNA or RNA target. The oligonucleotide or
oligonucleotide analog need not be 100% complementary to its target sequence to be
specifically hybridizable. An oligonucleotide or analog is specifically hybridizable when there is
a sufficient degree of complementarity to avoid non-specific binding of the oligonucleotide or
analog to non-target sequences under conditions where specific binding is desired. Such binding
is referred to as specific hybridization.

[0047] The identity/similarity between two or more nucleic acid sequences, or two or more
amino acid sequences, is expressed in terms of the identity or similarity between the sequences.
Sequence identity can be measured in terms of percentage identity; t e higher the percentage,
the more identical the sequences are. Homologs or orthologs of nucleic acid or amino acid
sequences possess a relatively high degree of sequence identity/similarity when aligned using
standard methods. Methods of alignment of sequences for comparison are well known in the art.
Various programs and alignment algorithms are described in: Smith & Waterman, Adv. Appl.
Math. 2:482, 198 1; Needleman & Wunsch, J . Mol. Biol. 48:443, 1970; Pearson & Lipman,
Proc. Natl. Acad. Sci. USA 85 :2444, 1988; Higgins & Sharp, Gene, 73 :237-44, 1988; Higgins
& Sharp, CABIOS 5:15 1-3, 1989; Corpet et al., Nuc. Acids Res. 16: 1088 1-90, 1988; Huang et
al. Computer Appls. in the Biosciences 8, 155-65, 1992; and Pearson et al., Meth. Mol. Bio.
24:307-3 1, 1994. Altschul et al., J . Mol. Biol. 2 15 :403-10, 1990, presents a detailed
consideration of sequence alignment methods and homology calculations. The NCBI Basic
Local Alignment Search Tool (BLAST) (Altschul et al, J . Mol. Biol. 215 :403- 10, 1990) is
available from several sources, including the National Center for Biological Information (NCBI,
National Library of Medicine, Building 38A, Room 8N805, Bethesda, MD 20894) and on the
Internet, for use in connection with the sequence analysis programs blastp, blastn, blastx,
tblastn, and tblastx. Blastn is used to compare nucleic acid sequences, while blastp is used to
compare amino acid sequences. Additional information can be found at the NCBI web site.
[0048] Once aligned, the number of matches is determined by counting the number of
positions where an identical nucleotide or amino acid residue is presented in both sequences.
The percent sequence identity is determined by dividing the number of matches either by the
length of the sequence set forth in the identified sequence, or by an articulated length (such as
100 consecutive nucleotides or amino acid residues from a sequence set forth in an identified
sequence), followed by multiplying the resulting value by 100. For example, a nucleic acid
sequence that has 1166 matches when aligned with a test sequence having 1554 nucleotides is
75 .0 percent identical to the test sequence ( 1166÷1554* 100=75 .0). The percent sequence
identity value is rounded to the nearest tenth. For example, 75 .11, 75 .12, 75 .13, and 75 .14 are
rounded down to 75 .1, while 75. 15, 75 .16, 75 .17, 75 .18, and 75 .19 are rounded up to 75 .2. The
length value will always be an integer. In another example, a target sequence containing a 20-
nucleotide region that aligns with 20 consecutive nucleotides from an identified sequence as

follows contains a region that shares 75 percent sequence identity to that identified sequence
(i.e., 15÷20* 100=75).
[0049] The term "amplification" refers to methods to increase the number of copies of a
nucleic acid molecule. The resulting amplification products are typically called "amplicons."
Amplification of a nucleic acid molecule (such as a DNA or RNA molecule) refers to use of a
technique that increases the number of copies of a nucleic acid molecule (including fragments).
In some examples, an amplicon is a nucleic acid from a cell, or acellular system, such as mRNA
or DNA that has been amplified.
[0050] An example of amplification is the polymerase chain reaction (PCR), in which a
sample is contacted with a pair of oligonucleotide primers under conditions that allow for the
hybridization of the primers to a nucleic acid template in the sample. The primers are extended
under suitable conditions, dissociated from the template, re-annealed, extended, and dissociated
to amplify the number of copies of the nucleic acid. This cycle can be repeated. The product of
amplification can be characterized by such techniques as electrophoresis, restriction
endonuclease cleavage patterns, oligonucleotide hybridization or ligation, and/or nucleic acid
sequencing.
[0051] Other examples of in vitro amplification techniques include quantitative real-time
PCR; reverse transcriptase PCR (RT-PCR); real-time PCR (rt PCR); real-time reverse
transcriptase PCR (rt RT-PCR); nested PCR; strand displacement amplification (see U.S. Patent
No. 5,744,3 11); transcription-free isothermal amplification (see U.S. Patent No. 6,033,88 1,
repair chain reaction amplification (see WO 90/01069); ligase chain reaction amplification (see
European patent publication EP-A-320 308); gap filling ligase chain reaction amplification (see
U.S. Patent No. 5,427,930); coupled ligase detection and PCR (see U.S. Patent No. 6,027,889);
and NASBA™ RNA transcription-free amplification (see U.S. Patent No. 6,025, 134) amongst
others
[0052] The term "primer" or "primers" refers to short nucleic acid molecules, such as a
DNA oligonucleotide, for example sequences of at least 15 nucleotides, which can be annealed
to a complementary nucleic acid molecule by nucleic acid hybridization to form a hybrid
between the primer and the nucleic acid strand. A primer can be extended along the nucleic acid
molecule by a polymerase enzyme. Therefore, primers can be used to amplify a nucleic acid
molecule, wherein the sequence of the primer is specific for the nucleic acid molecule, for

example so that the primer will hybridize to the nucleic acid molecule under very high
stringency hybridization conditions. The specificity of a primer increases with its length. Thus,
for example, a primer that includes 30 consecutive nucleotides will anneal to a sequence with a
higher specificity than a corresponding primer of only 15 nucleotides. Thus, to obtain greater
specificity, probes and primers can be selected that include at least 15, 20, 25, 30, 35, 40, 45, 50
or more consecutive nucleotides.
[0053] In particular examples, a primer is at least 15 nucleotides in length, such as at least
15 contiguous nucleotides complementary to a nucleic acid molecule. Particular lengths of
primers that can be used to practice the methods of the present disclosure, include primers
having at least 15, at least 16, at least 17, at least 18, at least 19, at least 20, at least 2 1, at least
22, at least 23, at least 24, at least 25, at least 26, at least 27, at least 28, at least 29, at least 30, at
least 31, at least 32, at least 33, at least 34, at least 35, at least 36, at least 37, at least 38, at least
39, at least 40, at least 45, at least 50, or more contiguous nucleotides complementary to the
target nucleic acid molecule to be amplified, such as a primer of 15-60 nucleotides, 15-50
nucleotides, or 15-30 nucleotides.
[0054] Primer pairs can be used for amplification of a nucleic acid sequence, for example,
by PCR, real-time PCR, or other nucleic-acid amplification methods known in the art. An
"upstream" or "forward" primer is a primer 5' to a reference point on a nucleic acid sequence. A
"downstream" or "reverse" primer is a primer 3' to a reference point on a nucleic acid sequence.
In general, at least one forward and one reverse primer are included in an amplification reaction.
PCR primer pairs can be derived from a known sequence, for example, by using computer
programs intended for that purpose such as Primer (Version 0.5, © 199 1, Whitehead Institute
for Biomedical Research, Cambridge, MA).
[0055] The term "probe" refers to an isolated nucleic acid capable of hybridizing to a
specific nucleic acid (such as a nucleic acid barcode or target nucleic acid). A detectable label or
reporter molecule can be attached to a probe. Typical labels include radioactive isotopes,
enzyme substrates, co-factors, ligands, chemiluminescent or fluorescent agents, haptens, and
enzymes. In some example, a probe is used to isolate and/or detect a specific nucleic acid.
[0056] Methods for labeling and guidance in the choice of labels appropriate for various
purposes are discussed, for example, in Sambrook et al, Molecular Cloning: A Laboratory

Manual, Cold Spring Harbor Laboratory Press (1989) and Ausubel et al, Current Protocols in
Molecular Biology, Greene Publishing Associates and Wiley-Intersciences (1987).
[0057] Probes are generally about 15 nucleotides in length to about 160 nucleotides in
length, such as 15, 16, 17, 18, 19, 20, 2 1, 22, 23, 24, 25, 26, 27, 28, 29, 30, 3 1, 32, 33, 34, 35,
36, 37, 38, 39, 40, 4 1, 42, 43, 44, 45, 46, 47, 48, 49, 50, 51, 52, 53, 54, 55, 56, 57, 58, 59, 60,
6 1, 62, 63, 64, 65, 66, 67, 68, 69, 70, 7 1, 72, 73, 74, 75, 76, 77, 78, 79, 80, 81, 82, 83, 84, 85,
86, 87, 88, 89, 90, 9 1, 92, 93, 94, 95, 96, 97, 98, 99, 100, 101, 102, 103, 104, 105, 106, 107,
108, 109, 110, 111, 112, 113, 114, 115, 116, 117, 118, 119, 120, 12 1, 122, 123, 124, 125, 126,
127, 128, 129, 130, 13 1, 132, 133, 134, 135, 136, 137, 138, 139, 140, 14 1, 142, 143, 144, 145,
146, 147, 148, 149, 150, 15 1, 152, 153, 154, 155, 156, 157, 158, 159, 160 contiguous
nucleotides complementary to the specific nucleic acid molecule, such as 50-140 nucleotides,
75-150 nucleotides, 60-70 nucleotides, 30-130 nucleotides, 20-60 nucleotides, 20-50
nucleotides, 20-40 nucleotides, or 20-30 nucleotides.
[0058] The term "optional" or "optionally" means that the subsequent described event,
circumstance or substituent may or may not occur, and that the description includes instances
where the event or circumstance occurs and instances where it does not.
[0059] The recitation of numerical ranges by endpoints includes all numbers and fractions
subsumed within t e respective ranges, as well as the recited endpoints.
[0060] The terms "about" or "approximately" as used herein when referring to a measurable
value such as a parameter, an amount, a temporal duration, and the like, are meant to encompass
variations of and from the specified value, such as variations of +/-10% or less, +/-5% or less,
+/-1% or less, and +/-0. 1% or less of and from t e specified value, insofar such variations are
appropriate to perform in the disclosed invention. It is to be understood that the value to which
the modifier "about" or "approximately" refers is itself also specifically, and preferably,
disclosed.
[0061] Reference throughout this specification to "one embodiment", "an embodiment,"
"an example embodiment," means that a particular feature, structure or characteristic described
in connection with the embodiment is included in at least one embodiment of the present
invention. Thus, appearances of the phrases "in one embodiment," "in an embodiment," or "an
example embodiment" in various places throughout this specification are not necessarily all
referring to the same embodiment, but may. Furthermore, the particular features, structures or

characteristics may be combined in any suitable manner, as would be apparent to a person
skilled in the art from this disclosure, in one or more embodiments. Furthermore, while some
embodiments described herein include some but not other features included in other
embodiments, combinations of features of different embodiments are meant to be within t e
scope of the invention. For example, in the appended claims, any of the claimed embodiments
can be used in any combination.
[0062] All publications, published patent documents, and patent applications cited herein are
hereby incorporated by reference to the same extent as though each individual publication,
published patent document, or patent application was specifically and individually indicated as
being incorporated by reference.
Overview
[0063] Future pandemics threaten human progress and must be detected early. The goal of
the present study was to achieve a sustainable, rapid-response surveillance system to detect
infectious disease outbreaks as soon as they appear. To do so, vast improvement is needed in
both diagnostic tools and the human resources to deploy them. The present invention therefore
relates to developing rapid pathogen sequencing for comprehensive microbial detection.
[0064] Rapid advances in DNA amplification and detection technology provide an
unprecedented capability to identify and characterize pathogens, and will soon enable
comprehensive and unbiased pathogen surveillance for early detection and prevention of future
epidemics. However, realizing its full potential for infectious disease surveillance and clinical
diagnosis present additional challenges, which require further investment and focused effort.
[0065] The present invention relates to a method for generating primers and/or probes for
use in analyzing a sample which may comprise a pathogen target sequence comprising
providing a set of input genomic sequence to one or more target pathogens, generating a set of
target sequences from the set of input genomic sequences, identifying one or more highly
conserved target sequences, and generating one or more primers, one or more probes, or a
primer pair and probe combination based on the one or more conserved target sequences.
[0066] In certain example embodiments, the methods for identifying highly conserved
sequences between genomic sequences of one or more target pathogens may comprise use a set
cover solving process. The set cover solving process may identify the minimal number of probes
needed to cover one or more conserved target sequence. Set cover approaches have been used

previously to identify primers and/or microarray probes, typically in the 20 to 50 base pair
range. See, e.g. Pearson et al, cs.virginia.edu/~robins/papers/primers_damll_final.pdf, Jabado
et al. Nucleic Acids Res. 2006 34(22):6605-l 1, Jabado et al. Nucleic Acids Res. 2008, 36(l):e3
doil0.1093/nar/gkmll06, Duitama et al. Nucleic Acids Res. 2009, 37(8):2483-2492, Phillippy
et al. BMC Bioinformatics . 2009, 10:293 doi: 10. 1186/147 1-2 105- 10-293 . However, such
approaches generally involved treating each primer/probe as k-mers and searching for exact
matches or allowing for inexact matches using suffix arrays. In addition, t e methods generally
take a binary approach to detecting hybridization by selecting primers or probes such that each
input sequence only needs to be bound by one primer or probe and the position of this binding
along the sequence is irrelevant. Alternative methods may divide a target genome into pre
defined windows and effectively treat each window as a separate input sequence under the
binary approach - i.e., they determine whether a given primer or probe binds within each
window and require that all of the windows be bound by the state of some primer or probe.
Effectively, these approaches treat each element of the "universe" in the set cover problem as
being either an entire input sequence or a pre-defined window of an input sequence, and each
element is considered "covered" if the start of a probe binds within the element. These
approaches limit the fluidity to which different primer or probe designs are allowed to cover a
given target sequence.
[0067] In contrast, the methods disclosed herein take a pan-target sequence approach
capable of defining a probe set that can identify and increase the sensitivity of pathogen
detection assays by identifying highly conserved regions shared among multiple variants of the
same pathogen or across different pathogens. For example, the methods disclosed herein may be
used to identify all variants of a given virus, or multiple different viruses in a single assay. In
addition, the methods disclosed herein may be used to detect all variants of a parasitic pathogen,
or multiple different parasitic pathogens in a single assay. Further, the methods disclosed herein
treat each element of the "universe" in the set cover problem as being a nucleotide of a target
sequence, and each element is considered "covered" as long as a probe binds to some segment
of a target genome that includes the element. Instead of the binary approach of previous
methods, the methods disclosed herein better model how a probe, and in particular larger
probes, may hybridize to a target sequence. Rather than only asking if a given sequence does or
does not bind to a given window, embodiments disclosed herein first determine a hybridization

pattern - i.e., where a given probe binds to a target sequence or target sequences - and then
determines from those hybridization patterns of highly conserved sequences with low to now
variability between sequences. These hybridization patterns may be determined by defining
certain parameters that minimize a loss function, thereby enabling identification of minimal
primer and probes sets in a way that allows parameter to vary for each species, e.g., to reflect the
diversity of each species, as well as in a computationally efficient manner that cannot be
achieved using a straightforward application of a set cover solution, such as those previously
applied in the primer and microarray probe design context.
[0068] A primer in accordance with the invention may be an oligonucleotide for example
deoxyribonucleic acid (DNA), ribonucleic acid (RNA), peptide nucleic acid (PNA), or other
non-naturally occurring nucleic acid. A probe, a candidate probe, or a selected probe may be a
nucleic acid sequence, the nucleic acid being, for example, deoxyribonucleic acid (DNA),
ribonucleic acid (RNA), peptide nucleic acid (PNA), or other non-naturally occurring nucleic
acid.
[0069] A sample as described herein may be a biological sample, for example a blood,
buccal, cell, cerebrospinal fluid, mucus, saliva, semen, tissue, tumor, feces, urine, and/or vaginal
sample. A sample may be obtained from an animal, a plant, or a fungus. The animal may be a
mammal. The mamma may be a primate. The primate may be a human n other embodiments,
the sample may be an environmental sample, such as water, soil, or a surface, such as an
industrial or medical surface.
[0070] As used herein, "target sequence" is intended to designate either one target sequence
or more than one target sequence, i.e., any sequence of interest at which the analysis is aimed.
Thus, the sample may comprise more than one target sequence and preferably a plurality of
target sequences. The target sequence may be a nucleotide sequence. The nucleotide sequence
may be a DNA sequence, a RNA sequence, or a mixture thereof.
[0071] The set of target sequences may comprise obtaining a nucleic acid array (e.g., a
microarray chip) and synthesizing a set of synthetic oligonucleotides, and removing the
oligonucleotides from the microarray (e.g., by cleavage or elution) to produce a set of target
sequences. Synthesis of oligonucleotides in an array format (e.g., chip) permits synthesis of a
large number of sequences simultaneously, thereby providing a set of target sequences for the

methods of selection. The array synthesis also has the advantages of being customizable and
capable of producing long oligonucleotides.
[0072] The target sequences may be prepared from the whole genome of the target
pathogen, for example, where t e target sequences are prepared by a method that includes
fragmenting genomic DNA of the target pathogen (e.g., where the fragmented target sequences
are end-labeled with oligonucleotide sequences suitable for PCR amplification or where the
target sequences are prepared by a method including attaching an RNA promoter sequence to
the genomic DNA fragments and preparing the target sequences by transcribing (e.g., using
biotinylated ribonucleotides) the DNA fragments into RNA. The target sequences may be
prepared from specific regions of the target organism genome (e.g., are prepared synthetically).
In certain embodiments, the target sequences are labeled with an affinity tag. In certain example
embodiments, the affinity tag is biotin, a hapten, or an affinity tag, or the target sequences are
generated using biotinylated primers, e.g., where the target sequences are generated by nick-
translation labeling of purified target organism DNA with biotinylated deoxynucleotides. In
cases where the target sequences are biotinylated, the target DNA can be captured using a
streptavidin molecule attached to a solid phase. The target sequences may be appended by
adapter sequences suitable for PCR amplification, sequencing, or RNA transcription. The target
sequences may include a RNA promoter or are RNA molecules prepared from DNA containing
an RNA promoter (e.g., a T7 RNA promoter).
[0073] Constructing the target sequence may comprise fragmenting the reference genomic
sequences into fragments of equal size that overlap one another, so that the overlap between two
fragments is half the size of the fragment, for example a 2x tiling as illustrated in FIG. 2 .
[0074] As used herein, "individual hybridization pattern" is intended to designate the
coverage capacity of one probe, /.e., the portion of the reference sequences to which the target
sequence is capable of aligning or hybridizing to. More generally, when used with respect to a
plurality of target sequence, "hybridization pattern" is intended to designate the collective
coverage capacity of the plurality of target sequences, i.e. the collection of subsequences of the
reference sequence which at least one of the target sequences of the plurality of target sequences
is capable of hybridizing or aligning to or to which at least one of the target sequences is
redundant once aligned to the reference genomic sequence.

[0075] A set cover solving process may be used to identify target sequences that are highly
conserved among the input genomic sequences. A set cover solving process may refer to any
process that approximates the solution to t e set cover problem or a problem equivalent to t e
set cover problem (see, e.g., Introduction to Algorithms (mitpress.mit.edu/books/introduction-
algorithms) and cc.gatech.edu/fac/Vijay.Vazirani/book.pdf). A set cover problem may be
described as follows: given a set of elements {1, 2 ... / ... m}, called the universe U, and a
collection S οΐ n subsets whose union covers the universe, the set cover problem is to identify
the smallest set of subsets whose union equals the universe.
[0076] As used herein, "reference genomic sequence" is intended to encompass the singular
and the plural. As such, when referring to a reference sequence, the cases where more than one
reference sequence is also contemplated. Preferably, the reference sequence is a plurality of
reference sequences, the number of which may be over 30; 50; 70; 100; 200; 300; 500; 1,000
and above. In certain example embodiments, the reference sequence is a genomic sequence. In
certain example embodiments, the reference sequence is a plurality of genomic sequences. In
certain example embodiments, the reference sequence is a plurality of genomic sequences from
the same species or viral strain. In certain other example embodiments, the reference sequence is
a plurality of genomic sequences from different species or viral strains.
[0077] In one embodiment, the reference sequence may be a collection of genomes of one
type of virus, wherein the genomes collectively form a universe of elements that are the
nucleotides (position within the genomes being considered as differentiating nucleotides of the
same type). In another embodiment, each genome may make up one universe so that the
problem as a whole becomes a multi-universe problem. Multi-universe may be a unique
generalization of the set cover problem. In this instance, separate universes may be helpful for
thinking about partial set cover, so that this way, a partial cover yields a desired partial coverage
of each genome (i. e., each universe). If the problem is imagined as being composed of a single
universe, thinking about partial coverage may be considered as covering a desired fraction of the
concatenation of all the genomes, rather than a desired fraction of each genome.
[0078] If X designates a genome and y designates a position within the corresponding
genome, an element of the universe can be represented by (X, y), which is understood as the
nucleotide in position y in genome X . Candidate probes are obtaining by fragmenting the
collection of genomes. The individual hybridization patterns are subsets of the universe. The

individual hybridization pattern of a candidate probe of length L can be represented as {(A, ai),
(A, ai+1) ... (A, ai+L), (A, aj), (A, aj+1) ... (A, aj+L), (B, bi), (B, bi+1) ... (B, bi+L) ...},
otherwise represented as {A:(ai ... ai+L), (aj ... aj+L); B:(b l ... bl+L) ...} (subset covering
nucleotides in position ai to ai+L and aj to aj+L in genome A, nucleotides in position bi to bi+L
in genome B ...) .
[0079] In certain example embodiments, the target genomic sequences are viral genomic
sequences. The viral sequences may be variants of the same viral strain, different viruses, or a
combination thereof. A hybridization pattern is determined for the target sequences. To model a
hybridization pattern, a number of different parameters may be defined to determine whether a
given target sequence is considered to hybridize to a given portion of a reference genomic
sequence. In addition, a percent of coverage parameter may be set to define t e percent of t e
target sequence that should be covered by the probe set. This value may range from a fraction of
a percent to 100% of the genome. In certain example embodiments, this may range from 0.0 1%
to 10%, l % to 5%, l % to 10%, l% to 15%, l % to 20%, l % to 25%, or the like.
[0080] In certain example embodiments, a number of mismatch parameters is defined. The
number of mismatches defines a number of mismatches that may be present between a probe
and a given portion of a target sequence. This value may range from 0 to 10 base pairs.
[0081] In certain example embodiments, another parameter, called the "island of exact
match" substring, may be used to model hybridization between a probe and nucleic acid
fragment. Let its value be x . When determining whether a probe covers a sequence, a value is
set that defines a stretch of at least x bp in the probe that exactly matches (i.e., with no
mismatches) a stretch of a target sequence. Along with the other parameters, this is applied as a
filter to decide whether a probe should be deemed as hybridizing to a portion of a target
sequence. The value may vary, but is usually set to be 30 bp. Setting its value to 0 would
effectively remove this filter when determining hybridization patterns.
[0082] In certain other example embodiments, a longest common substring parameter may
be set. This parameter defines that a probe only hybridizes if the longest common substring up
to a certain amount of mismatches is at least that parameter. For example, if the parameter is set
to 80 base pair with 3 mismatches, then a probe will still be considered to hybridized to a
portion of a target sequence if there is string of 80 base pairs that match the target sequence,
even if within that stretch, there are up to 3 mismatches. So, an 80-base-pair string that matches

except for two mismatches would be considered to be hybridized, but an 80-base-pair string that
matches except for 4 mismatches would not be considered to hybridize. This parameter may
range from a string of 20 to 175 base pairs with anywhere from 0 to 9 mismatches in that string.
[0083] In certain other example embodiments, an overhang or cover extension parameter
may be set. This parameter indicates that once a probe is found to hybridize, that probe will be
considered to cover, or account for, X additional base pairs upstream and downstream of where
the probe has bound. This parameter allows the number of total probes required to be reduced
further because it will be understood that a probe, e.g., 100 base pairs, will not only account for
the 100 base pairs portion it directly binds to, but may be reliably considered to capture a
fragment that is at least 50 base pairs longer than the 100 base pair string. This parameter may
vary between 0 and 200. In certain example embodiments, this parameter is set to 50.
[0084] This can be used, for example, in sequencing genomes of a virus for which a
collection of genomes is available from previous studies, such as Zika virus. The collection of
available genomes from previous studies is taken as reference target. One aim may be the study
and monitoring of the evolution of the virus, for example throughout an outbreak, in order to
determine proper actions to be taken for containing the outbreak and stopping it by sequencing
regularly, if not systematically, the genome of the virus that infects a patient known to have
contracted it.
[0085] The set cover solving process may be a weighted set cover solving process, i.e., each
of the individual hybridization patterns is allocated a weight.
[0086] For example, a lower weight is allocated to those individual hybridization patterns
that correspond to candidate target sequences that are specific to the reference sequence and a
higher weight is allocated to those individual hybridization patterns that correspond to target
sequences that are not specific to the reference sequence. Thus, the method may further
comprise determining the specificity of each target sequence with regard to the reference
sequence. For example, determining the stringency of hybridization may be indicative of the
specificity of the target sequence. The higher weight is determined based on when a target
sequence hybridizes to some other reference sequence (not a target). Another mismatch
parameter may be utilized when assigning higher weights, which is usually a looser and more
tolerant value. For example, there may be a mismatch parameter with a value of 3 for
determining whether a target sequence hybridizes to a region of a reference sequence, but a

separate tolerant mismatch parameter with a value of 10 for determining whether a probe hits a
blacklisted sequence or more than one virus type in identification. The reason is desired
increased sensitivity in determining these kinds of hits and more specificity in determining
where target sequence cover reference sequences.
[0087] The weighted set cover solving process makes it possible to reduce substantially, if
not dramatically, the number of selected target sequences that are highly conserved among
reference sequences.
[0088] In certain example embodiments, the reference sequence forms a universe of
elements that are the nucleotides (positions within the genomes being considered as
differentiating nucleotides of the same type). If X designates the target sequence and y
designates a position within the corresponding genome, an element of the universe can be
represented by (X, y), which is understood as the nucleotide in position y in the target sequence
X, or simply (y) because all y belongs to the same target sequence. Target sequences are
obtained by fragmenting the reference sequence. It is then determined which target sequences
are specific to the reference sequence and which are not. The individual hybridization patterns
are subsets of the universe. The individual hybridization pattern of a target sequence of length L
and which is specific to the reference sequence can be represented as (w, {(ai), (ai+1) ... (ai+L),
(aj), (aj+1) ... (aj+L) }), otherwise represented as (w, {(ai... ai+L), (aj... aj+L)}) (subset
covering nucleotides in position ai to ai+L ... and aj to aj+L to which a weight w is given). The
individual hybridization pattern of a target sequence of length L and which is not specific to the
reference sequence would be represented in the same manner but will receive weight W instead,
wherein W > w, preferably W » w, more preferably W is infinity and w is 1.
[0089] If the reference sequence is a collection of reference sequences, then the individual
hybridization pattern of a candidate probe of length L and which is specific to the reference
sequence can be represented as (V, {(A, ai), (A, ai+1) ... (A, ai+L), (A, aj), (A, aj+1) ... (A,
aj+L), (B, bi), (B, bi+1) ... (B, bi+L) ...}), otherwise represented as (V, {A:(ai... ai+L), (aj...
aj+L); B:(bi... bi+L)... }) (subset covering nucleotides in position ai to ai+L and aj to aj+L in
genome A, nucleotides in position bi to bi+L in genome B ... to which a weight V is given).
[0090] Allocating the same weight to all the individual hybridization patterns amounts to an
un-weighted set cover solving process, in other words, a set cover solving process without

allocation of any weight, such as described above. Both weighted set cover solving process and
un-weighted set cover solving process are contemplated by the invention.
[0091] A higher number of allowed mismatches for the weighted than for the un-weighted
set cover solving process may be used, which is considered to be a separate, more tolerant
parameter choice - in addition to the regular mismatch parameter that would be used (in the un
weighted problem) for determining hybridizations to target sequences. But, if the higher number
does not replace t e lower number, it is an additional parameter.
[0092] One example of a process that approximates the solution to the set cover problem is
the greedy method. The greedy method is an iterative method wherein at each iteration, the
solution that appears the best is chosen. When applied to the set cover problem at each iteration,
the subset with the widest coverage of the yet uncovered universe is selected and the elements
covered by the subset with the widest coverage are deleted from the yet uncovered universe.
This is repeated until all the selected subsets collectively cover the entire universe, in other
words, the yet uncovered universe, is empty.
[0093] Within the scope of the invention, this means that, at each iteration, the target
sequence with the widest individual hybridization pattern within yet uncovered portions of the
reference sequence is selected as one of the selected target sequences. The selection is repeated
among the remaining target sequences until the selected probes collectively have a hybridization
pattern that equals the desired coverage percentage of the reference sequences.
[0094] The method may further comprise minimizing a loss function depending on
overhang parameters and mismatch parameters (or any parameters that alters the number of
output probes) such that the total number of selected probes is no higher than a threshold
number to provide input parameters to the set cover solving process. An overhang parameter
("cover extension") determines the number of nucleotides of one or both ends of a target
sequence or a fragment thereof that remain unpaired once the target sequence or the fragment
thereof hybridizes a selected probe. The higher the overhang parameter is, the lower the number
of selected probes output by the set cover solving process. The value of the overhang parameters
can range from 0 to 200 bp, and any sub-range therein. A mismatch parameter is the acceptable
number of mismatches between a selected probe and the target sequence or the fragment
thereof. The higher the mismatch parameter is, the lower the number of selected probes. In
certain example embodiments, the mismatch parameter may have a range from 0 to 9 .

[0095] In the case of a plurality of target sequence types, one overhang parameter and one
mismatch parameter is assigned to each reference sequence or types thereof. The values of t e
overhang and mismatch parameters may be indicative of the diversity of the reference sequence,
especially when selecting these parameters under the constraint of having a fixed number of
probes.
[0096] The loss function is constructed so that the higher the value of the overhang
parameter, the higher the value of the loss function, and the higher the value of the mismatch
parameter, the higher the value of the loss function.
[0097] The use of a constraint while minimizing the loss function ensures that the number of
selected probes remains lower than a reasonable amount, depending on the application of the
selected probes.
[0098] The selected primers or probe can be used in a composition form, as part of a kit or a
system for detection of pathogen nucleic acids sequence. The kit may comprise primers and/or
probes generated from the identified target sequences, e.g., in a composition form, and a solid
phase operably linked to the selected probes. The system may comprise the selected probes, i.e.,
in a composition form; a sample containing DNA of said target organism and the non-specific
DNA; and a solid phase operably connected to the selected probes.
[0099] The solid phase may be a chip or beads. The selected probes may further comprise an
adapter, for example a label. Each selected probe may comprise two adapters. Preferably, a first
adapter is alternated with a second adapter.
[00100] As described in aspects of the invention, sequence identity is related to sequence
homology. Homology comparisons may be conducted by eye, or more usually, with the aid of
readily available sequence comparison programs. These commercially available computer
programs may calculate percent (%) homology between two or more sequences and may also
calculate the sequence identity shared by two or more amino acid or nucleic acid sequences.
[0100] Sequence homologies may be generated by any of a number of computer programs
known in the art, for example BLAST or FASTA, etc. A suitable computer program for carrying
out such an alignment is the GCG Wisconsin Bestfit package (University of Wisconsin, U.S.A;
Devereux et al., 1984, Nucleic Acids Research 12:387). Examples of other software than may
perform sequence comparisons include, but are not limited to, the BLAST package (see Ausubel
et al., 1999 ibid - Chapter 18), FASTA (Atschul et al., 1990, J . Mol. Biol., 403-410) and the

GENEWORKS suite of comparison tools. Both BLAST and FASTA are available for offline
and online searching (see Ausubel et al, 1999 ibid, pages 7-58 to 7-60). However it is preferred
to use the GCG Bestfit program. % homology may be calculated over contiguous sequences,
i.e., one sequence is aligned with the other sequence and each amino acid or nucleotide in one
sequence is directly compared with t e corresponding amino acid or nucleotide in t e other
sequence, one residue at a time. This is called an "ungapped" alignment. Typically, such
ungapped alignments are performed only over a relatively short number of residues. Although
this is a very simple and consistent method, it fails to take into consideration that, for example,
in an otherwise identical pair of sequences, one insertion or deletion may cause the following
amino acid residues to be put out of alignment, thus potentially resulting in a large reduction in
% homology when a global alignment is performed. Consequently, most sequence comparison
methods are designed to produce optimal alignments that take into consideration possible
insertions and deletions without unduly penalizing the overall homology or identity score. This
is achieved by inserting "gaps" in the sequence alignment to try to maximize local homology or
identity. However, these more complex methods assign "gap penalties" to each gap that occurs
in the alignment so that, for the same number of identical amino acids, a sequence alignment
with as few gaps as possible - reflecting higher relatedness between the two compared
sequences - may achieve a higher score than one with many gaps. "Affinity gap costs" are
typically used that charge a relatively high cost for the existence of a gap and a smaller penalty
for each subsequent residue in the gap. This is the most commonly used gap scoring system.
High gap penalties may, of course, produce optimized alignments with fewer gaps. Most
alignment programs allow the gap penalties to be modified. However, it is preferred to use the
default values when using such software for sequence comparisons. For example, when using
the GCG Wisconsin Bestfit package, the default gap penalty for amino acid sequences is -12 for
a gap and -4 for each extension. Calculation of maximum % homology, therefore, first requires
the production of an optimal alignment, taking into consideration gap penalties. A suitable
computer program for carrying out such an alignment is the GCG Wisconsin Bestfit package
(Devereux et al., 1984 Nuc. Acids Research 12 p387). Examples of other software than may
perform sequence comparisons include, but are not limited to, the BLAST package (see Ausubel
et al, 1999 Short Protocols in Molecular Biology, 4th Ed. - Chapter 18), FASTA (Altschul et
al, 1990 J . Mol. Biol. 403-4 10) and the GENEWORKS suite of comparison tools. Both BLAST

and FASTA are available for offline and online searching (see Ausubel et al., 1999, Short
Protocols in Molecular Biology, pages 7-58 to 7-60). However, for some applications, it is
preferred to use the GCG Bestfit program. A new tool, called BLAST 2 Sequences is also
available for comparing protein and nucleotide sequences (see FEMS Microbiol Lett. 1999
174(2): 247-50; FEMS Microbiol Lett. 1999 177(1): 187-8 and the website of the National
Center for Biotechnology information at the website of t e National Institutes for Health).
Although t e final % homology may be measured in terms of identity, the alignment process
itself is typically not based on an all-or-nothing pair comparison. Instead, a scaled similarity
score matrix is generally used that assigns scores to each pair-wise comparison based on
chemical similarity or evolutionary distance. An example of such a matrix commonly used is the
BLOSUM62 matrix - the default matrix for the BLAST suite of programs. GCG Wisconsin
programs generally use either the public default values or a custom symbol comparison table, if
supplied (see user manual for further details). For some applications, it is preferred to use the
public default values for the GCG package, or in the case of other software, the default matrix,
such as BLOSUM62.
[0101] Alternatively, percentage homologies may be calculated using the multiple alignment
feature in DNASISTM (Hitachi Software), based on an algorithm, analogous to CLUSTAL
(Higgins DG & Sharp PM (1988), Gene 73(1), 237-244). Once the software has produced an
optimal alignment, it is possible to calculate % homology, preferably % sequence identity. The
software typically does this as part of the sequence comparison and generates a numerical result.
[0102] Embodiments of the invention include sequences (both polynucleotide or
polypeptide) which may comprise homologous substitution (substitution and replacement are
both used herein to mean the interchange of an existing amino acid residue or nucleotide, with
an alternative residue or nucleotide) that may occur i.e., like-for-like substitution in the case of
amino acids, such as basic for basic, acidic for acidic, polar for polar, etc. Non-homologous
substitution may also occur i.e., from one class of residue to another or alternatively involving
the inclusion of unnatural amino acids such as ornithine (hereinafter referred to as Z),
diaminobutyric acid ornithine (hereinafter referred to as B), norleucine ornithine (hereinafter
referred to as O), pyriylalanine, thienylalanine, naphthylalanine and phenylglycine.
[0103] The practice of the present invention employs, unless otherwise indicated,
conventional techniques of immunology, biochemistry, chemistry, molecular biology,

microbiology, cell biology, genomics and recombinant DNA, which are within t e skill of t e
art. See Sambrook, Fritsch and Maniatis, MOLECULAR CLONING: A LABORATORY
MANUAL, 2nd edition (1989); CURRENT PROTOCOLS IN MOLECULAR BIOLOGY (F.
M . Ausubel, et al. eds., (1987)); the series METHODS IN ENZYMOLOGY (Academic Press,
Inc.): PCR 2 : A PRACTICAL APPROACH (M.J. MacPherson, B.D. Hames and G.R Taylor
eds. (1995)), Harlow and Lane, eds. (1988) ANTIBODIES, A LABORATORY MANUAL, and
ANIMAL CELL CULTURE (R.I. Freshney, ed. (1987)).
[0104] Hybridization can be performed under conditions of various stringency. Suitable
hybridization conditions for the practice of the present invention are such that the recognition
interaction between the probe and sequences associated with a signaling biochemical pathway is
both sufficiently specific and sufficiently stable. Conditions that increase the stringency of a
hybridization reaction are widely known and published in the art. See, for example, (Sambrook,
et al., (1989); Nonradioactive In Situ Hybridization Application Manual, Boehringer Mannheim,
second edition). The hybridization assay can be formed using probes immobilized on any solid
support, including but are not limited to nitrocellulose, glass, silicon, and a variety of gene
arrays. A preferred hybridization assay is conducted on high-density gene chips as described in
U.S. Patent No. 5,445,934.
[0105] For a convenient detection of the probe-target complexes formed during the
hybridization assay, the nucleotide probes are conjugated to a detectable label. Detectable labels
suitable for use in the present invention include any composition detectable by photochemical,
biochemical, spectroscopic, immunochemical, electrical, optical or chemical means. A wide
variety of appropriate detectable labels are known in the art, which include fluorescent or
chemiluminescent labels, radioactive isotope labels, enzymatic or other ligands. In preferred
embodiments, one will likely desire to employ a fluorescent label or an enzyme tag, such as
digoxigenin, β-galactosidase, urease, alkaline phosphatase or peroxidase, avidin/biotin complex.
[0106] The detection methods used to detect or quantify the hybridization intensity will
typically depend upon the label selected above. For example, radiolabels may be detected using
photographic film or a phosphoimager. Fluorescent markers may be detected and quantified
using a photodetector to detect emitted light. Enzymatic labels are typically detected by
providing the enzyme with a substrate and measuring the reaction product produced by the

action of the enzyme on the substrate; and finally colorimetric labels are detected by simply
visualizing the colored label.
[0107] Examples of the labeling substance which may be employed include labeling
substances known to those skilled in the art, such as fluorescent dyes, enzymes, coenzymes,
chemiluminescent substances, and radioactive substances. Specific examples include
radioisotopes (e.g., 32P, 14C, 1251, 3H, and 13 11), fluorescein, rhodamine, dansyl chloride,
umbelliferone, luciferase, peroxidase, alkaline phosphatase, β-galactosidase, β-glucosidase,
horseradish peroxidase, glucoamylase, lysozyme, saccharide oxidase, microperoxidase, biotin,
and ruthenium. In t e case where biotin is employed as a labeling substance, preferably, after
addition of a biotin-labeled antibody, streptavidin bound to an enzyme (e.g., peroxidase) is
further added.
[0108] Advantageously, the label is a fluorescent label. Examples of fluorescent labels
include, but are not limited to, Atto dyes, 4-acetamido-4'-isothiocyanatostilbene-2,2'disulfonic
acid; acridine and derivatives: acridine, acridine isothiocyanate; 5-(2'-
aminoethyl)aminonaphthalene-l -sulfonic acid (EDANS); 4-amino-N-[3-
vinylsulfonyl)phenyl]naphthalimide-3,5 disulfonate; N-(4-anilino-l-naphthyl)maleimide;
anthranilamide; BODIPY; Brilliant Yellow; coumarin and derivatives; coumarin, 7-amino-4-
methylcoumarin (AMC, Coumarin 120), 7-amino-4-trifluoromethylcouluarin (Coumaran 15 1);
cyanine dyes; cyanosine; 4',6-diaminidino-2-phenylindole (DAPI); 5'5"-dibromopyrogallol-
sulfonaphthalein (Bromopyrogallol Red); 7-diethylamino-3-(4'-isothiocyanatophenyl)-4-
methylcoumarin; diethylenetriamine pentaacetate; 4,4'-diisothiocyanatodihydro-stilbene-2,2'-
disulfonic acid; 4,4'-diisothiocyanatostilbene-2,2'-disulfonic acid; 5-
[dimethylamino]naphthalene-l-sulfonyl chloride (DNS, dansylchloride); 4-
dimethylaminophenylazophenyl-4'-isothiocyanate (DABITC); eosin and derivatives; eosin,
eosin isothiocyanate, erythrosin and derivatives; erythrosin B, erythrosin, isothiocyanate;
ethidium; fluorescein and derivatives; 5-carboxyfluorescein (FAM), 5-(4,6-dichlorotriazin-2-
yl)aminofluorescein (DTAF), 2',7 '-dimethoxy-4'5'-dichloro-6-carboxyfluorescein, fluorescein,
fluorescein isothiocyanate, QFITC, (XRITC); fluorescamine; IR144; IR1446; Malachite Green
isothiocyanate; 4-methylumbelliferoneortho cresolphthalein; nitrotyrosine; pararosaniline;
Phenol Red; B-phycoerythrin; o-phthaldialdehyde; pyrene and derivatives: pyrene, pyrene
butyrate, succinimidyl 1-pyrene; butyrate quantum dots; Reactive Red 4 (Cibacron™ Brilliant

Red 3B-A) rhodamine and derivatives: 6-carboxy-X-rhodamine (ROX), 6-carboxyrhodamine
(R6G), lissamine rhodamine B sulfonyl chloride rhodamine (Rhod), rhodamine B, rhodamine
123, rhodamine X isothiocyanate, sulforhodamine B, sulforhodamine 10 1, sulfonyl chloride
derivative of sulforhodamine 10 1 (Texas Red); Ν ,Ν ,Ν ',Ν ' tetramethyl-6-carboxyrhodamine
(TAMRA); tetramethyl rhodamine; tetramethyl rhodamine isothiocyanate (TRITC); riboflavin;
rosolic acid; terbium chelate derivatives; Cy3; Cy5; Cy5 .5; Cy7; IRD 700; IRD 800; La Jolta
Blue; phthalo cyanine; and naphthalo cyanine.
[0109] The fluorescent label may be a fluorescent protein, such as blue fluorescent protein,
cyan fluorescent protein, green fluorescent protein, red fluorescent protein, yellow fluorescent
protein or any photoconvertible protein. Colorimetric labeling, biolumine scent labeling and/or
chemiluminescent labeling may further accomplish labeling. Labeling further may include
energy transfer between molecules in t e hybridization complex by perturbation analysis,
quenching, or electron transport between donor and acceptor molecules, t e latter of which may
be facilitated by double stranded match hybridization complexes. The fluorescent label may be a
perylene or a terrylen. In the alternative, the fluorescent label may be a fluorescent bar code.
[0110] In an advantageous embodiment, the label may be light sensitive, wherein the label is
light-activated and/or light cleaves the one or more linkers to release the molecular cargo. The
light-activated molecular cargo may be a major light-harvesting complex (LHCII). In another
embodiment, the fluorescent label may induce free radical formation.
[0111] In an advantageous embodiment, agents may be uniquely labeled in a dynamic
manner (see, e.g., international patent application serial no. PCT/US20 13/6 1182 filed September
23, 2012). The unique labels are, at least in part, nucleic acid in nature, and may be generated by
sequentially attaching two or more detectable oligonucleotide tags to each other and each unique
label may be associated with a separate agent. A detectable oligonucleotide tag may be an
oligonucleotide that may be detected by sequencing of its nucleotide sequence and/or by
detecting non-nucleic acid detectable moieties to which it may be attached.
[0112] The oligonucleotide tags may be detectable by virtue of their nucleotide sequence, or
by virtue of a non-nucleic acid detectable moiety that is attached to the oligonucleotide such as,
but not limited to, a fluorophore, or by virtue of a combination of their nucleotide sequence and
the non-nucleic acid detectable moiety.

[0113] In some embodiments, a detectable oligonucleotide tag may comprise one or more
non-oligonucleotide detectable moieties. Examples of detectable moieties may include, but are
not limited to, fluorophores, microparticles, including quantum dots (Empodocles, et al., Nature
399: 126-130, 1999), gold nanoparticles (Reichert et al, Anal. Chem. 72:6025-6029, 2000),
biotin, DNP (dinitrophenyl), fucose, digoxigenin, haptens, and other detectable moieties known
to those skilled in the art. In some embodiments, the detectable moieties may be quantum dots.
Methods for detecting such moieties are described herein and/or are known in the art.
[0114] Thus, detectable oligonucleotide tags may be, but are not limited to, oligonucleotides
that may comprise unique nucleotide sequences, oligonucleotides that may comprise detectable
moieties, and oligonucleotides that may comprise both unique nucleotide sequences and
detectable moieties.
[0115] A unique label may be produced by sequentially attaching two or more detectable
oligonucleotide tags to each other. The detectable tags may be present or provided in a plurality
of detectable tags. The same or a different plurality of tags may be used as the source of each
detectable tag may be part of a unique label. In other words, a plurality of tags may be
subdivided into subsets and single subsets may be used as the source for each tag.
[0116] A unique nucleotide sequence may be a nucleotide sequence that is different (and
thus distinguishable) from the sequence of each detectable oligonucleotide tag in a plurality of
detectable oligonucleotide tags. A unique nucleotide sequence may also be a nucleotide
sequence that is different (and thus distinguishable) from the sequence of each detectable
oligonucleotide tag in a first plurality of detectable oligonucleotide tags but identical to the
sequence of at least one detectable oligonucleotide tag in a second plurality of detectable
oligonucleotide tags. A unique sequence may differ from other sequences by multiple bases (or
base pairs). The multiple bases may be contiguous or non-contiguous. Methods for obtaining
nucleotide sequences (e.g., sequencing methods) are described herein and/or are known in the
art.
[0117] In some embodiments, detectable oligonucleotide tags comprise one or more of a
ligation sequence, a priming sequence, a capture sequence, and a unique sequence (optionally
referred to herein as an index sequence). A ligation sequence is a sequence complementary to a
second nucleotide sequence which allows for ligation of the detectable oligonucleotide tag to
another entity which may comprise the second nucleotide sequence, e.g., another detectable

oligonucleotide tag or an oligonucleotide adapter. A priming sequence is a sequence
complementary to a primer, e.g., an oligonucleotide primer used for an amplification reaction
such as but not limited to PCR. A capture sequence is a sequence capable of being bound by a
capture entity. A capture entity may be an oligonucleotide which may comprise a nucleotide
sequence complementary to a capture sequence, e.g. a second detectable oligonucleotide tag. A
capture entity may also be any other entity capable of binding to the capture sequence, e.g. an
antibody, hapten, or peptide. An index sequence is a sequence that may comprise a unique
nucleotide sequence and/or a detectable moiety as described above.
[0118] The present invention also relates to a computer system involved in carrying out t e
methods of the invention relating to both computations and sequencing.
[0119] A computer system (or digital device) may be used to receive, transmit, display
and/or store results, analyze the results, and/or produce a report of the results and analysis. A
computer system may be understood as a logical apparatus that can read instructions from media
(e.g., software) and/or network port (e.g., from the internet), which can optionally be connected
to a server having fixed media. A computer system may comprise one or more of a CPU, disk
drives, input devices such as keyboard and/or mouse, and a display (e.g., a monitor). Data
communication, such as transmission of instructions or reports, can be achieved through a
communication medium to a server at a local or a remote location. The communication medium
can include any means of transmitting and/or receiving data. For example, the communication
medium can be a network connection, a wireless connection, or an internet connection. Such a
connection can provide for communication over the World Wide Web. It is envisioned that data
relating to the present invention can be transmitted over such networks or connections (or any
other suitable means for transmitting information, including but not limited to mailing a physical
report, such as a print-out) for reception and/or for review by a receiver. The receiver can be, but
is not limited to an individual, or electronic system (e.g., one or more computers, and/or one or
more servers).
[0120] In some embodiments, the computer system may comprise one or more processors.
Processors may be associated with one or more controllers, calculation units, and/or other units
of a computer system, or implanted in firmware as desired. If implemented in software, the
routines may be stored in any computer readable memory such as in RAM, ROM, flash
memory, a magnetic disk, a laser disk, or other suitable storage medium. Likewise, this software

may be delivered to a computing device via any known delivery method including, for example,
over a communication channel such as a telephone line, the internet, a wireless connection, etc.,
or via a transportable medium, such as a computer readable disk, flash drive, etc. The various
steps may be implemented as various blocks, operations, tools, modules and techniques which,
in turn, may be implemented in hardware, firmware, software, or any combination of hardware,
firmware, and/or software. When implemented in hardware, some or all of the blocks,
operations, techniques, etc. may be implemented in, for example, a custom integrated circuit
(IC), an application specific integrated circuit (ASIC), a field programmable logic array
(FPGA), a programmable logic array (PLA), etc.
[0121] A client-server, relational database architecture can be used in embodiments of t e
invention. A client-server architecture is a network architecture in which each computer or
process on t e network is either a client or a server. Server computers are typically powerful
computers dedicated to managing disk drives (file servers), printers (print servers), or network
traffic (network servers). Client computers include PCs (personal computers) or workstations on
which users run applications, as well as example output devices as disclosed herein. Client
computers rely on server computers for resources, such as files, devices, and even processing
power. In some embodiments of the invention, the server computer handles all of the database
functionality. The client computer can have software that handles all the front-end data
management and can also receive data input from users.
[0122] A machine-readable medium which may comprise computer-executable code may
take many forms, including, but not limited to, a tangible storage medium, a carrier wave
medium or physical transmission medium. Non-volatile storage media include, for example,
optical or magnetic disks, such as any of the storage devices in any computer(s) or the like, such
as may be used to implement the databases, etc., shown in the drawings. Volatile storage media
include dynamic memory, such as main memory of such a computer platform. Tangible
transmission media include coaxial cables, copper wire, and fiber optics, including the wires that
comprise a bus within a computer system. Carrier-wave transmission media may take the form
of electric or electromagnetic signals, or acoustic or light waves such as those generated during
radio frequency (RF) and infrared (IR) data communications. Common forms of computer-
readable media therefore include, for example: a floppy disk, a flexible disk, hard disk, magnetic
tape, any other magnetic medium, a CD-ROM, DVD or DVD-ROM, any other optical medium,

punch cards paper tape, any other physical storage medium with patterns of holes, a RAM, a
ROM, a PROM and EPROM, a FLASH-EPROM, any other memory chip or cartridge, a carrier
wave transporting data or instructions, cables or links transporting such a carrier wave, or any
other medium from which a computer may read programming code and/or data. Many of these
forms of computer readable media may be involved in carrying one or more sequences of one or
more instructions to a processor for execution.
[0123] The subject computer-executable code can be executed on any suitable device which
may comprise a processor, including a server, a PC, or a mobile device such as a smartphone or
tablet. Any controller or computer optionally includes a monitor, which can be a cathode ray
tube ("CRT") display, a flat panel display (e.g., active matrix liquid crystal display, liquid
crystal display, etc.), or others. Computer circuitry is often placed in a box, which includes
numerous integrated circuit chips, such as a microprocessor, memory, interface circuits, and
others. The box also optionally includes a hard disk drive, a floppy disk drive, a high capacity
removable drive such as a writeable CD-ROM, and other common peripheral elements.
Inputting devices such as a keyboard, mouse, or touch-sensitive screen, optionally provide for
input from a user. The computer can include appropriate software for receiving user
instructions, either in the form of user input into a set of parameter fields, e.g., in a GUI, or in
the form of preprogrammed instructions, e.g., preprogrammed for a variety of different specific
operations.
[0124] The present invention also contemplates multiplex assays. The present invention is
especially well suited for multiplex assays. For example, t e invention encompasses use of a
SureSelectXT, SureSelectXT2 and SureSelectQXT Target Enrichment System for Illumina
Multiplexed Sequencing developed by Agilent Technologies (see, e.g.,
agilent.com/genomics/protocolvideos), a SeqCap EZ kit developed by Roche NimbleGen, a
TruSeq® Enrichment Kit developed by Illumina and other hybridization-based target
enrichment methods and kits that add sample-specific sequence tags either before or after the
enrichment step, as well as Illumina HiSeq, MiSeq and NexSeq,, Life Technology Ion Torrent.
Pacific Biosciences PacBio RSII, Oxford Nanopore Minion, Promethlon and Gridlon and other
massively parallel Multiplexed Sequencing Platforms.

Microbe Detection
[0125] In some embodiments, t e methods described herein may be used for detecting
microbes, such as a virus as described herein, in samples. Such detection may comprise
providing a sample as described herein with reagents for detection, incubating the sample or set
of samples under conditions sufficient to allow binding of the primers or probes to nucleic acid
corresponding to one or more microbe-specific targets wherein a positive signal is generated;
and detecting the positive signal, wherein detection of the detectable positive signal indicates the
presence of one or more target molecules from a microbe, i.e., a virus, in the sample. The one
or more target molecules may be any type of nucleic acid, including, but not limited to, mRNA,
rRNA, tRNA, genomic DNA (coding or non-coding), or a combination of any of these, wherein
the nucleic acid comprises a target nucleotide sequence that may be used to distinguish two or
more microbial species/strains from one another.
[0126] The embodiments disclosed herein may also utilize certain steps to improve
hybridization and/or amplification between primers and/or probes of the invention and target
nucleic acid sequences. Methods for enhancing nucleic acid hybridization and/or amplification
are well-known in the art. A viral- or microbe-specific target may be a nucleic acid such as R A
or DNA, or a target may be a protein, such as a viral- or microbe-encoded protein.
[0127] In some embodiments, hybridization between a primer and/or probe of the invention
and a viral or microbial target sequence may be performed to verify the presence of the virus
and/or microbe in the sample. In some specific cases, one or more viruses or microbes may be
detected simultaneously. In other embodiments, a primer and/or probe of the invention may
distinguish between 2 or more different viruses or microbes, even where those viruses and/or
microbes may be sufficiently similar at the nucleotide level.
Detection of Single Nucleotide Variants
[0128] In some embodiments, one or more identified target sequences may be detected
and/or differentiated using primers and/or probes of the invention that are specific for and bind
to the target sequence as described herein. The systems and methods of the present invention
can distinguish even between single nucleotide polymorphisms present among different viral or
microbial species and therefore, use of multiple primers or probes in accordance with the
invention may further expand on or improve the number of target sequences that may be used to
distinguish between species. For example, in some embodiments, one or more primers and/or

probes may distinguish between viruses and/or microbes at the species, genus, family, order,
class, phylum, kingdom, or phenotype, or a combination thereof.
[0129] In certain example embodiments, a method or diagnostic test may be designed to
screen viruses and/ormicrobes across multiple phylogenetic and/or phenotypic levels at the same
time. For example, the method or diagnostic may comprise the use of multiple sets of primers
and/or probes as described herein. Such an approach may be helpful for distinguishing viruses
and/or microbes at the genus level, while further sets of primers/probes may distinguish at t e
species level. Thus, in accordance with t e invention, a matrix may be produced identifying all
viruses and/or microbes identified in a given sample. The foregoing is for example purposes
only. Other means for classifying other microbe types are also contemplated and fall within the
scope of the present invention so long as they find use of the primers and/or probes as described
herein.
[0130] In certain other example embodiments, amplification of genetic material using a
primer developed and/or described herein may be performed. Genetic material may comprise,
for example, DNA and/or RNA, or a hybrid thereof, may be used to amplify the target nucleic
acids. Amplification reactions employ recombinases, which are capable of pairing sequence-
specific primers, such as described herein, with homologous sequence in the target nucleic acid,
e.g., duplex DNA. If target DNA is present, DNA amplification is initiated and primers of the
invention may anneal to the target sequence such that amplification of the target sequence may
occur. Amplification reactions may be carried out at any appropriate temperature and using any
reagents appropriate for the particular application or for the particular viral or microbial species.
A primer of the invention is designed to amplify a sequence comprising the target nucleic acid
sequence to be detected. In certain example embodiments, an RNA polymerase promoter, such
as a T7 promoter, may be added to one of the primers, to result in an amplified double-stranded
DNA product comprising the target sequence and an RNA polymerase promoter. After, or
during, the amplification reaction, an RNA polymerase may be added that will produce RNA
from the double-stranded DNA template. The amplified target RNA can then be detected as
described herein. In this way, target DNA may be detected using the embodiments disclosed
herein. Amplification reactions may also be used to amplify target RNA. The target RNA is first
converted to cDNA using a reverse transcriptase reaction, followed by second strand DNA
synthesis, at which point the amplification reaction proceeds as outlined above.

[0131] Accordingly, in certain example embodiments t e systems disclosed herein may
include amplification reagents. Different components or reagents useful for amplification of
nucleic acids are described herein. For example, an amplification reagent as described herein
may include a buffer, such as a Tris buffer. A Tris buffer may be used at any concentration
appropriate for t e desired application or use, for example including, but not limited to, a
concentration of 1 mM, 2 mM, 3 mM, 4 mM, 5 mM, 6 mM, 7 mM, 8 mM, 9 mM, 10 mM, 11
mM, 12 mM, 13 mM, 14 mM, 15 mM, 25 mM, 50 mM, 75 mM, 1 M, or the like. One of skill
in the art will be able to determine an appropriate concentration of a buffer such as Tris for use
with the present invention.
[0132] A salt, such as magnesium chloride (MgC12), potassium chloride (KCl), or sodium
chloride (NaCl), may be included in an amplification reaction, such as PCR, in order to improve
the amplification of nucleic acid fragments. Although the salt concentration will depend on the
particular reaction and application, in some embodiments, nucleic acid fragments of a particular
size may produce optimum results at particular salt concentrations. Larger products may require
altered salt concentrations, typically lower salt, in order to produce desired results, while
amplification of smaller products may produce better results at higher salt concentrations. One
of skill in the art will understand that the presence and/or concentration of a salt, along with
alteration of salt concentrations, may alter the stringency of a biological or chemical reaction,
and therefore any salt may be used that provides the appropriate conditions for a reaction of the
present invention and as described herein.
[0133] Other components of a biological or chemical reaction may include a cell lysis
component in order to break open or lyse a cell for analysis of the materials therein. A cell lysis
component may include, but is not limited to, a detergent, a salt as described above, such as
NaCl, KCl, ammonium sulfate [(NH4)2S04], or others. Detergents that may be appropriate for
the invention may include Triton X-100, sodium dodecyl sulfate (SDS), CHAPS (3-[(3-
cholamidopropyl)dimethylammonio]-l-propanesulfonate), ethyl trimethyl ammonium bromide,
nonyl phenoxypolyethoxylethanol (NP-40). Concentrations of detergents may depend on the
particular application, and may be specific to the reaction in some cases. Amplification
reactions may include dNTPs and nucleic acid primers used at any concentration appropriate for
the invention, such as including, but not limited to, a concentration of 100 nM, 150 nM, 200
nM, 250 nM, 300 nM, 350 nM, 400 nM, 450 nM, 500 nM, 550 nM, 600 nM, 650 nM, 700 nM,

750 nM, 800 nM, 850 nM, 900 nM, 950 nM, 1 mM, 2 mM, 3 mM, 4 mM, 5 mM, 6 mM, 7 mM,
8 mM, 9 mM, 10 mM, 20 mM, 30 mM, 40 mM, 50 mM, 60 mM, 70 mM, 80 mM, 90 mM, 100
mM, 150 mM, 200 mM, 250 mM, 300 mM, 350 mM, 400 mM, 450 mM, 500 mM, or the
like. Likewise, a polymerase useful in accordance with t e invention may be any specific or
general polymerase known in the art and useful or the invention, including Taq polymerase, Q5
polymerase, or the like.
[0134] In some embodiments, amplification reagents as described herein may be appropriate
for use in hot-start amplification. Hot start amplification may be beneficial in some
embodiments to reduce or eliminate dimerization of oligos, or to otherwise prevent unwanted
amplification products or artifacts and obtain optimum amplification of the desired product.
Many components described herein for use in amplification may also be used in hot-start
amplification. In some embodiments, reagents or components appropriate for use with hot-start
amplification may be used in place of one or more of the composition components as
appropriate. For example, a polymerase or other reagent may be used that exhibits a desired
activity at a particular temperature or other reaction condition. In some embodiments, reagents
may be used that are designed or optimized for use in hot-start amplification, for example, a
polymerase may be activated after transposition or after reaching a particular temperature. Such
polymerases may be antibody-based or apatamer-based. Polymerases as described herein are
known in the art. Examples of such reagents may include, but are not limited to, hot-start
polymerases, hot-start dNTPs, and photo-caged dNTPs. Such reagents are known and available
in the art. One of skill in the art will be able to determine the optimum temperatures as
appropriate for individual reagents.
[0135] Amplification of nucleic acids may be performed using specific thermal cycle
machinery or equipment, and may be performed in single reactions or in bulk, such that any
desired number of reactions may be performed simultaneously. In some embodiments,
amplification may be performed using microfluidic or robotic devices, or may be performed
using manual alteration in temperatures to achieve the desired amplification. In some
embodiments, optimization may be performed to obtain the optimum reactions conditions for
the particular application or materials. One of skill in the art will understand and be able to
optimize reaction conditions to obtain sufficient amplification.

[0136] In certain embodiments, detection of DNA with the methods or systems of t e
invention requires transcription of the (amplified) DNA into RNA prior to detection.
Set Cover Approaches
[0137] In particular embodiments, a primer and/or probe is designed that can identify, for
example, all viral and/or microbial species within a defined set of viruses and microbes. Such
methods are described in certain example embodiments. A set cover solution may identify the
minimal number of target sequence probes or primers needed to cover an entire target sequence
or set of target sequences, e.g. a set of genomic sequences. Set cover approaches have been used
previously to identify primers and/or microarray probes, typically in the 20 to 50 base pair
range. See, e.g. Pearson etal, cs.virginia.edu/~robins/papers/primers_damll_final.pdf, Jabado
etal. Nucleic Acids Res. 2006 34(22):6605-ll, Jabado etal. Nucleic Acids Res. 2008, 36(l):e3
doil0.1093/nar/gkmll06, Duitama et al. Nucleic Acids Res. 2009, 37(8):2483-2492, Phillippy
et al. BMC Bioinformatics . 2009, 10:293 doi: 10. 1186/1471-2105-10-293. Such approaches
generally involved treating each primer/probe as k-mers and searching for exact matches or
allowing for inexact matches using suffix arrays. In addition, the methods generally take a
binary approach to detecting hybridization by selecting primers or probes such that each input
sequence only needs to be bound by one primer or probe and the position of this binding along
the sequence is irrelevant. Alternative methods may divide a target genome into pre-defined
windows and effectively treat each window as a separate input sequence under the binary
approach - i.e. they determine whether a given probe or guide RNA binds within each window
and require that all of the windows be bound by the state of some primer or probe. Effectively,
these approaches treat each element of the "universe" in the set cover problem as being either an
entire input sequence or a pre-defined window of an input sequence, and each element is
considered "covered" if the start of a probe or guide RNA binds within the element.
[0138] In some embodiments, the methods disclosed herein may be used to identify all
variants of a given virus, or multiple different viruses in a single assay. Further, the method
disclosed herein treat each element of the "universe" in the set cover problem as being a
nucleotide of a target sequence, and each element is considered "covered" as long as a probe or
guide RNA binds to some segment of a target genome that includes the element. Rather than
only asking if a given primer or probe does or does not bind to a given window, such
approaches may be used to detect a hybridization pattern - i.e. where a given primer or probe

binds to a target sequence or target sequences - and then determines from those hybridization
patterns the minimum number of primers or probes needed to cover the set of target sequences
to a degree sufficient to enable both enrichment from a sample and sequencing of any and all
target sequences. These hybridization patterns may be determined by defining certain
parameters that minimize a loss function, thereby enabling identification of minimal probe or
guide R A sets in a way that allows parameters to vary for each species, e.g. to reflect the
diversity of each species, as well as in a computationally efficient manner that cannot be
achieved using a straightforward application of a set cover solution, such as those previously
applied in the primer or probe design context.
[0139] The ability to detect multiple transcript abundances may allow for the generation of
unique viral or microbial signatures indicative of a particular phenotype. Various machine
learning techniques may be used to derive the gene signatures. Accordingly, the primers and/or
probes of the invention may be used to identify and/or quantitate relative levels of biomarkers
defined by the gene signature in order to detect certain phenotypes. In certain example
embodiments, the gene signature indicates susceptibility to a particular treatment, resistance to a
treatment, or a combination thereof.
[0140] In one aspect of the invention, a method comprises detecting one or more pathogens.
In this manner, differentiation between infection of a subject by individual microbes may be
obtained. In some embodiments, such differentiation may enable detection or diagnosis by a
clinician of specific diseases, for example, different variants of a disease. Preferably the viral or
pathogen sequence is a genome of the virus or pathogen or a fragment thereof. The method
further may comprise determining the evolution of the pathogen. Determining the evolution of
the pathogen may comprise identification of pathogen mutations, e.g. nucleotide deletion,
nucleotide insertion, nucleotide substitution. Among the latter, there are non-synonymous,
synonymous, and noncoding substitutions. Mutations are more frequently non-synonymous
during an outbreak. The method may further comprise determining the substitution rate between
two pathogen sequences analyzed as described above. Whether the mutations are deleterious or
even adaptive would require functional analysis, however, the rate of non-synonymous
mutations suggests that continued progression of this epidemic could afford an opportunity for
pathogen adaptation, underscoring the need for rapid containment. Thus, the method may

further comprise assessing the risk of viral adaptation, wherein the number non-synonymous
mutations is determined. (Gire, et al., Science 345, 1369, 2014).
Screening Environmental Samples
[0141] The methods disclosed herein may also be used to screen environmental samples for
contaminants by detecting the presence of target nucleic acids or polypeptides. For example, in
some embodiments, the invention provides a method of detecting viruses and/or microbes,
comprising: exposing a primer and/or probe as described herein to a sample; allowing binding of
the primer and/or probe to one or more viral- or microbe -specific target nucleic acids such that a
detectable positive signal is produced. The positive signal can be detected and is indicative of
the presence of one or more viruses or microbes in the sample.
[0142] As described herein, an environmental sample for use with the invention may be a
biological or environmental sample, such as a food sample (fresh fruits or vegetables, meats), a
beverage sample, a paper surface, a fabric surface, a metal surface, a wood surface, a plastic
surface, a soil sample, a freshwater sample, a wastewater sample, a saline water sample,
exposure to atmospheric air or other gas sample, or a combination thereof. For example,
household/commercial/industrial surfaces made of any materials including, but not limited to,
metal, wood, plastic, rubber, or the like, may be swabbed and tested for the presence of viruses
and/or microbes. Soil samples may be tested for the presence of pathogenic viruses or bacteria
or other microbes, both for environmental purposes and/or for human, animal, or plant disease
testing. Water samples such as freshwater samples, wastewater samples, or saline water samples
can be evaluated for cleanliness and safety, and/or potability, to detect the presence of a viral or
microbial contaminant such as, for example, Cryptosporidium parvum, Giardia lamblia, or
other microbial contamination. In further embodiments, a biological sample may be obtained
from a source including, but not limited to, a tissue sample, saliva, blood, plasma, sera, stool,
urine, sputum, mucous, lymph, synovial fluid, cerebrospinal fluid, ascites, pleural effusion,
seroma, pus, or swab of skin or a mucosal membrane surface, or any other types of samples
described herein above. In some particular embodiments, an environmental sample or biological
samples may be crude samples and/or the one or more target molecules may not be purified or
amplified from the sample prior to application of the method. Identification of microbes may be
useful and/or needed for any number of applications, and thus any type of sample from any

source deemed appropriate by one of skill in the art may be used in accordance with t e
invention.
[0143] A microbe in accordance with the invention may be a pathogenic virus or microbe or
a microbe that results in food or consumable product spoilage. A pathogenic microbe may be
pathogenic or otherwise undesirable to humans, animals, or plants. For human or animal
purposes, a microbe may cause a disease or result in illness. Animal or veterinary applications
of the present invention may identify animals infected with a microbe. For example, the
methods and systems of the invention may identify companion animals with pathogens
including, but not limited to, kennel cough, rabies virus, and heartworms. In other embodiments,
the methods and systems of the invention may be used for parentage testing for breeding
purposes. A plant microbe may result in harm or disease to a plant, reduction in yield, or alter
traits such as color, taste, consistency, odor, For food or consumable contamination purposes, a
microbe may adversely affect the taste, odor, color, consistency or other commercial properties
of the food or consumable product. In certain example embodiments, the microbe is a bacterial
species. The bacteria may be a psychrotroph, a coliform, a lactic acid bacteria, or a spore-
forming bacteria. In certain example embodiments, the bacteria may be any bacterial species
that causes disease or illness, or otherwise results in an unwanted product or trait. Bacteria in
accordance with the invention may be pathogenic to humans, animals, or plants.
[0144] The invention is further described in the following examples, which do not limit the
scope of the invention described in the claims.
EXAMPLES
Example 1 - Genome sequencing reveals Zika v m s diversity spread in the Americas
[0145] Despite great attention given to the recent Zika virus (ZIKV) epidemic in the
Americas, much remains unknown about its epidemiology and evolution. One hundred ZIKV
genomes were sequenced from clinical samples from 10 countries and territories, greatly
expanding the observed viral genetic diversity from this outbreak, and analysis of the timing and
patterns of introduction into distinct geographic regions was done. Phylogenetic evidence was
confirmed for the origin and rapid expansion of the outbreak in Brazil (Faria et a , 2016), and
for multiple introductions from Brazil into Honduras, Colombia, Puerto Rico, other Caribbean
islands, and the continental US. It was found that ZIKV circulated undetected in many regions

of the Americas for up to a year before t e first reported diagnoses, highlighting t e challenge of
effective surveillance for this virus. Multiple sequencing approaches were developed and
applied, optimizing genomic surveillance of ZIKV and characterizing genetic variation across
the outbreak to identify mutations with possible functional implications for ZIKV biology and
pathogenesis.
[0146] Since its introduction into the Americas in 2013 (Faria et al., 2016), mosquito-borne
ZIKV (Family: Flaviviridae) has spread rapidly throughout the Americas, causing hundreds of
thousands of cases of ZIKV disease, as well as ZIKV congenital syndrome and likely other
neurological complications (Zika situation report, 2016; Dos Santos et al., 20 16). Phylogenetic
analysis of ZIKV can reveal the trajectory of the outbreak and detect mutations that may be
associated with new disease phenotypes or affect molecular diagnostics. Despite the nearly 60
years since its discovery, however, fewer than 100 ZIKV genomes have been sequenced directly
from clinical samples. This is due in part to technical challenges posed by low peak viral loads
(for example, often orders of magnitude lower than in Ebola virus or dengue virus infection
(Schieffelin et al., 2014; Sardi et al., 2016; Martina et al., 2009)), and practical challenges of
sample handling because patient samples are typically collected for clinical diagnosis without
sequencing in mind. Culturing the virus increases the material available for sequencing, but can
result in genetic variation that is not representative of the original clinical sample.
[0147] In order to gain a deeper understanding of the viral populations underpinning the
ZIKV epidemic, extensive genome sequencing was performed of ZIKV directly from samples
collected as part of ongoing surveillance. Unbiased metagenomic R A sequencing was initially
pursued in order to capture both ZIKV and other viruses known to be co-circulating with ZIKV.
In most of the 38 samples examined by this approach, there proved to be insufficient ZIKV
RNA for genome assembly, but it still proved valuable to verify results from other methods.
Metagenomic data also revealed RNA from other viruses, including 41 likely novel viral
sequence fragments in mosquito pools (Table 1). In one patient, no ZIKV sequence was
detected, but a complete genome from dengue virus was assembled (type 1), one of the viruses
that co-circulates with and presents similarly to ZIKV.

Table 1. Viruses Identified from Metagenomic Data
a# reads fro species % genome
Species Sample( of i' unambiguous
USA_201 6_FL-01-MOS 5662 99. 1%(0.02%)
USA_2016_FL-Q4-MOS 1588 1%(0.003%)
Ceil fusing agent virus USA_2016_FL-05-MOS 9614 99 %(0 02%)
USA_2016_FL-06-MOS 2646 82.2%(0 007%)
USA_2Q16_FL-08-MGS 13608 99.4%(0.008%)
Deformed wing virus-like USA_20 6_FL-06-MOS 6580 8.34%(0 02%)
Dengue virus type 1 BLM_2G 6_ A-WGS 6-0Q6-SER 2355926 99 8%.8%)
JC poiyomavirus BRA_2016_FC-DQ75D1 -UR! 8050 99.2%(0.20%)
JC poiyomavirus-like USA_2016_FL-032-URI 316 7.71 %(0.001%)
bClassified contias Classified contigs Likely novel
Sample Total coniiqs(all) (viral) viral contigs
USA_201 6_FL-01 - OS 496 431 45 25
USA_201 6_FL-02-MOS 563 463 17 14
USA_201 _FL-03- S 164 133 29 22
USA_201 6_FL-04-MOS 679 492 25 19
USA_201 6_FL-05-MOS 355 313 8
USA_20 6_FL- 6- OS 726 635 26 14
USA_201 6_FL-07-MOS 5967 5650 5 2
USA_2Q1 6_FL-G8-MOS 1679 1528 39 27
Ail pools: unique 9013 8426 84 41
Viruses other than Zika uncovered by unbiased sequencing, (a) Viral species other than Zika were found by unbiased
sequencing of 38 samples. Column 3 : number of reads in a sample belonging to a species as a raw count and a percent of total
reads. Column 4 : percent genome assembled based on the number of unambiguous bases called. Flavivirus cell fusing agent
virus and deformed wing virus-like genomes in mosquito pools, and dengue virus type 1, JC poiyomavirus, and JC
polyomavirus-like genomes were identified in clinical samples. All assemblies had >95% sequence identity to a reference
sequence for the listed species, except cell fusing agent virus in USA 2016 FL-06-MOS (91%) and dengue virus type 1 in
BLM 2016 MA-WGS16-006-SER (92%). The dengue virus type 1 genome showed >95% sequence identity to other available
isolates of the virus (b) Contigs assembled from unbiased sequencing data of 8 mosquito pools. Column 2 : number of contigs
assembled. Column 3 : number of contigs classified by BLASTN/BLASTX43. Column 4 : number of contigs hitting a viral

species. Column 5 : number of contigs hitting a viral species with <80% amino acid identity to the best hit. Each column is a
subset of the previous column. Contigs in column 5 are considered to be likely novel. Last row lists counts, after removing
duplicate contigs, for all mosquito pools combined.
[0148] In order to capture sufficient ZIKV content for genome assembly, two targeted
enrichment approaches were used before sequencing: multiplex PCR amplification and hybrid
capture. Sequencing and assembly of complete or partial genomes from 110 samples from
across the epidemic, out of 229 attempted (22 1 clinical samples from confirmed and possible
ZIKV disease cases and eight mosquito pools, Table 4). This dataset, which was used for further
analysis, included 110 genomes produced using multiplex PCR amplification (amplicon
sequencing) and a subset of 37 genomes produced using hybrid capture (out of 66 attempted).
Because these approaches amplify any contaminant ZIKV content, negative controls were relied
heavily upon in order to detect artefactual sequence, and stringent, method-specific thresholds
on coverage and completeness were established for calling high confidence ZIKV assemblies
(FIG. 16a). Completeness and coverage for these genomes are shown in FIG. 16b and 16c; t e
median fraction of the genome with unambiguous base calls was 93%. Per-base discordance
between genomes produced by the two methods was 0.0 17% across the genome, 0 .15% at
polymorphic positions, and 2.2% for minor allele base calls. Concordance of within-sample
variants is shown in more detail in FIG. 16d-16f. Patient sample type (urine, serum, or plasma)
made no significant difference in sequencing success in the study (FIG. 17).
[0149] To investigate the spread of ZIKV in the Americas (FIG. 18), a phylogenetic analysis
of the 110 genomes from the dataset was performed, together with 64 published genomes
available on NCBI GenBank and in the literature (FIG. 18a). The reconstructed phylogeny (FIG.
18b), which is based on a molecular clock, is consistent with the outbreak originating in Brazil:
Brazil ZIKV genomes appear on all deep branches of the tree, and their most recent common
ancestor is the root of the entire tree. It was estimated that the date of that common ancestor to
have been in early 20 14 (95% credible interval, CI, August 20 13 to July 20 14). The shape of the
tree near the root remains uncertain (i. e., the nodes have low posterior probabilities) because
there are too few mutations to clearly distinguish the branches. This pattern suggests rapid early
spread of the outbreak, consistent with the introduction of a new virus to an immunologically
naive population. ZIKV genomes from Colombia («=10), Honduras («=1 8), and Puerto Rico
(n=3) cluster within distinct, well-supported clades. A clade consisting entirely of genomes from
patients who contracted ZIKV in one of three Caribbean countries (the Dominican Republic,

Jamaica, and Haiti) or t e continental US, containing 30 of 32 genomes from the Dominican
Republic and 19 of 20 from the continental US was also observed. The within-outbreak
substitution rate was estimated to be 1.15xl0 substitutions/site/year [95% CI (9.78xl0 4,
1.33xl0 )], similar to prior estimates for this outbreak. This is somewhat higher ( 1.3x-5x) than
reported rates for other flaviviruses 1 , but is measured over a short sampling period, and
therefore may include a higher proportion of mildly deleterious mutations that have not yet been
removed through purifying selection.
[0150] Determining when ZIKV arrived in specific regions helps elucidate the spread of the
outbreak and track rising incidence of possible complications of ZIKV infection. The majority
of the ZIKV genomes from the study fall into four major clades from different geographic
regions, for which it was estimated a likely date for ZIKV arrival. In each case, the date was
months earlier than the first confirmed, locally transmitted case, indicating ongoing local
circulation of ZIKV before its detection. In Puerto Rico, the estimated date was 4.5 months
earlier than the first confirmed local case 14; it was 8 months earlier in Honduras 15 , 5 .5 months
earlier in Colombia 16 , and 9 months earlier for the Caribbean/continental US clade 17 . In each
case, the arrival date represents the estimated time to the most recent common ancestor
(tMRCA) for the corresponding clade in our phylogeny (FIG. 18c). Similar temporal gaps
between the tMRCA of local transmission chains and the earliest detected cases were seen when
chikungunya virus emerged in the Americas. Evidence for several introductions of ZIKV into
the continental US was observed, and it was found that sequences from mosquito and human
samples collected in Florida cluster together, consistent with the finding of local ZIKV
transmission in Florida.
[0151] Principal component analysis (PCA) is consistent with the phylogenetic observations
(FIG. 17d). It shows tight clustering among ZIKV genomes from the continental US, the
Dominican Republic, and Jamaica. ZIKV genomes from Brazil and Colombia are similar and
distinct from genomes sampled in other countries. ZIKV genomes from Honduras form a third
cluster that also contains genomes from Guatemala or El Salvador. The PCA results show no
clear stratification of ZIKV within Brazil.
[0152] Determining when ZIKV arrived in specific regions is important for understanding
the epidemiology of the virus and its effects on health. The tMRCA was estimated for well-
supported nodes within the phylogeny, including four highly supported clades (posterior

probability >0.95), formed mostly by strains from Colombia, Honduras, Puerto Rico, and t e
Caribbean. It was found that these four clades originated in early to mid 2015, many months
before ZIKV was first reported in each region, indicating ongoing local circulation of ZIKV
before its detection by surveillance systems. The tMRCA of Colombian sequences was
estimated to be in March 2015 [95% CI (2014.97, 2015.46)], 7 months before the first
confirmed cases in Colombia (Pacheco et al., (2016), Zika virus disease in Colombia—
preliminary report. New England Journal of Medicine); Honduran sequences to be in March
2015 [95% CI (2014.76, 2015.50)], 10 months before the first reported case (Pan-American
Health Organization. Zika-Epidemiological Report Honduras,
paho.org/hq/index.php?option=com_docman&task=doc_view&gid=35137&Itemid=270), and
Puerto Rican sequences to be in July 2015 [95% CI (2015.30, 2015.78)], six months before the
first reported case (Pan-American Health Organization. Zika-Epidemiological Report Puerto
Rico, paho.org/hq/index.php?option=com_docman&task=doc_view&gid=35231&Itemid=270
&lang=en). The estimated tMRCA of the Caribbean clade, consisting of sequences from three
Caribbean countries and the continental USA, to be in February 2015 [95% CI (2014.76,
2015.52)], seven months before the first reported case in the Dominican Republic and about
nine months before the first reported case in Florida, USA (Likos et al., "Local Mosquito-Borne
Transmission of Zika Virus — Miami-Dade and Broward Counties, Florida, June-August
2016," MMWR Morb Mortal Wkly Rep 65:1032-1038, 2016). Several introductions of ZIKV
into the continental USA were observed and it was found that sequences from mosquito and
human samples collected in Florida cluster together, consistent with previous findings. Similar
temporal gaps between the tMRCA of local transmission chains and the detection of early cases
were observed in the emergence of chikungunya in the Americas (Nunes et al., 2015).
[0153] Genetic variation can provide important clues to understanding ZIKV biology and
pathogenesis and can reveal potentially functional changes in the virus. 1030 single nucleotide
polymorphisms (SNPs) were observed in the complete dataset, well distributed across the
genome (FIG. 20a). Any effect of these mutations cannot be determined from these data;
however, the most likely candidates for functional mutations would be among the 202
nonsynonymous SNPs (Table 5) and the 32 SNPs in the 5' and 3' untranslated regions (UTRs).
Adaptive mutations are more likely to be found at high frequency or to be seen multiple times,
although both effects can also occur by chance. Five positions with nonsynonymous mutations

were observed at >5% minor allele frequency that occur on two or more branches of t e tree
(FIG. 20b); two of these (at 4287 and 899 1) occur together and might represent incorrect
placement of a Brazil branch in the tree. The remaining three are more likely to represent
multiple nonsynonymous mutations; one (at 9240) appears to involve nonsynonymous
mutations to two different alleles.
[0154] To assess the possible biological significance of these mutations, evidence of
selection in the ZIKV genome was evaluated. Viral surface glycoproteins are known targets of
positive selection, and mutations in these proteins can confer adaptation to new vectors 19 or aid
immune escape20'2 1. An excess of nonsynonymous mutations was evaluated in the ZIKV
envelope glycoprotein (E). However, the nonsynonymous substitution rate in E proved to be
similar to that in the rest of the coding region (FIG. 20c, left); moreover, amino acid changes
were significantly more conservative in that region than elsewhere (FIG. 20c, middle and right).
Any diversifying selection occurring in the surface protein thus appears to be operating under
selective constraint. Evidence was also identified for purifying selection in the ZIKV 3' UTR
(FIG. 20d, Table 6), a region important for viral replication22.
[0155] While the transition-to-transversion ratio (6.98) in the dataset was within the range
seen in other viruses (Duchene e t a , 2015), a significantly higher frequency of C-to-T and T-to-
C substitutions than other transitions was observed (FIG. 20d and Table 2). This enrichment was
apparent both in the genome as a whole and at 4-fold degenerate sites, where selection pressure
is minimal. Many processes are possible contributors to this conspicuous mutation pattern,
including mutational bias of the ZIKV RNA-dependent RNA polymerase, host RNA editing
enzymes (e.g., APOBECs, ADARs) acting upon viral RNA, and chemical deamination, but
further investigation is required to determine the actual cause of this phenomenon.

Table 2. Nucleotide transition and transversion rates. Observed nucleotide changes in 165
outbreak genomes, per available base.
to A t to t to A to to G to T
r A . 0.00438 0 . 5 0.00012 from A 0.00000 0.00473 02199 0.00287
C j 0 . S80 0.00000 0 . S4 1 4 m G 0.00678 0.00000 0 00000 0.07458
. 45 2 . 34 0 . 0 0 0 .00 ror - G 0.01219 G.OOOGO 0 ooooo 0.00325
T : 0.01083 0.1 67 . 0520 0.00000 or T 0.01257 0.07890 00359 0.00000
to A t to t to A to C to G to T
ir m 0.00000 0.00000 0.05310 0.00885 from A O.OOOOO 0.00000 02643 0.00331
C j 0.00000 0.00000 0.00000 0 04202 from G 0.00255 0.00000 0 S 0.02423
0.0232S 0 .GG 0 .OO OO 0.00000 G 0.01 186 .00527 0 00000 0 . 0 2
f o T 0.00000 0.08955 .oooo 0.00000 T 0.00103 0 .02687 0 · ooooo 0.00000
to A to C to G to ΐο A o o G to :
from A j 0.00000 0 ..0 3 0.13474 0.03579 O.OOOOO 0.00604 0 .13988 0.02312
i C j 0.02079 O.OOOOO O.OOOOO 0 24249 G 0.01595 0 00000 0.00000 0.25285
G j 0.1S481 0.00998 O.OODOO 0.01746 0 . 1332 0.00497 0.00000 0.00895
T 0.03779 0.31686 0.02326 O.OOOOO from T j 0.02370 0:29333 0.01333 O.OOOOO
[0156] Mismatches between PCR assays and viral sequence are a potential source of poor
diagnostic performance in this outbreak24 . To assess t e potential impact of ongoing viral
evolution on diagnostic function, we compared eight published qRT-PCR-based primer/probe
sets to our data. Numerous sites were found where the probe or primer did not match an allele
found among the 174 ZIKV genomes from the current dataset (FIG. 20e). In most cases, the
discordant allele was shared by all outbreak samples, presumably because it was present in the
Asian lineage that entered the Americas. These mismatches could affect all uses of the
diagnostic assay in the outbreak. Mismatches were found from new mutations that occurred
following ZIKV entry into the Americas. Most of these were present in less than 10% of
samples, although one was seen in 29%. These observations suggest that genome evolution has
not caused widespread degradation of diagnostic performance during the course of the outbreak,
but that mutations continue to accumulate and ongoing monitoring is needed.
[0157] Analysis of within-host viral genetic diversity can reveal important information for
understanding virus-host interactions and viral transmission. However, accurately identifying
these variants in low-titer clinical samples is challenging, and further complicated by potential

artefacts associated with enrichment prior to sequencing. To investigate whether it was possible
to reliably detect within-host ZIKV variants in the data, within-host variants were identified in a
cultured ZIKV isolate used as a positive control throughout the study, and it was found that both
amplicon sequencing and hybrid capture data produced concordant and replicable variant calls
(FIG. 16d). In clinical samples, hybrid capture within-host variants were noisier but contained a
reliable subset: although most variants were not validated by the other sequencing method or by
a technical replicate, those at high frequency were always replicable, as were those that passed a
previously described filter25 (FIG. 16e-f, Table 3). Within this high confidence set, variants
shared between samples were evaluated as a clue to transmission patterns, but there were too
few variants to draw any meaningful conclusions. By contrast, within-host variants identified in
amplicon sequencing data were unreliable at all frequencies (FIG. 16f, Table 3), suggesting that
further technical development is needed before amplicon sequencing can be used to study
within-host variation in ZIKV and other clinical samples with low viral titer.
Table 3. Unvalidated Variants Across Methods.
a% unvalidated
Methodby other method
Amplicon sequencing 87.3%
Hybrid capture 85.8% =
Hybrid capture, verified 25.0% = o
b
% unvalidated in replicate
Method ail variants passingvariants strand bias filter
Amplicon sequencing 92.7% 66.7%
Hybrid capture 74.5% 0.00% = a
[0158] Sequencing low titer viruses like ZIKV directly from clinical samples presents several
challenges that have likely contributed to the paucity of genomes available from the current
outbreak. While development of technical and analytical methods will surely continue, it is
noted that factors upstream in the process, including collection site and cohort, were strong
predictors of sequencing success in the study (FIG. 17). This highlights the importance of
continuing development and implementation of best practices for sample handling, without

disrupting standard clinical workflows, for wider adoption of genome surveillance during
outbreaks. Additional sequencing, however challenging, remains critical to ongoing
investigation of ZIKV biology and pathogenesis. Together with two companion studies 10 11, this
effort advances both technological and collaborative strategies for genome surveillance in the
face of unexpected outbreak challenges.
Methods
Sample collections and study subjects
[0159] Human blood, urine, cerebrospinal fluid, and saliva samples were obtained from
suspected ZIKV cases; all samples were acquired during the period in which the participant was
symptomatic. A blood sample of up to 5 mL was taken from the patient/research subject via
venipuncture using sterile and disposable material, similar to blood collections during routine
laboratory tests. The time from onset of symptoms to enrollment into respective studies was
similar among different patients. Following sample acquisition, specimens were stored between
4 and -20°C . Serum or plasma were prepared by centrifugation at 2,500 rpm for 15 min using
whole blood or anticoagulated blood, respectively. Diagnostic tests for the presence of ZIKV
were performed on-site using RT-qPCR or RT-PCR (see below).
Viral RNA isolation
[0160] RNA was isolated following manufacturer's standard operating protocol for 0.14 mL
up to 1mL samples32 using the QIAamp Viral RNA Minikit (Qiagen), except that in some cases
0.1 M final concentration of β-mercaptoethanol (as a reducing agent) or 40 µg/mL final
concentration of linear acrylamide (Ambion) (as a carrier) were added to AVL buffer prior to
inactivation. Extracted RNA was resuspended in AVE buffer or nuclease-free water. In some
cases, viral samples were concentrated using Vivaspin-500 centrifugal concentrators (Sigma-
Aldrich) prior to inactivation and extraction. In these cases, 0.84 mL of sample was
concentrated to 0 .14 mL by passing through a 30 kDa filter and discarding the flow through.
Quantification of RNA content using RT-qPCR
[0161] Host RNA (18S rRNA) was quantified using the Power SYBR Green RNA-to-Ct 1-
Step kit (Applied Biosystems) and human 18S rRNA primers: 5'-
TCCTTTAACGAGGATCCATTGG-3 ' (forward, SEQ ID NO:l), and 5'-
CGAGCTTTTTAACTGCAGCAACT-3 ' (reverse, SEQ ID NO: ) . Human genomic DNA
(Promega) was used as a standard control. All reactions were performed on the ABI 7900HT

(Applied Biosystems). ZIKV samples were quantified using a panel of published RT-qPCR
assays which included two assays that target the envelope (E) region as described by (Pyke e t
al., 20 14) and (Lanciotti e t al. 2008) and one assay that targets t e nonstructural protein 5 (NS5)
gene as described by (Faye e t al., 2013). Standards for each assay were created using IDT
gBlocks® Gene Fragments. Standard curves for each assay were created by performing a 10-
fold serial dilution of all assay standards resulting in a dynamic range of lxl0 to 1 copies/ µ ΐ .
All RT-qPCR assays were performed in 10 µ ΐ reactions using TaqMan RNA-to-CT 1-Step Kit
(Applied Biosystems) and 3 µ ΐ of a 1:20 dilution of sample RNA or standard. Genome
amplification was performed on t e ABI 7900HT and QuantStudio™ 6 Real Flex Real-Time
PCR System (ThermoFisher Scientific) using the conditions previously described for each assay
(Pyke e t al, 20 14; Lanciotti e t al, 2008; Faye e t al, 2013).
Carrier RNA and host rRNA depletion
[0162] In a subset of samples, carrier RNA and host rRNA were depleted from RNA samples
using RNase H selective depletion (Morlan e t al., 2012; Matranga e t al., 2014). Briefly, oligo
d(T) (40 nt long) and/or DNA probes complementary to human rRNA were hybridized to the
sample RNA. The sample was then treated with 20 units of Hybridase Thermostable RNase H
(Epicentre) for 30 minutes at 45°C. The complementary DNA probes were removed by treating
each reaction with RNase-free DNase kit (Qiagen) according to the manufacturer's protocol.
Depleted samples were purified using 2.2x volume AMPure RNAclean beads (Beckman Coulter
Genomics) and eluted into 10 µ ΐ water for cDNA synthesis.
Illumina library construction and sequencing
[0163] cDNA synthesis was performed as described in previously published RNA-seq
methods 9. To track potential cross-contamination, 50 fg of synthetic RNA (gift from M . Salit,
NIST) was spiked into samples using unique RNA for each individual ZIKV sample. ZIKV
negative control cDNA libraries were prepared from water, human K-562 total RNA (Ambion),
or EBOV (KY425633 .1) seed stock; ZIKV positive controls were prepared from ZIKV Senegal
(isolate HD78788) or ZIKV Pernambuco (isolate PE243; KX197 192. 1) seed stock. The dual
index Accel-NGS® 2S Plus DNA Library Kit (Swift Biosciences) was used for library
preparation. Approximately half of the cDNA product was used for library construction, and
indexed libraries were generated using 18 cycles of PCR. Each individual sample was indexed

with a unique barcode. Libraries were pooled at equal molarity and sequenced on the Illumina
HiSeq 2500 or MiSeq (paired-end reads) platforms.
Amplicon-based cDNA synthesis and library construction
[0164] ZIKV amplicons were prepared as described8 11, similarly to "RNA jackhammering"
for preparing low input viral samples for sequencing34, with slight modifications. After PCR
amplification, each amplicon pool was quantified on a 2200 Tapestation (Agilent Technologies)
using High Sensitivity D1000 ScreenTape (Agilent Technologies). 2 of a 1 : 10 dilution of t e
amplicon cDNA was loaded and the concentration of the 350-550 bp fragments was calculated.
The cDNA concentration, as reported by the Tapestation, was highly predictive of sequencing
outcome (i.e., whether a sample passes genome assembly thresholds). cDNA from each of the
two amplicon pools were mixed equally (10-25 ng each) and libraries were prepared using the
dual index Accel-NGS® 2S Plus DNA Library Kit (Swift Biosciences) according to
manufacturer's protocol. Libraries were indexed with a unique barcode using 7 cycles of PCR,
pooled equally, and sequenced on the Illumina MiSeq (250 bp paired-end reads) platform.
Primer sequences were removed by hard trimming the first 30 bases for each insert read prior to
analysis.
Zika hybrid capture
[0165] Viral hybrid capture was done as previously described (Matranga et a , 2014).
Probes were created to target ZIKV and Chikungunya virus (CHIKV). Candidate probes were
created by tiling across publicly available sequences for ZIKV and CHIKV (NCBI GenBank).
Probes were selected from among these candidate probes to minimize the number used while
maintaining coverage of the observed diversity of the viruses. Alternating universal adapters
were added to allow two separate PCR amplifications, each consisting of non-overlapping
probes.
[0166] The probes were synthesized on a 12k array (CustomArray). The synthesized oligos
were amplified by two separate emulsion PCR reactions with primers containing T7 RNA
polymerase promoter. Biotinylated baits were in vitro transcribed (MEGAshortscript, Ambion)
and added to prepared ZIKV libraries. The baits and libraries were hybridized overnight (-16
hrs), captured on streptavidin beads, washed, and re-amplified by PCR using the Illumina
adapter sequences. Capture libraries were then pooled and sequenced. In some cases, a second
round of hybrid capture was performed on PCR-amplified capture libraries to further enrich the

ZIKV content of sequencing libraries (FIG. 1). In t e main text, "hybrid capture" refers to a
combination of hybrid capture sequencing data and data from the same libraries without capture
(unbiased), unless explicitly distinguished.
Genome assembly
[0167] Reads were assembled from all sequencing methods into genomes using viral-ngs
v l .13 .336'37. Reads were filtered taxonomically from amplicon sequencing against a ZIKV
reference, KU321639. 1. Reads were filtered from other approaches against the list of accessions
provided herein. To compute results on individual replicates, we de novo assembled these and
scaffolded against KU32 1639. 1. To obtain final genomes for analysis, data was pooled from
multiple replicates of a sample, de novo assembled, and scaffolded against KX 197 192. 1. For all
assemblies, the viral-ngs 'assembly_min_length_fraction_of_reference' and
'assembly_min_unambig' parameters were set to 0.01 . For amplicon sequencing data,
unambiguous base calls required at least 90% of reads to agree in order to call that allele
('major_cutoff = 0.9); for hybrid capture data, the default threshold of 50% was used. Viral-ngs
were modified so that calls to GATK's UnifiedGenotyper set
'min_indel_count_for_genotyping' to 2 .
[0168] At 3 sites with insertions or deletions (indels) in the consensus genome CDS, the
genome was corrected using Sanger sequencing of the RT-PCR product (namely, at 3447 in the
genome for sample DOM 2016 BB-0085-SER; at 5469 in BRA 2016 FC-DQ 12D 1-PLA; and
at 65 16-6564 in BRA 2016 FC-DQ 107D 1-URI, with coordinates in KX197 192. 1). At other
indels in the consensus genome CDS, indels with ambiguity were replaced.
[0169] When reporting and using depth of coverage values from amplicon-based sequencing
data, PCR and optical duplicates were not removed. Otherwise, these were removed with viral-
ngs.
Identification of viruses in samples by unbiased sequencing
[0170] Using kraken vO. 10.6 (Wood et al., 20 14) in viral-ngs, a database was built that
includes its default "full" database (which incorporates all bacterial and viral whole genomes
from RefSeq (O'Leary et al., 2016) as of October 20 15). Additionally included were the whole
human genome (hg38), genomes from PlasmoDB (Aurrecoechea et al., 2009), and sequences
covering mosquito genomes (Aedes aegypti, Aedes albopictus, Anopheles albimanus, Anopheles
quadrimaculatus, Culex quinquefasciatus, and the outgroup Drosophila melanogaster) from

GenBank (Clark et al., 20 16), protozoa and fungi whole genomes from RefSeq, SILVA LTP 16s
rRNA sequences (Yarza et al., 2008), and all sequences from NCBI's viral accession list (as of
October 2015) for viral taxa that have human as a host.
[0171] For each sample, Kraken was run and its output reports were searched for viral taxa
with more than 100 reported reads. The results were manually filtered to remove ZIKV,
bacteriophages, and likely lab contaminants. For each sample and its associated taxa, genomes
were assembled using viral-ngs as described above. The following genomes were used for
taxonomically filtering reads and as t e reference for assembly: KJ74 1267. 1 (cell fusing agent
virus), AY292384. 1 (deformed wing virus), and LC164349. 1 (JC polyomavirus). When
reporting sequence identity of an assembly with a taxon, the identity used was that determined
by BLASTN (Altschul et al., 1997) when t e assembly compared against the reference genome
used for assembly.
[0172] To focus on metagenomics of mosquito pools (Table 1), unbiased sequencing data
from 8 mosquito pools were considered (not including hybrid capture data). First the depletion
pipeline of viral-ngs was run on raw data and then run on the viral-ngs Trinity44 assembly
pipeline on the depleted reads to assemble them into contigs. Contigs from all mosquito pool
samples were pooled and all duplicate contigs were identified with sequence identity >95%
using CD-HIT45 . Additionally, predicted coding sequences from Prodigal 2.6.346 were used to
identify duplicate protein sequences at >95% identity. Contigs were classified using BLASTN43
against nt and BLASTX 4 against nr (as of February 2017) and contigs with an e-value greater
than 1E-4 were discarded. Viral contigs are defined as contigs that hit a viral sequence, and all
reverse-transcriptase-like contigs were removed due to their similarity to retrotransposon
elements within the Aedes aegypti genome. Viral contigs with less than 80% amino acid identity
to their best hit as likely novel viral contig were categorized. Table 9 lists the unique viral
contigs found, their best hit, and information scoring the hit.
Relationship between metadata and sequencing outcome
[0173] To determine if metadata are predictive of sequencing outcome, the following
variables were tested: sample collection site, patient gender, patient age, sample type, and the
number of days between symptom onset and sample collection ("collection interval"). To
describe sequencing outcome of a sample S, the following response variable Ys were used:

mean({ 1(R) * (number of unambiguous bases in R) for all amp-seq replicates R of S }), where
I(i?)=l if median depth of coverage of R >500 and l(R)=0 otherwise.
[0174] The one sample of type "Saliva," the one sample of type "Cerebrospinal fluid," t e
samples from mosquito pools, and rows with missing values were excluded. Samples with type
"Plasma EDTA" were treated as having type "Plasma," and the "collection interval" variable
was treated as categorical (0-1, 2-3, 4-6, and 7+ days).
[0175] With a single model, the zero counts were underfit, possibly because many zeros (no
positive Zika virus assembly) are truly Zika-negative. The data is thus viewed as coming from
two processes: one determining whether a sample is Zika-positive or Zika-negative, and another
that determines, among the observed positive samples, how much of a Zika genome that is able
to be sequenced. The first process was modeled with logistic regression (in R using GLM (R
Core Team 2016) with binomial family and logit link); the positive observed samples are the
samples S for which Ys > 2500. For the second, a beta regression was performed, using only
the positive observed samples, of Ys divided by Zika genome length on the predictor variables.
This was implemented in R using the betareg package (Cribari-Neto et a , 2010) and fractions
from the closed unit interval were transformed to the open unit interval as the authors suggest.
[0176] To test the significance of predictor variables, a likelihood ratio test was used. For
variable X , a full model (with all predictors) was compared against a model that uses all
predictors except Xi. Results are shown in FIG. 17.
Visualization of coverage depth across genomes
[0177] For amplicon-based sequencing data, coverage was plotted across 97 samples that
yielded a positive assembly by either method and for which amplicon-based data was obtained
(FIG. 16c). With viral -ngs, depleted reads were aligned to the reference sequence KX 197 192. 1
using the novoalign aligner with options '-r Random - 1 40 -g 40 -x 20 -t 100 -k' . There was no
duplicate removal. Depth was binarized at each nucleotide position, showing red if depth of
coverage was at least 500x. Rows (samples) were hierarchically clustered to ease visualization.
[0178] For hybrid capture sequencing data, depth of coverage was plotted across the 37
samples that yielded a passing assembly (FIG. 16c). Reads were aligned as described above for
amplicon sequencing data, except duplicates were removed. For each sample, depth of coverage
was calculated at each nucleotide position. The values for each sample were then scaled so that
each would have a mean depth of 1.0. At each nucleotide position, the median depth across the

samples was calculated, as well as the 20 and 80 percentiles. The mean of each of these
metrics was plotted within a 200-nt sliding window.
Criteria for pooling across replicates
[0179] Sequencing was attempted for one or more replicates of each sample and a genome
assembled from each replicate. Data from any replicates whose assembly showed high
sequence similarity was discarded, in any part of the genome, to the assembly of a sample
consisting of an African (Senegal) lineage (strain HD78788). This sample was used as a positive
control throughout this study, and its presence was considered in the assembly of a clinical
sample to be evidence of contamination. Any data from replicates that showed evidence of
contamination was also discarded, at the RNA stage, by the baits used for hybrid capture; these
were detected by looking for adapters that were added to these probes for amplification.
[0180] For the amplicon sequencing approach, an assembly was considered positive if it
contained at least 2500 unambiguous base calls and had a median depth of coverage of at least
500x over its unambiguous bases (depth was calculated including duplicate reads). For the
unbiased and hybrid capture approaches, an assembly of a replicate was considered positive if it
contained at least 4000 unambiguous base calls at any coverage depth. For each approach, the
unambiguous base threshold was selected based on an observed density of negative controls
below the threshold (FIG. 16b). For assemblies from amplicon sequencing data, a threshold on
depth of coverage was added because coverage depth was roughly binary across replicates, with
negative controls falling in the lower class. Based on these thresholds, it was found that 0 of 87
negative controls used throughout the sequencing runs yielded positive assemblies and that 29
of 29 positive controls yielded positive assemblies.
[0181] A sample was considered to have a positive assembly if any of its replicates, by either
method, yielded an assembly that passed the above thresholds. For each sample with at least one
positive assembly, read data was pooled across replicates for each sample, including replicates
with assemblies that did not pass the positivity thresholds. When data was available by both
amplicon-based sequencing and unbiased/hybrid capture approaches, amplicon sequencing data
was pooled separately from data produced by the unbiased and hybrid capture approaches, the
latter two of which were pooled together (henceforth, the "hybrid capture" pool). A genome was
then assembled from each set of pooled data. When assemblies on pooled data were available
from both approaches, the assembly was selected from the hybrid capture approach if it had

more than 10267 unambiguous base calls (95% of t e reference, GenBank accession
KX197 192. 1); when both assemblies had fewer than this number of unambiguous base calls, the
one that had more unambiguous base calls was selected.
[0182] The number of ZIKV genomes publicly available prior to this study was the result of
a GenBank (Clark e t al., 2016) search for ZIKV in February 20 17. Any sequences with length
<4000 nt were filtered, and sequences that were part of the present study or that were labeled as
having been passaged were excluded. Less than 100 sequences were counted.
Multiple sequence alignments
[0183] ZIKV consensus genomes were aligned using MAFFT v7.22 1 (Katoh e t al., 20 13)
with the following parameters: '--maxiterate 1000 ~ep 0 .123 —localpair' .
Analysis of within- and between-sample variants
[0184] To measure overall per-base discordance between consensus genomes produced by
amp-seq and hybrid capture, all sites where base calls were made in both the amp-seq and
hybrid capture consensus genomes of a sample were considered, and the fraction in which the
alleles were not in agreement was calculated. To measure discordance at minor alleles, all of the
consensus genomes generated in this study that were selected for downstream analysis were
searched for minor alleles (see Criteria for pooling across replicates for choosing among the
amp-seq and hybrid capture genome when both are available). All positions at which there was a
minor allele and for which genomes from both methods were available were evaluated, and the
fraction in which the alleles were not in agreement were calculated. For both calculations,
partial ambiguity was tolerated (e.g., 'Y' is concordant with 'T'). If one genome had full
ambiguity ('Ν ' ) at a position and the other genome had an indel, the site was counted as
discordant; otherwise, if one genome had full ambiguity, it was not counted.
[0185] After assembling genomes, within-sample allele frequencies were determined for
each sample by running V-Phaser 2.0 via viral-ngs 7 on all pooled reads mapping to the sample
assembly. When determining per-library allele counts at each variant position, viral-ngs were
modified to require a minimum base (Phred) quality score of 30 for all bases, to discard
anomalous read pairs, and to use per-base alignment quality (BAQ) in its calls to SAMtools 50
mpileup. This was particularly helpful for filtering spurious amplicon sequencing variants
because all generated reads start and end at a limited number of positions (due to the pre
determined tiling of amplicons across the genome). Because amplicon sequencing libraries were

sequenced using 250 bp paired-end reads, bases near the middle of t e -450 nt amplicons fall at
the end of both paired reads, where quality scores drop and incorrect base calls are more likely.
To determine the overall frequency of each variant in a sample, allele counts were summed
(calculated using SAMtools 50 mpileup via viral-ngs) across libraries.
[0186] When comparing allele frequencies across methods: let f a and fi, c be frequencies in
amplicon sequencing and hybrid capture, respectively. If both were non-zero, an allele was
included only if the read depth at its position was > l /min( , f c) in both methods, and if depth at
the position was at least 100 for hybrid capture and 275 for amplicon sequencing. a read
depth of max( l / , 275) at the position in the amplicon sequencing method was used; similarly,
100) at the position in the hybrid capture method was used.
This was to eliminate lack of coverage as a reason for discrepancy between two methods. When
comparing allele frequencies across sequencing replicates within a method, only a minimum
read depth (275x for amplicon sequencing and lOOx for hybrid capture) was imposed, but
required this depth in both libraries. In samples with more than two replicates, only the two
replicates with the highest depth at each plotted position were considered. .
[0187] Allele frequencies from hybrid capture sequencing were considered to be "verified" if
they passed the strand bias and frequency filters described in Gire e t al., 20 14, with the
exception that a variant identified in only one library was allowed if its frequency was >5%. In
Table 8 and FIG. 16f, the same strand bias filter was applied, but not the minimum frequency
filter. In FIG. 16e and f, alleles were considered "validated" if they were present at above 0.5%
frequency in both libraries or methods. When comparing two libraries for a given method M
(amp-seq or hybrid capture): the proportion unvalidated was the fraction, among all variants in
M at >0.5% frequency in at least one library, of the variants that are at >0.5% frequency in
exactly one of the two libraries. Similarly, when comparing methods: the proportion unvalidated
for a method M was the fraction, among all variants at >0.5% frequency in M , of the variants
that are at >0.5% frequency in M and <0.5% frequency in the other method. The root mean
squared error includes only points found in both methods or replicates (i.e., does not include
unvalidated alleles). Restricting the sample set used for comparison of alleles across libraries to
only samples with a positive assembly in both methods had no significant impact on the results.
[0188] SNPs were initially called on the aligned consensus genomes using Geneious version
9 .1.7 (Kearse e t al., 20 12). Since Geneious treats ambiguous base calls as variants, the SNP set

was filtered and allele frequencies were re-calculated directly from the consensus genomes,
treating fully or partially ambiguous calls as missing data. A nonsynonymous SNP is shown on
the tree (FIG. 20b) if it includes an allele that is nonsynonymous relative to t e ancestral state
(see Molecular clock phylogenetics and ancestral state reconstruction section below) and has an
allele frequency of >5%; all occurrences of nonsynonymous alleles are shown. Mutations were
placed at a node such that the node leads only to samples with the mutation or with no call at
that site. Uncertainty in placement occurs when a sample lacks a base call for the corresponding
SNP; in this case, the SNP was placed on t e most recent branch for which data was available.
This ancestral ZIKV state was used to count the frequency of each type of substitution over
various regions of the ZIKV genome, per number of available bases in each region (FIG. 20d
and Table 8).
[0189] The effect of nonsynonymous SNPs was quantified using the original BLOSUM62
scoring matrix for amino acids (Henikoff and Henikoff 1992), in which positive scores indicate
conservative amino acid changes and negative scores unlikely or extreme substitutions.
Statistical significance was assessed for equality of proportions by test (FIG. 20c, middle),
and for difference of means by 2-sample t-test with Welch-Satterthwaite approximation of df
(FIG. 20c, right). All error bars indicate 95% confidence intervals.
Maximum likelihood estimation and root-to-tip regression
[0190] A maximum likelihood tree was generated using a multiple sequence alignment that
includes sequences generated in this study, as well as a selection of other available sequences
from the Americas, Southeast Asia, and Pacific. IQ-TREE (Nguyen e t al., 20 15) was run with
options '-m HKY+G4 -bb 1000' (Minh e t al, 2013). In FigTree v l .4.2 (Rambaut 2014), the tree
was rooted on the oldest sequence used as input (GenBank accession EU545988. 1).
[0191] TempEst v l .5 was used (Rambaut e t al, 2016), which selects the best-fitting root
with a residual mean squared function (also EU545988. 1), to estimate root-to-tip distances.
Regression was performed in R with the lm function (R Core Team 2016) of distances on dates.
Molecular clock phylogenetics and ancestral state reconstruction
[0192] For molecular clock phylogenetics, a multiple sequence alignment was made from the
genomes generated in this study combined with a selection of other available sequences from
the Americas. Sequences from outside the outbreak in the Americas were not used. Among
ZIKV genomes published and publicly available on NCBI GenBank35, 32 were selected from

the Americas that had at least 7000 unambiguous bases, were not labeled as having been
passaged more than once, and had location metadata. In addition, 32 genomes from Brazil
published in a companion paper 10 that met the same criteria were used.
[0193] BEAST vl .8.4 was used to perform molecular clock analyses56 . Sampled tip dates
were used to handle inexact dates57 . Because of sparse data in non-coding regions, only the CDS
was used as input. The SDR06 substitution model was used on the CDS, which uses HKY with
gamma site heterogeneity and partitions codons into two partitions (positions (1+2) and 3)58. To
perform model selection, three coalescent tree priors were tested: a constant-size population, an
exponential growth population, and a Bayesian Skyline tree prior (10 groups, piecewise-
constant model)59 . For each tree prior, two clock models were tested: a strict clock and an
uncorrelated relaxed clock with lognormal distribution (UCLN)60 . In each case, the molecular
clock rate was set to use a continuous time Markov chain rate reference prior6 1. For all six
combinations of models, path sampling (PS) and stepping-stone sampling (SS) were performed
to estimate marginal likelihood62'63 . Sampling was done for 100 path steps with a chain length of
1 million, with power posteriors determined from evenly spaced quantiles of a Beta(alpha=0.3;
1.0) distribution. The Skyline tree prior provided a better fit than the two other (baseline) tree
priors (Table 7), so this tree was used prior for all further analyses. Using a constant or
exponential tree prior, a relaxed clock provides a better model fit, as shown by the log Bayes
factor when comparing the two clock models. Using a Skyline tree prior, the log Bayes factor
comparing a strict and relaxed clock is smaller than it is using the other tree priors, and it is
similar to the variability between estimated log marginal likelihood from PS and SS methods. A
relaxed clock was chosen for further analyses, but key findings were also reported using a strict
clock.
[0194] For the tree and tMRCA estimates in FIG. 17, as well as the clock rate reported in
main text, BEAST was run with 400 million MCMC steps using the SRD06 substitution model,
Skyline tree prior, and relaxed clock model. Clock rate and tMRCA estimates, and their
distributions, were extracted with Tracer v l .6.0 and the maximum clade credibility (MCC) tree
was identified using TreeAnnotator v l .8.2. The reported credible intervals around estimates are
95% highest posterior density (HPD) intervals. When reporting substitution rate from a relaxed
clock model, the mean rate was given (mean of the rates of each branch weighted by the time
length of the branch). Additionally, for the tMRCA estimates in FIG. 17c with a strict clock,

BEAST was run with the same specifications (also with 400M steps) except used a strict clock
model. The resulting data are also used in the more comprehensive comparison shown in FIG.
25 .
[0195] For the data with an outgroup in FIG. 25, BEAST was run t e same as specified
above (with strict and relaxed clock models), except with 100 million steps and with outgroup
sequences in the input alignment. The outgroup sequences were the same as those used to make
the maximum likelihood tree. For the data excluding sample DOM_20 16_MA-WGS 16-020-
SER in FIG. 25, BEAST was run the same as specified above (with strict and relaxed clocks),
except this sample was removed from the input and 100 million steps were run.
[0196] BEAST v l .8.4 was used to estimate transition and transversion rates with CDS and
non-coding regions. The model was the same as above except that we used the Yang96
substitution model on the CDS, which uses GTR with gamma site heterogeneity and partitions
codons into three partitions64; for the non-coding regions, a GTR substitution model was used
with gamma site heterogeneity and no codon partitioning. There were four partitions in total:
one for each codon position and another for the non-coding region (5' and 3' UTRs combined).
This was run for 200 million steps. At each sampled step of the MCMC, substitution rates were
calculated for each partition using the overall substitution rate, the relative substitution rate of
the partition, the relative rates of substitutions in the partition, and base frequencies. In FIG. 26,
the means of these rates over the steps were plotted; the error bars shown are 95% HPD
intervals of the rates over the steps.
[0197] BEAST vl .8.4 was used to reconstruct ancestral state at the root of the tree using
CDS and non-coding regions. The model was the same as above except that, on the CDS, the
HKY substitution model was used with gamma site heterogeneity and codons partitioned into
three partitions (one per codon position). On the non-coding regions the same substitution model
was used without codon partitioning. This was run for 50 million steps and TreeAnnotator
v l .8.2 was used to find the state with the MCC tree. The ancestral state was selected
corresponding to this state. In all BEAST runs, the first 10% of states were discarded from each
run as burn-in.
Principal components analysis
[0198] PCA was conducted using the R package FactoMineR (Le e t al., 2008). Missing data
was imputed with the package missMDA (Josse e t al., 20 16). Removing the two most extreme

outlier samples from the plot clarified population structure, and the results are shown in FIG.
18b.
Diagnostic assay assessment
[0199] Primer and probe sequences (FIG. 20e) were extracted from eight published RT-
qPCR assays (Pyke et al, 2014; Lanciotti et al, 2008; Faye et al, 2008, 2013; Balm et al,
2012; Tappe et al, 2014) and aligned to our ZIKV genomes using Geneious version 9.1.7.
(Kearse et al., 2012). Matches and mismatches were then tabulated to the diagnostic sequence
for all outbreak genomes, allowing multiple bases to match where the diagnostic primer and/or
probe sequence contained nucleotide ambiguity codes. Sequences used in the present study are
provided in Table 3.
[0200] Links to publicly available data used in methods Hybrid capture probes that target
Zika and Chikungunya viruses storage.googleapis.com/sabeti-public/hybsel_probes/zikv-
chikv_201602.fasta [2.25 MB]. Probe sequences are 140 nt. They contain 20 nt adapters on each
end for PCR amplification; t e middle 100 nt targets the virus.
[0201] Kraken database built for identifying viruses in samples by unbiased sequencing
storage.googleapis.com/sabeti-public/meta_dbs/kraken_full-and-mosquito-and-all_huma
n_viral.tar.gz [185.25 GB]
[0202] Sequences used for taxonomic filtering or analyses Sequences against which reads
from unbiased and hybrid capture approaches were taxonomically filtered.
[0203] GenBank accessions: KX087101.2 KX198135.1 KX101066.1 KU501215.1
KX197192.1 KU365779.1 KU991811.1 KU681082.3 KU955589.1 KU926309.1 KU321639.1
KX087102.1 KX253996.1 HQ234500.1 KF383115.1 KU955591.1 KF383117.1 KU955593.1
KF383119.1 KX156775.1 KU922923.1 KU729218.1 KF268950.1 KU820899.2 KU866423.1
NC_012532.1 KU365777.1 KU955590.1 KF268948.1 KU501216.1 KU647676.1 KX198134.1
KU963574.1 KU527068.1 KU937936.1 KX101062.1 KX262887.1 DQ859059.1 KX051563.1
KU820897.2 KU497555.1 KU926310.1 KU681081.3 KU707826.1 KU509998.3 AY632535.2
KX156774.1 KX247646.1 KU820898.1 KU365780.1 HQ234501.1 KU940228.1 HQ234498.1
KU955592.1 KF383118.1 JN860885.1 KU365778.1 KU955595.1 KX185891.1 KU922960.1
KX156776.1 KJ776791.1 KU853013.1 KU744693.1 KX056898.1 KF383116.1 KU761564.1
KU963796.1 KU853012.1 KU3 123 12.1 LC002520.1 HQ234499.1 KU963573.1 KU729217.2

KU870645.1 KF993678.1 KU501217.1 KF383120.1 KF268949.1 KX117076.1 EU545988.1
KU955594.1
[0204] Sequences used in molecular clock phylogenetic analyses and SNP analyses All
sequences generated in this study, as well as: · 32 published sequences from the Americas.
GenBank accessions: KU312312.1 KU321639.1 KU365777.1 KU365778.1 KU365779.1
KU497555.1 KU501216.1 KU501217.1 KU509998.3 KU527068.1 KU647676.1 KU707826.1
KU729217.2 KU729218.1 KU820897.5 KU853012.1 KU853013.1 KU926310.1 KU940224.1
KU940227.1 KU940228.1 KX051563.1 KX101060.1 KX101061.1 KX101066.1 KX269878.1
KX280026.1. 5 sequences from Colombia, with permission from the authors. GenBank
accessions: KY3 17936.1 KY3 17937.1 KY3 17938.1 KY3 17939.1 KY3 17940.1. 32 sequences
generated in t e ZiBRA project, with permission from the authors. ZiBRA project IDs:
ZBRA105 ZBRC14 ZBRC16 ZBRC18 ZBRC28 ZBRC301 ZBRC302 ZBRC313 ZBRC319
ZBRC321 ZBRD103 ZBRD107 ZBRD116 ZBRX1 ZBRX2 ZBRX4 ZBRX7 ZBRX8 ZBRX11
ZBRX12 ZBRX13 ZBRX14 ZBRX15 ZBRX16 ZBRXIOO ZBRX102 ZBRX103 ZBRX106
ZBRX127 ZBRX128 ZBRX130 ZBRX137
[0205] Sequences used for maximum likelihood estimation and root-to-tip regression.
Sequences from "Sequences used in molecular clock phylogenetic analyses and SNP analyses"
as well as 6 outgroup sequences from Southeast Asia and the South Pacific. These
outgroup sequences are: · 6 published sequences. GenBank accessions: EU545988.1
JN860885.1 KF993678.1 KJ776791.2 KU681081.3 KU681082.3
[0206] Table 4 listed below provides observed non-synonymous SNPs across the data used
for SNP analysis. Includes frequency and count of ancestral and derived alleles at each position,
as well as amino acid changes caused by each SNP.

Table 4

66

[0207] Table 5 below provides substitution rates across the 164 genomes analyzed (100 of
which were sequenced as part of this study). Includes observed mutations per available base as
well as substitution rates estimated by BEAST.

Table 6. Sequences used in the present study. R refers to A or G; Y refers to C or T; Srefers to G or C; W refers to A or T.
qPCR Assay Assay Assay Reverse Assay PCR-Probe Amplicon (Target Sequence)Forward PrimerPrimer
Zi a GGCTTG CCCTCAATG AGATGGCCTC GGCTTGAAGCAAGAATGCAAGCAA GCTGCTACTT ATAGCCTCGCTCTA TCCTTGACAATATTTACCTCGAATGC TC T (Seq. ID No. (Seq. I.D. No. 5) CAAGATGGCCTCATAGCCT(Seq. ID. No. 4) CGCTCTATCGACCTGAGGC3) CGACAAAGTAGCAGCCAT
TGAGGG (Seq. I.D. No. 6)
Zi a ATTGAGGA GTTCTTTCCT AAGACGGCTG ATTGAGGAATGGTGCTGTAATGGTGCT GGGCCTTATC CTGGTATGGAATGG GGGAATGCACAATGCCCCGTAGG T (Seq. I.D. No. (Seq. I.D. No. 9) CACTATCGTTTCGAGCAAA(Seq. I.D. No. 8) AGACGGCTGCTGGTATGGV) AATGGAGATAAGGCCCAG
GAAAGAAC (Seq. I.D. No.10)
Zika TCATGAAG CTCAGCCGC TGCAAAGCTATGGG TCATGAAGAACCCGTGTTGAACCCRTG CATRTGRAA TGGAACA (Seq. I.D. GTGCAAAGCTATGGGTGGYTGG (Seq. GA (Seq. I.D. No. 13) AACATAGTCCGTCTTAAGAI.D. No. 11) No. 12) GTGGGGTGGACGTCTTTCA
TATGGCGGCTGAG (Seq.I.D. No. 14)
Zika AGYYGAYT YTCCTCAATC ACCTGGTCAATCCA AGTTGACTGGGTTCCAACTGGGTHCCA CACACTCTRT TGGAAAGGGA (Seq. GGGAGAACTACCTGGTCAAC TG (Seq. TC (Seq. I.D. I.D. No. 17) ATCCATGGAAAGGGAGAAI.D. No. 15) No. 16) TGGATGACCACTGAAGAC
ATGCTTGTGGTGTGGAACAGAGTGTGGATTGAGGAG(Seq. I.D. No. 18)
Zika CCAYTTCA TTTGCWARC TGCCGCCACCAAGA CCACTTCAACAAGCTCCATACAARCTS ARGCAGTCT TGAACTGA (SEQ. CTCAAGGACGGGAGGTCCYAYCT C (SEQ. I.D. I.D. No. 21) ATTGTGGTTCCCTGCCGCC(SEQ. I.D. No. 20) ACCAAGATGAACTGATTGNo. 19) GCCGGGCCCGCGTCTCTCC
AGGGGCGGGATGGAGCATCCGGGAGACTGCTTGCCTAGCAAA (SEQ. I.D. No. 22)
Zika TSYAGGGA ACTAAGTTR TGGTATGGAATGGA AGGGAGTGCACAATGCCCRTGCACAA CTYTCTGGTT GATAAGGCCC (SEQ. CCACTGTCGTTCCGGGCTAT (SEQ. I.D. CYTTY (SEQ. I.D. No. 25) AAGATGGCTGTTGGTATGGNo. 23) I.D. No. 24) AATGGAGATAAGGCCCAG
GAAAGAACCAGAAAGCAACTTAGTAAGG (SEQ. I.D.No. 26)
Zika AGAGACCC CTCGGTGAT AGATGTCGGC AGAGACCCTGGGAGAGAATGGGAGAG GCCTGA CCTGGAGTT CTACT ATGGAAGGCCCGCTTGAAAA AT (SEQ. CTTT (SEQ. (SEQ. I.D. No. 29) CCAGATGTCGGCCCTGGAI.D. No. 27) I.D. No. 28) GTTCTACTCCTACAAAAAG

TCAGGCATCACCGAG(SEQ. I.D. No. 30)
Chikungunya TTTGCAAG GTAGCTGTA GAGAAGCTCAGAG TTTGCAAGCTCCAGATCCACTCCAGAT GTGCGTACCT GACCCGT (SEQ. I.D. ACTTCGAGAAGCTCAGAGCCA (SEQ. ATTT (SEQ. No. 33) GACCCGTCATAACTTTGTAI.D. No. 31) I.D. No. 32) CGGCGGTCCTAAATAGGTA
CGCACTACAGCTAC (SEQ.I.D. No. 34)
Chikungunya CGTTCTCG TGATCCCGA GTACTTCCTGTCCG CGTTCTCGCATCTAGCCATCATCTAGC CTCAACCAT ACATCATC (SEQ. I.D. AAAACTAATAGAGCAGGACATAA CCTGG (SEQ. No. 37) AATTGATCCCGACTCAACC(SEQ. I.D. I.D. No. 36) ATCCTGGATATAGGTAGTGNo. 35) CGCCAGCAAGGAGGATGA
TGTCGGACAGGAAGTAC(SEQ. I.D. No. 38)
Chikungunya CCCGACTC GCAGACGCA CCAGCAAGG A CCCCGACTCAACCATCCTGAACCATCC GTGGTACTT GGATGATGT GATATCGGCAGTGCGCCAGTG (SEQ. (SEQ. I.D. No. CGG (SEQ. I.D. No. CAAGGAGGATGATGTCGGI.D. No. 39) 40) 41) ACAGGAAGTACCAGGAAG
TACCACTGCGTCTGCC(SEQ. I.D. No. 42)
Dengue AACCWAC GRGAAWCTC TCAATATGCTG AACCTACGAAAAAAGACGGRAARAAG TTYGYYARC AAACGC (SEQ. I.D. GCTCGACCGTCTTTCAATARCGV (SEQ. TG (SEQ. I.D. No. 45) TGCTGAAACGCGCGAGAAI.D. No. 43) No. 44) ACCGCGTGTCAACTGTTTC
ACAGTTGGCGAAGAGATTCTC (SEQ. I.D. No. 46)
Dengue Same as Same as listed CG TCT TTC AA TAT Same as listed abovelisted above above GCT GAA ACG CGC
(SEQ. I.D. No. 47)
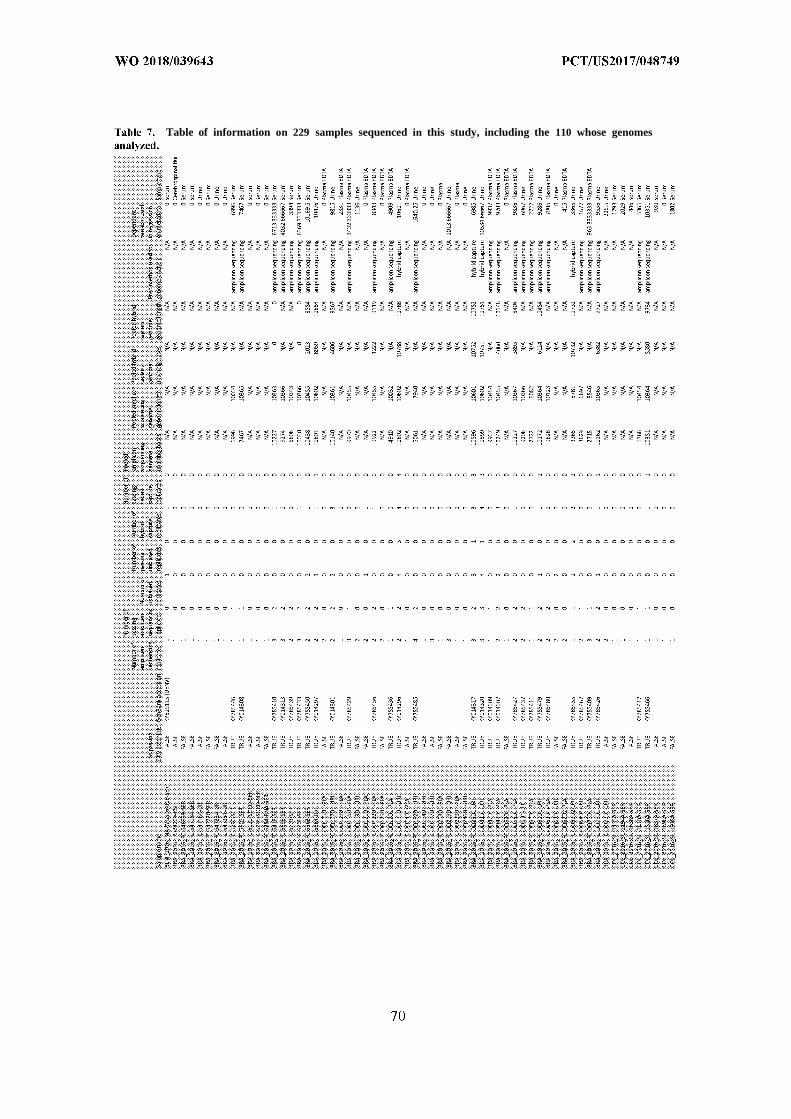
Table of information on 229 samples sequenced in this study, including the 110 whose genomes


; < < < < < < < <
< < < < < < < < < < ; < < < < < < < <
: < < < < < < < < < < < < < < < < < < < < < < < < < < < <


Table 8. Table listing observed nonsynonymous SNPs across data used for SNP analysis.
a 2 _ _
> 2 -
I-
¾

E
m Ώ

< < < < < < < < <
< < < -< < < < < < < < < < << < < < < < < < < < < - < < < s g s s < < << < < < <
< < << < < << < < < < < < < < < < < << -< < < < < < < < < b < < < - < < < < < <

> > < > > < -
< >
< 3 I-< < < < < < << < < P< < 3 < < < < < < << <
< < < 3 3 - < < y 3<y < - << < <<
< I— 3<< 3<< < < < < <
< < < < < << < < << < <
d d d d d d d d
d d d d d d d d d d d d d d d d d d d d
u < u ΰ < <
< < J J J < < <

10090
CT
0.84667
0.15333
23
150
808
1ACT
->ATT
T->1
NS5
10101
cA
0.9932
0.0068
1147
812
1CTT
->ATT
L->1
NS5
10155
AG
0.99301
0.00699
1143
830
1ACC
->GCC
T->A
NS5
10164
AG
0.91667
0.08333
12
144
833
1ACG
->GCG
T->A
NS5
10165
CT
0.99306
0.00694
1144
833
1ACG
->ATG
T->M
NS5
10221
CT
0.99301
0.00699
1143
852
1CTC->TTC
L->F
NS5
10295
AG
0.98611
0.01389
2144
876
3ATA
->ATG
1->M
NS5
10301
TG
0.64336
0.35664
51
143
878
2GAT
->GAG
D->E
NS5
10315
C0.99301
0.00699
1143
883
1ATG
->ACG
M->
TNS5

Table 9. Substitution rates across the 174 genomes analyzed (110 of which weresequenced).

Table 10. Unique viral contigs assembled from 8 mosquito pools. Includes the best hit of each contig according to aBLASTN/BLASTX search and information scoring the hit.

8 1

[0208] Various modifications and variations of the described methods, pharmaceutical
compositions, and kits of the invention will be apparent to those skilled in the art without
departing from the scope and spirit of the invention. Although the invention has been
described in connection with specific embodiments, it will be understood that it is capable of
further modifications and that the invention as claimed should not be unduly limited to such
specific embodiments. Indeed, various modifications of the described modes for carrying out
the invention that are obvious to those skilled in the art are intended to be within the scope of
the invention. This application is intended to cover any variations, uses, or adaptations of the
invention following, in general, the principles of the invention and including such departures
from the present disclosure come within known customary practice within the art to which the
invention pertains and may be applied to the essential features herein before set forth.

References
Akiyama, Benjamin M., Hannah M . Laurence, Aaron R . Massey, David A . Costantino,
Xuping Xie, Yujiao Yang, Pei-Yong Shi, Jay C . Nix, J . David Beckham, and Jeffrey S.
Kieft. 2016. "Zika Virus Produces Noncoding RNAs Using a Multi-Pseudoknot Structure
That Confounds a Cellular Exonuclease." Science 354 (6316): 1148-52.
Altschul, S. , T. L . Madden, A . A . Schaffer, J . Zhang, Z . Zhang, W. Miller, and D . J . Lipman.
1997. "Gapped BLAST and PSI-BLAST: A New Generation of Protein Database Search
Programs " Nucleic Acids Research 25 (17): 3389-3402.
Aurrecoechea, Cristina, John Brestelli, Brian P. Brunk, Jennifer Dommer, Steve Fischer,
Bindu Gajria, Xin Gao, et al. 2009. "PlasmoDB: A Functional Genomic Database for
Malaria Parasites. Nucleic Acids Research 37 (Database issue): D539-43.
Avesson, Lotta, and Guy Barry. 2014. "The Emerging Role of RNA and DNA Editing in
Cancer." Biochimica et Biophysica Acta 1845 (2): 308-16.
Brinton, Margo A., and Mausumi Basu. 2015. "Functions of the 3' and 5' Genome RNA
Regions of Members of the Genus Flavivirus." Virus Research 206: 108-19.
Cribari-Neto, Francisco, and Achim Zeileis. 2010. "Beta Regression in R." Journal of
Statistical Software 34 (1): 1-24.
Donald, Claire L., Benjamin Brennan, Stephanie L . Cumberworth, Veronica V. Rezelj, Jordan
J . Clark, Marli T. Cordeiro, Rafael Freitas de Oliveira Franca, et al. 2016. "Full Genome
Sequence and sfRNA Interferon Antagonist Activity of Zika Virus from Recife, Brazil."
PLoS Neglected Tropical Diseases 10 (10): e0005048.
Drummond, A . J., A . Rambaut, B . Shapiro, and O . G . Pybus. 2005. "Bayesian Coalescent
Inference of Past Population Dynamics from Molecular Sequences." Molecular Biology
and Evolution 22 (5): 1185-92.
Drummond, Alexei J., Marc A . Suchard, Dong Xie, and Andrew Rambaut. 2012. "Bayesian

Phylogenetics with BEAUti and the BEAST 1.7." Molecular Biology and Evolution 29
(8): 1969-73.
Faria, Nuno Rodrigues, Raimunda do Socorro da Silva Azevedo, Moritz U . G . Kraemer,
Renato Souza, Mariana Sequetin Cunha, Sarah C . Hill, ien Theze, et al. 2016. "Zika
Virus in the Americas: Early Epidemiological and Genetic Findings." Science 352 (6283):
345-49.
Faye, Oumar, Ousmane Faye, Diawo Diallo, Mawlouth Diallo, Manfred Weidmann, and
Amadou Alpha Sail. 2013. "Quantitative Real-Time PCR Detection of Zika Virus and
Evaluation with Field-Caught Mosquitoes." VirologyJournal 10 (October): 311.
Ferreira, Marco A . R., and Marc A . Suchard. 2008. "Bayesian Analysis of Elapsed Times in
Continuous-Time Markov Chains." The Canadian Journal of Statistics = Revue
Canadienne de Statistique 36 (3). Wiley-Blackwell: 355-68.
Gire, Stephen K., Augustine Goba, Kristian G . Andersen, Rachel S. G . Sealfon, Daniel J .
Park, Lansana Kanneh, Simbirie Jalloh, et al. 2014. "Genomic Surveillance Elucidates
Ebola Virus Origin and Transmission during the 2014 Outbreak." Science 345 (6202):
1369-72.
Hemert, Formijn van, and Ben Berkhout. 2016. "Nucleotide Composition of the Zika Virus
RNA Genome and Its Codon Usage." VirologyJournal 13 (June): 95.
Henikoff, S., and J . G . Henikoff. 1992. "Amino Acid Substitution Matrices from Protein
Blocks." Proceedings of the National Academy of Sciences of the United States of
America 89 (22): 10915-19.
Josse, Julie, and Francois Husson. 2016. "missMDA: A Package for Handling Missing Values
in Multivariate Data Analysis." Journal of Statistical Software 70 (1): 1-31.
Katoh, Kazutaka, and Daron M . Standley. 2013. "MAFFT Multiple Sequence Alignment
Software Version 7 : Improvements in Performance and Usability."Molecular Biology and

Evolution 30 (4): 772-80.
Kearse, Matthew, Richard Moir, Amy Wilson, Steven Stones-Havas, Matthew Cheung, Shane
Sturrock, Simon Buxton, et al. 2012. "Geneious Basic: An Integrated and Extendable
Desktop Software Platform for the Organization and Analysis of Sequence Data."
Bioinformatics 28 (12): 1647-49.
Lanciotti, Robert S., Olga L . Kosoy, Janeen J . Laven, Jason O . Velez, Amy J . Lambert, Alison
J . Johnson, Stephanie M . Stanfield, and Mark R . Duffy. 2008. "Genetic and Serologic
Properties of Zika Virus Associated with an Epidemic, Yap State, Micronesia, 2007."
Emerging Infectious Diseases 14 (8): 1232-39.
Le, S., J . Josse, and F. Husson. 2008. "FactoMineR: An R Package for Multivariate Analysis."
Journal of Statistical Software. Citeseer.
http://citeseerx.ist.psu. edu/viewdoc/download?doi=10.1.1.422.7829&rep=repl&type=pdf.
Matranga, Christian B., Kristian G . Andersen, Sarah Winnicki, Michele Busby, Adrianne D .
Gladden, Ryan Tewhey, Matthew Stremlau, et al. 2014. "Enhanced Methods for Unbiased
Deep Sequencing of Lassa and Ebola RNA Viruses from Clinical and Biological
Samples." Genome Biology 15 (11): 519.
Minh, Bui Quang, Minh Anh Thi Nguyen, and Arndt von Haeseler. 2013. "Ultrafast
Approximation for Phylogenetic Bootstrap." Molecular Biology and Evolution 30 (5):
1188-95.
Morlan, John D., Kunbin Qu, and Dominick V. Sinicropi. 2012. "Selective Depletion of rRNA
Enables Whole Transcriptome Profiling of Archival Fixed Tissue." PloS One 7 (8):
e42882.
Nguyen, Lam-Tung, Heiko A . Schmidt, Arndt von Haeseler, and Bui Quang Minh. 2015. "IQ-
TREE: A Fast and Effective Stochastic Algorithm for Estimating Maximum-Likelihood
Phylogenies. "Molecular Biology and Evolution 32 (1): 268-74.

Park, Daniel J., Gytis Dudas, Shirlee Wohl, Augustine Goba, Shannon L . M . Whitmer,
Kristian G . Andersen, Rachel S. Sealfon, et al. 2015. "Ebola Virus Epidemiology,
Transmission, and Evolution during Seven Months in Sierra Leone." Cell 161 (7): 1516-
26.
Pyke, Alyssa T , Michelle T. Daly, Jane N . Cameron, Peter R . Moore, Carmel T. Taylor, Glen
R . Hewitson, Jan L . Humphreys, and Richard Gair. 2014. "Imported Zika Virus Infection
from the Cook Islands into Australia, 2014." PLoS Currents 6 (June)
doi: 10. 1371/currents.outbreaks.4635a54dbffba2156fb2fd76dc49f65e.
Rambaut, Andrew. 2014. "FigTree. Version 1.4.2." Edinburgh, UK: Inst. Evol. Biol., Univ.
Edinburgh http://tree.bio.ed.ac.uk/software/figtree/.
Rambaut, Andrew, Tommy T. Lam, Luiz Max Carvalho, and Oliver G . Pybus. 2016.
"Exploring the Temporal Structure of Heterochronous Sequences Using TempEst
(formerly Path-O-Gen)." Virus Evolution 2 (1): vew007.
R Core Team. 2016. "R: A Language and Environment for Statistical Computing." R
Foundation for Statistical Computing. https://www.R-project.org/.
Shapiro, Beth, Andrew Rambaut, and Alexei J . Drummond. 2006. "Choosing Appropriate
Substitution Models for the Phylogenetic Analysis of Protein-Coding Sequences."
Molecular Biology and Evolution 23 (1): 7-9.
Tomkins-Tinch, Chris, Simon Ye, Hayden Metsky, Irwin Jungreis, Rachel Sealfon, Xiao Yang,
Kristian Andersen, Mike Lin, and Daniel Park. 2016. Broadinstitute/Viral-Ngs: VI. 13. 3 .
Zenodo. doi:10.5281/zenodo.200428.
Wood, Derrick E., and Steven L . Salzberg. 2014. "Kraken: Ultrafast Metagenomic Sequence
Classification Using Exact Alignments." Genome Biology 15 (3): R46.
Yarza, Pablo, Michael Richter, Jorg Peplies, Jean Euzeby, Rudolf Amann, Karl-Heinz
Schleifer, Wolfgang Ludwig, Frank Oliver Glockner, and Ramon Rossello-Mora. 2008.

"The All-Species Living Tree Project: A 16S rRNA-Based Phylogenetic Tree of All
Sequenced Type Strains." Systematic andApplied Microbiology 3 1 (4): 241-50.

WE CLAIM:
1. A method for developing probes and primers to pathogens, comprising:
providing a set of input genomic sequences to one or more target pathogens;
generating a set of target sequences from the set of input genomic sequences;
applying a set cover solving process to the set of target sequences to identify one or
more target amplification sequences, wherein the one or more target amplification sequences
are highly conserved target sequences shared between the set of input genomic sequences of
the target pathogen; and
generating one or more primers, one or more probes, or a primer pair and probe
combination based on the one or more target amplification sequences
2 . The method of claim 1, wherein the set of input genomic sequences represent
genomic sequences from two or more variants of the one or more target pathogens.
3 . The method of claim 1, wherein the set of input genomic sequences are
obtained from a metagenomic sample.
4 . The method of claim 3, wherein the metagenomic sample is obtained from one
or more vector species of the one or more target pathogens.
5 . The method of claim 4, wherein the one or more vector species are one or more
species of mosquito.
6 . The method of any of the preceding claims, wherein the one or more target
pathogens is one or more viral pathogens.
7 . The method of claim 6, wherein the viral pathogen is Zika, Chikungunya, or
Dengue.
8 . The method of claim 7, wherein the one or more viral pathogens is Zika,
Chikungunya.

9 . The method of any one of claims 1 to 5, wherein the one or more target
pathogens is a parasitic pathogen.
10. The method of any of the preceding claims, wherein the target sequences are
fragmented to a size that is approximately equal to a size of an amplicon for detection using a
nucleic acid amplification assay.
11. The method of claim 10, wherein the size of the target sequence is 100 to 500
base pairs.
12. The method of any of the preceding claims, wherein each nucleotide of the set
of input genomic sequences is considered an element of universe of the set cover solving
process and wherein each element is considered covered if the target sequence aligns to some
portion of a genomic reference sequence.
13. A method for detecting one or more pathogens comprising:
contacting a sample with one or more primers and/or probes generated using any one
of the methods of claims 1 to 12;
detecting amplification of one or more pathogen target sequences using a nucleic acid
amplification method and the one or more primers and/or probes, wherein detection of the
target sequence indicates a presence of the one or more pathogens in the sample.
14. The method of claim 13, wherein the nucleic acid amplification method is
quantitative PCR and the one or more primers and/or probes comprise a forward and reverse
primers and a probe modified with a detectable label.
15. The method of claim 14, wherein the forward primer comprises one of SEQ ID
NOs: 1, 5, 9, 13, 17, 2 1, 25, 29, 33, 37, or 4 1, the reverse primer comprises one of SEQ ID
NOs: 2, 6, 10, 14, 18 22, 26, 30, 34, 38, or 42, and the probe comprises one of SEQ ID NOs:
3, 7, 11, 15, 19, 23, 27, 31, 35, 39, or 45.

16. The method of claim 13, wherein the one or more primers and/or probes are
configured to detect one or more non-synonymous single nucleotide polymorphisms (SNPs)
listed in Tables 3 or 7 .
17. A method for detecting Zika and/or Chikungunya in samples, comprising
contacting a sample with a forward and reverse primer and a probe with a detectable
label, wherein the forward primer comprises one or more of SEQ ID NOs: 1, 5, 9, 13, 17, 2 1,
25, 29, 33, 37, or 41, the reverse primer comprises one of more of SEQ ID NOs: 2, 6, 10, 14,
18 22, 26, 30, 34, 38, or 42, and the probe comprises one or more of 3, 7, 11, 15, 19, 23, 27,
31, 35, 39, or 45. ;
detecting amplification of one or more target sequences through a quantitative PCR
assay using the forward and reverse primers and the probe, wherein detection of the one or
more target sequences indicates the presence of Zika, Chikungunya, or both.
18 . A kit comprising the primers and/or probes of any one of claims 1 to 14.


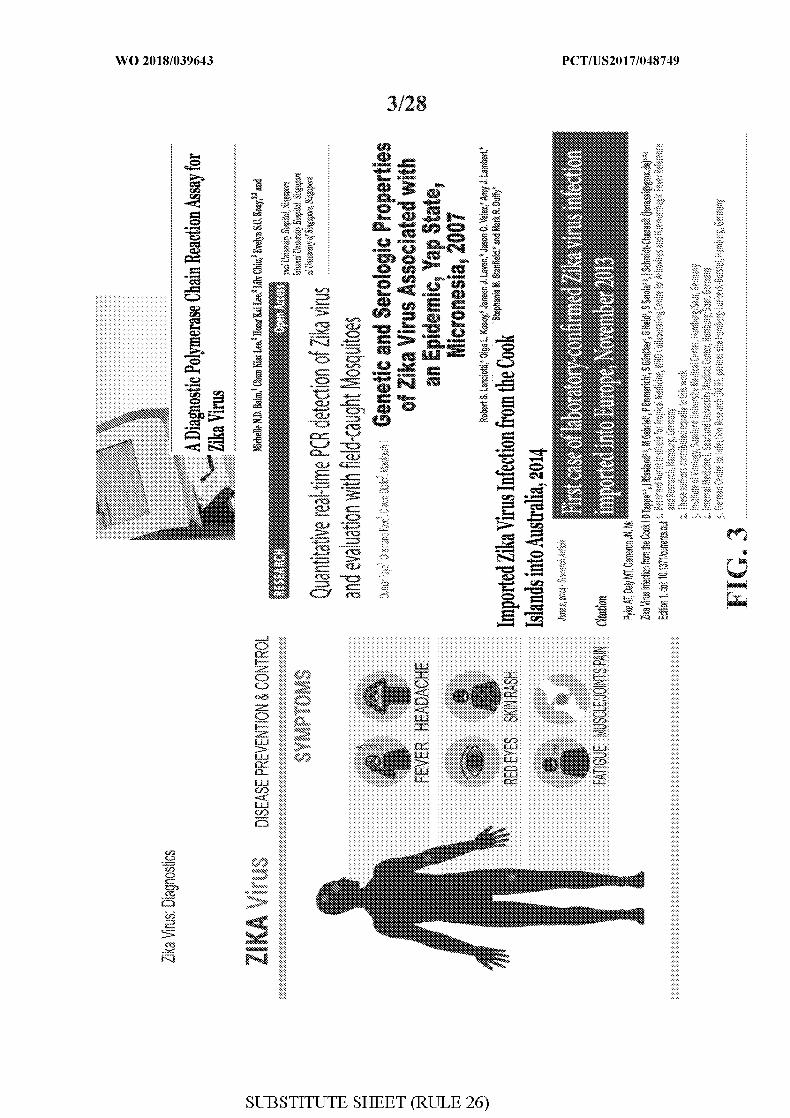


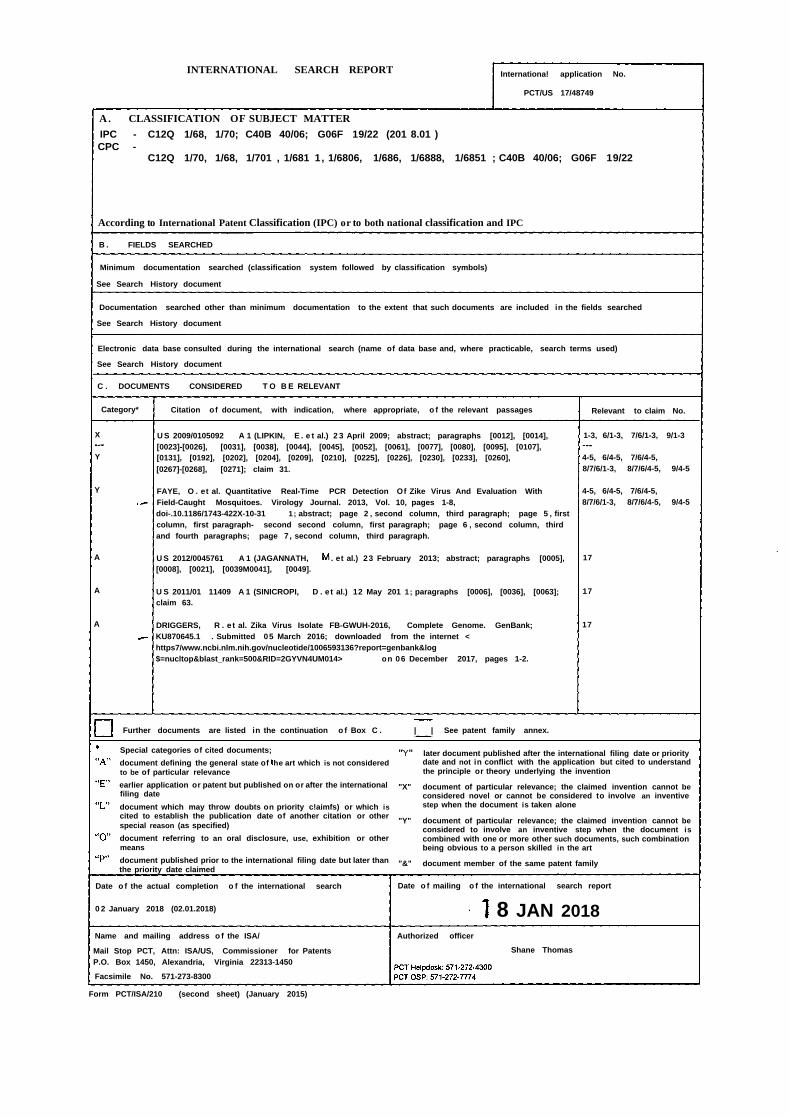
INTERNATIONAL SEARCH REPORT Internationa! application No.
PCT/US 17/48749
A. CLASSIFICATION OF SUBJECT MATTER
IPC - C12Q 1/68, 1/70; C40B 40/06; G06F 19/22 (201 8.01 )CPC -
C12Q 1/70, 1/68, 1/701 , 1/681 1, 1/6806, 1/686, 1/6888, 1/6851 ; C40B 40/06; G06F 19/22
According to International Patent Classification (IPC) or to both national classification and IPC
B . FIELDS SEARCHED
Minimum documentation searched (classification system followed by classification symbols)
See Search History document
Documentation searched other than minimum documentation to the extent that such documents are included in the fields searched
See Search History document
Electronic data base consulted during the international search (name of data base and, where practicable, search terms used)
See Search History document
C . DOCUMENTS CONSIDERED T O B E RELEVANT
Category* Citation of document, with indication, where appropriate, o f the relevant passages Relevant to claim No.
X U S 2009/0105092 A 1 (LIPKIN, E . e t al.) 2 3 April 2009; abstract; paragraphs [0012], [0014], 1-3, 6/1-3, 7/6/1-3, 9/1-3[0023]-[0026], [0031], [0038], [0044], [0045], [0052], [0061], [0077], [0080], [0095], [0107],
Y [0131], [0192], [0202], [0204], [0209], [0210], [0225], [0226], [0230], [0233], [0260], 4-5, 6/4-5, 7/6/4-5,
[0267]-[0268], [0271]; claim 31. 8/7/6/1-3, 8/7/6/4-5, 9/4-5
Y FAYE, O . et al. Quantitative Real-Time PCR Detection Of Zike Virus And Evaluation With 4-5, 6/4-5, 7/6/4-5,Field-Caught Mosquitoes. Virology Journal. 2013, Vol. 10, pages 1-8, 8/7/6/1-3, 8/7/6/4-5, 9/4-5doi-.10.1186/1743-422X-10-31 1; abstract; page 2 , second column, third paragraph; page 5 , firstcolumn, first paragraph- second second column, first paragraph; page 6 , second column, thirdand fourth paragraphs; page 7 , second column, third paragraph.
A U S 2012/0045761 A 1 (JAGANNATH, . et al.) 23 February 2013; abstract; paragraphs [0005], 17[0008], [0021], [0039M0041], [0049].
A U S 2011/01 11409 A 1 (SINICROPI, D . e t al.) 12 May 201 1; paragraphs [0006], [0036], [0063]; 17claim 63.
A DRIGGERS, R . e t al. Zika Virus Isolate FB-GWUH-2016, Complete Genome. GenBank; 17
KU870645.1 . Submitted 05 March 2016; downloaded from the internet <https7/www.ncbi.nlm.nih.gov/nucleotide/1006593136?report=genbank&log$=nucltop&blast_rank=500&RID=2GYVN4UM014> on 06 December 2017, pages 1-2.
Further documents are listed in the continuation o f Box C . | | See patent family annex.
Special categories of cited documents; "Ύ" later document published after the international filing date or prioritydocument defining the general state of he art which is not considered date and not in conflict with the application but cited to understandto be of particular relevance the principle or theory underlying the invention
earlier application or patent but published on or after the international "X" document of particular relevance; the claimed invention cannot befiling date considered novel or cannot be considered to involve an inventivedocument which may throw doubts on priority c!aimfs) or which is step when the document is taken alonecited to establish the publication date of another citation or otherspecial reason (as specified)
"Y" document of particular relevance; the claimed invention cannot beconsidered to involve an inventive step when the document is
document referring to an oral disclosure, use, exhibition or other combined with one or more other such documents, such combinationmeans being obvious to a person skilled in the art
document published prior to the international filing date but later than "&" document member of the same patent familythe priority date claimed
Date o f the actual completion o f the international search Date o f mailing o f the international search report
0 2 January 2018 (02.01.2018) 8 JAN 2018Name and mailing address o f the ISA/ Authorized officer
Mail Stop PCT, Attn: ISA/US, Commissioner for Patents Shane Thomas
P.O. Box 1450, Alexandria, Virginia 22313-1450
Facsimile No. 571-273-8300
Form PCT/ISA/210 (second sheet) (January 2015)

INTERNATIONAL SEARCH REPORT International application No.
PCT/US17/48749
Box No. II Observations where certain claims were found unsearchable (Continuation of item 2 of first sheet)
This international search report has not been established in respect of certain claims under Article 7(2)(a) for the following reasons:
1. Claims Nos.:because they relate to subject matter not required to be searched by this Authority, namely:
□ Claims Nos.because they relate to parts of the international application that do not comply with the prescribed requirements to such anextent that no meaningful international search can be carried out, specifically:
Claims Nos.: 10-16, 8because they are dependent claims and are not drafted in accordance with the second and third sentences of Rule 6.4(a).
Box No. I Observations where unity of invention is lacking (Continuation of item 3 of first sheet)
This International Searching Authority found multiple inventions in this international application, as follows:
-""-Please See Supplemental Page- *" -
As all required additional search fees were timely paid by the applicant, this international search report covers all searchableclaims.
As all searchable claims could be searched without effort justifying additional fees, this Authority did not invite payment ofadditional fees.
□ As only some of the required additional search fees were timely paid by the applicant, this international search report coversonly those claims for which fees were paid, specifically claims Nos.:
No required additional search fees were timely paid by the applicant. Consequently, this international search report isrestricted to the invention first mentioned in the claims; it is covered by claims Nos.:
-""-Please See Supplemental Page-" *-
The additional search fees were accompanied by the applicant's protest and, where applicable, thepayment of a protest fee.
The additional search fees were accompanied by the applicant's protest but the applicable protestfee was not paid within the time limit specified in the invitation.
No protest accompanied the payment of additional search fees.
Form PCT/ISA/210 (continuation of first sheet (2)) (January 201 5)

INTERNATIONAL SEARCH REPORTInternational application No.
Information on patent family membersPCT/US 17/48749
-'"-Continued from Box No. Ill: Observations Where Unity of Invention is Lacking:
This application contains the following inventions or groups of inventions which are not so linked as to form a single general inventiveconcept under PCT Rule 13.1. In order for all inventions to be examined, the appropriate additional examination fees must be paid.
Groups l+, Claims 1-9, 17 and SEQ ID NOs: 1-3 are directed toward methods for deveoping primers and probes to pathogens and theuse of said primers and probes for detecting the presence of target sequences of Zika or Chikungunya virus in a sample.
The methods, primers and probes will be searched to the extent they encompass a forward primer encompassing SEQ ID NO: 1(forward primer), a reverse primer encompassign SEQ ID NO: 2 (reverse primer) and a probe encompassing SEQ ID NO: 3 (probe).Applicant is invited to elect additional set(s) of primers, with corresponding probe(s), with specified SEQ D NO: for each, to be searched.Additional set(s) of primers and probe(s) will be searched upon the payment of additional fees. It is believed that claims 1-9 and 7(in-part) encompass this first named invention and thus these claims will be searched without fee to the extent that they encompass SEQD NO: 1 (forward primer); SEQ D NO: 2 (reverse primer); and SEQ ID NO: 3 (probe). Failure to clearly identify how any paid additional
invention fees are to be applied to the "+" group(s) will result in only the first claimed invention to be searched/examined. An exemplaryelection would be a set of primers and a corresponding probe encompassing SEQ ID NO: 5 (forward primer); SEQ ID NO: 6 (reverseprimer); and SEQ ID NO: 7 (probe).
No technical features are shared between the polypeptide sequences of Groups l+ and, accordingly, these groups lack unity a priori.
Additionally, even if Groups l+ were considered to share the technical features of: a method for developing probes and primers topathogens, comprising: providing a set of input genomic sequences to one or more target pathogens; generating a set of targetsequences from the set of input genomic sequences; applying a set cover solving process to the set of target sequences to identify oneor more target amplification sequences, wherein the one or more target amplification sequences are highly conserved target sequencesshared between the set of input genomic sequences of the target pathogen; and generating one or more pnmers, one or more probes, ora primer pair and probe combination based on the one or more target amplification sequences; and a method for detecting Zika and/orChikungunya in samples, comprising contacting a sample with a forward and reverse primer and a probe with a detectable label, anddetecting amplification of one or more target sequences through a quantitative PCR assay using the forward and reverse primers andthe probe, wherein detection of the one or more target sequences indicates the presence of Zika, Chikungunya, or both; these sharedtechnical features are previously disclosed by US 2009/0105092 A 1 to Lipkin et al. (hereianfter 'Lipkin') in view of US 2012/0045761 A 1to Jagannath et al. (hereinafter 'Jagannath').
Lipkin discloses a method for developing probes (generating probes to detect viral target seqeunces; paragraphs [0012], [0038]; claim31) and primers to pathogens (paragraphs [0012], [0038]; claim 31), comprising: providing a set of input genomic sequences (sets ofgenomic sequences from a database such as partial genomes of viral species; paragraphs [0025], [0202]) to one or more targetpathogens (analyzing pathogens; paragraph [0061]); generating a set of target sequences from the set of input genomic sequences(paragraphs [0267], [0268]); applying a set cover solving process to the set of target sequences (selecting sequences with set coveralgorithms; paragraphs [0024], [0095]; claim 31) to identify one or more target amplification sequences (paragraph [0225]; claim 36),wherein the one or more target amplification sequences are highly conserved target sequences shared between the set of input genomicsequences of the target pathogen (paragraph [0007]; claim 1); and generating one or more primers, one or more probes, or a primer pair(paragraph [0209]; claim 3 1) and probe combination(paragraph [0061]) based on the one or more target amplification sequences(paragraphs [0212], [0232]). Lipkin does not disclose a method for detecting Zika and/or Chikungunya in samples, comprisingcontacting a sample with a forward and reverse primer and a probe with a detectable label; and detecting amplification of one or moretarget sequences through a quantitative PCR assay using the forward and reverse primers and the probe, wherein detection of the oneor more target sequences indicates the presence of Zika, Chikungunya, or both.
Jagannath discloses a method for detecting Chikungunya in samples (abstract; paragraph [0001]), comprising contacting a sample(subjecting a sample to primers and probes; paragraph [0005]) with a forward and reverse primer (paragraph [0049]) and a probe with adetectable label (paragraph [0005]); and detecting amplification of one or more target sequences ((through a quantitative (paragraph[0039]) PCR assay (obtaining amplified target sequence using PCR; paragraph [0005]) using the forward and reverse primers and theprobe (paragraph [0049]), wherein detection of the one or more target sequences indicates the presence of Chikungunya (abstract). Itwould have been obvious to one of ordinary skill in the art at the time of the invention to have modified the disclosure of Lipkin to providea method for detecting Zika and/or Chikungunya in samples, comprising contacting a sample with a forward and reverse primer and aprobe with a detectable label; and detecting amplification of one or more target sequences through a quantitative PCR assay using theforward and reverse primers and the probe, wherein detection of the one or more target sequences indicates the presence of Zika,Chikungunya, or both, because applying forward and reverse primers and detectably-labeled probes to the analysis of samples for theidentification of a viral pathogen such as Chikungunya through detection of amplified target sequences as disclosed by Jagannath wouldhave allowed the primers and probes generated through applying a set cover solving process to a set of target sequences frompathogens as previously disclosed by Lipkin to be utilized to identify and diagnose the causation of infection in a clinical setting.
Since none of the special technical features of the Groups l+ inventions is found in more than one of the inventions, and since all of theshared technical features are previously disclosed by the combination of the Lipkin and Jagannath references, unity of invention islacking.
Form PCT/ISA/2 0 (patent family annex) (January 201 5)