4.6 GEOLOGY, SOILS, MINERAL RESOURCES, AND PALEONTOLOGICAL ...
Upload
hoangkhuongCategory
view
216download
2
Bureau of Mineral Resources, Geology & Geophysi~s __
\~'C.RAL~ ~ ~J' .
6 \.\COttp...R'{ 0c,
=> (\'\r'{ ,'jj)9~ ~ ~ ~, ~
,j.. ,,' Bl\1R PIT" ~~ -r ". ') CG"',1PACTUS -? u 0> ~.
c-'\NSER\1."'· . --=
BMR RECORD 1992/18
MUNDARING GEOPHYSICAL OBSERVATORY
ANNUAL REPORT
1990
by
P.J. GREGSON
BMR Record No. 1992/18
MUNDARING GEOPHYSICAL OBSERVATORY
ANNUAL REPORT
1990
by
P.J. Gregson
1^11 1111^1111*R 9 2 0 1 8 0 1 *

© Commonwealth of Australia, 1992.
This work is copyright. Apart from any fair dealing for the purposes of study, research, criticism or review, as permitted under the Copyright Act, no part may be reproduced by any process without written permission. Inquiries should be directed to the Principal Information Officer, Bureau of Mineral Resources, Geology and Geophysics, GPO Box 378, Canberra, ACT, 2601.
ISSN 0811-062 X ISBN 0 642 17591 8

SUMMARY
Annual reports detailing observatory activities have been prepared up till 1989. This report covers activity for the year 1990.
Basic program in geomagnetism, ionospherics and seismology continued at the Mundaring Geophysical Observatory during the period. The main instrument were an Eschenhagen normal-run magnetograph, an IPS type 4B ionosonde, a Worldwide Standard Seismograph, and a Seismic Research Observatory.
Digital magnetic recording commenced full time from 3 July after a period of testing and calibration of an Elsec based Automatic Magnetic Observatory.
Seismographs were operated at Ballidu, Coolgardie, Forrest, Kellerberrin, Kununurra, Marble Bar, Meekatharra, Morawa, Mundaring, Rocky Gully, Narrogin and Warburton. The operation of Manton Dam (NT) was taken over from the Headquarters Group on 1 August.
The observatory now operates nine accelerographs and maintains a further 13 for the Water Authority and Telecom.
The earthquake list (Ml>2) shows details of 138 Western Australian earthquakes during the year.
An isoseismal map was prepared for an earthquake that occurred near Meckering on 17 January 1990.
A major project to determine varying responses of different sub-soil conditions to earthquake vibrations was undertaken during the year.

CONTENTS
~
SUMMARY 1. INTRODUCTION 1 2. STAFF AND VISITORS 1 3. SEISMOLOGY 1
Seismograph stations 1 Temporary stations 3 Accelerographs 3 Seismicity 3 Earthquake intensities and isoseismal maps 4 Earthquake magnitude 4 Earthquake locations 4 Water level monitoring 5 Microzonation 5 Data distribution and publication 6 Earthquake Symposium 6
4. GEOMAGNETISM 7 GNANGARA: 8 Eschenhagen magnetograph 8 Eschenhagen magnetograph tests 8 Magnetometers 8 Comparisons 8 Reference marks 9 Automatic magnetic observatory 9 Accessory equipment 9 LEARMONTH: EDA fluxgate magnetograph 9 Magnetometers 10 Comparisons 10 Reference marks 10 Data reduction and publication 10 Magnetic surveys 11
5. IONOSPHERICS 11 Data distribution and publication 11
6. GENERAL OPERATIONS 11 7. ACKNOWLEDGEMENTS 12 8. REFERENCES 13
APPENDIX 1 : Principal events 1957-1990 14

1. 2. 3. 4. 5. 6. 7. 8. 9.
10. 11. 12. 13. 14. 15. 16. 17. 18. 19. 20. 21. 22.
23. 24. 25. 26. 27. 28. 29. 30.
Observatory staff Observatory staff absences Work experience students Associated personnel
TABLES
Conferences, training and committees Addresses Visitors Western Australian seismograph stations Seismograph calibration data Western Australian earthquakes Western Australian accelerograph locations Accelerograph calibration data Accelerogram data Gnangara - absolute instruments Gnangara - instrument comparisons Gnangara - azimuths of reference marks Gnangara - variometer temperature coefficients Gnangara - orientation tests Gnangara - standard deviation of observations Gnangara - Eschenhagen adopted control values Gnangara - AMO adopted control values Gnangara - preliminary monthly mean geomagnetic values and k-indices Gnangara - geomagnetic annual mean values, 1980 - 1990 Learmonth - absolute instruments Learmonth - temperature coefficients Learmonth - adopted control values Learmonth - standard deviation of observations Learmonth - preliminary monthly mean geomagnetic values Learmonth - geomagnetic annual mean values, 1987-1990 Distribution of magnetic data
FIGURES
16 16 16 17 17 18 19 20 21 22 25 26 28 31 31 31 32 32 32 33 36 37
37 38 38 39 42 42 42 43
1. Earthquakes in the region of Western Australia ML>2.4, 1990 2. Earthquakes in the region 30.0° - 35.0° Sand 114.5° - 118.5° E, 1990 3. Isoseismal map of the Meckering WA earthquake, 17 January 1990 4. Gnangara magnetic observatory - AMO equipment 5. Learmonth magnetic observatory - equipment and data recording 6. Secular variation Gnangara 1919-1990 7. Mundaring computing system
1. INTRODUCTION
The Mundaring Geophysical Observatory opened on 18 March 1959. Descriptions of the observatory and an outline of activity there to the end of 1989 have been given in previous records (e.g. Gregson 1991). This report outlines the activity during the year. Principal events in the observatory's history are given in Appendix 1.
The observatory controls seismic recording at Ballidu, Coolgardie, Forrest, Kellerberrin, Kununurra, Marble Bar, Meekatharra, Morawa, Mundaring, Nanutarra, Narrogin, Rocky Gully and Warburton. Operational control of the seismograph at Manton Dam (NT) was transferred from head office to the observatory on 1 August. The seismograph at Narrogin is a Seismic Research Observatory (SRO) and is operated in co-operation with the United States Geological Survey. Nine accelerographs are now operating in the Southwest Seismic Zone with a further 13 being operated in co-operation with the Water Authority of Western Australia and Telecom. Magnetic recording is carried out at Gnangara and Learmonth, and ionospheric recording at Mundaring.
The observatory hosted a three day Earthquake Symposium on Recent Intraplate Seismological Studies which was attended by forty seismologists from Australia, Japan and the United States.
A joint project between the BMR, the Academy of Science and the Promotion of Science in Japan was continued to determine the likely response of sediments near Perth to earthquake vibrations. Following a visit by B.A. Gaull to Japan in August 1989, systematic occupation of more than 50 sites have been made using Kelunji seismographs.
All observatory staff listed in Table 1 contributed to this report.
2. STAFF AND VISITORS
Observatory staff are listed in Table 1 and staff absences other than recreation leave are listed in Table 2. Students who attended the observatory for work experience and other personnel associated with the observatory's operations are shown in Tables 3 and 4 respectively. Table 5 lists the conferences and training courses attended and Table 6 the addresses given by staff. P.J. Gregson was a member of the Geophysics AdviSOry Committee, Curtin University of Technology. P.J. Gregson, E.P. Paull and B.J. Page reoccupied the Australia Wide Array of Geomagnetic Stations (AWAGS) in the southwest of Western Australia.
Visitors to the observatory are listed in Table 7.
3. SEISMOLOGY
Seismograph Stations
Permanent seismograph stations were operated throughout the four years at Ballidu (BAL), Cooigardie (COOL), Forrest (FORR), Kellerberrin (KLB), Kununurra (KNA), Manton Dam (MTN) from 1 August, Marble Bar (MBl), Meekatharra (MEKA), Morawa (MRWA), Mundaring (MUN), Nanutarra (NANU), Narrogin (NWAO), Rocky Gully (RKG) and Warburton (WARB). An insensitive seismograph was operated in the Mundaring office. Preparations were made for the installation of a three component broad-band, borehole seismometer to be installed at Yerdanie Rock to replace the Cooigardie station.
A temporary MEQ 800 seismograph was operated at Pingrup until 27 May. Kelunji seismographs were operated for short periods at various locations (see below).
Details of station locations are given in Table 8 and seismograph calibration data is shown in Table 9. Brief descriptions of individual station operations are given below.
The most significant problem in operating the seismograph stations was the spasmodic jumping of the Omega clock displays which provided time control to the seismograms. In most cases where there were numerous jumps time control was maintained by collating clock time-marks with automatic calibration pulses.However the need to do this was time consuming. This problem affected recordings at FORR, MBL, MEKA, MRWA, NANU, RKG and WARB. Two of the Omega systems were returned to Precital in Switzerland in December to fit modified antennas to the radio receivers. It is hoped that this will solve the problems.
Ballidu (BALl. This station continued to operate exceptionally well with only 0.4% record loss. There was some cross interference on the Telecom line with Kellerberrin which was eliminated by Telecom changing circuits.
Cooigardie (COOLl. The major cause of record loss (2.8%) resulted from the ELCB at the remote site dropping out. In turn this resulted in the battery slowly discharging and a loss of signal. Telecom installed a surge protector which should reduce the possibility of this happening in the future. Other record losses totalled 0.2%.
Forrest (FORRl. Total record loss for the year was 3.8%. The majority of this was caused through operator error, i.e. incorrect setting of the recording pen (2.0%) and late changes (0.7%). On site training during the year should reduce these problems in the future.
Although the seismometer is 5 km from the east-west standard gauge railway line an average of about 12 trains a day caused disturbance over several minutes each. It is proposed to relocate the seismometer further from the line in 1991.
Kellerberrin (KLB1. Cross interference with Ballidu was eliminated by Telecom changing circuits. Line outage (0.7%) was the reason for the majority of record loss.
Kununurra (KNA1. Operational problems were similar to previous years, i.e. pen pressure (1.2%) and power failures (0.7%). Late changes and recording paper being reversed contributed a further 0.7% of record loss.
Manton Dam (MTNl. Operating control of this station located 70 km south of Darwin (NT) was transferred from headquarters to the observatory on 1 August 1991. The recording pen broke on several occasions resulting in 1.9% record loss over the remainder of the year. Other losses amounted to 0.3%. Re-alignment of the Stuart Highway since installation has increased the background noise considerably. Trucks crossing a nearby bridge often obliterate the record. The seismograph gain was decreased by 6db on 13 November. The labtronics radio was damaged by lightning and replaced in November.
Marble Bar (MBLl. Total record losses were 10.2%. Late changes accounted for 3.0%, recorder failure 2.7% and broken pens 1.3%. Telecom line outage following an electrical storm was responsible for 2.8%.
Meekatharra (MEKAl. The seismograph operated well throughout the year with 0.4% record loss. Industrial noise continued to be a problem and plans are being made to relocate the seismometer during 1991.
2
Morawa(MRWAl. Power failure and broken pens were the main causes of the 2.2% record loss. It is proposed to telemeter data back to the Mundaring office during 1991.
Mundaring (MUNl. Both the World standard and high gain systems operated well during the year with little record loss. The main problem was paper falling off the recorder drums. The Wood Anderson seismometers sent to the Engineering Services Unit (Canberra) in March 1987 to fit photoelectric cells to convert to either digital or visual recording, had not been returned by the end of 1990.
Nanutarra (NANU1. The recording pen broke several times resulting in 1.9% record loss out of a total of 2.2%. late record changes was the reason for most of the remainder of record loss.
Narrogin (NWAO). Major failure of the A to D resulted in a down time of 23.7% from 15 May to 02 August. Several replacement units were sent from Albuquerque Seismological laboratory. This helped contribute to the lengthy down time. Other record losses totalled 0.6%.
Rocky Gully (RKGl. Total record loss was 2.3% with late changes resulting in 1.2%.
Warburton (WBN). The reliability of the operator deteriorated during the year with 6.0% of record being lost due to late changes and paper reversed on the recording drum. A further 1.0% was lost as a result of power and other minor problems. The recorder was relocated in August to the administration office which is air conditioned and service improved considerably.
Temporary stations
Plngrup (PINl. A Sprengnether MEQ800 was operated at Pingrup until 27 May.
Others. Kelunji seismographs were operated near Ballidu {AZA and TOU} from 22 June to 14 August and at Northam (NOR), Clackline (ClK) and Wooroloo (WOO) from 13 November.
Accelerographs
Twenty-two accelerographs were in operation in Western Australia in 1990. Nine were owned by the Bureau of Mineral Resources; ten by the Water Authority of Western Australia and three by Telecom. All instruments were maintained by observatory staff. All the BMR accelerographs were located in the south-west seismic zone.
The Water Authority A700 accelerographs were located on the following dams:- Canning (2), Serpentine (2),lake Argyle (2), North Dandalup (1) and Victoria (1). SMA1 and M02 accelerographs were operated at Mundaring Weir.
The three Telecom accelerographs were SMA 1 instruments and were operated for the four years in the main telephone exchange building in Perth. There were no triggerings during the period.
Details of instrumentation type, calibration data, location and dates of operation are given in Tables 11 and 12.
Strong motion data recorded during the year is listed in Table 13.
Seismicity
Table 10 lists earthquakes of magnitude ML 2.0 or greater which occurred in Western Australia in 1990. Epicentres of those with magnitude Ml 2.5 or greater are shown in Figure 1. Individual areas are discussed below. Where zone numbers are used they refer to zones defined by Gaull & others (1990).
3
Only five earthquakes of magnitude ML 4 or greater occurred in the Western Australian region in 1990, about the same level as the previous year.
The largest occurred on 17 January, 10 km South of Meckering (ML 5.5). Of the 138 earthquakes listed, the majority of activity occurred within, or close to the defined zones. The notable exception was a magnitude 2.9 earthquake just offshore about 150 km north of Geraldton on 28 May. This is in the same area as a group of offshore earthquakes between Geraldton and Shark Bay between 1987 and 1989.
Magnitude 4 or greater earthquakes outside the southwest seismic zone occurred 230 km N of Port Hedland (ML 4.5) on 18 February; 45 km NE Broome (ML 4.2) on 17 August and 900 km W of Dongara (ML 4.1) on 9 May.
Southwest Seismic Zone (Zones 1 and 2). Seventy-eight earthquakes were located in this zone, compared with 62 in 1989. The most significant activity occurred near Meckering (14 events) where the largest earthquake was recorded (see above). Other areas of activity were Cadoux (10); Ballidu (23); Wyalkatchem (6) and Dumbleyung (6). Minor activity occurred near Bencubbin (3); Calingiri (2); Gnowangerup (10); Brookton (7); Corrigin (8); Nyabing (9); Quairading (5); Bolgart (1); Beverley (6); Kellerberrin (4) and Newdegate (11).
Earthquake Intensities and Isoselsmal maps
An isoseismal map was prepared for only one earthquake in 1990 from information received from the distribution of questionnaires and newspaper reports.
Maximum intensities for other felt earthquakes are shown in Table 10.
Meckerlng 17 January (Figure 3). An earthquake occurred 10 km S of Meckering (100 km east of Perth) at 2.38 p.m. (WST). This was the largest earthquake in the Meckering area since 14 October 1968 when a magnitude 6.9 earthquake destroyed the townsite. An aftershock of magnitude 5.7 occurred several hours after the main shock (Everingham & Others, 1982).
Isolated reports of MM VI were received from near the epicentre. The earthquake was felt strongly at Meckering (MM V) with reports of items of crockery etc. being shown from shelves. There were no reports of major damage and no injuries. The effects of the earthquake were felt throughout the Perth Metropolitan area and over an area of 200,000 km
2 at distances of 280 km from the epicentre. The
mean radius of the IV and III isoseismals were 180 and 270 km respectively.
M(I) calculated using the relationship M(I) = 1.01 In (Rp) + 0.13 (McCue, 1980) of 5.6 which is consistent with the Richter magnitude of ML 5.5. Most of the intensities reported from Perth were MM IV which is the same as the Yilgarn block at that distance.
Only four aftershocks ranging from ML 2 to 2.3 were recorded, all within 2 days of the main event.
Earthquake magnitude
Some further work was done by E. Paull and B. Gaul! on determining earthquake magnitude using durations of codas recorded on Western Australian seismographs. Their results were presented at the Earthquake Symposium in Perth (1990).
Earthquake locations
V. Dent did some work on a new crustal model for south-east Western Australia using the Phillip Institute of Technology (PIT) computer program "MODEL". He also determined deviations from
4

Jeffreys - better travel times for Australian earthquakes. Results were presented at the Earthquake symposium in Perth (1990).
Water level monitoring
Three ground water instruments measuring water level changes were operated throughout the year. There were no significant recordings. Monitoring of P-values continued spasmodically.
Mlcrozonatlon
The bilateral project between the BMR (Australia) and various institutions in Japan to determine the likely response of the sediments near Perth to earthquake vibrations continued. This program was carried out by Brian Gaull. A systematic occupation of 50 more sites using 6 Kelunji seismographs, was carried out by staff at the observatory. Before deployment each seismometer was fitted with seismograph damping resistors and anti-aliasing filters. The 1-second, 3- component seismometers were sampled at 32 sps. Operational advantages introduced at this stage over the earlier sets of observations were:
- The recordings were times to trigger simultaneously and late at night when traffic induced vibrations were minimal. This means that (at least at the long period end of the spectrum [> 1 s]) effects from temporal changes in source, were also minimised.
- Direct comparison between one traverse and another was made possible by having the same reference point at MGO throughout the observations.
- A north-south orientation for each of the 10 traverses occupied, was chosen so as to eliminate attenuation effects from anyone traverse. The assumption here is that the source of the longerperiod microtremors was the Indian Ocean.
- Seismometers were buried to reduce wind effects.
- Repeat observations were made at each site over 2 nights to check for consistency of spectra and also to allow averaging of them.
In this manner, 100 seconds of microtremor recordings were obtained simultaneously at 4.00 a.m. L.T. at 5 sites. Located along each of the traverses shown in Figure 1 as well as at the reference site. Site selection was based on a grid spacing of about 3 km and also on as diverse site geology as possible.
The spectra at each site were then compared using the following procedure:
- Each file was transferred into the Webster (Spectrum computer) at MGO and the data plotted using the PIT software REPLAY.
- The "quietest" 30s of each component of each record was selected and spectral analyses carried out using the Fourier transform and smoothing function in REPLAY. A file for each spectra was saved.
- Spectral ratios were then computed and plotted for each component of each recording at each site using the corresponding reference site spectra for each ratio calculation.
It was fortuitous that on 8 May 1989 a ML 4.5 earthquake centred near Cadoux triggered seismographs located at Mundaring (MUN) and at Kewdale (KEW). These earthquake seismograms are compared in Figure 2. The spectral ratios from this event were then used to "calibrate" the spectral ratios obtained from the micro-tremor recordings from the same pair of sites and a procedure for interpretation of the spectral ratios was developed as follows:
5

- Determine the mean spectral ratios for both records for each component at each site.
- Determine the mean curve of both horizontal components of the mean curves derived in (1).
- Apply an attenuation factor of x 2 to ground periods less than 2 s.
- Apply an additional attenuation factor of x 2 whenever "local" sources were observed, providing the frequency of this temporal source was still apparent through the rest of the recording. Otherwise any spike in the ratio plot owing to such a source was completely ignored.
It was found that when this procedure was applied the spectral ratios determined by microtremor recordings as described above compared reasonably well with those obtained from the earthquake recordings.
Spectral ratios at periods of 5, 2, 1, 0.5, 0.33 and 0.2 seconds were inter-polated from the spectral ratio plots, derived as above, for each of the above 50 sites. These results were then contoured and the following conclusions were drawn:
- Estimates of amplification of ground motion in the sediments in the Perth Basin varied between 2-10 times that observed on the hard rocks of Mundaring over all the periods of interest. It should be determined how this effect should be incorporated into earthquake risk estimates.
- Contours at 5 seconds correlate reasonably well with gravity contours.
- Other possible microtremor-contour correlations with geological contours were: at 2s, the intra Neocomian unconformity surface at 1 s, the Leederville Formation at 0.5 and 0.33s the Kings Park and Osborne Formations.
- It is thought that peak contours in the shorter period maps may correspond to alluvial deposits of various thickness.
Further field work is required to improve control on contours. Also further averaging of spectral ratios is required to reduce sampling error.
Data distribution, publication and requests
Monthly lists of Western Australian earthquakes were distributed to interested recipients.
Numerous requests for seismic data were attended to during the year. Narrogin magnetic tapes were sent to ASL via the Australian Seismological Centre (Canberra) where they were copied prior to being forwarded. Mundaring WWSS and Narrogin SRO seismograms were sent to the WDC-A and Albuquerque Seismological Laboratory for copying.
Earthquake Symposium
From 5-7 September 1990, the Department of Primary Industries and Energy, Perth was the venue for a 3 day symposium organised by Peter Gregson, Officer in charge at Bureau of Mineral Resources (BMR), Mundaring Geophysical Observatory (MGO). The occurrence of large earthquakes in Australia over recent decades has attracted international interest, even amongst seismologists in countries bordering active plate boundaries.
6
BMR acting Deputy Director, Dr David Denham opened the symposium by summarising the important part played by the MGO in establishing BMR's reputation for operating world-class geophysical observatories. Two names on the first page of MGO's visitors book are those of Jeffreys and Bullen, both world renowned seismologists. Ian Everingham, previous ole at MGO also attended the symposium.
Twenty-six papers were presented over seven sessions on Wednesday and Friday, with a field trip to Meckering on Thursday to inspect the scarp formed during the October 14, 1968 earthquake. Abstracts of papers are given in Gregson 1990. John Lewis from the Geological Survey of WA and one of the authors of an authorative report on the earthquake, gave a paper and field briefing on the faulting. Ed Paull and Barry Page from MGO had supervised the excavation of a trench across the scarp so that subsurface features of the faulting could be examined. Interpretation was led by Tony Crone and Mike Machette from the U.S. Geological Survey who were in Australia on a grant from the U.S. National Science Foundation to undertake paleoseismicity studies of scarps formed during the large central Australian earthquakes at Marryat Creek in 1986 and Tennant Creek in 1988. They and Roger Bowman, Australian National University collaborator on the project, broke their trip to attend the symposium and present initial results of their study.
Thirty-eight delegates attended, from Japan, United States and all Australian States except Tasmania and the Northern Territory. Universities, government. emergency services and private sector were all represented.
Professors Kagami and Hattori and Dr. Taniguchi from Japan also synchronised their visit to Perth to co-incide with the symposium. Their joint project with MGO to undertake microzonation of the Perth Basin follows a visit last year by Brian Gaull to Japan to establish a methodology. Three joint papers on the work were presented and their preliminary results showing amplification of ground movement at frequencies corresponding to different geological strata were remarkable. This method will be repeated at Newcastle, NSW and Adelaide, SA.
Papers on specific Australian earthquake sequences, at Tennant Creek, NT, Meckering, WA and Tasmania were given by Emmanual Bouniot, Roger Bowman, Vic Dent, Laurie Drake, Gary Gibson and Marion Michael-Leiba and regional seismic studies were presented by Russell Cuthbertson (Qld), Peter Gregson (WA),
David Love (SA) and Kevin McCue (SE Australia). The last two sessions dealt with crustal studies (Vic Dent and Roger Bowman) and instrumentation (Barry Page and Vaughan Wesson). Mike Gladwin illustrated some interesting anomalous strain recordings on University of Queensland meters installed near the San Andreas Fault in California, up to a year before the Loma Prieta earthquake of last October.
Charles Bubb, Australian delegate to the International Association of Earthquake Engineering closed the symposium with a discussion of professional liability; a rapidly developing issue in Australia, especially with professions called on to give advice in court.
4. GEOMAGNETISM
An Eschenhagen 20mmlhr magnetograph operated continuously at Gnangara recording the three components D, Hand Z. Routine recording commenced with the Elsec Automatic Observatory (AMO) from 3 July. Three components D, F and I were recorded digitally at minute intervals. Some problems (detailed below) were experienced during testing and calibration of the AMO in the early part of the year.
7

An EDA fluxgate magnetometer was operated at Learmonth throughout the year. Three components X, Y and Z are recorded digitally at minute intervals on an EDAS tape recorder.
GNANGARA
Eschenhagen magnetograph. The magnetograph operated satisfactorily throughout the year. Record loss was minimal although several records were recorded back to front. There were no abrupt changes in base or scale values.
As in previous years, the Z scale value drifted between summer and winter, i.e. April to June becoming less sensitive and October to November becoming more sensitive. The range was from 5.16 to 5.40 nT/mm.
Adopted scale and baseline values for 1990 are given in Table 20. The corrections applied to derive the adopted values are given in Table 14. The standard deviations of observed baseline and scale values from adopted values for each year are given in Table 19. The values are fairly consistent with previous years.
Eschenhagen magnetograph tests
Temperature coefficients. Values of qH = 0.0 nTl C remained valid during the year and qZ = 1.0 nTfc has applied since August 1988. Table 17 summarises the temperature coefficients used.
Orientation. Orientation tests were carried out on the H and 0 variometers on 12 December. Results are shown in Table 18. The orientation determined for both magnets were less than 1
0 from
the required azimuth and were compatible with previous results after allowing for secular variation and ordinate adjustments
Parallax. No tests were performed during 1990 and it was assumed that parallax remained unchanged from previous years. During 1973 it had been found that the parallax on variation trace time-mark spots (but not on baseline spots or hour lines) was zero on all components. The parallax for other time-marks can be measured from the trace time-marks.
Scale values. A magnetograph calibration MC02 was used in conjunction with Helmholtz coils to determine Hand Z scale values once weekly. The 0 scale value was determed as 1.09'/mm on 12 December using a Helmholtz coil. This was consistent with the value being used.
Mag netometers
Absolute observations for D, Hand Z values were made at weekly intervals. An Askania magnetometer (SIN 309319, circle 580135) was used throughout the year for 0 observations on the NE pier. A proton vector magnetometer (PVM B/5/Z) was used for combined observations of F and Z (cancellation method) on the NM pier. The PVM consisted of Elsec vector coils (set B), and MMS-2 proton preceSSion magnetometer (SIN 5) and sensor (SIN Z). H and I values were calculated from the F and Z values.
Table 14 details the magnetometers and the correction applied to observed values.
Comparisons
Comparisons were made through baseline values between tha standard set of OHM's 460 to 461 and the PVM H. Results are are detailed in Table 15. A series of observations were made over a ten week period from October 24 comparing values of H, 0, Z, F and I determined from the normal set of magnetometers (as above) and a DIM magnetometer on the NE pier. Comparisons were made through the baselines (see Table 15).
8

A second set of brass foot plates were fixed to the NE pier so that the Askania magnetometer could be completely rotated through 180°. This enabled an absolute correction to be determined for the magnetometer. Sets of observations were made between 28 November and 27 December and showed a difference between the observed baselines depending on its orientation.
ASK.D(N) - ASK.D(S) = -1.9' (Eschenhagen) ASK.D(N) - ASK.D(S) = -1.8' (AM 0)
Reference marks
Auxiliary marks were not used or checked during the year.
Record changing
Magnetograms were changed at 00 UT except for the period 23 August to 29 December, when they were changed at 0900 UT.
Automatic Magnetic Observatory CAMO)
Routine recording commenced using the Elsec Automatic Magnetic Observatory at,Gnangara on 3 July 1990, although data from the testing period since January has been recorded and calibrated. Variations in the three components D, F and I are recorded at minute intervals. Data is telemetered back to the Mundaring office using a Telecom line and recorded on a dedicated NEC APC IV computer using 5 1/4" discs formatted for 1.2 mbyte capacity. A Cleveland PC is located at Gnangara as a backup in the event of the communication link or NEC PC failing. An SPS-1000 backup power supply is installed at Gnangara to ensure that operation continues in the event of a mains power failure. The NEC PC at Mundaring is operated from continuous SRO power. Figure 4 shows a block diagram of the system equipment.
Control observations were made throughout the year using the same instruments as for the Eschenhagen variometer. Table 21 gives the control values adopted for the AMO. The standard deviations of observed and adopted values are given Table 19. It is planned that a DIM magnetometer will be used for control observations from 1 January 1991. This will give direct control between observations and recorded components.
The Elsec magnetometers failed on April 27 as a result of mouse infestation. It was sent to Canberra for repair and reinstalled on with official recording starting on July 3. The equipment at Gnangara was sensitive to heat and required air conditioning during the summer months.
The equipment operated reliably other than the two month break.
Adopted scale and baseline (at 5000 counts) values are given in Table 21.
Accessory eqUipment
With the installation of the NEC PC recording digital data from Gnangara the visual Askania magnetograph was withdrawn from service in the Mundaring office. Up to 40 hours of on-line data is displayed on the NEC screen which is sufficient as a visual monitor.
LEARMONTH
EDA fluxgate magnetograph. Components of X, Y and Z were recorded throughout the year without significant loss. Recording of an F channel were spasmodic, but as the field could be defined
9

by X, Y and Z it was not a problem.
Adopted base, scale and zero values for 1990 are listed in Table 26. The corrections applied are shown in Table 24. The Z zero value drifted by about 15 counts (3 nT) in June but then returned rapidly to its previous value towards the end of June. There were no other sudden jumps.
Standard deviations of observed base, scale and zero values from adopted values for each year are shown in Table 27. The values are consistent with previous years.
Temperature coefficients
Temperature coeficients derived for previous years were used during 1990 (see Table 25) as was the Doric thermograph count conversion to temperature.
o T C = count x 0.019924 - 0.176
Magnetometers
Absolute observations for 0, F and I were made at weekly intervals using a DIM and Elsec E801 proton precession magnetometer. Table 24 gives the details of instruments and corrections used.
Comparisons
There were no comparisons made during the year.
Reference marks
Auxiliary marks were not used or checked during the year.
Data reduction and publication
Routine distribution and publication of data from Gnangara and Learmonth is shown in Table 30
Gnangara
Magnetograms and reduction data were prepared in monthly batches about six weeks after the end of the month and sent to headquarters for reduction to mean hourly values. Weekly batches of AMO digital data were transfered to the BMR Data General computer where they were stored for later processing.
Monthly and annual mean values of H, 0, Z, F and K-index for 1990 are listed in Table 22. The field values were derived from the five local quiet days each month by scaling a mean ordinate for each component from each magnetogram. The F value was calculated from Hand Z values. Annual values and secular variation for all components since 1980 are shown in Table 23. Changes in 0 continued the trend commenced in the early 1980's with 0 becoming more easterly by about 2.5' per year. H continued to decrease but only by 2 nT and Z increased by 2 nT. The mean value of F decreased by 41 nT
A plot of secular variation since 1919 is shown in Figure 6.
K-indices for each week are dispatched to the Ionospheric Prediction Service (Sydney) from where they are distributed to their recipients. Components of K-index are stored on computer at headquarters.
10

Checked data for solar flare effects for 1988 were prepared for the IAGA Bulletin.
Learmonth
All control data is prepared at Mundaring. Digital tapes of minute values of X, V, Z are sent direct to headquarters where they are stored for further processing
Monthly mean and annual values of field components were determined at head-quarters and are shown in Table 28 and 29 respectively. The trends indicated since installation of the magnetograph in 1986 are 0 becoming more easterly (1.5'/annum); H remaining fairly constant; Z becoming more negative (6 nT/annum) and F increasing (5 nT/annum).
Magnetic surveys
Australia Wide Array of Geomagnetic Stations were visited in February/March to change batteries and to make absolute observations. Occupations were as follows:-
Feb 1990 (P.J. Gregson) Southern Cross, Laverton, Esperance and Albany
Mar 1990 (E.P. Paull) Zanthus, Carnegie, Meekatharra, Mt Vernon, Port Hedland (B.J. Page) Carnarvon & Geraldton
Arrangements were made with local operators to return the magnetometers to Flinders University (SA) in July.
5. IONOSPHERICS
A quarter-hourly sounding schedule was continued throughout the period using a model 4B ionosonde. The ionosonde spare components and film were supplied by the Ionospheric Prediction Service. A total of 2.6% of record was lost; 2.4% as a result of the film jamming.
There were no major technical problems.
Data distribution and publication
The F21ayer critical frequency at each six hours UT and local noon were scaled. The six-hourly values were sent to IPS for distribution internationally and the monthly median of the noon values was telexed to the International Radio Consultative Committee (Geneva) for the determination of the index IF2. The weekly film was sent to IPS Sydney for scaling of the remaining parameters. Hourly values of all parameters are published in the IPS Series 0 and are distributed internationally. lonograms are available on loan within Australia from IPS and internationally through the WOC-A.
6. GENERAL OPERATIONS
Computing
The computing system in operation at Mundaring at the end of 1990 is shown in Figure 7.
Webster system. A Wester computer is the backbone of the computing system at Mundaring. It supports:
11

Desk top terminals (7) Graphics terminal Printer Plotter Laptop computer Modem
(Wyse WY85 or WY99GT) (Digital VT340) (Toshiba P351) (Graphtec MP3200) (NEC multispeed) (Dataplex DPX224)
The Webster is supported by the Phillip Institute of Technology Seismic Interpretation System (PITS IS). The system is used routinely for earthquake location, to catalogue Western Australian earthquake data and to produce listings or plots of earthquakes according to specified requirements. Data from digital recorders (Kelunji's) is currently fed into the Webster via the NEC multispeed laptop where it is analysed. The computer is also used for administrative requirements, operational logs, storage of some geomagnetic data etc.
A Telecom DDS line between Mundaring and the Australian Seismological Centre in Canberra (ASC) provides permanent access to the suite of SUN computers. A statmux (scitec NPX25) allows access through eight ports which can be used simultaneously. One port is accessed from the Webster allowing access to the SUN from any of the desk top terminals. A second port can be accessed directly from terminal 5 to ensure that seismic phase data can be transmitted without delay.
All seismic phase data analysed from all Western Australian seismograph stations is transmitted via the above link to the SUN computer at ASC where it is processed and automatically telexed to the United States National Earthquake Information Centre via the United States Embassy in Canberra. Data is also stored for later production of monthly bulletins of Australian seismic data.
The Dataplan modem installed during the year allows dial-up access via the Telecom network for other users and visa versa. Access for non-approved users is protected by using passwords. Access to the ASC Webster can be obtained through a local area network via the SUN.
DEC 350PC system. This system is dedicated to storage and analysis of digital earthquake strong motion data recorded on Geotech A700 accelerographs. It is used for data both recorded on BMR and Water Authority, Western Australian accelerographs. It supports a printer (Digital LA50) and a Geotech data retrieval unit (DRU750) for transferring data from accelerographs to computer.
NEe system. An online NEC APCIV continuously records digital geomagnetic data from the Gnangara magnetic observatory via a Telecom line. A back-up Clevland PC is maintained at Gnangara in the event of a line failure. Data is transferred weekly from the recording NEC to a second NEC PC via disc. A link through the DDS line connects this NEC to the BMR Data General computer where magnetic data is stored and processed. This link was not being used routinely as it was not reliable at the end of 1990. Steps are being taken to improve the reliability.
It is proposed that data from the Learmonth Magnetic Observatory will be fed into the Data General through the Mundaring based NEC PC using either disc transfer or a dial-up modem.
Works prog ram
There were no major works project during the year other than the normal program of painting, etc.
7. ACKNOWLEDGEMENTS
The assistance of the daily attendants listed in Table 4 and the co-operation of Telecom for housing the seismomgraph at Marble Bar is hereby acknowledged. Remote seismometers and telemetry equipment were located on the properties of K. Quartermaine (Narrogin), V. Wright (Kellerberrin) and T. Mailey (Ballidu).
12

8. REFERENCES
EVERINGHAM, LB., McEWIN, A.J. & DENHAM, D., (1982) - Atlas of isoseismal maps of Australian earthquakes. Bureau of Mineral Resources, Geology and Geophysics, Bulletin, 214.
GAULL, B.A., MICHAEL-LEIBA, M.O., and RYNN, J.M.W., (1990) - Probabilistic earthquake risk maps of Australia. Australian Journal of Earth Sciences, 37, 169-187
GREGSON, P.J., (Compiler), (1990) - Recent intraplate seismicity studies - Symposium, Perth, Western Australia. Bureau of Mineral Resources, Geology and Geophysics, Record, 1990/44 (unpublished).
GREGSON, P.J., (1991) - Mundaring Geophysical Observatory, 1986 to 1989. Bureau of Mineral Resources Geology and Geophysics, Record, 19911 (unpublised)
GREGSON, P.J., 1986 - Australian Seismological Report 1982. Bureau of Mineral Resources, Australia, Report 273
McCUE, K.F., 1980 - Magnitude of some early earthquakes in southeastern Australia. Search, 11 (3), 78-80
13

APPENDIX 1
PRINCIPAL EVENTS
MUNDARING GEOPHYSICAL OBSERVATORY 1957·1990
1957 May 1959 Mar 18 1959 Apr 03 1959 Jul30 1960 Mar-Oct 1960 Apr 30
1960 May 01 1960 Jun 22
1962 Jun 1963 Apr 19-Dec 17 1963 May 30-Dec 19 1964 Nov 06 1965 Nov 29-1966 Aug 24 1965 Nov
1967 Feb 1967 Oct 26 1968 Oct-Nov 26 1968 Nov 16-1971 Dec 31 1970 Jan 01 1970 Feb 26 1971 Feb 10-1972 Jul 31 1971 Nov 30 1972 Feb 29 1972 Mar 01 1972 Jun 27
1972 Oct 12-1975 Feb 1972 Nov 16 1973 Jan 31
1973 Mar 01 1973 Mar 30 1973 May 23 1973 May 25 1974 Apr 01 1974 May 01 1974 Jun 17-31 1974 Sep-1978 Jun 1975 Jul 18-Nov 19 1975 Mar 1975 Mar 19-Aug 15 1975 Sep 02-1976 Feb 05
Geomagnetic recording commenced at Gnangara (La Cour) Transfer of observatory from Watheroo to Mundaring lonsopheric recording commenced (Type 2 ionosonde) MUN seismograph recording commenced (Benioff) Atmospheric noise recording (for CSI RO) Eschenhagen normal magnetograph replaced La Cour at Gnangara Cossor ionosonde replaced Type 2 Absolute magnetic observations commenced in new absolute house WWSS system commenced recording at M UN GRV seismograph operation NGN seismograph operation KLG SP seismograph recording commenced LVS seismograph operation KNA SP-Z seismograph recording commenced; operation intermittent till February 1972 Fremantle Region Upper Mantle Project MEK SP-Z seismograph recording commenced Field seismograph operation at Meckering AFMAG recording at Mundaring Routine analysis of KNA seismograms commenced IPS IIIE ionosonde replaced Cossor KAA SP-Z seismograph operation Two M02 accelerographs installed at Meckering KNA seismograph upgraded to 3 components M02 accelerograph (PWD) installed at Kununurra Proton scalar magnetometer introduced for Z baseline control MBT SP-Z seismograph recording M02 accelerograph (PWD) at Kununurra Mobile SP-Z recording at various sites in SW seismic zone started MEK reduced to 3 component SP KLG reduced to SP-Z MUN 2 Wood Andersons installed MUN Benimore SP-Z withdrawn; Benioff SP-Z started Proton vector coils introduced for Z baseline control Proton vector coils introduced for H baseline control Riometer recording at Mundaring during solar eclipse GLS SP-Z recording Earthtide recording at Mundaring MagnetiC pulsation recording commenced at Mundaring SWV SP-Z recording NWAO SP-Z recording
14
1976 Mar 27 1976 Jun 1976 Sep-1977 Nov 27 1976 Oct 1977 Nov 28 1978 Feb 1978 Jun 27 1980 Jun 19 1981 Aug 07-1982 Mar 27 1981 Sep 23 1981 Nov 19-1982 Jun 27 1982 Aug 26 1983 Aug 03 1984 Jun 21 1986 Mar 04 1986 Apr 30 1986 May 12 1986 Oct 26 1987 Jan 16
1987 Jun 27 1987 Oct 22 1988 Apr 1988 Aug 10 1988 Oct 07 1988 Dec 1989 Sep 13 1990 1990 Jul 03
APPENDIX 1 (Contd)
NWAO Seismic Research Observatory commenced MBl SP-Z recording commenced XMI recording Special ionospheric sounding, solar eclipse (23 Oct) A third M02 accelerograph installed at Meckering A fourth M02 accelerograph installed at Meckering WBN SP-Z recording commenced NAU SP-Z recording commenced BAL SP-Z recording KLB SP-Z recording commenced Walpole SP-Z field recording BAL SP-Z recording commenced RKG SP-Z recording commenced MRWA SP-Z recording commenced First digital accelerograph (A700) installed at Cadoux MEK SP-Z recording transferred to MEKA KLG SP-Z recording transferred to KLGA Geomagnetic recording commenced at Learmonth Program of strong motion recording commenced on WAWAdams WBN SP-Z recording transfered to WARB NAU SP-Z recording transfered to NANU Office accomodation extended KLGA SP-Z recording transfered to COOL FORR SP-Z recording commenced Webster computer installed First Kelunji recording equipment installed at Dowerin Perth microzonation project GNA - routine AMO digital recording commenced
15
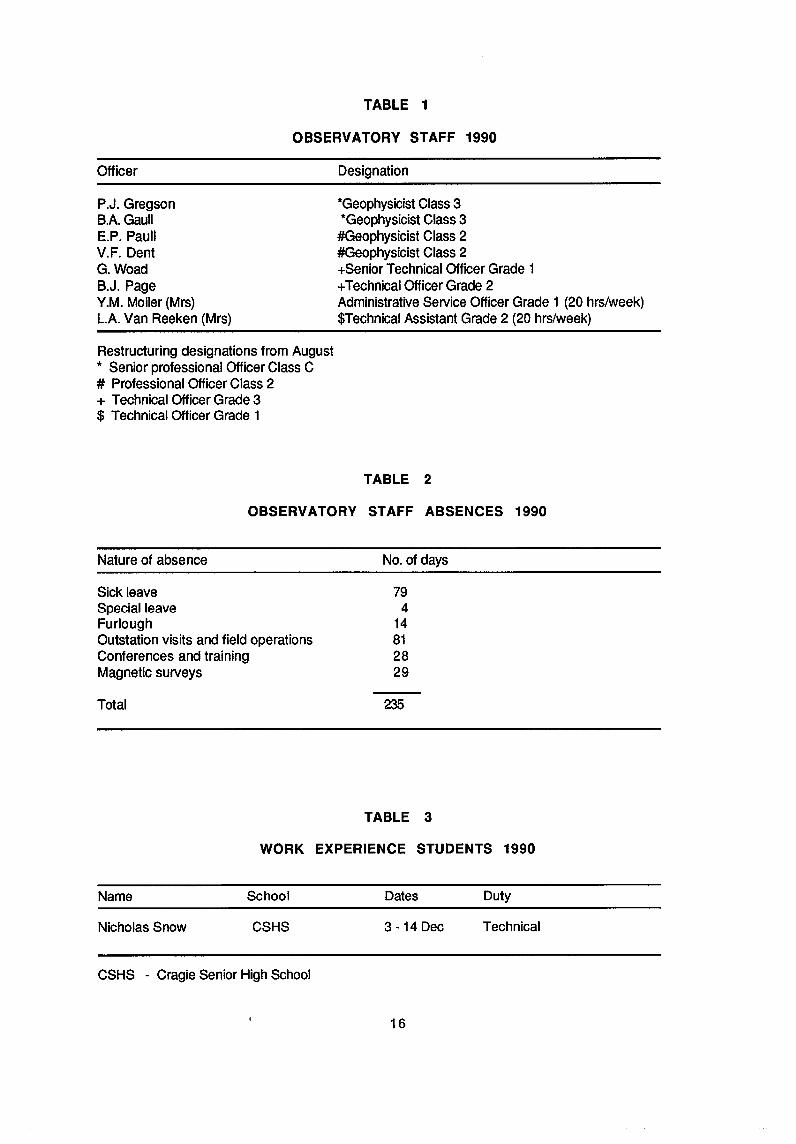
TABLE 1
OBSERVATORY STAFF 1990
Officer
P.J. Gregson B.A. Gaull E.P. Paull V.F. Dent G. Woad B.J. Page Y.M. Moiler (Mrs) L.A. Van Reeken (Mrs)
Restructuring designations from August * Senior professional Officer Class C # Professional Officer Class 2 + Technical Officer Grade 3 $ Technical Officer Grade 1
Designation
*Geophysicist Class 3 *Geophysicist Class 3 #Geophysicist Class 2 #Geophysicist Class 2 +Senior Technical Officer Grade 1 + Technical Officer Grade 2 Administrative Service Officer Grade 1 (20 hrs/week) $Technical Assistant Grade 2 (20 hrs/week)
TABLE 2
OBSERVATORY STAFF ABSENCES 1990
Nature of absence
Sick leave Special leave Furlough Outstation visits and field operations Conferences and training Magnetic surveys
Total
No. of days
79 4
14 81 28 29
235
TABLE 3
WORK EXPERIENCE STUDENTS 1990
Name School Dates Duty
Nicholas Snow CSHS 3 -14 Dec Technical
CSHS - Cragie Senior High School
16

Name
B. Carling P. Harvey L. Wooton A. Annear P. Kildea D.Hart J. Bartlet S. Curtis C. Paget R. Tregonning S. Cameron D. Schoch S. Lozsan
TABLE 4
ASSOCIATED PERSONNEL 1990
Nature of Duties
Daily attendant, Gnangara (to Aug 21 ) Daily attendant, Gnangara (from Aug 22) Daily attendant, Kununurra (to Feb 10) Daily attendant, Kunnunrra (from Feb 10) Daily attendant, Meekatharra Daily attendant, Morawa Daily attendant, Nanutarra Daily attendant, Warburton (to Aug 10) Daily attendant, Warburton (from Aug 10) Daily attendant, Marble Bar Daily attendant, Rocky Gully Ground maintenance Cleaning
TABLE 5
CONFERENCES, TRAINING AND COMMITTEES 1990
Officer Date
P.J. Gregson
V.F. Dent 5-9 Feb
G. Woad 9 Feb
P.J. Gregson 9 Feb
P.J. Gregson 13 Aug
G. Woad 28 Aug
V.F. Dent 13 Nov
P.J. Gregson; E.P. Paull; 5-7 Sep V.F. Dent; BA Gau"; G. Woad; B.J. Page
17
Conference
Committees
Geophysics Advisory Committee, Western Australian Institute of Technology.
Conferences
9th Australian Geological Conference, Hobart.
Seminar on "Effects of lightning" - Perth.
EEO awareness, DPIE, Perth.
Leadership and leadership teams, DPIE, Perth.
Operation of HP CRO's - Perth.
Seminar - Canning BaSin, GSWA, Perth.
Earthquake seminar - Perth.

TABLE 6
ADDRESSES
Officer Date Organisation
V.F. Dent 5-9 Feb 9th Australian Geological Conference, Hobart-"Accurately located earthquakes near Cadoux, Western Australia.
B.A. Gaull 9 Mar Royal Society of WA - "Earthquake risk and prediction".
P.J. Gregson 5-7 Sep Earthquake seminar - "Seismicity of Western Australia - an overview".
E.P. Paull & 5-7 Sep Earthquake seminar - "Duration B.A. Gaull magnitude".
V.F. Dent 5-7 Sep Earthquake seminar - "The ML 5.5 Meckering earthquake of 17 Jan 1990 and its foreshocks and aftershocks".
B.A. Gaull 5-7 Sep Earthquake seminar - "A study on the microzonation of the Perth Basin, Western Australia, through microtremor measurements. A pilot survey and its preliminary analysis.
BA Gaull 5-7 Sep Earthquake seminar - "Preliminary results of the microzonation of the Perth Basin in the region of the Perth MetropOlitan area".
V.F. Dent 5-7 Sep Earthquake seminar - "A crustal model for south-east Western Australia".
V.F. Dent 5-7 Sep Earthquake seminar - "Deviations from Jeffreys-Bullen travel times for Australian earthquakes.
B.J. Page & 5-7 Sep Earthquake seminar - "History of strong B.A. Gaull motion recording in Western Australia".
18

Visitor
Prof H. Kagami Dr H. Tanaguchi
Mr R.lves Mr K. Harraway Mr K. Muirhead Mr D. Perry MrL. Miller Mr J. Rickards Mr C. Swindells Mr R. Bowman Dr A. Crone Mr M. Machette Dr E. Padovani Mr R. Cuthbertson Dr D Denham Dr M. Dentith MrL. Drake Mr I. Everingham MrG.Gibson MrV. Wesson Dr M. Gladwin MrS. Gunson Dr S. Hattori MrJ. Lewis Mr D. Love MrK. McCue Dr M. Michael-Leiba Mr C. Sinadinovski
TABLE 7
VISITORS 1990
Institution
Hokkaido University, Japan The Research Institute of Regional Problems, Japan State Emergency Service State Emergency Service (Northam) Australian Seismological Centre C.S.I.R.O C.S.I.R.O Teledyne Geotech (Melbourne) Geological Survey of WA Australian National Universtty, Canberra U.S. Geological Survey U.S. Geological Survey U.S. Geological Survey Queensland Geological Survey Bureau of Mineral Resources, Canberra University of WA Macquarie University
Phillips Institute of Technology, Vic Phillips Institute of Technology, Vic University of Queensland Curtin University, WA Muroran Institute of Technology, Japan Geological Survey of WA Department of Mines & Energy, SA Australian Seismological Centre, BMR, Canberra Australian Seismological Centre, BMR, Canberra Flinders University, SA
19

TABLE 8
WESTERN AUSTRALIAN SEISMOGRAPH STATIONS 1990
Code Station Name latO S LongO E Elev Opened Closed
AZA Arizona* 30.4846 116.8645 300 90 Jun 22
BAl Ballidu 30.6065 116.7072 300 82 Aug 27
ClK Clackline * 31.7230 116.4940 265 90 Nov 13
COOL Coolgardie 30.8838 121.1447 500 88 Aug 10
FORR Forrest 30.7992 128.0673 530 88 Oct 07
KlB Kellerberrin 31.5923 117.7600 300 81 Sep 23
KNA Kununurra 15.7500 128.7667 150 72 Feb 28
MBl Marble Bar 21.1600 119.8333 200 76 Jun 21
MEKA Meekatharra 26.6142 118.5336 520 86 May 01
MRWA Morawa 29.2180 115.9960 300 84 Jun 21
MTN Manton Dam 12.8467 131.1300 80 72 Jun 01
MGO Mundaring Office 31.9033 116.1650 250 79 Jan 11
MUN Mundaring 31.9783 116.2083 253 62 Jun 01
NANU Nanutarra 22.5620 115.5290 300 87 Oct 22
NOR Northam * 31.6570 116.6650 155 90 Nov 13
NWAO Narrogin 32.9267 117.2333 265 76 Mar 19
PIN Pingrup * 33.5165 118.6143 300 89 Aug 01 90 May 27
RKG Rocky Gully 34.5698 117.0103 300 83 Aug 03
TOU Touella* 30.4890 116.7600 300 90 Jun 22
WARB Warburton 26.1838 126.6430 460 87 Jun 28
WOO Wooroloo * 31.8070 116.3180 245 90 Nov 13
* Temporary station
20

TABLE 9
SEISMOGRAPH CALIBRATION DATA 1990
MAGN IFICATION (x1000)
SHORT PERIOD
PERIOD (Sec) 0.1 0.15 0.2 0.25 0.3 0.4 0.5 0.6 0.7 0.8 0.9 1.0
BAl Z 224 300 282 254 238 148 99 66 49 36 26 19
COOL Z 200 417 399 255 178 130 91 70 50 36
FORR 207 358 402 389 343 232 151 99 63 43 20 19
KlB Z 200 426 475 438 376 262 183 130 92 66 43 37
KNA Z 135 187 200 187 164 118 86 65 49 37 28 21
KNA N,E 36 54 61 62 58 48 39 32 27 22 19 16
MBl Z 481 748 828 794 711 500 380 293 220 177 140 116
MEKA Z 349 453 480 448 393 280 200 143 105 78 58 43
MRWA Z 650 878 974 926 808 556 364 240 156 105 72 47
MTN Z 34 180 246 240 200 157 118 87 55 40
MGO INS 2.60 3.03 2.98 2.97 2.97 2.87 2.59 2.25 1.89 1.70 1.40 1.11
MUN+ZNE 3 6 10 14.5 20 31 39 41 40 36 31 25
MUN HGZ 406 380 338 324 326 318 207 101 55 31 21 14
MUN WA 2.05 2.05 1.98 1.83 1.68 1.50 1.35 1.21 1.06 0.95
NANU Z 480 940 1010 954 823 520 348 190 115 76 53 40
NWAO*Z 30 110 193 238 260 242 190 150 120 90 70 50
PIN Z to 26 May 90 296 336 3-4 264 224 164 154 230 60 48 30 21
RKG Z 544 632 616 540 408 246 160 104 68 48 32 22
WARB Z 900 1220 1300 1190 1010 673 430 265 176 116 78 55
Standard Wood- 2.77 2.75 2.65 2.43 2.25 2.03 1.82 1.61 1.43 1.27 Anderson Response
lQN~ PEBIQD PERIOD (Sec) 8 9 10 15 20 25 30 40 50 60 80 100
MUN+Z .62 .69 .72 .75 .67 .50 .55 .35 .29 .22 .15 .11 MUN+Z .31 .34 .36 .37 .34 .25 .27 .18 .14 .11 .08 .06 MUN+NE .31 .34 .36 .37 .34 .25 .27 .18 .14 .11 .08 .06 NWAO*ZNE 2.8 4.0 6.8 8.8 32.8 40.0 40.0 31.6 26.4 16.0 8.0 4.4 NWAO*ZNE 0.7 1.0 1.7 2.2 8.2 10.0 10.0 7.9 6.6 4.0 2.0 1.1
+ World Wide Standard Seismograph SP-Z, N, E LP-Z, N, E * Seismic Research Observatory SP-Z LP-Z, N, E HG High Gain Short Period Vertical WA Wood Anderson Seismograph
21

TABLE 10
WESTERN AUSTRALIAN EARTHQUAKES 1990
Date Origin UT LatOS LongOE Depth Magn Locality
Jan 6 125853.9 30.85 117.15 2 ML2.3 CADOUX, 9KM SSE Jan 13 1430 5.6 30.86 117.72 4 ML2.4 BENCUBBIN, 13KM WSW Jan 16 0251 57.5 31.19 117.51 1C ML 2.1 WYALKATCHEM, 13KM E Jan 7 0638 8.2 31.72 116.99 6 ML5.5 MECKERING, 10KM S Jan 17 0741 16.4 31.75 117.00 13 ML 2.0 MECKERING, 13KM S Jan 17 153930.0 31.70 117.00 6 ML 2.0 MECKERING, 8KM S Jan 17 1652 9.2 31.70 116.98 3 ML 2.0 MECKERING, 8KM SSW Jan 19 0223 1.1 31.70 116.98 3 ML2.3 MECKERING, 8KM SSW Jan 19 0416 3.2 31.04 116.51 4 ML2.5 CALINGIRI, 7KM NE Jan 20 114537.4 30.86 117.15 0 ML 2.2 CADOUX, 11 KM SSW Jan 20 1853 14.5 27.37 122.90 5N ML2.3 COSMO NEWBERRY, 68KM N Jan 25 054751.1 31.70 116.98 4 ML 1.6 MECKERING, 8KM SSW Jan 26 022942.2 34.04 117.81 3 ML2.4 TAMBELLUP, 16KM E Jan 26 0551 5.9 33.44 117.82 5N ML2.0 DUMBLEYUNG, 16KM SSE Jan 26 180338.2 33.44 117.82 4 ML 2.2 DUMBLEYUNG, 15KM SSE Feb 1 0711 55.2 31.65 117.04 4 ML2.3 MECKERING, 4KM SE Feb 1 2258 16.3 33.45 117.81 0 ML 2.9 DUMBLEYUNG, 16KM SE Feb 3 130058.8 16.86 121.53 5N ML3.4 BROOME, 144KM NW Feb 12 2211 16.9 22.61 114.53 5N ML 2.3 EXMOUTH, 87KM SE Feb 14 0203 6.0 32.22 119.82 5N ML 1.9 KALGOORLlE, 226KM SW Feb 18 224733.7 18.25 118.23 5N ML4.5 PORT HEDLAND, 230KM N Feb 20 1419 1.0 16.54 128.51 5N ML 3.1 KUNUNURRA, 88KM S Feb 25 1600 10.6 31.63 117.03 10 ML 2.1 MECKERING Feb 26 231746.2 20.00 118.39 5N ML 2.2 PORT HEDLAND, 40KM NW Mar 5 1258 25.5 26.26 127.77 3 ML 2.9 WARBURTON, 116KM E Mar 5 152045.9 34.41 115.12 5N ML 2.0 AUGUSTA, 10KM S Mar 12 0730 12.8 19.22 124.70 5N ML 2.0 TOBIN LAKE, 150KM NW Mar 17 054841.5 33.41 117.82 5N ML3.2 DUMBLEYUNG, 13KM SE Mar 20 2109 21.8 18.46 124.24 5N ML3.4 DERBY, 142KM SE Mar 23 201731.3 30.75 117.12 5N ML 1.7 CADOUX,4KM NW Mar 25 200441.2 20.39 116.14 15 ML 2.3 DAMPIER, 67KM NW Mar 26 1400 7.4 17.43 121.04 16 ML2.4 BROOM E, 140KM NW Mar 28 071345.3 30.76 121.49 1C ML 2.9 KALGOORLIE Mar 28 1125 8.0 15.00 129.15 5N ML 2.2 KUNUNURRA, 54KM SE Mar 30 1131 27.6 24.02 113.39 5N ML3.5 CARNARVON, 100KM N Apr 14 121320.4 15.81 124.57 5N ML2.5 DERBY, 196KM NNE Apr 15 0620 21.8 22.33 114.06 5N ML3.2 LEARMONTH, 8KM SSW Apr 15 131758.0 30.55 116.80 3 ML2.6 BALLlDU, 6KM NNE Apr 19 0011 44.0 30.53 116.78 4 ML 1.8 BALLlDU, 7KM N Apr 20 011535.7 30.54 116.78 5 ML 2.1 BALLlDU, 7KM N Apr 21 213653.1 26.14 127.30 10 ML 3.1 WARBURTON, 72KM E Apr 28 1352 43.1 30.53 116.78 5 ML 1.5 BALLlDU, 7KM N Apr 30 041930.3 30.53 116.80 5 ML2.7 BALLlDU, 8KM NNE Apr 30 042430.8 30.53 116.81 1C ML3.0 BALLlDU, 9KM NNE Apr 30 052230.7 30.52 116.83 4 ML2.0 BALLlDU, 10KM NE May 6 2351 15.2 30.54 116.78 5N ML2.0 BALLIDU, 7KM N May 8 184056.6 30.78 117.10 2 ML4.5 CADOUX, 4KM W May 9 001430.4 21.61 114.68 5N ML2.7 EXMOUTH, 66KM NE May 9 012453.5 30.56 116.78 5N ML2.5 BALLIDU, 5KM N
22

TABLE 10 (Cont'd)
Date OrQin UT LatOS LongOE Depth Magn Locality
May 9 0241 54.5 27.45 105.97 5N ML 4.1 DONGARA, 900KM W May 9 230523.2 30.53 116.79 5N ML 2.1 BALLlDU, 7KM N May 9 231026.6 30.79 117.10 5N ML 1.8 CADOUX, 4KM SW May 10 135757.9 31.70 117.06 7 ML2.2 MECKERING, 10KM SE May 11 042644.6 30.55 116.81 1C ML2.8 BALLlDU, 7KM NE May 12 153930.7 30.78 117.10 5N ML 1.9 CADOUX, 3KM W May 15 001812.1 18.11 122.12 5N ML2.2 BROOME, 19KM SW May 23 072427.6 30.53 116.78 5N ML 2.1 BALLlDU, 7KM N May 23 2333 17.1 30.55 116.77 5N ML2.2 BALLlDU, 6KM N May 28 082338.1 27.55 113.84 5N ML2.9 KALBARRI, 39KM NW May 29 0127 4.5 32.37 116.93 5N ML 1.8 BROOKTON, 12KM SW May 30 1943 47.1 30.53 116.81 3 ML3.2 BALLlDU, 8KM N May 30 2112 7.3 30.53 116.79 5N ML 1.8 BALLlDU, 8KM N May 30 2145 7.0 30.54 116.79 5N ML 2.0 BALLlDU, 7KM N Jun 3 144034.9 . 31.67 117.00 5 ML 1.7 MECKERING, 5KM S Jun 4 001347.1 30.44 116.83 1C ML 1.8 BALLlDU, 19KM NNE Jun 5 0953 6.7 31.20 117.51 2 ML 2.2 WYALKATCHEM, 13KM E Jun 5 0956 2.6 31.21 117.51 1 ML 1.9 WYALKATCHEM, 12KM ESE Jun 6 1221 57.7 33.41 117.90 0 ML 2.1 DUMBLEYUNG, 19KM ESE Jun 6 144856.8 22.65 114.13 5N ML2.4 LEARMONTH, 45KM S Jun 10 1359 0.5 32.74 118.05 10 ML 2.0 CORRIGIN, 49KM SSE Jun 10 1743 5.4 33.79 118.41 17 ML 2.0 ONGERUP, 21 KM NNW Jun 20 1701 9.5 30.51 116.75 6 ML 2.1 BALLlDU, 10KM N Jun 22 0154 21.8 29.41 114.46 lC ML 2.1 DONGARA, 49KM WSW Jun 23 000349.2 30.53 116.78 4 ML 2.7 BALLlDU, 7KM N Jun 24 072054.0 30.65 118.21 lC ML 2.1 BENCUBBIN, 40KM ENE Jun 24 2055 0.3 30.53 116.81 1 ML2.7 BALLlDU, 8KM NNE Jun 26 091455.1 30.54 116.80 lC ML2.5 BALLlDU, 7KM NNE Jun 26 1750 11.9 24.90 116.91 5N ML2.2 LANDOR, 26KM N Jun 26 2030 46.2 18.70 126.80 5N ML3.3 HALLS CREEK, 105KM WSW Jun 27 0021 16.8 33.71 118.22 5N ML2.4 NYABING, 18KM SSE Jun 27 1423 49.6 18.83 123.12 5N ML 3.1 BROOME, 134KM SE Jul 7 0944 3.0 30.78 117.09 lC ML 1.8 CADOUX, 2KM W Jul 8 110037.6 18.89 121.45 28 ML2.8 BROOME, 131KM SW Jul 9 0917 2.1 30.87 117.06 lC ML 1.8 CADOUX, 13KM SW Jul 10 144547.1 21.91 126.54 5N ML2.4 TOBIN LAKE, 43KM E Jul 11 1855 1.4 30.87 117.08 1 ML2.3 CADOUX, 12KM SSW Jul 13 1818 25.4 18.85 116.32 5N ML3.0 DAMPIER, 204KM NNW Jul 17 0513 0.7 30.77 121.48 lC ML3.2 KALGOORLlE, 3KM SSE Jul 18 0332 12.8 29.48 114.70 5N ML2.3 DONGARA, 34KM SW Jul 22 182445.9 26.90 126.17 5N ML 2.1 WARBURTON, 95KM SSW Jul 23 1253 1.0 31.20 117.48 lC ML 1.8 WYALKATCHEM, 10KM E Jul 31 160042.2 31.21 117.49 1C ML2.0 WYALKATCHEM, 11KM ESE Aug 9 181248.2 31.66 117.02 6 ML2.4 MECKERING, 4KM S Aug 11 1625 43.8 32.22 117.39 0 ML2.3 QUAIRADING, 21 KM S Aug 17 121437.8 17.69 122.54 5N ML 4.2 BROOME, 45KM NE Aug 17 213237.9 17.75 122.57 5N ML2.9 BROOME, 44KM NE Aug 18 041626.1 31.62 117.04 2 ML 2.1 MECKERING, 3KM E Aug 18 1947 6.9 26.27 118.53 49 ML 2.6 MEEKATHARRA,34KM N Aug 19 2049 0.3 20.94 121.38 13 ML2.4 MARBLE BAR, 170KM E
23

TABLE 10 (Cont'd)
Date Origin UT LatOS LongOE Depth Magn Locality
Aug 20 010034.2 31.78 116.34 7 ML 1.9 WOOROLOO, 4KM ENE Aug 20 1845 15.8 32.15 115.58 5 ML 1.8 POSSIBLE BLAST Aug 28 100454.2 22.86 112.75 5 ML3.6 EXMOUTH, 180KM SW Aug 30 1228 50.5 32.93 117.57 6 ML2.0 DUMBLEYUNG, 46KM N Sep 3 170354.1 31.18 123.51 9 ML2.7 ZANTHUS, 18KM S Sep 5 0412 5.7 41.05 117.90 5 ML3.0 ALBANY, 670KM S Sep 11 092952.0 32.89 118.00 5N ML 1.9 NEWDEGATE, 31KM NW Sep12 105029.1 30.57 116.80 2 ML2.5 BALLlDU, 4KM NW Sep12 120539.5 18.63 122.87 5N ML3.2 BROOME, 100KM SE Sep12 1248 3.8 30.56 116.80 2 ML2.2 BALLlDU, 4KM NE Sep12 193048.6 28.37 106.95 5 ML2.7 PERTH, 950KM WNW Sep13 130033.4 30.54 116.80 4 ML 1.8 BALLlDU, 7KM NNE Sep14 155352.0 32.16 117.16 160 ML 1.7 BEVERLEY, 22KM ESE Sep15 1538 15.9 29.89 108.91 5N ML3.7 PERTH, 700KM WNW Sep28 0421 12.7 30.03 123.62 5N ML2.2 ZANTHUS, 110KM N Sep28 055059.2 31.70 116.97 5N ML 1.7 MECKERING,8KMSW Oct 9 181615.5 14.29 128.90 5N ML3.3 KUNUNURRA, 167KM N Oct 15 194927.2 22.34 113.79 5N ML3.2 LEARMONTH, 31 KM WSW Oct 17 143221.8 25.06 115.21 31 C ML2.7 GASCOYNE IN, 1 KM SE Oct 18 095257.1 25.91 115.80 5N ML2.9 BYRO HOMESTEAD, 39KM NW Oct 29 045259.3 20.71 116.82 37 ML2.8 KARRATHA, 5KM NW Nov 6 0911 30.4 29.18 122.97 5N ML2.2 LAVERTON, 83KM SE Nov 8 152259.8 31.09 116.53 2 ML 1.6 CALINGIRI, 8KM E Nov 11 172548.4 20.48 120.19 3 ML2.6 SHAY GAP, 5KM NE Nov 12 0026 11.2 31.36 116.50 2 ML2.0 BOLGART, 10KM S Nov 19 192529.4 21.14 121.68 2 ML2.4 MARBLE BAR,190KM E Nov 20 044254.6 31.71 117.07 2 ML2.2 MECKERING, 11 KM SE Nov 22 081952.3 33.87 118.14 5N ML 1.9 GNOWANGERUP, 15KM NE Nov 22 152953.8 33.87 118.19 2 ML2.0 GNOWANGERUP,19KM E Nov 25 214651.4 21.73 126.40 5N ML3.0 LAKE TOBIN, 36KM NE Nov 27 184958.4 16.68 128.44 2 ML2.5 KUNUNURRA, 105KM S Nov 29 171320.2 31.68 117.05 6 ML2.6 MECKERING, 7KM SE Dec 12 2340 17.0 34.35 116.90 5N ML 1.8 ROCKY GULLY, 22KM NNW Dec 15 140032.6 31.54 117.96 2 ML 2.1 KELLERBERRIN, 25KM ENE Dec 15 173423.0 16.54 128.65 5N ML 2.2 KUNUNURRA,85KM S Dec 21 1557 5.3 31.19 117.49 4 ML2.5 WYALKATCHEM, 11KM E Dec 22 222530.2 33.67 118.07 2 ML 2.0 NY ABING, 15KM SSW Dec 26 1004 8.8 30.08 125.31 3 ML 2.6 RAWLINNA, 105KM N Dec 29 1100 15.3 30.77 117.11 1 ML 1.8 CADOUX,3 KM W
Western Standard Time (WST) = Universal Time (UT) + 8 hours N = Nominal depth C = Constrained depth ML Richter Magnitude MM Maximum Reported Modified Mercalli Intensity
24

TABLE 11
WESTERN AUSTRALIAN ACCELEROGRAPH LOCATIONS 1990
LOCALITY CODE LATS LONGE ELEV FOUNDATION OP.
BALLIDU MaileyT. BA-M 30.607 116.707 300 Granite BMR CADOUX AveryC. CA-C 30.851 117.160 300 Alluvium-Granite BMR EmmottJ. CA-E 30.895 117.123 320 Laterite BMR KalajzicC. CA-K 30.718 117.141 300 Granite BMR KalajzicM. CA-A 30.746 117.151 300 Weathered Granite BMR RobbA. CA-R 30.781 117.138 300 Alluvium-Granite BMR Shankland CA-S 30.810 117.132 300 Alluvium- Granite BMR CANNING DAM Lower gallery CD-L 32.154 116.126 142 Granite BMR Upper gallery CD-U 32.154 116.126 202 Granite BMR DOWERIN Uberin Rock DO-W 31.010 116.982 300 Granite BMR GOOMALLING Skett GO-O 31.394 116.852 250 Granite BMR KUNUNURRA Dam abutment KN-A 16.113 128.737 Phyllite BMR Dam wall KN-W 16.113 128.738 Rock fill, 3 m clay BMR
90 m quartzite MECKERING Kelly ME-K 31.694 116.982 200 Alluvium/Granite BMR MIJNDARING Weir MU-W 31.958 116.164 140 Concrete wall 42m WAWAlBMR O'Conner Museum MU-C 31.957 116.162 106 Concrete floor WAWAlBMR NORTH DANDALUP Downstream ND-D 32.52 116.01 205 Granite WAWAlBMR PERTH Telecom ) PT-B 31.953 115.850 10 Perth Basin Sediment TEUBMR Exchange) PT-M 31.953 115.850 40 Perth Basin Sediment TEUBMR Building ) PT-T 31.953 115.850 70 Perth Basin Sediment TEUBMR SERPENTINE DAM Basement SE-B 32.40 116.10 Granite WAWAlBMR wall SE-W 32.40 116.10 Earthfill WAWAlBMR VICTORIA DAM Survey marker VI-D 32.04 116.06 Granite WAWAlBMR
OPERATQBS BMR Bureau of Mineral Resources, Mundaring Geophysical Observatory WAWA Water Authority of Western Australia WAWAlBMR Owned by WAWA but operated by BMR TEUBMR Owned by Telecom but operated by BMR
25

TABLE 12
ACCELEROGRAPH CALIBRATION DATA
Code Date of Operation Inst. Block CALIBRATION DATA No. No. g-cm and azimuth
Ia Ib Ic
BA-M Fm 1990 May 08 M02 1196 0.590 0.560 0.394 291 090 000 Up
CA-A Fm 1986 Jul 02 A700 10002 1.159V 1.172V 1.167V 033 090 000 Up
CA-C Fm 1986 Oct 03 M02 1196 0.590 0.560 0.394 To 1990 May 07 291 090 000 Up
CA-E Fm 1987 Jan 21 A700 10003 1.178V 1.216V 1.187V 030 090 000 Up
CA-I Fm 1987 Dec 11 M02 448 0.602 0.628 0.409 To 1989 Jun 23 245 090 000 Up
CA-K Fm 1985 Dec 18 M02 1166A 0.582 0.548 0.348 289 090 000 Up
CA-R Fm 1986 Jul 01 M02 1196 0.540 0.560 0.394 To 1986 Aug 05 291 090 000 Up
Fm 1986 Aug 05 M02 651 0.631 0.659 0.433 290 090 000 Up
CA-S Fm 1985 Dec 18 M02 1462 0.609 0.597 0.417
CO-L Fm 1987 Jan 16 A700 10032 2.339V 2.400V 2.308V 072 090 000 Up
CO-U Fm 1987 Jan 16 A700 10033 2.436V 2.396V 2.420V 056 090 000 Up
OO-W Fm 1989 Sep 13 Kelungi 2 x 10⁶
counts/g
GO-O Fm 1988 Dec 20 Kelungi 2 x 10⁶
counts/g 057
KN-A Fm 1989 Jul 04 A700 10040 1.200V 1.217V 1.221V 244 090 000 Up
KN-W Fm 1989 Jul 04 A700 10041 1.209V 1.247V 1.233V 203 090 000 Up
ME-K Fm 1989 Jul 01 M02 837 0.625 0.642 0.443 245 090 000 Up
26
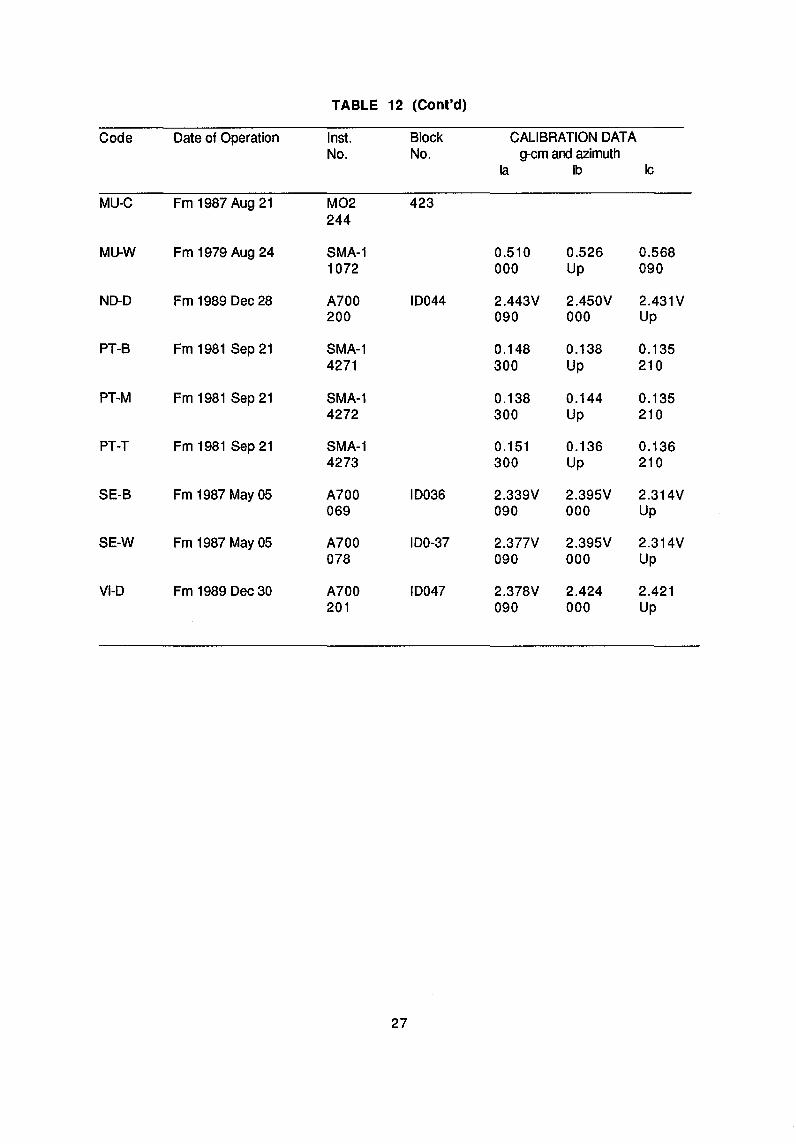
TABLE 12 (Cont'd)
Code Date of Operation Inst. Block CALIBRATION DATA No. No. g-em and azimuth
Ia Ib Ie
MU-C Fm 1987 Aug 21 M02 423 244
MU-W Fm 1979 Aug 24 SMA-1 0.510 0.526 0.568 1072 000 Up 090
ND-D Fm 1989 Dec 28 A700 ID044 2.443V 2.450V 2.431V 200 090 000 Up
PT-B Fm 1981 Sep 21 SMA-1 0.148 0.138 0.135 4271 300 Up 210
PT-M Fm 1981 Sep 21 SMA-1 0.138 0.144 0.135 4272 300 Up 210
PT-T Fm 1981 Sep 21 SMA-1 0.151 0.136 0.136 4273 300 Up 210
SE-B Fm 1987 May 05 A700 ID036 2.339V 2.395V 2.314V 069 090 000 Up
SE-W Fm 1987 May 05 A700 IDO-37 2.377V 2.395V 2.314V 078 090 000 Up
VI-D Fm 1989 Dec 30 A700 ID047 2.378V 2.424 2.421 201 090 000 Up
27

TABLE 13
ACCELEROGRAM DATA· 1990
VA MN OY UT LA,.oS LONGo E ML LOC HIE COM T(S) ACC R OUR
90 01 06 1259 30.85 117.15 2.3 CA-S 5/5 LZ 0.040 10.2 N 0.046 8.8 16.2 0.8 E 0.029 9.0
OO-W 36/36 SZ 0.030 0.4 N 0.030 0.5 0.5 E 0.030 0.3
90 01 17 0638 31.72 116.99 5.5 CA-S 110/110 SZ 0.059 1.7 N 0.059 0.5 3.4 E 0.059 2.9
LZ 0.147 2.4 27.0 N 0.059 1.6 4.9 E 0.147 4.0
CA-A 100/100 LZ 0.046 3.1 N 0.052 3.5 6.9 8 E 0.058 5.1
CA-E 90/90 PZ 0.104 2.6 N 0.129 3.0 6.3 E 0.153 4.9
SZ 0.104 1.8 10 N 0.153 2.6 7.9 E 0.153 7.2
DO-W 78/78 PZ 0.15 0.4 N 0.15 0.4 0.6 E 0.15 0.2
SZ 0.075 2.3 27 N 0.075 2.1 9.8 E 0.075 9.3
Motion transverse to the wall amplified by) MU-W 90/90 Z 0.08 9.8 a factor of 4 cf motion along it. Some ) LONGITUDINAL N 0.05 7.5 30.4>13 vertical amplification also apparent. ) TRANSVERSE E 0.08 27.8
CD-L 100/100 SZ 1.8 N 0.2 1.5 3.0 0 E 0.164 1.8
Motion transverse to wall amplified by ) CO-U 100/100 PZ 0.25 1.5 a factor of 3 cf motion along it. Motion ) N (0.2) 1.2 2.6 transverse to wall amplified by a factor of ) E (0.3) 1.8 6.8 cf that in the lower gallery. ) SZ 0.15 2.9 35
N (0.7) 4.4 13.1 E 0.13 12.3
28
TABLE 13 (Cont'd)
YR MN OY UT LA,-05 LONGo E ML LOC HIE COM T(5) ACC R OUR
90 02 02 0711 31.65 117.04 2.3 GO-O 33/33 5Z 0.035 2.1 N 0.035 2.3 4.4 0.5 E 0.035 3.2
90 03 06 2332 (unlocatable) 1.0 CA-R (close) LZ 0.035 2.1 N 0.035 2.6 6.5 0.3 E 0.035 5.6
90 03 10 0149 (unlocatable) 0.9 CA-R 5/5 PZ 0.021 0.2 (5-P = 0.655) N 0.021 0.3 0.5
E 0.021 0.3 5Z 0.029 3.8 0.2
N 0.024 3.2 5.9 E 0.018 3.1
90 05 08 1841 30.78 117.10 4.5 CA-K 8/8 PZ 0.050 15.4 (5-P = 0.9s) N 0.050 10.8 22.0
E 0.050 11.4 5Z 0.065 63.2 12
N 0.053 45.7103.8 E 0.059 68.5
CA-A 6/6 PZ 0.103 13.7 (5-P = 0.805) N 0.074 6.1 16.3
E 0.074 6.5
5Z 0.035 60.7 14 N 0.025 245.8324.9 E 0.056 203.6
(5-P - 2.0s) CA-E 15/15 PZ 0.039 4.7 N 0.10 1.6 5.1 E 0.10 1.4
5Z 0.125 12.8 14 N 0.147 14.0 36.3 E 0.145 30.9
CA-5 4/6 PZ 0.035 15.5 N 0.030 9.1 19.9
(5-P = 0.565) E 0.030 8.6 SZ 0.035 36 13 N 0* (100) E 0.035 91
LZ 0.097 58 *NS component too faint to read
90 11 20 1033 30.76 117.12 1.9 CA-K 5/7 S2 0.035 1.7 N 0.035 1.3 2.6 E 0.035 1.4
29

TABLE 13 (Cont'd)
VR MN OV lJT LA"f8 LONGoE ML LOC HIE COM T(8) ACC R OUR
90 11 20 1621 30.75 117.12 1.2 CA-K 4/6 8Z 0.035 1.7 N 0.035 1.3 2.6 E 0.035 1.4
90 12 05 0742 30.73 117.16 1.6 CA-A 2/2 8Z 0.030 3.4 N 0.030 17.6 25.4 0.4 E 0.030 18.0
YR = year MN = month OV = day lJT = universal time LAT = latitude (degrees south) LONG = longitude (degrees east) ML = Richter magnitude LOC = accelerograph location HIE = hypocentral/epicentral distance in kilometres COM = component T(8) = ground period in seconds ACC = peak ground acceleration in centimetres per second squared R = resultant acceleration in centimetres per seocond squared OUR = duration in seconds while ground acceleration remained above
3.0 centimetres per second squared () = Value inside brackets is subject to greater error than normal.
30

TABLE 14 GNANGARA • ABSOLUTE INSTRUMENTS, 1990
Used From Component Instrument Ser No. Correction
1986 Jan 01 H PVM MNS-2 8/5/Z# o nT
1986 Jan 01 D Askania 509319 0.5' Circle 580135
1986 Jan 01 Z PVM MNS-2 8/5/Z# o nT
# PVM serial number coil/magnetometer/sensor
TABLE 15 GNANGARA • INSTRUMENT COMPARISONS, 1990
Date Instrument Difference No of Obs.
IhrQygb ESQb~!lhag~n bas~liD~S 1990 Julto Nov H. PVM 8/5/Z - H.460 -1.5 ± 0.5 nT 18 1990 Julto Nov H.PVM B/5/Z - H.461 -2.4 ± 0.4 nT 6 1990 Julto Nov H.PVM B/5/Z - H.462 -0.9 ± 0.8 nT 13 1990 Oct to Dec H.PVM 8/5/Z - H.DIM 212 -1.7 ± 0.5 nT 9 1990 Oct to Dec Z.PVM B/5/Z - Z.DIM 212 -0.1 ± 0.7 nT 9 1990 Oct to Dec D.ASK 319 - D.DIM 212 -1.7 ± 0.3' 8
Ib[Qygh AMQ bas~lin~s 1990 Oct to Dec D.ASK 319 - D.DIM 212 -1.9 ± 0.3' 9 1990 Oct to Dec F.PVM B/5/Z - F.Elsec 0.5 ± 0.5 nT 10 1990 Oct to Dec I.PVM B/5/Z - I.DIM 212 0.10 ± 0.02' 10
TABLE 16 GNANGARA • AZIMUTHS OF REFERENCE MARKS
E SE SW N
Datum# Temporary Permanent Permanent Distance from 70m 30m 85m 130m Resolution 1 mm 0.05' 0.09' 0.04' 0.25'
Date Azirruth from NE Qier
1982 Aug 11 77° 23.6 150° 28.4 198° 59.0 03° 10.4 1982 Sep 20 77° 23.6 150° 28.4 198° 59.4 03° 10.6 1982 Oct 07 77° 23.6 150° 28.4 198° 59.4 03° 10.4 1983 Aug 21 77° 23.6 198° 59.3 03° 10.3 1985 Aug 21 77° 23.6 198° 59.2 03° 10.3 1987 Jan 16 77° 23.6 198° 59.2 03° 10.4 1989 Nov 24 77° 23.6 198° 53.3 03° 10.4
Adopted 77° 23.6 150° 28.4 198°59.3 03° 10.4
# Azimuth determined by Australian Survey Office. All other azimuths are relative to this value. Azimuths read from NE pier
31

TABLE 17
GNANGARA • VARIOMETER TEMPERATURE COEFFICIENTS
Used from Component Coefficient Yr Mn Dy Hr nTfC
1981 Jan 01 00 H 0.0
1981 Jan 01 00 Z 3.2 1987 Jan 16 06 Z 2.0 1988 Aug26 00 Z 1.0
TABLE 18
GNANGARA • ORIENTATION TESTS, 1990
Date Component Reference Magnet Orientation N Pole
1985 Jul 09 H 23247 nT East 0.20
South 1987 Jan 16 H 23241 nT East 0.30 South 1989 Feb 28 H 23204 nT East 0.8
0 South
1985 Jul 09 D 3°17.5' W North 0.20
West 1986 Jan 16 D 3
015.0' W North 0.1
0 West 1989 Feb 28 D 3
010.0' W North 0.2
0 West
1985 Jul 09 Z 53771 nT North 0.50
Up 1989 Feb 28 Z 53809 nT North 0.3
0 Up
TABLE 19
GNANGARA • STANDARD DEVIATION OF OBSERVATIONS
Year H Scale Value Z Scale Value D Base Value H Base Value Z Base Value nT/mm nT/mm nT(min) nT nT
1981 0.02 0.04 0.7 (0.1) 1.1 1.2 1982 0.02 0.03 1.5 (0.2) 1.4 1.7 1983 0.01 0.03 1.7 (0.25) 0.9 1.3 1984 0.02 0.04 1.4 (0.20) 1.4 1.0 1985 0.013 0.033 1.4 (0.19) 1.14 1.43 1986 0.012 0.019 1.5 (0.22) 1.06 1.87 1987 0.015 0.023 1.3 (0.20) 1.49 1.90 1988 0.014 0.025 1.8 (0.26) 1.04 1.73 1989 0.014 0.026 1.4 (0.19) 1.00 0.91 1990 0.019 0.031 1.6 (0.22) 0.89 0.89
32

TABLE 20
GNANGARA • ESCHEN HAGEN ADOPTED CONTROL VALUES, 1990
Date from VALUE REMARKS YR MN OY HR Mn
BO 90 01 01 00 00 302.5 BO 90 05 01 00 00 302.4 BO 90 05 11 00 00 302.3 BO 90 05 21 00 00 302.2 BO 90 09 01 00 00 302.1 BO 90 09 26 00 00 302.2 BO 90 10 01 00 00 302.3 BO 90 11 01 00 00 302.4 BO 90 12 10 00 00 302.3
BHt 90 01 01 00 00 23101 BHt 90 02 16 00 00 23102 BHt 90 03 01 00 00 23103 BHt 90 03 24 00 00 23104 BHt 90 03 26 00 00 23105 BHt 90 03 28 00 00 23106 BHt 90 03 03 00 00 23107 BHt 90 04 01 00 00 23108 BHt 90 05 01 00 00 23109 BHt 90 06 01 00 00 23108 BHt 90 06 11 00 00 23107 BHt 90 07 06 00 00 23108 BHt 90 07 11 00 00 23109 BHt 90 08 01 00 00 23110 BHt 90 08 16 00 00 23111 BHt 90 11 01 00 00 23110
BZt 90 01 01 00 00 53798 BZt 90 01 15 00 00 53799 BZt 90 02 06 00 00 53800 Bzt 90 03 01 00 00 53801 Bzt 90 03 07 00 00 53800 BZt 90 03 22 00 00 53799 Bzt 90 03 24 00 00 53798 BZt 90 03 26 00 00 53797 Bzt 90 04 01 00 00 53796 BZt 90 04 08 00 00 53795 BZt 90 04 13 00 00 53794 Bzt 90 04 16 00 00 53793 Bzt 90 04 28 00 00 53792 Bzt 90 05 01 00 00 53791 Bzt 90 05 08 00 00 53790 Bzt 90 05 18 00 00 53789 Bzt 90 05 25 00 00 53788 Bzt 90 06 01 00 00 53787 BZt 90 06 15 00 00 53786 Bzt 90 06 23 00 00 53785 Bzt 90 07 09 00 00 53785
33
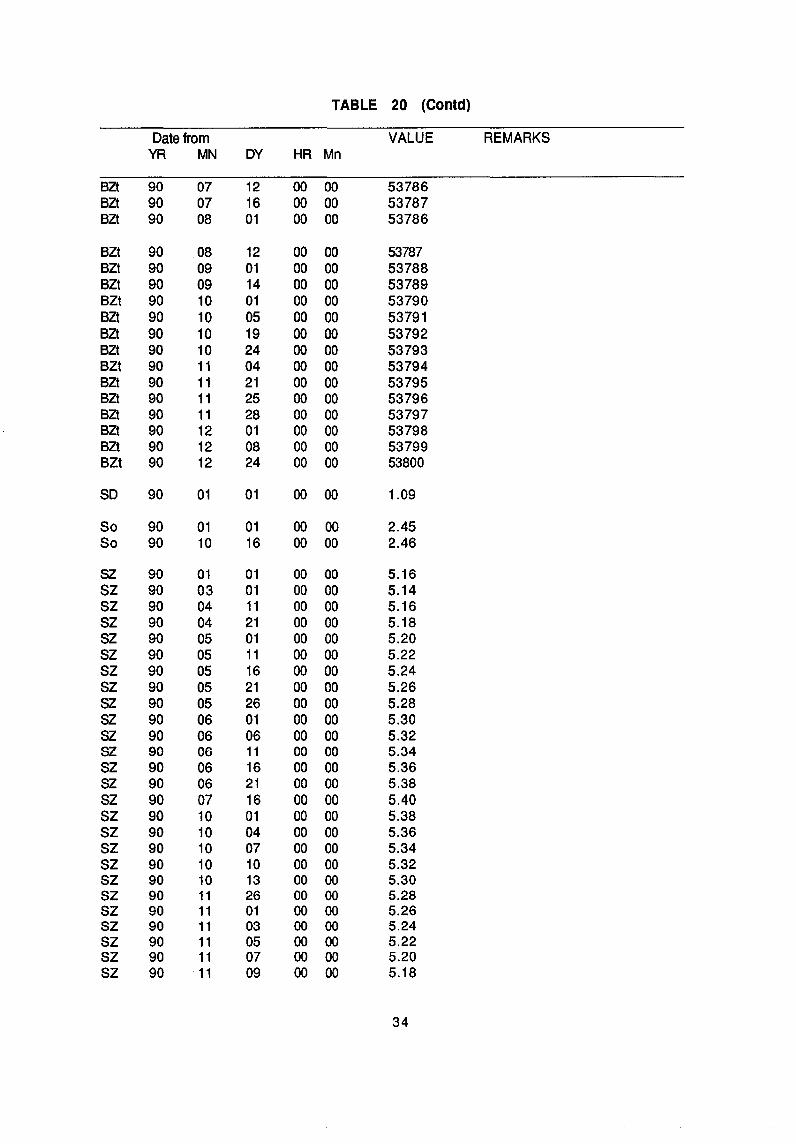
TABLE 20 (Contd)
Date from VALUE REMARKS YR MN DY HR Mn
BZt 90 07 12 00 00 53786 BZt 90 07 16 00 00 53787 BZt 90 08 01 00 00 53786
BZt 90 08 12 00 00 53787 BZt 90 09 01 00 00 53788 BZt 90 09 14 00 00 53789 BZt 90 10 01 00 00 53790 BZt 90 10 05 00 00 53791 BZt 90 10 19 00 00 53792 BZt 90 10 24 00 00 53793 BZt 90 11 04 00 00 53794 BZt 90 11 21 00 00 53795 BZt 90 11 25 00 00 53796 BZt 90 11 28 00 00 53797 BZt 90 12 01 00 00 53798 BZt 90 12 08 00 00 53799 BZt 90 12 24 00 00 53800
SO 90 01 01 00 00 1.09
So 90 01 01 00 00 2.45 So 90 10 16 00 00 2.46
SZ 90 01 01 00 00 5.16 SZ 90 03 01 00 00 5.14 SZ 90 04 11 00 00 5.16 SZ 90 04 21 00 00 5.18 SZ 90 05 01 00 00 5.20 SZ 90 05 11 00 00 5.22 SZ 90 05 16 00 00 5.24 SZ 90 05 21 00 00 5.26 SZ 90 05 26 00 00 5.28 SZ 90 06 01 00 00 5.30 SZ 90 06 06 00 00 5.32 SZ 90 06 11 00 00 5.34 SZ 90 06 16 00 00 5.36 SZ 90 06 21 00 00 5.38 SZ 90 07 16 00 00 5.40 SZ 90 10 01 00 00 5.38 SZ 90 10 04 00 00 5.36 SZ 90 10 07 00 00 5.34 SZ 90 10 10 00 00 5.32 SZ 90 10 13 00 00 5.30 SZ 90 11 26 00 00 5.28 SZ 90 11 01 00 00 5.26 SZ 90 11 03 00 00 5.24 SZ 90 11 05 00 00 5.22 5Z 90 11 07 00 00 5.20 SZ 90 11 09 00 00 5.18
34

TABLE 20 (Contd)
Date from VALUE REMARKS YR MN DY HR Mn
SZ 90 11 11 00 00 5.16 SZ 90 11 13 00 00 5.14 SZ 90 12 01 00 00 5.12 SZ 90 12 16 00 00 5.10 "a" factor = 0.00 25 nT/mmlmm
INSTRUMENT CORRECTIONS USED D 0.5' ASK 319 H OnT B/5/Z Z OnT Bl5Z
35

TABLE 21
GNANGARA AUTOMATIC MAGNETIC OBSERVATORY
REDUCTION DATA 1990
VA MN OY HR Mn VALUE REMARKS
BO 90 01 01 00 00 3° 18.6 BO 90 04 01 00 00 3 18.4 BO 90 07 00 00 00 3 19.2 BO 90 08 01 00 00 3 19.4 BO 90 11 01 00 00 3 19.6 BO 90 12 01 00 00 3 19.4
BF 90 01 01 00 00 58490 BF 90 10 01 00 00 58591
BI 90 01 01 00 00 6635.3 BI 90 03 01 00 00 6635.4 BI 90 04 01 00 00 6635.5 BI 90 07 01 00 00 6635.7 BI 90 10 11 00 00 6635.6 BI 90 10 21 00 00 6635.5 BI 90 11 16 00 00 6635.4 BI 90 12 16 00 00 6635.3
SO 90 01 01 00 00 0.0148
SF 90 01 01 00 00 0.1000
SI 90 01 01 00 00 0.00587
00 90 01 01 00 00 5000
OF 90 01 01 00 00 5000
01 90 01 01 00 00 5000
36

TABLE 22
GNANGARA - PRELIMINARY MONTHLY MEAN GEOMAGNETIC VALUES AND K-INDICES, 1990
Month D(West} H, nT Z, nT F, nT K
January 3° 07.7 23204 -53808 58598 2.48 February 06.6 198 806 594 3.02 March 06.6 185 806 589 2.65 April 06.9 173 813 590 2.80 May 06.1 187 807 590 2.06 June 05.8 195 806 593 1.75 July 05.7 199 796 585 1.56 August 05.8 177 802 582 2.28 September 05.6 192 801 587 2.17 October 06.1 200 794 584 2.13 November 05.0 212 793 587 1.74 December 04.7 216 790 586 1.78
Mean 3° 06.1 23195 53802 58589 2.19
TABLE 23 GNANGARA - GEOMAGNETIC ANNUAL MEAN VALUES, 1980-1990
(AND SECULAR VARIATION)
Year D H, nT X,nT Y,nT Z, nT F,nT Notes
1980 3° 17.8' 66° 25.7' 23409 23370 -1346 -53652 -58536 C (-2.1 ) (-3.2) (-45) (-45) (-12) (-33) (+14)
1981 19.9 28.9 364 325 -1358 685 550 D (+0.4) (-3.0) (-43) (-43) (-29) (-29) (+8)
1982 19.5 31.9 321 282 -1353 714 558 D (+0.2) (-1.8) (-27) (-27) (+3) (-16) (+4)
1983 19.3 33.7 294 255 -1350 730 562 D (+0.3) (-1.6) (-21 ) (-21) (+4) (-22) (+14)
1984 19.0 35.3 273 234 -1346 752 574 D (+1.1) (-1.7) (-15) (-15) (+8) (-20) (+13)
1985 17.9 37.0 258 219 -1338 772 587 D (+2.4) (-1.1) (-19) (-18) (+18) (-20) (+10)
1986 15.5 38.1 239 201 -1320 792 597 D (+2.0) (-0.9) (-11 ) (-10) (+13) (-14) (+09)
1987 13.5 39.0 228 191 -1307 806 606 D (+ 1.8) (-0.9) (-14) (-13) (+13) (-05) (-02)
1988 11.7 39.9 214 178 -1294 811 604 D (+3.1 ) (-0.9) (-17) (-16) (+22) (-02) (-04)
1989 08.6 40.8 197 162 -1272 813 600 0 (+2.5) (+0.1 ) (-02) (-01) (+17) (-11 ) (-41)
1990 06.1 40.7 195 161 -1255 802 589 0
Notes: C Preliminary values = Mean daily values, 10 days 0 Preliminary values = Mean daily values, 5 days
37

Used From
1986 Nov 30 1986 Nov 30 1986 Dec 31
Data Set
1986 Nov 1986 Nov 1986 Nov
1987 Jan-Oct 1987 Jan-Dec
1988 Mar-Dec 1988 Jan-Dec
TABLE 24
LEAR MONTH • ABSOLUTE INSTRUMENTS 1990
Component Instrument Serial No. Correction
D DIM E801/201 0 I DIM E801/201 0 F PPM Elsec E770/189 0
TABLE 25
LEAR MONTH • TEMPERATURE
Component
x y Z
x z
x z
COEFFICIENTS 1990
Temperature coefficient nTfC
0.77 0.04
-0.65
0.682 -0.506
0.563 -0.498
Adopted values from yr mm dd
1986 11 26
1986 11 26
1986 11 26
hr
00
00
00
x y
Z
38
0.6
0.0
-0.5

TABLE 26
LEAR MONTH • ADOPTED CONTROL VALUES, 1990
YR MN DY HR Mn VALUE
ex 90 01 01 00 00 29505 ex 90 03 01 00 00 29504 ex 90 03 16 00 00 29503 ex 90 05 01 00 00 29504 ex 90 05 16 00 00 29503 ex 90 06 01 00 00 29502 ex 90 06 11 00 00 29501 ex 90 06 21 00 00 29500 ex 90 07 01 00 00 29499 ex 90 07 11 00 00 29498 ex 90 07 21 00 00 29497 ex 90 08 01 00 00 29496 ex 90 08 11 00 00 29495 ex 90 08 21 00 00 29494 ex 90 09 01 00 00 29495 BX 90 09 04 00 00 29496 ex 90 09 07 00 00 29497 ex 90 09 10 00 00 29498 ex 90 09 13 00 00 29499 ex 90 09 16 00 00 29500 ex 90 09 19 00 00 29501 BX 90 09 22 00 00 29502 ex 90 10 21 00 00 29503 ex 90 10 26 00 00 29504 ex 90 11 01 00 00 29505 ex 90 11 06 00 00 29506 ex 90 11 11 00 00 29507 ex 90 11 16 00 00 29508
ey 90 01 01 00 00 183 ey 90 06 11 00 00 181 ey 90 06 21 00 00 179 BY 90 09 01 00 00 180 ey 90 10 01 00 00 181
ez 90 01 01 00 00 44409 ez 90 02 01 00 00 44408 ez 90 03 01 00 00 44407 ez 90 05 21 00 00 44406 ez 90 05 26 00 00 44405 BZ 90 06 01 00 00 44404 ez 90 07 11 00 00 44403 BZ 90 07 21 00 00 44402 BZ 90 08 01 00 00 44401 BZ 90 09 06 00 00 44402 BZ 90 09 11 00 00 44403 ez 90 09 16 00 00 44404 ez 90 09 21 00 00 44405
39

TABLE 26 (Contd)
YR MN DY HR Mn VALUE
BZ 90 09 26 00 00 44406 BZ 90 11 16 00 00 44407 BZ 90 11 21 00 00 44408 BZ 90 11 26 00 00 44409 BZ 90 12 01 00 00 44410 BZ 90 12 16 00 00 44411
SX 90 01 01 00 00 0.1968 SX 90 03 01 00 00 0.1966 SX 90 09 01 00 00 0.1964 SX 90 10 01 00 00 0.1962 SX 90 11 01 00 00 0.1960 SX 90 12 01 00 00 0.1968
SY 90 01 01 00 00 0.2000 SY 90 05 01 00 00 0.2005 SY 90 06 01 00 00 0.2010 SY 90 09 01 00 00 0.2000 SY 90 09 06 00 00 0.1990 SY 90 09 11 00 00 0.1980
SZ 90 01 01 00 00 0.1948 SZ 90 09 01 00 00 0.1946
OX 90 01 01 00 00 4999 OX 90 02 01 00 00 4998
OY 90 01 01 00 00 4998 OY 90 02 01 00 00 4997 OY 90 06 01 00 00 4998
OZ 90 01 01 00 00 5063 OZ 90 04 21 00 00 5062 OZ 90 06 01 00 00 5061 OZ 90 06 03 00 00 5060 OZ 90 06 05 00 00 5059 OZ 90 06 07 00 00 5058 OZ 90 06 09 00 00 5057 OZ 90 06 11 00 00 5056 OZ 90 06 13 00 00 5055 OZ 90 06 14 00 00 5054 OZ 90 06 15 00 00 5053 OZ 90 06 16 00 00 5052 OZ 90 06 17 00 00 5050 OZ 90 06 18 00 00 5048 OZ 90 06 19 00 00 5046 OZ 90 06 20 00 00 5044 OZ 90 06 21 00 00 5042 OZ 90 06 22 00 00 5040 OZ 90 06 23 00 00 5038 OZ 90 06 24 00 00 5036
40

TABLE 26 (Contd)
YR MN DY HR Mn VALUE
OZ 90 06 25 00 00 5034 OZ 90 06 26 00 00 5032 OZ 90 06 27 00 00 4030 OZ 90 06 28 00 00 5028 OZ 90 06 29 00 00 5026 OZ 90 06 30 00 00 5024 OZ 90 07 01 00 00 5022 OZ 90 10 01 00 00 5021 OZ 90 12 01 00 00 5020 OZ 90 12 11 00 00 5019 OZ 90 12 21 00 00 5018
41

TABLE 27 LEARMONTH - STANDARD DEVIATION OF OBSERVATIONS 1990
Year Scale Values Base Values Zero Values nT/oount nT nT
X Y Z X Y Z X Y Z
1987 0.00035 0.0023 0.00013 2.27 2.63 1.72 0.5 1.4 0.6 1988 0.00023 0.0012 0.00018 2.27 2.59 2.46 0.5 0.5 0.5 1989 0.00034 0.0017 0.00031 1.89 2.90 2.25 0.7 0.4 0.4 1990 0.00027 0.0016 0.00030 0.26 0.49 0.75 0.6 0.2 2.1
TABLE 28 LEARMONTH - PRELIMINARY MONTHLY MEAN GEOMAGNETIC VALUES
AND K-INDICES1990
Month D(West) H,nT Z,NT F, nT
January 00 29.9 29521 -44443 53354 -56 24.4 February 00 30.1 29510 -44447 53351 -56 25.1 March 00 29.4 29504 -44448 53349 -5625.5 April 00 29.5 29500 -44448 53346 -5625.7 May 00 29.0 29515 -44442 53350 -5624.7 June 00 28.6 29503 -44441 53343 -5625.2 July 00 28.3 29516 -44432 53342 -56 24.3 August 00 28.0 29507 -44433 53338 -5624.8 September 00 28.2 29515 -44435 53344 -56 24.4 October 00 28.1 29527 -44434 53349 -56 23.7 November 00 27.8 29537 -44428 53351 -5623.0 December 00 27.6 29537 -44431 53254 -5623.1
Mean 00 28.7 29516 -44439 53348 -5624.5
TABLE 29
LEAR MONTH - GEOMAGNETIC ANNUAL MEAN VALUES (AND SECULAR CHANGES),1987-1990
Year D H,nT X,nT Y,nT Z, nT F,nT Notes
1987 -00°37.4' -56°25.6' 29483 29481 -321 -44421 53314 (+ 1.0) (-0.2) (+ 1) (+ 1) (+9) (-7) (+6)
1988 -0036.4 -56 25.8 29484 29482 -312 -44428 53320 (+2.1) (-0.4) (-3) (-3) (+18) (-5) (+4)
1989 -0034.3 -56 26.2 29481 29479 -294 -44433 53324 (+5.6) (+1.7) (+35) (+36) (+48) (-6) (+24)
1990 -0028.7 -56 24.5 29516 29515 -246 -44439 53348
42

TABLE 30
ROUTINE DISTRIBUTION OF GEOMAGNETIC DATA
Weekly K-indices
Gnangara Ionospheric Prediction Service for distribution to their recipients
Monthly K-Indices
Gnangara
BMR, Canberra *1
IPS, Sydney *
WDC A, Washington *
WDC C1, Denmark *
WDC C2, Kyoto *
Observatory de Ebro
Institute de Physiques * du Globe
Learmonth
BMR, Canberra
Data Published
Rapid Variations
*1
*
*
*
*
*2
Principal Storms
*1
*
*
*
Preliminary Magnetogram Mean Values 16mm copy
*1
*
*1
1 . Geophysical Observatory Report, Bureau of Mineral Resources, Geology and Geophysics
2. IAGA Bulletin, Geomagnetic data
43
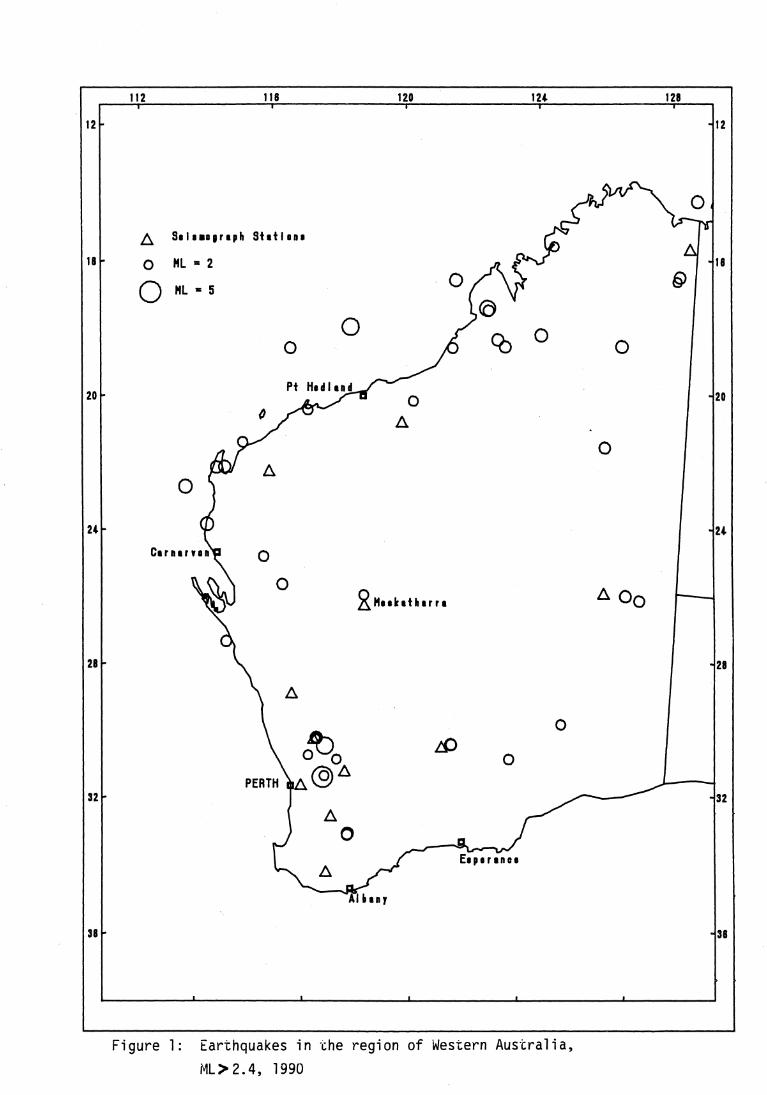
112 lIB 120 IU 128
121- -112
18 ~
,.l
2J
28 t-
32l
3al
l:l. Slla.Dlraph Stltl.n.
0 HL = 2 o /\~-V o HL" 5
0 £ CO 0 0 0
Pt ....-a 0
l:l.
0 l:l.
0
..,..,
0
0 R HI. kit h • r r I l:l. 00
" l:l.
0 1:0
0 PERTH~ @D.
~ l:l.
0 ~
E. per Inee
~ AlhnJ
Figure 1: Earthquakes in the region of Western Australia, f~L>2.4, 1990
, -118
~
, -120
iU
128
132
-138
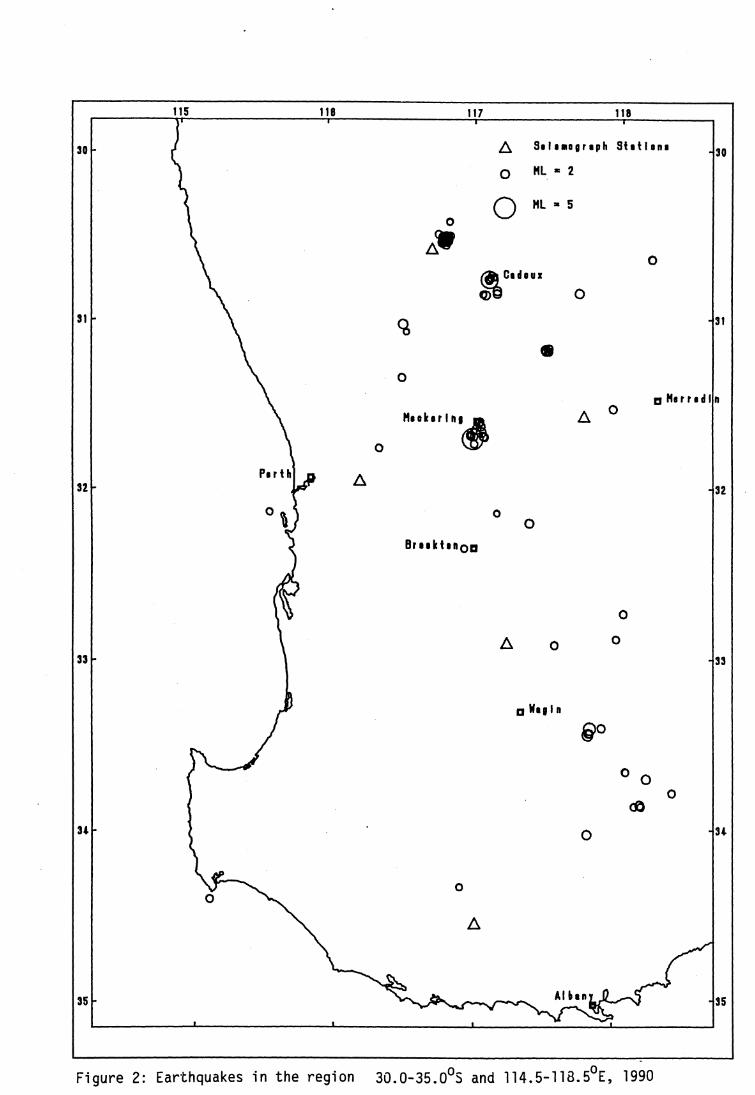
118 117 118
30 6, SI'UOlrlph Sht' Inl 30
0 HL • 2
0 HL • 5 0
6,-0
~ e,hu 0
31 31
• 0
Hili kIF' h '<f 6, 0
0
a H. r rid' n
32 6,
32
0 0
Brllktlhoa
0
0 0
33 33
a N'g' n
~o
o 0 0
d)
u 0 34.
35
Figure 2: Earthquakes in the region 30.0-35.0°5 and 114.5-118.50 E, 1990

/=/C;~E --=-
ISOSEISMAL MAP OF THE MECKERING EARTHQUAKE, WESTERN. AUSTRALIA 17 JANUARY 1990
,,~"..,' N!S'-' /"'"7~' /,.,~' ~~, ~--------~------~~-----------------r------------------'--------------------'i~e~'
. ,.. ....... "' .. a
•
c---~ f 3 "\ 4rlC4~.
"' :5 ..
5 ., ~3 4.4 4S .,.
. ., 4 ... ..f.
410 ~~Ilil'""''''' '''' ~.6 ~ .5.. .. 4J t ~ ,(,. V) 14
'-./ " .. ·'i3 4-... .. f \I ..,
...
, II
a.' 91 W;f~AI
e$·urt+-.u c:ACt~
y /' ,.
_ 3~/
ALII"""""
~~'
32-'" ,
.u"Q,'
:-, ____ --~:-~::~~~~-------------L-----------------L----------------~13~~.' DATE: 17 JANUARY 1990 TI~1E : MAGNITUDE: EPICENTRE: DEPTH:
• IV 4 o
06 38 08.2 5.5 Mb (MUN) 0 31.72 S, 116.99 E 6km
EPICENTRE ZONE INTENSITY DESIGNATION EARTHQUAKE FELT 0.11>1) EARTHQUAKE NOT FELT
t> .:&bOle...,
;1.4/ vY '" / ee
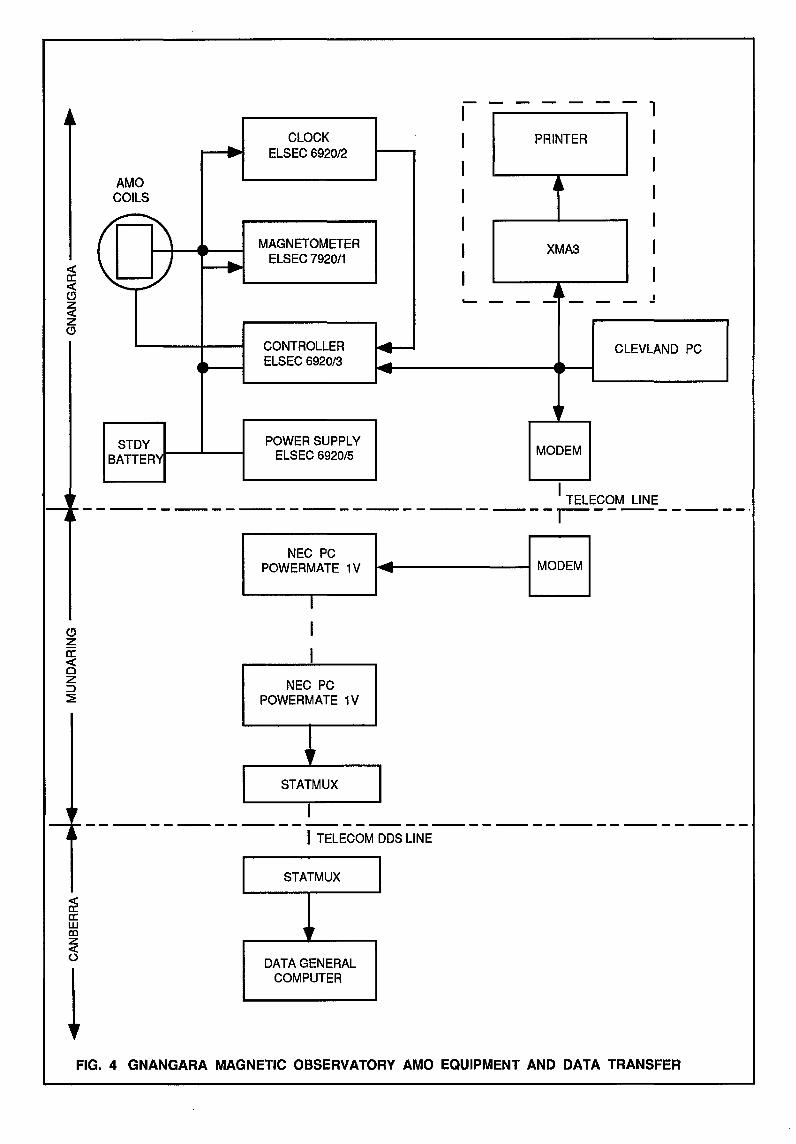
<C a: <C C!J
~ z C!J
------, CLOCK I PRINTER I .. ELSEC 6920/2 - I I
AMO ~~ I COILS I
/A\ I I
( MAGNETOMETER I XMA3 I .. ELSEC 792011
\.~ -- I I '-- - - ..J l_ - - J
CONTROLLER ... CLEVLAND PC --ELSEC 6920/3 ... --"
STDY POWER SUPPLY BATTERy ELSEC 6920/5 MODEM
I TELECOM LINE -----------------------r---------'
NEC PC POWERMATE 1V
I
NEC PC POWERMATE 1V
" STATMUX I
... --
I TELECOM DDS LINE
STATMUX
DATA GENERAL COMPUTER
MODEM
FIG. 4 GNANGARA MAGNETIC OBSERVATORY AMO EQUIPMENT AND DATA TRANSFER

FLUXGATE
CHART RECORDER
W&W
DIGITAL CLOCK
MAGNETOMETER ~----~ ~--"-4~
PRINTER TTY 43 EDAS FM 105B
EDAS2 CASSETTE RECORDER
CALIBRATOR
DIGITAL .1..-_____ ... THERMOMETER
DORIC 41 OAT
1--__ -1 MAGNETOMETER.+--~ ELSEC 595
* PROPOSED UPGRApE
NEC PC POWERMATE IV
* CASSETTE TAPE TRANSFER TO DATA GENERAL AT SMR CANBERRA
DISC TRANSFER OR DIAL-UP SYSTEM TO MUNDARING (SEE FIGURE 7)
FIG. 5 LEARMONTH MAGNETIC OBSERVATORY· EQUIPMENT AND DATA TRANSFER

HORIZONTAL INTENSITY
24000 1\ / r- "'" " ./ " "'-L.---.-' '\
\ \
23500 \ \ ~
23000 1920 1930 1940 1950 1960 1970 1980 1990
DECLI NAT ION -5 30'
-4 30' I---
-3 30' \ ~ / ~ ---- ...-
-2 30' 1920 1930 1940 1950 1960 1970 1980 1990
_ 54000 VERTICAL INTENSITY TOTAL INTENSITY 59000
FV
~ ""'" .L,... ~Z ---~ V
-53000 // ~
58000
Z//' F
./ 'i" ~/
-52000 7 57000
1920 1930 1940 1950 1960 1970 1980 1990
Figure 6 Geomagnetic Annual mean values at Gnangara 1919 - 1990
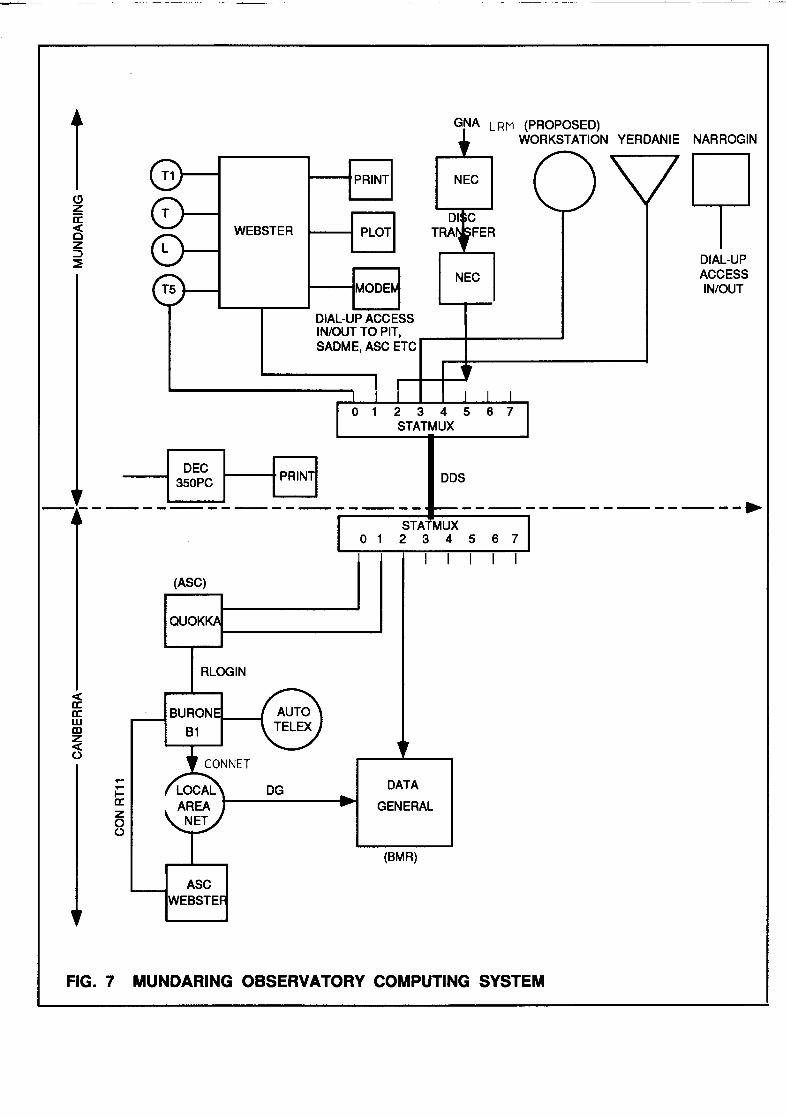
< a: a: w m z < 0
~
~
I-a: z 0 0
I DEC ~OOPC
WEBSTER
1----+ PRINT
I-----t PLOT
I------IMODE
DIAL-UP ACCESS INIOUT TO PIT, SADME, ASC ETC
IPR1N1
GNA LRM (PROPOSED)
NEC
NEC
DDS
WORKSTATION YERDANIE NARROGIN
DIAL-UP ACCESS IN/OUT
--------------.-STATMUX
o 1 2 3 4 5 6 7
I I I I I (ASC)
QUOK
RLOGIN
DG DATA
GENERAL
(BMR)
ASC WEBSTE
FIG. 7 MUNDARING OBSERVATORY COMPUTING SYSTEM