bura.brunel.ac.uk€¦ · Web viewUnderstanding handwriting difficulties: A comparison of...
46
Understanding handwriting difficulties: A comparison of children with and without motor impairment Mellissa PRUNTY a & Anna L. BARNETT b a Brunel University London, Uxbridge, Middlesex, UB8 3PH, U.K. b Oxford Brookes University, Gipsy Lane, Oxford, OX3 0BP, U.K. Department Clinical Sciences, [email protected] 1
Transcript of bura.brunel.ac.uk€¦ · Web viewUnderstanding handwriting difficulties: A comparison of...

Understanding handwriting difficulties: A comparison of children with and without motor
impairment
Mellissa PRUNTY a & Anna L. BARNETT b
a Brunel University London, Uxbridge, Middlesex, UB8 3PH, U.K.b Oxford Brookes University, Gipsy Lane, Oxford, OX3 0BP, U.K.
Department Clinical Sciences, [email protected]
1
Understanding handwriting difficulties: A comparison of children with and without motor
impairment
The nature of handwriting difficulties have been explored in children with specific
developmental disorders. The aim of this study was to investigate the nature of handwriting
difficulties in children with dysgraphia, a less studied group who have significant handwriting
difficulties in the absence of motor control or cognitive difficulties. The performance of a
dysgraphia group aged 8-14 years was compared to a group with Developmental Coordination
Disorder and to typically developing (TD) controls. Participants completed two handwriting
tasks on a digitizing writing tablet. The amount and accuracy of the handwriting product was
measured, plus various temporal and spatial features of the writing process. There were no
significant differences in performance between the two groups with handwriting difficulties but
both performed more poorly than the TD group. Individual differences in the type and severity
of handwriting impairments suggest the need for a range of classroom assessments to tailor
intervention appropriately.
Keywords: dysgraphia; writing; handwriting speed, pausing, DCD
.
2

Introduction
The skill of handwriting is an important gateway to academic success (Graham, Berninger,
Weintraub & Schafer, 1998) as it supports participation in the classroom and provides a
valuable source of self-esteem in children (Engel-Yeger, Nagauker-Yanuv, & Rosenblum,
2009). It is a complex skill, often referred to as ‘language by hand’ (Berninger, Abbott, Abbott,
Graham, & Richards, 2002), which reflects the complex integration of cognitive and motor
processes which underpin the task (Van Galen, 1991). As such, handwriting skill takes time to
develop (Graham et al, 1998; Barnett, Henderson, Scheib, & Schulz, 2007). Initially, correct
letter formation (including size and shape) are taught in the classroom (5-6 years) (Department
for Education [DfE], 2013) followed by an emphasis on speed and fluency later on (8-9 years of
age) (DfE, 2013). The development of handwriting speed in particular plays an important role in
the overall task of writing, as the number of words produced per minute has been found to
predict compositional quality in both typically (Graham, Berninger, Abbott, Abbott, &
Whitaker, 1997; Puranik & Otaiba, 2012) and atypically developing children (Sumner,
Connolly & Barnett, 2014; Connelly, Dockrell, Walter, & Critten, 2012; Prunty, Barnett,
Wilmut, & Plumb, 2016). Therefore, if a child has difficulties with aspects of handwriting
performance such as speed and/or legibility, it can significantly hamper progress in the
classroom and lead to academic underachievement (Graham, Harris, & Fink, 2000).
According to Van Hartingsveldt et al (2011) up to 27% of school aged children
experience difficulties with handwriting. Handwriting difficulties are varied in their presentation
and may be explained by a range of factors. Van Galen’s (1991) psychomotor model of
handwriting can provide a useful lens for considering handwriting difficulties in children, as it
describes the range of cognitive and motor processes involved in the skill. At the top level Van
Galen (1991) refers to higher-level cognitive processes including attention (activation of the
intention to write) and language (semantic retrieval and syntactical construction). These
processes have been linked to poor handwriting in children with various developmental
disorders including Attention Deficit Hyperactivity Disorder (ADHD) (Adi-Japha et al, 2007;
Rosenblum, Epsztein, & Josman, 2008) and Specific Language Impairment (SLI) (Connelly et
al, 2012; Connelly & Dockrell, 2015). In children with SLI for example, language ability was
found to constrain handwriting speed and fluency (Connelly et al, 2012; Connelly & Dockrell,
2015) as they produced fewer words per minute and paused for longer during writing compared
to typically developing peers.
3

Below the levels of language Van Galen (1991) describes the process of spelling. This
can be programmed in two ways; through the mapping of phoneme-to-grapheme (sound to
letter) rules or through knowledge of spelling a familiar word (orthographic representations)
(Miceli & Capasso, 2006; Rapp, Purcell, Hillis, Capasso, & Micelli, 2016). Indeed spelling
difficulties, found in children with dyslexia, have been linked to poor handwriting performance.
Sumner et al (2013) found that children with dyslexia produced fewer words per minute
compared to typically developing peers. By analysing the location of writing pauses, Sumner et
al (2013) revealed that the dyslexic group had a tendency to pause within misspelled words,
which impacted on their handwriting speed. However, the notion of spelling as a constraint on
handwriting also applies to typically developing individuals where word-structure has been
found to mediate the kinematics of handwriting (Kandel, Soler, Valdois, & Gros, 2006). For
example the process of phoneme to grapheme mapping can constrain handwriting speed
(Kandel et al, 2006) as can the number of syllables in a word (Lambert, Kandel, Fayol, &
Esperet, 2008). It is therefore apparent that language and spelling are important components to
consider when examining handwriting difficulties in children as these factors alone can
constrain performance.
According to Van Galen’s model (1991) there are three motor processes involved in
handwriting production. The first is the selection of the allograph1 which according to Van
Galen’s model refers to the activation of the motor program (retrieval of an action pattern from
long-term motor memory) and the selection of the type of script (joined, un-joined, capital
letters, small letters). Following this, the parameterisation process occurs under size control
where the size, speed and spacing of allographs are programmed (Van Galen, 1991). This is
followed by recruitment of muscle synergies which results in the real time movement of the pen
(Van Galen, 1991). These three motor processes (selection of allograph, size/speed control,
muscular adjustment) are complex in nature, and any one may be associated with handwriting
difficulties. One population known for their difficulties with motor skill are children with
Developmental Coordination Disorder (DCD) (APA, 2013). DCD is the term used to describe
children who have motor coordination difficulties which are unexplained by a general medical
condition, intellectual disability or neurological impairment (APA, 2013). They commonly
present with slow and poorly formed handwriting (Rosenblum & Livneh-Zirinski, 2008; Prunty
et al, 2014; 2015) and have a tendency to pause for a greater percentage of writing tasks
compared to typically developing peers (indicating a lack of automatization) (Prunty et al.,
2014). They also produce a higher percentage of errors during the process of letter formation
1 In the literature the term ‘allograph’ is used in different ways including to describe the visual (non-motor) representation of a letter (Teulings, 1996). The present study uses Van Galen’s (1991) definition.
4

including incorrect starting position and inaccuracy in the number, direction and sequence of
letter strokes (Prunty et al, submitted). These difficulties appear to straddle the three motor
processes in Van Galen’s model.
Van Galen’s model is useful in outlining the processes involved in the skill of
handwriting and, as outlined above, how these are impacted by cognitive or motor impairments
associated with developmental disorders. However, teachers also commonly report handwriting
difficulties in children in the absence of motor or cognitive impairment and these have been
referred to by some as ‘dysgraphia’ (Smits-Engelsman & Schoemaker., 2017; Di Brina, Niels,
Overvelde, Levi, & Hulstijn, 2008; Rosenblum et al, 2003; Dohla & Heim, 2015). This term is
not formally described in either of the international classification systems, DSM-5 or ICD-10
but the literal translation of the Greek term is ‘bad writing’, which includes handwriting,
spelling and written expression. While ‘dysgraphia’ has been used by some to describe children
with spelling difficulties (e.g. Miceli & Capasso, 2006), many have used the term to denote
children with handwriting difficulties (e.g. Smits-Engelsman & Schoemaker., 2017; Di Brina,
Niels, Overvelde, Levi, & Hulstijn, 2008; Rosenblum et al, 2003; Dohla & Heim, 2015) and that
is the focus of the current paper. Studies which have focussed on handwriting performance in
children with dysgraphia reported difficulties such as slow and illegible handwriting with a
tendency to pause during writing (Rosenblum et al, 2003). Although this seems very similar to
features of handwriting in DCD, no study has directly compared handwriting performance
across these groups. Smits-Engelsman & Schoemaker (2017) found no differences between a
DCD and ‘dysgraphia’ group on a drawing task, in which children copied a series of patterns
from a computer screen as quickly and accurately as possible. Although both groups had slower
movement velocity, a smaller trajectory length and were less accurate than typically developing
controls, the DCD and ‘dysgraphia’ groups did not differ from each other. However, the results
may be quite different for a handwriting task involving the production of language by hand. In
previous research, distinctions between the handwriting difficulties of children with different
developmental disorders suggest different approaches to intervention for these groups. In the
same vein, further investigation of those with dysgraphia is needed to inform tailored
interventions for these children.
While previous studies tend to focus on group findings, the heterogeneity of groups is
acknowledged and it is recognised that individual differences may be masked (Sugden &
Chambers, 2007). Moreover, handwriting difficulties can take various forms, as mentioned
above and children may have different profiles of proficiency across various temporal and
spatial measures of handwriting performance (e.g. letter accuracy, legibility, pausing and overall
speed). Therefore, the main aim of this study was to examine handwriting performance in
5

children with dysgraphia (handwriting difficulties), compared to children with DCD (general
motor difficulties) and a typically developing control group using tools commonly used by
teachers and health professionals in an attempt to tap into the motor processes outlined in Van
Galen’s (1991) model. Measures of the handwriting product (speed and legibility) were
supplemented with more detailed temporal aspects (process measures) of performance across
two handwriting tasks. Group analyses were supplemented with an examination of individual
performance profiles within and across the three groups.
Method
Two groups of children with handwriting difficulties were included, a Dysgraphia and DCD
group. Handwriting difficulties were determined by scores either below the 15th percentile on
the Detailed Assessment of Speed of Handwriting (DASH) (Barnett et al, 2007) indicating slow
handwriting, or below average on the Handwriting Legibility Scale (HLS) (Barnett, Prunty &
Rosenblum, 2013).
Participants
Twenty eight children with handwriting difficulties were recruited to the study ranging from 8
to 14 years of age. For 14 of these children their handwriting difficulties were accompanied by
a diagnosis of Developmental Coordination Disorder (DCD) (14 boys), the remaining 14 had
handwriting difficulties with no significant motor impairment (Dysgraphia Group). There was a
third group of 14 typically developing children (TD group) with neither handwriting difficulties
nor movement difficulties. All three groups were age and gender matched in the study. The
recruitment procedure for each group is outlined below.
Dysgraphia Group
This group was recruited through local primary and secondary schools. Teachers were asked to
use their professional judgement to identify children with handwriting difficulties without
motor, reading/spelling difficulties and without intellectual impairment. The children were also
individually tested on the Movement Assessment Battery for Children 2nd edition Test (MABC-
2 Test; Henderson et al, 2007), British Picture Vocabulary Scale 2nd edition (BPVS-2, Dunn,
Dunn, Whetton, & Burley, 1997) and the reading and spelling components of the British Ability
Scales 2nd Edition (BAS-II; Elliott, 1996). Children in this group had a MABC-2 score above the
15th percentile and standard scores above 85 on the BPVS and reading/spelling measures
indicating performance within the expected range. None had a diagnosis of dyslexia.
6

DCD Group
The children with DCD were recruited from a database of children previously assessed and who
met the formal diagnostic criteria from the Diagnostic and Statistical Manual of Mental
Disorders, 5th edition (DSM-5; APA, 2013). The children had significant motor difficulties, with
performance below the 10th percentile (13 were below the 5th, 1 below the 10th) on the MABC-2
(Henderson et al, 2007). These difficulties had a significant impact on their activities of daily
living, as reported by their parents and evident on the MABC-2 Checklist (Henderson et al,
2007). A developmental, educational and medical history was taken from the parents, which
confirmed that there was no history of neurological or intellectual impairment and no medical
condition that might explain the motor deficit. The BPVS-2 (Dunn et al, 1997) was used to give
a measure of receptive vocabulary, which correlates highly with verbal IQ (Glenn &
Cunningham, 2005). This was in at least the average range (above a standard score of 85) for all
children. The Strengths and Difficulties Questionnaire (SDQ; Goodman, 1997) was also used to
note any other behavioural difficulties reported by the parent, which commonly occur with
DCD such as attention deficit hyperactivity disorder (ADHD) (Miller, Missiuna, Macnab,
Malloy-Miller, & Polatajko, 2001). The parent interviews revealed that no children had been
given a diagnosis of ADHD from a health professional. The children were also assessed on the
reading and spelling components of the BAS-II. None had a diagnosis of dyslexia.
Typically Developing (TD) Control Group
Teachers in local primary and secondary schools were asked to use their professional judgement
to identify children without any handwriting, motor, or reading/spelling difficulties and without
intellectual impairment. To ensure the children identified were free of these difficulties, they
were individually tested on the MABC-2 Test, BPVS-2 and the reading and spelling
components of the BAS-II. Children were included in the control group if they scored at least at
the typical level expected for their age on all measures.
7

Exclusion criteria
Children from all groups with a diagnosis of dyslexia, and/or those who had English as a second
language were excluded from the study. Children who had a reported physical, sensory or
neurological impairment or who were born before 35 weeks gestational age were also excluded.
This was to ensure that handwriting difficulties could not be attributed to other disorders. See
Table 1 for performance profiles of all groups.
INSERT TABLE 1 ABOUT HERE
Table 1
Mean (SD) age and scores for Dysgraphia (D), DCD and TD groups on selection measures
Selection MeasuresD
n=14
DCD
n=14
TD
n=14 p
Age in years
MABC-2 Test percentiles:
Total Test score
Manual Dexterity component
BPVS-2 Standard Score
BAS-II Spelling Standard Score
BAS-II Reading Standard Score
10.55 (1.77)
32.00 (21.15)
36.21 (24.60)
105.43 (11.3)
104.00 (12.78)
113.80 (9.48)
10.61 (1.82)
6.41 (8.12)
7.42 (9.14)
111.21 (17.44)
100.36 (10.58)
113.71 (11.04)
10.47 (2.00)
48.28 (26.32)
55.85 (30.92)
106.77 (12.79)
112.21 (10.11)
121.86 (11.60)
.981
<.001*
<.001*
.532
.023*
.101
DCD<D<TD
DCD<D<TD
DCD=D; D=TD;
DCD<TD
*p≤ .050. MABC-2: Movement Assessment Battery for Children test component. BPVS-2: British Picture Vocabulary
Scale, BAS-II: British Ability Scale
8

Assessments:
The Detailed Assessment of Speed of Handwriting (DASH; Barnett et al, 2007)
The DASH is a standardised handwriting speed test with UK norms for 9 to 16 year olds. It is
commonly used among teachers and health care professionals to identify children with
handwriting difficulties (Blank et al, 2012). In this study two tasks from the DASH were
implemented, alphabet writing and free writing. The demands of both tasks were deemed
acceptable for use with children aged 8 years as they align with practice in the classroom and
have been successfully used in our previous work (Prunty et al, 2013; 2014), they are outlined
below.
Alphabet Writing: The participants wrote the alphabet repeatedly from memory as fast as
possible for one minute. They were instructed to write it in the correct order using lower case
letters, making sure that every letter was readable.
Free-writing: The participants wrote on the topic of ‘my-life’. A spider diagram, offering
different writing suggestions, was presented prior to writing, in order to elicit ideas from the
child. The content of their writing was not assessed, but they were instructed to try and write
continuously over a 10-minute period using their everyday handwriting. They were first given
one minute to think of some ideas before writing. No instructions were given regarding writing
style and children used their usual way of writing. In the UK there is no single, prescribed
writing style; some schools teach fully joined (‘cursive’) from the start but a semi-joined script
is most common and this was reflected in our sample.
Performance on these two tasks was scored and analysed in various ways, as described in the
‘data analysis’ section below.
The Handwriting Legibility Scale (HLS; Barnett, Prunty and Rosenblum, 2013)
The HLS examines five different components of handwriting legibility including global
legibility (overall readability of the text on first reading), effort to read the script, layout on the
page, letter formation and alterations to writing (attempts made to rectify written work). The
HLS is applied retrospectively to the DASH free-writing task. Each component is scored on a
scale of 1 to 5 with 1 representing good performance and 5 representing poor performance.
9
Each component is summed to give a total score for legibility with total scores ranging from 5
to 25, with higher scores reflecting poorer legibility. Inter-rater reliability and internal
consistency have been reported to be high (α=.92 in each case), with all components loading on
just one factor. The total HLS score for each group is recorded. The analysis involving the HLS
is described below.
Apparatus
When completing the two DASH tasks the participants wrote with an inking pen on paper
placed on a Wacom Intuos 4 digitising writing tablet (325.1mm x 203.2 mm) to record the
movement of the pen during handwriting. The writing tablet transmits information about the
spatial and temporal data of the pen as it moves across the surface. The data were sampled at
100 Hz via a laptop computer. Eye & Pen version 2 (EP2) software (Alamargot, Chesnet,
Dansac, & Ros, 2006) was used to analyse the tablet data.
Measures
From the above assessments, a range of measures were obtained, aligned as closely as
possible with the motor processes from Van Galen’s (1991) model. Although these do not
provide a pure measure of each process, they indicate how commonly used clinical tools can be
used to begin to examine different components of the model. .
Motor Process 1: Selection of the Allograph
Quality of Letter Formation
According to Van Galen (1991) the first stage in the motor aspect of handwriting is the selection
of the allograph. Using Van Galen’s definition of an allograph we examined this process across
the three groups. To do so, we examined the quality of letter form production, as this might
reflect incomplete (or erroneous) knowledge about the proper form of the allograph. The
participants completed the alphabet task from the DASH (Barnett et al, 2007) (described above).
The alphabet was chosen as it would naturally facilitate an examination of each of the individual
letter forms required for handwriting. Using EP2’s video function which allows for the replay of
handwriting production in real time on a laptop, the alphabet task was initially played and
replayed in slow motion. The video was paused if needed to allow for accurate coding of the
process. In the UK children may be taught different handwriting styles which include variations
10

of joined or un-joined letterforms, so the coding in this study only focused on incorrect
letterforms and directions that the children would not be taught in the school system regardless
of style.
The quality of letter formation was examined using the following codes.
(1) Letter stroke in wrong direction: This occurred in letters that ‘looked’ appropriate on
paper but when replayed revealed incorrect letter stroke directions. An example of this
was a clockwise rather than anti-clockwise direction when forming the letter ‘a’ or ‘o’.
(2) Incorrect start place: this occurred if a letter started in a position that would not be
taught. An example of this includes the letters ‘r’, ‘n’ or ‘i’ starting at the baseline rather
than at the top of the letter.
(3) Letters with missing strokes: this occurred if a letter was missing a required stoke. An
example of this includes the letters ‘t’ and ‘f’ without the cross stroke or ‘r’, ‘n’, ‘u’
completed with one stroke rather than two.
(4) Letters with added strokes: this occurred through over-writing on a letter. An example of
this is repeating strokes already formed.
(5) Letter reversals: This occurred if a letter was formed in the opposite direction. An
example of this is the letter ‘b’ appearing as ‘d’.
The percentage of letters in the alphabet task with formation errors were calculated and reported
for each group. The inter-rater reliability for this measure is .89 as reported previously in Prunty
& Barnett (submitted).
Motor Process 2: Size/Speed Control
The second motor process outlined in Van Galen’s (1991) model is size control, which refers to
the parameterisation of the allograph. This is where the size, speed and spacing of allographs are
programmed.
Size & Spacing
To examine letter size and spacing we used two measures of legibility on the free-writing task
including the HLS total score (as described above) and the percentage of illegible words
11

identified using the instructions from the DASH manual. The HLS score takes into account an
overview of both letter size and spacing while the percentage of illegible words provides an
additional word level analysis. While issues with legibility may be attributed to difficulties in
other areas (i.e the level of the allograph - quality of letter forms) we made the assumption
based on Di Brina et al’s (2010) findings that parameterisation including poor spacing and size
could also contribute to legibility issues. In their study they reported that difficulties with letter
spacing were independent of the difficulties observed in letter form production (Di Brina et al,
2010).
Handwriting Speed
To examine the speed of handwriting the scoring instructions from the DASH manual were
applied to the 10 minute free-writing task. The number of words per minute were averaged over
the 10-minute period. Indeed the number of words per minute is a frequently used measure of
handwriting speed in the literature on writing (Connelly et al, 2012; Sumner et al, 2013).
Motor Process 3: Muscular Adjustment & Real-Time Trajectory of Pen
The final stage described in Van Galen’s model is thought to represent the recruitment of
muscle synergies and the real-time movement of the pen. We examined this process through the
temporal aspects of performance measured using the digitizing writing tablet (as described
above) and the EP2 software (Almargot, Chesnet, Dansac, & Ros, 2006). In particular, we
examined execution speed to explore muscular adjustment and writing pauses to explore any
interference with the real-time trajectory.
The following variables obtained from EP2 were ascertained for the alphabet and free-writing
tasks:
1. Execution speed (cm/sec): The speed of the pen when it is in contact and moving on the
page. This does not include when the pen is pausing on the page.
2. Pause duration (% of writing time): The percentage of time during the task where the
pen was either off the page (in-air pause), or halted on the page (on paper pause). A
pause was defined as three successive digital samples without movement (a halt >30
ms) (Almargot et al, 2006). This threshold has been used by other researchers in the
case of handwriting in dyslexia, speech and language impairments and in typically
developing populations (Sumner et al, 2013, Connelly et al, 2012, Almargot et al,
2006). It is the minimum threshold available with the EP2 software and is thought to
capture all writing events.
12

Individual Performance Profiles
In order to ascertain whether the children in the dysgraphia and DCD groups were performing
more poorly than TD peers on handwriting measures, the mean and standard deviation from the
TD group was used to denote typical or average performance. The number of standard
deviations from the TD mean was calculated to demonstrate the severity of difficulties in the
dysgraphia and DCD groups in comparison to TD peers. This was calculated for the following
measures:
(1) Speed: Number of words per minute on the free writing task
(2) Legibility: Total score of the HLS
(3) Percentage of pausing on the free-writing task
(4) Percentage of errors in letter formation on the alphabet task
Initially the numbers and percentages of participants who were poor on each measure (at least
below 1 SDs of the TD mean) were calculated. A common cut-off to determine poor
performance on a measure is more than one standard deviation from the mean (Cascio,
Alexander & Barrett, 1988). This was then extended across the measures to ascertain the
number and percentage of participants who were poor on two and three measures.
Procedure
The study was approved by the University Research Ethics Committees at Oxford Brookes
University and Brunel University London. Parents were required to sign a consent form and
children were asked to either assent (below 11 years), or countersign the parent consent form
(over 11 years).
The handwriting component of this study took place over one 60-minute session. Each child met
with the first author and completed the reading, spelling and handwriting tasks. The sessions
were completed either at the child’s home, school or at Oxford Brookes University or Brunel
University London. During the handwriting tasks the children were seated at a height adjustable
table and chair, with knees positioned at approximately 90 degrees. The participants were
invited to manoeuvre the tablet to a position that was comfortable for them when writing.
13

Data Analysis
Group Differences
To examine group differences on a range of handwriting measures, one-way ANOVAs and (or
non-parametric equivalent) were used. Significant group effects were broken down using
pairwise comparisons. An ANCOVA was used with age as a co-variate on handwriting speed
and pausing measures due to the relationship between these variables and age and the wide age-
range of participants. Two-way mixed ANCOVAs were used to examine group differences
across handwriting execution speed. Significant main effects and interactions were broken down
using post-hoc tests and simple main effects respectively. For all analyses, significance levels
were set at .05, with Bonferroni corrections used to control for multiple comparisons.
Correlations
Partial bivariate correlations (controlling for age) were also conducted to examine the
relationship between reading/spelling/vocabulary/motor skills with the handwriting measures
(quality of letter formation, handwriting speed, legibility and pausing). The correlations were
calculated for each group separately and for all participants together.
Results
Motor Process 1: Selection of the Allograph
The quality of letter formation
Kruskal-Wallis H tests showed that there was a significant effect of group in the percentage of
errors in letter production produced (χ2(2) = 7.37, p = .025) (mean rank 21.39 for dysgraphia,
27.82 for DCD, 15.29 for TD). Mann Whitney U tests (with Bonferroni corrections) revealed
that the dysgraphia group (U = 42.25. Z = -2.56, p =.010) performed significantly below the TD
group but did not differ from the DCD group (U = 65.0. Z = -1.52, p =.129) (see Table 2).
Motor Process 2: Size/ Speed Control
Size & Spacing
14

Handwriting Legibility Scale
There was a significant effect of group for performance on the HLS (χ2(2) = 22.96, p < .001)
(mean rank 27.61 for dysgraphia, 28.18 for DCD, 8.71 for TD). The TD group demonstrated
significantly better performance on the HLS compared to the dysgraphia (U = 14.0. Z = -3.87, p
< .001) and DCD (U = 3.00. Z = -4.38, p < .001) groups which did not differ from each other
(U = 96.5. Z = -0.69, p = .945).
Percentage of Illegible Words
Kruskal-Wallis H tests showed that there was a significant effect of group in the percentage of
illegible words produced in the DASH free-writing task (χ2(2) = 22.72, p < .001) (mean rank
27.21 for DCD, 28.18 for dysgraphia, 9.11 for TD). Mann Whitney U tests (with Bonferroni
corrections) revealed that the TD group performed significantly better than both the dysgraphia
(U = 7.50. Z = -4.44, p < .001) and DCD (U = 15.0. Z = -4.14, p < .001) groups which did not
differ from each other (U = 95.0. Z = -1.38, p = .890) (see Table 2).
Handwriting Speed
One-way ANCOVAs (group x writing task with age as covariate) revealed no significant effect
of group for the alphabet task, as the three groups produced a similar number of letters during
the one minute task (F[2,38] = 1.92, p=.160, η2=.092). The covariate, age, was significantly
related to the number of letters produced in the alphabet task (F[1,38] = 7.55, p<.009, η2=.166).
On the free-writing task there was a significant effect of group for the number of words written
(F[2,38] = 3.50, p=.040, η2=.156). Pairwise comparisons indicated that the TD group produced
a higher number of words per minute compared to the dysgraphia (p=.032) and DCD groups
(p=.024) who did not differ from each other (p=.910). The covariate, age, was significantly
related to the number of words produced (F[2,38] = 14.48, p<.001, η2=.276). See Table 2 for
group means.
INSERT TABLE 2 ABOUT HERE
15

Table 2
A comparison of the handwriting performance measures (mean (SD) or median) for the
Dysgraphia (D), DCD & TD groups
Measures Dysgraphia
n=14
DCD
n=14
TD
n=14
Handwriting Product
Alphabet (lpm)
Free-Writing (wpm)*
HLS (total score)*
% illegible words*
Handwriting Process
Execution speed cm/sec
Alphabet
Free-writing
Percentage of Pausing
Alphabet
Free-writing *
Percentage of errors
in letter production
Alphabet *
41.07 (23.28)
12.43 (3.83)
16.57 (3.61)
4.98 (4.53)
2.63 (1.02)
2.85 (.61)
60.74 (9.08)
61.20 (7.15)
13.79 (8.94)
42.93 (16.17)
12.34 (4.22)
17.64 (4.10)
6.55 (8.22)
2.46 (.82)
2.67 (.63)
56.94 (9.44)
62.19 (8.66)
24.38 (18.30)
52.57 (15.66)
15.38 (4.48)
9.57 (2.06)
.001 (.005)
2.74 (.73)
2.64 (.61)
58.28 (9.08)
53.52 (8.70)
9.63 (5.37)
TD> (D=DCD)
TD< (D=DCD)
TD< (D=DCD)
TD< (D=DCD)
TD< (D=DCD)
wpm= words per minute, lpm= letters per minute, *p≤ .050.
Motor Process 3: Muscular Adjustment & Real-Time Trajectory of Pen
Execution Speed:
The execution speed (the speed of the pen when it is in contact and moving on the page) for
both groups averaged between 2-3 cm/s in both tasks. A two-way mixed ANCOVA (Group x
Writing Task) was used to examine group differences across the two tasks. The co-variate age
was significantly related to execution speed F[1,38]=14.61, p< .001, η2=.278. There was no
effect of group (F[2,38]=.389, p=.681, η2=.020), indicating that the three groups performed in a
similar way. There was also no effect of task F(1, 38)=2.38, p=.131, η2=0.59 (df corrected for
violation of sphericity with a Greenhouse-Geisser correction).
16

Pausing Percentage
There was no group effect for the percentage of pausing on the alphabet task (F[2,38]= .599,
p=.554, η2 =.031). However, there was a significant group effect for the free writing task
(F[2,38]= 4.93, p=.012, η2 =.206). Pairwise comparisons indicated that the dysgraphia (p=.016)
and DCD (p=.007) groups spent a significantly longer percentage of time pausing than their TD
peers but did not differ from each other (p=.735) (See Table 2).
Performance profiles across the handwriting measures
Tables 3 and 4 show the individual performance profiles of children in the Dysgraphia and DCD
groups respectively. It can be seen that, within each group, children differ both in the severity of
impairment and in the pattern of performance across the measures. Comparing the frequency of
difficulties on the handwriting measures between the DCD and D groups using Chi-square tests
of independence revealed no significant group differences. Based on 1SD, 7/14 (50%)
participants in the dysgraphia group had difficulties with handwriting speed, and 5/14 (36%)
participants in the DCD group (χ2(2) = .667, p=.717). On the HLS 11/14 (79%) in the
dysgraphia group were above (indicating poor performance) 1SD and 12/14 (86%) children in
the DCD group (χ2(2) = .377, p=.828). For the percentage of pausing, 7/14 (50%) children in the
dysgraphia group were below their TD peers (showing greater pausing) and 9/14 (64%) in
children with DCD (χ2(2) = 1.74, p=.420). For the percentage of errors in letterform production
an equal number of children in the DCD and dysgraphia groups 9/14 (64%) were at least 1SD
below their TD peers on this measure (χ2(2) = 1.66, p=.435).
In relation to the severity of difficulties, Chi-square tests of independence revealed no
significant group differences. For example for the quality of letter formation while 5/14
(35%) children in the DCD group appeared to score between 3-9 SDs below the TD
group mean compared to 2/14 (14%), this was not significant (χ2(3) = 3.21, p=.360).
Results Across Measures
Out of the 14 children with DCD 12/14 (86%) were poor on at least two measures with
4 of them (29%) scoring below 1SD on all four measures followed by 3 (21%) across
three measures. Only two (14%) children with DCD scored within the TD range on all
17

measures. Similar profiles emerged in the dysgraphia group with 11/14 (79%) poor on
at least two measures, 4/14 (29%) on four and 2/14 (14%) on three. Tables 3 and 4
indicate the performance profiles of the DCD and dysgraphia groups on the four
measures.
Table 3
Performance profiles of children with Dysgraphia across four measures
TD Mean (SD)9.63
(5.37)15.38(4.48)
9.07(2.06)
53.52 (8.70)
ParticipantProcess
% errors in letter
formationa
Speed(wpm)
Legibilitya
(HLS)Process
% pausinga
37 -1 -1 -2 0
08 +2 -1 +4 +2
10 +1 +1 +3 0
124 +3 -2 +3 +1
133 +1 0 +2 +1
144 -2 0 +2 0
45 +1 0 +2 +1
46 +1 -1 +2 +1
147 +1 +1 +1 -1
48 -1 -2 +1 0
49 +1 -2 +2 +2
51 0 0 +1 +1
156 -1 0 0 0
118 +3 -1 0 -1
Note. 0= Within 1 SD of the TD mean, a positive SD indicates performance below TD group
18

Table 4Performance profiles of children with in the DCD group across four measures
TD Mean (SD)
9.63(5.37)
15.38(4.48)
9.07(2.06)
53.52 (8.70)
ParticipantProcess
% errors in letter formationa
Speed(wpm)
Legibilitya
(HLS)Process
% pausinga
02 +6 -1 +3 +2
05+8 +1 +3 -1
15+7 -1 +7 +1
180 0 +1 +1
19+1 0 +1 +1
20+1 0 +2 0
28+1 -1 +1 +1
24+1 0 +1 +1
30-1 +2 0 -1
39+9 -2 +2 +1
330 0 +2 +2
410 -1 +2 0
42-1 0 -1 -1
53+3 0 +1 +1
Note. 0= Within 1 SD of the TD mean, a positive SD indicates performance below TD group
19

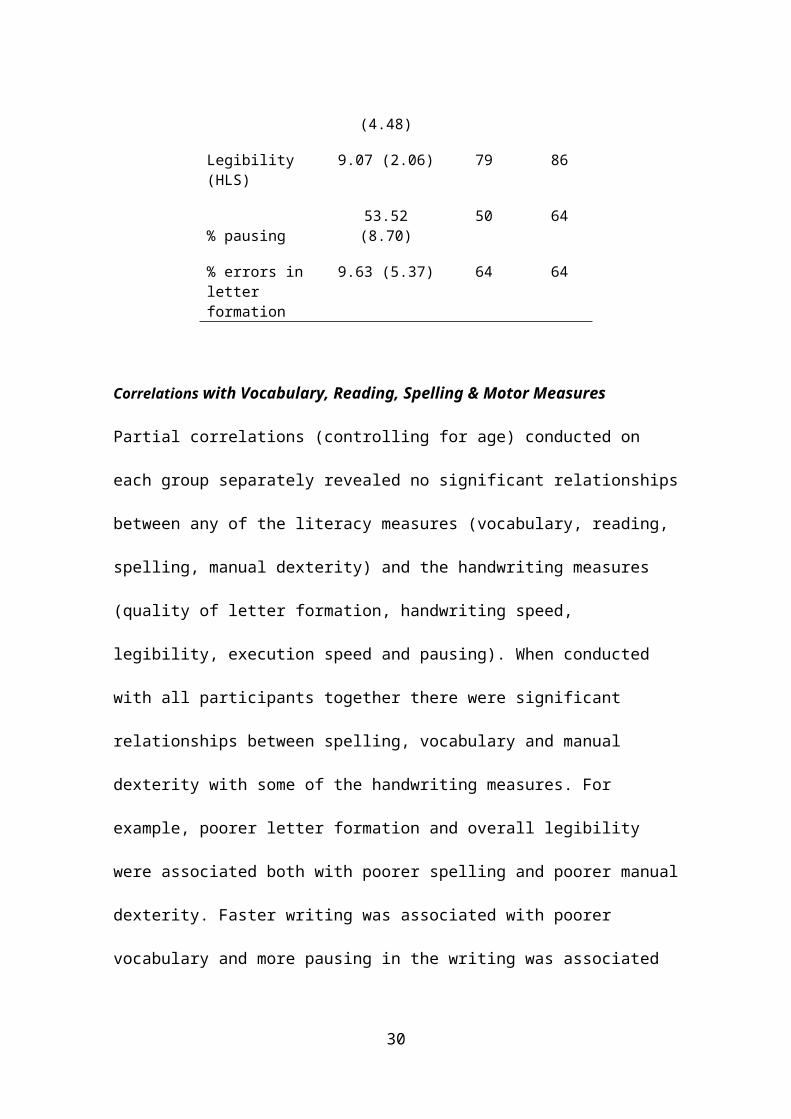
Table 5
Percentage of children in the Dysgraphia and DCD groups with scores below 1 SD of TD group
mean.
Measure TD mean (SD)%
Dysgraphia%
DCD
Speed (wpm) 15.38 (4.48) 50 36
Legibility (HLS) 9.07 (2.06) 79 86
% pausing 53.52 (8.70) 50 64
% errors in letter formation
9.63 (5.37) 64 64
Correlations with Vocabulary, Reading, Spelling & Motor Measures
Partial correlations (controlling for age) conducted on each group separately revealed no
significant relationships between any of the literacy measures (vocabulary, reading,
spelling, manual dexterity) and the handwriting measures (quality of letter formation,
handwriting speed, legibility, execution speed and pausing). When conducted with all
participants together there were significant relationships between spelling, vocabulary
and manual dexterity with some of the handwriting measures. For example, poorer letter
formation and overall legibility were associated both with poorer spelling and poorer
manual dexterity. Faster writing was associated with poorer vocabulary and more
pausing in the writing was associated with poorer manual dexterity, vocabulary and
spelling. There were no significant correlations with reading ability (see Table 6).
20

Table 6
Correlations between reading, spelling, vocabulary and manual dexterity with the
handwriting measures (n=42).
Reading Spelling Vocabulary Manual Dexterity
Measure r p r p r p r p
MeasuresQuality of letter formation(% incorrect letterforms)Free-writing (wpm)HLS Total Score (1-25)a
Execution speed (cm/sec)% pausing on Free-writing
-.309
.079-.276.123-.099
.067
.648
.103
.477
.565
-.383
.322-.397.155-.361
.021*
.056.017*.367.031*
-.033
-.409.261-.093.367
.846
.013*.125.590.028*
-.351
.262-.658-.112-.399
.036*
.123<.001*
.515.016*
Note. *p≤ .050, wpm= words per minute, HLS=Handwriting Legibility Scale, aHigher
scores on HLS reflect poorer legibility
Discussion
Previous research on handwriting has focused on identifying performance deficits in groups of
children with different developmental disorders (Adi-Japha et al, 2007; Rosenblum et al, 2008;
Sumner et al, 2014; Connelly et al, 2012, Prunty et al, 2013). However, there are many children
who have significant handwriting difficulties in the absence of specific developmental disorders
(Smits-Engelsman & Schoemaker., 2017; Di Brina et al, 2008; Rosenblum et al, 2003; Dohla &
Heim, 2015). Often referred to as dysgraphia, this particular group causes concern to teachers
and can severely impact on progress for the children. While work has been done on
understanding handwriting difficulties in atypically developing children, this particular group
has not received as much attention in the literature. As a consequence, it is unclear how they
differ from other groups of children and how best to support them in school.
Using a range of measures accessible to health and educational professionals to help
understand different aspects of performance we examined handwriting in children with
dysgraphia compared to children with and without DCD. In doing so we took into consideration
additional factors that might impact on handwriting performance such as motor coordination,
language, reading and spelling skill. Our findings generally reflect those of Smits-Engelsman
and Schoemaker (2017) who compared the performance of children with dysgraphia and DCD
21

on a drawing task and found no group differences. This pattern held for the comprehensive
range of measures used in our study, examining aspects of both the product and process of
handwriting, considering both temporal features and the quality/accuracy of letter formation.
This was an interesting finding as none of the children in the Dysgraphia group had a significant
motor difficulty, all with scores above the 16th percentile on the MABC-2 (and scores on the
Manual Dexterity component in the average range for their age). It seems that despite the
extensive range of measures used in this study we were unable to clearly distinguish between
the dysgraphia and DCD groups. Both the DCD and Dysgraphia groups displayed difficulties
across the range of measures in comparison to the TD controls including handwriting speed,
legibility and the handwriting process measures (pausing and letter formation).
The three motor processes outlined in Van Galen’s (1991) model serve as a useful lens
for discussion as we used the model as a framework for investigation. However, as there are no
clinical tools specifically designed to assess each of these, we attempted to align our clinical
assessments to this model. We recognise that there are limitations to this as while the measures
align to some degree with the motor processes outlined by Van Galen (1991), the alignment is
not perfect and each measure probably reflects processing at several levels. Nonetheless the
first process examined was the selection of the allograph which we evaluated through studying
the quality of letter formation in real-time. We considered that poor letter formation might
reflect poor knowledge about the proper form of the allograph. Previous studies such as Di
Brina et al (2010) reported inaccuracy of letter formation using single letters in children with
dysgraphia. However in the current study we were interested in identifying letters across the
alphabet that were formed in a way that would not be taught in schools. Interestingly the DCD
and Dysgraphia groups had an equal percentage of children with difficulties in this area (64%).
As such, it would appear that both groups align with previous descriptions of poor writers where
a higher percentage of inaccurate letter forms were reported compared to TD peers (Di Brina et
al, 2010; Smits-Engelsman & Van Galen, 1997). However, it is difficult to speculate on the
underlying mechanisms for this issue in both groups as while deficits in motor sequence
learning and procedural learning may be an issue in the DCD group (Bo & Lee, 2013; Wilson et
al, 2003), this has yet to be examined in children with dysgraphia. Indeed the considerable
variation in performance on this measure adds another layer of complexity as while some
children appeared to be more severely affected than others (3-9 SDs below TD group mean),
there were five children in both groups who did not appear to have any difficulties on this
measure. However the allograph is only one level of analyses. According to Di Brina et al
(2010) the inaccuracy of letterforms reported in their dysgraphia group was independent of
difficulties with size control (in their case trajectory length and velocity). As such, the process
22

of size control (parameterisation) which was the second area of consideration in this study may
provide more insight.
To examine the motor process of size/speed control we used measures of handwriting
speed and legibility. Size control here refers to the parameterisation of the motor programme
where the size, speed and spacing of allographs are programmed (Van Galen, 1991). Looking at
the individual data it seems that both the Dysgraphia and DCD groups demonstrated significant
difficulties with parameterisation evident through a high percentage of children in each group
with difficulties on the HLS. The HLS examines aspects of legibility including the size and
spacing within and between words. Pending the correct sequencing of strokes at the allograph
level, paramaterisation would be a key factor which could impact on global legibility as
measured by the HLS. Interestingly, both groups had difficulties with handwriting speed as
measured through the number of words produced per minute. However, many factors could
contribute to this finding including higher level cognitive processes such as planning (Berninger
& Swanson, 1994) and as such it may not be exclusively an issue with motor processing.
Looking at the individual data on handwriting speed, 50% of the Dysgraphia group had
difficulties compared to 36% in the DCD group. However this difference was not significant.
The issue of heterogeneity within the groups was again apparent and it remains unclear why
some children within either group had difficulties writing quickly while others did not.
The final motor process in Van Galen’s model (1991) is the recruitment of muscle
synergies which results in the real time movement of the pen. While physiological examinations
of muscle activation and recruitment (i.e. electromyography/biofeedback) were beyond the
scope of this study, we examined the execution speed of the pen and the percentage of pausing
during writing to identify slowness and dysfluency in the real time movement of the pen.
Interestingly both the Dysgraphia and DCD groups did not differ from the TD group on
execution speed indicating that they were able to move the pen as quickly as their peers.
However both the DCD and Dysgraphia groups paused for a greater percentage of the task
indicating some dysfluency in the movement of the pen. According to Smits Engelsman and
Van Galen (1997) this motor process includes muscular initiation which can be impacted by
neuromotor noise in children with handwriting difficulties. While we did not consider the
control of movement beyond measures of manual dexterity and execution speed of the pen, an
examination at this level could help differentiate between children with dysgraphia and DCD.
Indeed Smits-Engelsman et al (1997) suggested that poor writers are unable to adapt their fine
distal musculature movements to the demands of an accurate handwriting task. Furthermore, it
has been hypothesised that children with handwriting difficulties are unable to apply effective
biomechanical strategies such as ‘stiffness’ to reduce neuromotor noise (Van Galen et al, 1993;
23

Van Galen & De Jong, 1995). According to Smits-Engelsman and Wilson (2013) neuromotor
noise involves unpredictable fluctuations and disturbances during movement which can have a
neural, neuromuscular, or environmental origin. The inability to apply movement strategies to
counteract noise in the system may result in crude movements which according to Van Galen et
al (1993) have an impact on the quality of handwriting. These crude movements described by
Van Galen (1993) align with the idea that poor writers resort to using the wrist or the elbow as
pivots of action. This may result in larger movements which are not conducive to accurate
performance on a task such as handwriting (Engelsman & Van Galen, 1997). However, while
there are some hypotheses in the literature surrounding neuromotor noise and the biomechanical
influences these were outside the scope of this study. Further research is needed to investigate
the process of muscular adjustment in more detail to examine possible differences between
handwriting difficulties in dysgraphia and DCD.
A limitation of this study was the relatively small sample size which may have
impacted on power and overall null group differences. If supported in larger studies, these
findings suggest that it may be helpful to include other groups of children such as those with
dyslexia and Specific Language Impairment, to begin to understand the nature of handwriting
difficulties in these different groups. Full diagnostic assessment is important to differentiate the
groups and should include a range of literacy and motor measures which may impact on
handwriting production. Although our samples were too small to identify any significant
relationships between measures within each of the groups, some significant correlations were
found when we considered all groups together. For example, better manual dexterity scores and
better spelling scores were each associated with better letter formation/legibility and less
pausing during writing. This seems to reflect the importance of manual dexterity and spelling
ability to aspects of handwriting production. Some other correlations are more difficult to
interpret and need further investigation. A further limitation of our work is that, while we
applied Van Galen’s (1991) model as a framework for investigation, our clinical measures were
not specifically designed to tap into these processes. Nonetheless the extensive range of
measures used allowed us to gain greater insight into the heterogeneity and presentation of
handwriting difficulties in children with dysgraphia. The within-group variability found across
the measures showed that no one assessment was able to capture every child with a handwriting
difficulty. This suggests that in both research and clinical practice a range of measures need to
be included to more fully understand handwriting profiles. In addition, one area that was not
considered in this study was the influence of external factors such as the way in which
handwriting is taught in the schools of the participants and the amount of handwriting practice
they engaged in (Molyneaux et al, 2013; Smits Engelsman & Van Galen, 1997). These are
24

societal based factors which were outside the scope of this study but do warrant further
investigation.
In summary, our examination of handwriting performance in children with dysgraphia
spanned across the three motor processes of Van Galen’s (1991) model and found that children
in this group had difficulties in all three areas. Further work needs to be done to understand
these processes in more detail as despite poor performance at a group level on all of our clinical
measures, the individual variability within and across the measures illustrates the complex
nature of handwriting difficulties. The results advance our knowledge of handwriting
difficulties in children with dysgraphia but more research is needed in order to understand the
underlying mechanisms of their difficulties. Further research needs to unpick the motor
processes in more detail to aid in the provision of evidence for planning future interventions in
this group.
Acknowledgements
We would like to thank all of the participants, their families and the schools who took part in
this study.
25

References
Adi-Japha, E., Landau, Y., Frenkel, L., Teicher, M., Gross-Tsur, V., & Shalev, R. (2007).
ADHD and dysgraphia: underlying mechanisms. Cortex, 43(6), 700-709.
Alamargot, D., Chesnet, D., Dansac, C., & Ros, C. (2006). Eye and Pen: a new device to study
reading during writing. Behaviour Research Methods, Instruments and Computers, 38(2),
287-299.
American Psychiatric Association (APA). (2013). DSM-5. Diagnostic and Statistical Manual of
Mental disorders (5th ed.). Washington: American Psychiatric Association.
Barnett, A., Henderson, S., Scheib, B., & Schulz, J. (2007). The Detailed Assessment of Speed
of Handwriting. London: Harcourt Assessment.
Barnett, A., Prunty, M., & Rosenblum, S. (June, 2013). Development of the handwriting
legibility scale (HLS): an examination of reliability and validity. Paper presented at the
International Graphonomics Society Conference, Nara, Japan.
Berninger, V., Abbott, R., Abbott, S., Graham, S., & Richards, T. (2002). Writing and reading:
connections between language by hand and language by eye. Journal of Learning
Disabilities, 35, 39-56.
Berninger, V., & Swanson, L. (1994). Modifying Hayes & Flower's model of skilled writing to
explain beginning and developing writing. In E. Butterfield (Ed.), Children's writing:
Toward a process theory of development of skilled writing (pp. 57-81). Greenwich, CT:
JAI Press.
Bo, J., Colbert, A., Lee, C., Schaffert, J., Oswald, K., & Neill, R. (2014). Examining the
relationship between motor assessments and handwriting consistency in children with and
without probable developmental coordination disorder. Research in Developmental
Disabilities, 35(9), 2035-2043.
Blank R, Smits-Engelsman, B., Polatajko, H., Wilson, P. (2012). European Academy for
Childhood Disability (EACD): recommendations on the definition, diagnosis and
intervention of developmental coordination disorder (long version). Developmental
Medicine and Child Neurology,54(1), 54-93.
Cascio, W. F., Alexander, R. A., & Barrett, G. V. (1988). Setting cutoff scores: Legal,
psychometric, and professional issues and guidelines. Personnel Psychology, 41(1), 1-24
Connelly, V., & Dockrell, J., (2015). The role of oral language in underpinning the text
generation difficulties in children with specific language impairment. Journal of
Research in Reading, 38(1), 18–34.
26

Connelly, V., Dockrell, J., Walter, K., & Critten, S. (2012). Predicting the quality of
composition and written language bursts from oral language, spelling and
handwriting skills in children with and without specific language
impairment. Written Communication, 29, 278-302.
Department for Education (DfE). (2013). The national curriculum in England. Retrieved March
2017, from, https://www.gov.uk/government/collections/national-curriculum
Di Brina. C., Niels, R., Overvelde, A., Levi, G., & Hulstijn, W. (2008). Dynamic time warping:
a new method in the study of poor handwriting. Human Movement Science, 27(2), 242-
255.
Dohla, D., & Heim, S. (2015). Developmental dyslexia and dysgraphia: what can we learn from
the one about the other? Frontiers in Psychology, 6, 2045.
Dunn, L., Dunn, L., Whetton, C., & Burley, J. (1997). The British Picture Vocabulary Scale (2nd
ed.). London: NFERNelson Publishing Company Ltd.
Elliot, C. (1996). British ability scales (II): Administration and scoring manual. London: NFER
Nelson Publishing Company Ltd.
Engel-Yeger, B., Nagauker-Yanuv, L., & Rosenblum, S. (2009). Handwriting performance,
self-reports, and perceived self-efficacy among children with dysgraphia. American
Journal of Occupational Therapy, 63, 182-192.
Glenn, S., & Cunningham, C. (2005). Performance of young people with Down syndrome on
the Leiter-R and British picture vocabulary scales. Journal of Intellectual Disability
Research, 49, 239-244.
Goodman, R. (1997). The strengths and difficulties questionnaire: A research note. Journal of
Child Psychology and Psychiatry, 38, 581-586.
Graham, S., Berninger, V., Abbott, R., Abbott, S., & Whitaker, D. (1997). Role of mechanics in
composing of elementary school students: A new methodological approach. Journal of
Educational Psychology, 89, 170-182.
Graham, S., Berninger, V., Weintraub. N., & Schafer, W. (1998). Development of handwriting
speed and legibility in grades 1-9. The Journal of Educational Research. 92(1), 42-52.
Graham, S., Harris, K., & Fink, B. (2000). Is handwriting causally related to learning to write?
Treatment of handwriting problems in beginning writers. Journal of Educational
Psychology, 92, 620–633.
Henderson, S., Sugden, D., & Barnett, A. (2007). Movement Assessment Battery for Children
(2nd ed.). (Movement ABC-2). Examiner’s Manual. London: Pearson Assessment.
Kandel, S., Soler, O., Valdois, S., & Gros, C. (2006). Graphemes as motor units in the
acquisition of writing skills. Reading and Writing, 18, 313-337.
27

Lambert, E., Kandel, S., Fayol, M., & Esperet, E. (2008). The effect of the number of syllables
when writing poly-syllabic words. Reading & Writing: An Interdisciplinary Journal, 21,
859–883.
Miceli, G., & Capasso, R. (2006). Spelling and dysgraphia. Cognitive Neuropsychology, 23(1),
110-134.
Miller, L., Missiuna, C., Macnab, J., Malloy-Miller, T., & Polatajko, H. (2001). Clinical
description of children with developmental coordination disorder. Canadian Journal of
Occupational Therapy, 68, 5–15.
Molyneaux, A., Barnett, A., Glenny, G. & Davies, R. (June, 2013). The Association between
Handwriting Practice and Lexical Richness: An Analysis of the Handwritten Output of
Children aged 9 - 10 years. Paper presented at the International Graphonomics Society
Conference, Nara, Japan.
Puranik, C. S., & Al, Otaiba, S. (2012). Examining the contribution of handwriting and spelling
to written expression in kindergarten children. Reading and Writing: An
Interdisciplinary Journal, 25, 1523–1546.
Prunty, M., & Barnett, A. (submitted). Accuracy and consistency of letter formation in children
with Developmental Coordination Disorder, Journal of Learning Disabilities.
Prunty, M., Barnett, A., Wilmut, K., & Plumb, M. (2013). Handwriting speed in children with
developmental coordination disorder: Are they really slower? Research in
Developmental Disabilities, 34(9), 2927-2936.
Prunty, M., Barnett, A., Wilmut, K., & Plumb, M. (2014). An examination of writing pauses in
the handwriting of children with Developmental Coordination Disorder. Research in
Developmental Disabilities, 35(11), 2894-2905.
Prunty, M., Barnett, A., Wilmut, K., & Plumb, M. (2016). The impact of handwriting
difficulties on compositional quality in children with developmental coordination
disorder. British Journal of Occupational Therapy, 79(10), 591–597.
Rapp, B., Purcell, J., Hillis, A., Capasso, R., & Micelli, G. (2016). Neural bases of orthographic
long-term memory and working memory in dysgraphia. Brain, 139(2), 588-604.
Rosenblum, S., Epsztein, L., Josman, N. (2008). Handwriting performance of children
with attention deficit hyperactive disorders: a pilot study. Physical & Occupational
Therapy in Pediatrics, 28(3), 19-34.
Rosenblum, S., Parush, S., & Weiss, P. (2003). Computerized temporal handwriting
characteristics of proficient and non-proficient handwriters. The American Journal of
Occupational Therapy, 57(2), 129-138.
Rosenblum, S., & Livneh-Zirinski, M. (2008). Handwriting process and product characteristics
of children diagnosed with developmental coordination disorder. Human Movement
28

Science, 27(2), 200-214.
Smits-Engelsman, B., & Schoemaker, M. (2017). Comparability of graphic performance in
children with pure dysgraphia and children with dysgraphia as part of Developmental
Coordination Disorder (DCD). In A.L. Barnett. & D.A. Sugden, (Eds) Moving,
Developing and Learning. A Festschrift in celebration of the career of Sheila E.
Henderson. Oxford Brookes University. (pages 81-95)
Smits-Engelsman, B., & Van Galen, G. (1997). Dysgraphia in children; lasting psychomotor
deficiency or transient developmental delay? Journal of Experimental Child Psychology,
67(2), 164–184.
Smits-Engelsman, B., & Wilson, P. (2013). Noise, variability, and motor performance in
developmental coordination disorder. Developmental Medicine & Child Neurology, 55
(4), 69–72.
Sugden, D., & Chambers, M. (2007). Stability and change in children with Developmental
Coordination Disorder. Child Care Health & Development, 33(5), 520-528.
Sumner, E., Connelly, V. & Barnett, A. (2013). Children with dyslexia are slow writers because
they pause more often and not because they are slow at handwriting execution. Reading
& Writing, 26(6), 991–1008.
Sumner, E., Connelly, V. & Barnett, A. (2014). The influence of spelling ability on handwriting
production: Children with and without Dyslexia. Journal of Experimental Psychology:
Learning, Memory, and Cognition, 40(5), 1441-1447.
Teulings, H.L. (1996). Handwriting movement control. In S.W. Keele and H. Heuer (Eds.),
Handbook of perception and action. Vol.2: Motor Skills (pp. 561-613). London:
Academic Press. ISBN 0-12-516162-X (reformatted).
Van Galen, G., Portier, S. J., Smits-Engelsman, B., & Shoemaker, L. (1993). Neuromotor noise
and poor handwriting in children. Acta Psychologica: European Journal of Psychology,
82, 161–178.
Van Galen, G. (1991). Handwriting: issues for a psychomotor theory. Human Movement
Science, 10, 165-191.
Van Galen, G., & De Jong., W. (1995). Fitts’ law as the outcome of a dynamic noise filtering
model of motor control. Human Movement Science, 14 (1995), 539–572.
Van Hartingsveldt, M., De Groot, I., Aarts, PBM., Ni-jhuis-van der Sanden., MWG. (2011).
Standardized tests of hand-writing readiness: a systematic review of the literature.
Developmental Medicine & Child Neurology, 53, 506–515.
29
Wilson, P., Ruddock, S., Smits-Engelsman, B., Polatajko, H. & Blank, R. (2013).
Understanding performance deficits in developmental coordination disorder: a meta-
analysis of recent research. Developmental Medicine & Child Neurology, 55(3), 217-228.
30