bura.brunel.ac.ukbura.brunel.ac.uk/bitstream/2438/13355/1/Fulltext.docx · Web viewDriving...
44
Driving Innovation through Big Open Linked Data (BOLD): Exploring Antecedents using Interpretive Structural Modelling Yogesh K. Dwivedi (Corresponding Author) School of Management, Swansea University, UK [email protected]/[email protected] Marijn Janssen Section of Information & Communication Technology, Faculty of Technology, Policy, and Management, Delft University of Technology, The Netherlands [email protected] Emma L. Slade School of Management, Swansea University, UK [email protected] Nripendra P. Rana School of Management, Swansea University, UK [email protected] Vishanth Weerakkody Business School, Brunel University, UK [email protected] Jeremy Millard Business School, Brunel University, UK and Danish Technological Institute, Denmark [email protected]; [email protected] Jan Hidders Web and Information Systems Engineering Lab, Department of Computer Science Vrije Universiteit Brussel, Belgium [email protected] Dhoya Snijders Researcher Data & Society The Dutch Study Center for Technology Trends (STT) Prinsessegracht 23, 2514 AP Den Haag, The Netherlands [email protected] 1
Transcript of bura.brunel.ac.ukbura.brunel.ac.uk/bitstream/2438/13355/1/Fulltext.docx · Web viewDriving...

Driving Innovation through Big Open Linked Data (BOLD): Exploring Antecedents using Interpretive
Structural ModellingYogesh K. Dwivedi (Corresponding Author)
School of Management, Swansea University, [email protected]/[email protected]
Marijn Janssen Section of Information & Communication Technology, Faculty of Technology, Policy, and
Management, Delft University of Technology, The Netherlands [email protected]
Emma L. SladeSchool of Management, Swansea University, UK
Nripendra P. RanaSchool of Management, Swansea University, UK
Vishanth WeerakkodyBusiness School, Brunel University, UK
Jeremy MillardBusiness School, Brunel University, UK and Danish Technological Institute, Denmark
[email protected]; [email protected]
Jan HiddersWeb and Information Systems Engineering Lab, Department of Computer Science
Vrije Universiteit Brussel, Belgium [email protected]
Dhoya SnijdersResearcher Data & Society
The Dutch Study Center for Technology Trends (STT)Prinsessegracht 23, 2514 AP Den Haag, The Netherlands
ABSTRACT
1
Driving Innovation through Big Open Linked Data (BOLD)
Innovation is vital to find new solutions to problems, increase quality, and improve profitability. Big open linked data (BOLD) is a fledgling and rapidly evolving field that creates new opportunities for innovation. However, none of the existing literature has yet considered the interrelationships between antecedents of innovation through BOLD. This research contributes to knowledge building through utilising interpretive structural modelling to organise nineteen factors linked to innovation using BOLD identified by experts in the field. The findings show that almost all the variables fall within the linkage cluster, thus having high driving and dependence powers, demonstrating the volatility of the process. It was also found that technical infrastructure, data quality, and external pressure form the fundamental foundations for innovation through BOLD. Deriving a framework to encourage and manage innovation through BOLD offers important theoretical and practical contributions.
Keywords: Big Data, Open Data, Linked Data, Innovation, Interpretive Structural Modelling
INTRODUCTION
‘We only have to imagine a world without Google searches, online weather forecasts
or GPS technologies to realize the current impact of data on our lives’ (Jetzek et al.
2014, p.101).
The rapid advancement of ICTs together with electronic publishing has enabled wide
distribution of large amounts of data previously held in closed, internal systems. ‘Big data’
consists of datasets so large and complex that they require advanced capture, storage,
management, and analysis technologies (Chen et al., 2012; Hota et al., 2015). While big data
is characterised by its size and variety (Gandomi & Haider, 2015; Kankanhalli et al., 2016),
‘open data’ is characterised by its free availability and absence of privacy restrictions
(Janssen et al., 2012). Although large volumes of raw open data published in an electronic
format are machine-readable and can be shared online and re-used, on its own open data
offers limited potential for decision making. However, when dispersed open data is
interlinked to provide more context, greater opportunities for stakeholders to exploit the data
for innovative purposes are provided, for example through collaboration and co-creation
(Behkamal et al., 2014).
‘Big open linked data’ (BOLD) is a recent and rapidly emerging field in the technology
oriented business world (Janssen et al., 2015). It refers to the integration of diverse data,
without predefined restrictions or conditions of use, to create new insights (Janssen and Kuk,
2016). BOLD can be released by public and private organizations or individuals (Janssen et
al., 2015) and can increase the reach of statistical and operational information, and deepen
analysis of outcomes and impacts. Realising the variety of potential benefits (Hossain et al.,
2

Driving Innovation through Big Open Linked Data (BOLD)
2016), governments are keen to adopt open data policies, documented by the increasing
number of countries committing to the Open Government Partnership, with 65 countries
collectively developing more than 2,000 policy initiatives by 2014 (Open Government
Partnership, 2014). McKinsey & Company (2011) estimate that the value of big data to US
healthcare could be more than $300 billion through driving efficiency and quality, and in the
private sector using big data effectively has the potential to increase retailers’ operating
margins by 60%. The use of BOLD is often tied to evidence-based policymaking (Ferro et al.,
2013; Janssen & Kuk, 2016); however, unlike public sector actors, private organizations can
view data as a strategic asset, providing a challenge to greater information sharing (Sayogo et
al., 2014).
It is widely recognised that innovation is key to growth and performance (Hauser et al. 2006;
Van der Panne et al., 2003). BOLD creates innovation opportunities for both the public and
private sectors, from innovation of processes and products to developments in the supply
chain and new markets (Jetzek et al., 2014; Zuiderwijk et al., 2014). However, Janssen et al.
(2015, p.87) state that ‘creating innovations with data is a complex process in which both the
available data and the users’ demands need to be taken into account’. Despite the
complexities, research has not yet attempted to draw together the factors affecting innovation
through BOLD. Industry-focussed research highlights issues that need to be addressed to
capture the full potential of big data - such as innovation - including data policies, technology
infrastructure, organizational change and talent, access to data, and competitive advantage
(McKinsey & Company, 2011). Although providing a useful starting point for further
investigation, the interrelationships between the issues have not been explored, which is
necessary for avoiding failure and maximising success of new initiatives in this area
(Dwivedi et al. 2015a; Hughes et al. 2015). Therefore, adopting the interpretive structural
modelling (ISM) method, this research seeks to attend to this gap.
The remainder of the paper is as follows. First, a literature review of research regarding
BOLD and innovation is undertaken. Next is a section detailing the ISM method employed to
determine the power of different factors in driving innovation through BOLD, followed by
further sections discussing the results and their implications. Finally, the paper is concluded,
outlining limitations and discussing future lines of research.
3

Driving Innovation through Big Open Linked Data (BOLD)
LITERATURE REVIEW
In their analysis of the literature, Chen et al. (2012) found research regarding ‘big data’ began
to gain traction from 2007. Similarly, Zuiderwijk et al. (2014) report a sharp increase in
publications regarding ‘open data’ from 2009. However, research combining the concepts of
big, open, and linked data has only recently begun to emerge, and studies considering
innovation through BOLD are even more scarce.
This review of the literature finds support for Zuiderwijk et al.’s (2014) suggestions that
much of the existing research has oriented towards data provision. Shadbolt et al. (2012)
consider how to bring open government data into the linked-data web. They report that
licensing restrictions are one of the biggest obstacles, management of an influx of
heterogeneous data a challenge, and ease of citizen access and better infrastructure is critical
to realize value. Considering data disclosure in the private sector, Sayogo et al. (2014) found
several challenges and motivating factors regarding market dynamics, information policies,
data challenges, and technological capability. Nevertheless, research is beginning to emerge
regarding the acceptance and use of data and open data technologies (Zuiderwijk et al.,
2015). Juell-Skielse et al.’s (2014) study investigates the role and functions of digital
innovation contests and explores the support provided following such contests to finalise and
implement the participants’ ideas. Susha et al. (2015) examined the organisational measures
to facilitate the use of open data. Their findings indicated that most public organisations have
no or limited interaction with data users and are often found selective in terms of with whom
and how to communicate.
Given the novelty of the area, many existing studies adopt a case study method. Lassinantti et
al. (2014) used two in-depth case studies of Swedish municipalities to consider how local
open data initiatives can stimulate innovation. Analysis of the cases revealed different drivers
for open data initiatives – ‘techno-economic growth’ and ‘co-created societal growth’. The
authors note that although targeted innovation activities initially render quicker results,
excluding potential innovators can inhibit more radical innovations. Janssen et al. (2015)
explored the link between BOLD and smart cities based on case studies of Amsterdam and
Rio de Janeiro and found that BOLD combined with predictive analytics enables improved
use of resources in the urban area. It was found that a main challenge of using BOLD to
create smart cities is in identifying data sources and the availability of the data. The authors
4
Driving Innovation through Big Open Linked Data (BOLD)
noted that much can be accomplished with simple analytic techniques but in order to take
advantage of the methods citizens must be smart with the knowledge provided.
Nugroho et al. (2015) provided a comprehensive cross-national comparative framework to
compare the open data policies from different countries. The comparison highlighted various
lessons including actions related to strong legal framework, generic operational policies, data
providers and data users, data quality, designated agencies and initiatives, and incentives for
stimulating demand for data. Jetzek et al. (2014) devise a framework of value generation
strategies from the data provider’s perspective. The four identified mechanisms are
transparency, participation, efficiency, and innovation. Jetzek et al. (2014) propose a
conceptual model of the data driven innovation mechanism consisting of three fundamental
phases: idea generation, idea conversion, and idea diffusion. They determine four multi-
dimensional ‘enabling factors’ capable of influencing the innovation mechanism, namely
absorptive capacity, such as organizational capabilities; openness, such as ease of access to
data; resource governance, including leadership and privacy; and technical connectivity, for
instance number of platforms. However, the conceptual model is presented at a high level of
abstraction, failing to account for interrelationships between individual factors, and is based
on a single-case study.
Following Dwivedi et al.’s (2015a) approach, a recent panel discussion held at the 14th IFIP
I3E Conference brought together invited academic and practitioner experts to consider how
BOLD can be utilised to drive innovation and the obstacles and challenges that might be
implicated (Dwivedi et al., 2015b). Several of the panellists noted the diverging interests of
different stakeholders and the risks of forgetting users’ needs as a result of data-driven
solutions. As disadvantages of BOLD are often overlooked (see Zuiderwijk & Janssen,
2014), panellists discussed the technical, legal, regulatory, and ethical challenges. This panel
discussion provides further foundations for the development of a conceptual model of
innovation through BOLD.
Zuiderwijk et al. (2014) argue that the diversity of theories that are currently implicated in
open data research is likely to be a result of the topic being an emerging phenomenon. The
authors recommend that future research should focus on theory development and stimulating
the use of open data. Therefore, this paper responds to these recommendations by taking
pioneering steps to develop a theory of driving innovation through BOLD.
5
Driving Innovation through Big Open Linked Data (BOLD)
METHODS
Interpretive structural modelling (ISM) is a well-established method for identifying
relationships among specific items, which define a problem or an issue (Jharkharia and
Shankar 2005). A number of factors may be related to any complex problem under
consideration. However, the direct and indirect relationships between the factors describe the
situation far more accurately than a specific factor taken in isolation. Therefore, ISM
develops insight into collective understanding of these relationships (Attri et al. 2013). The
method is interpretive in the sense that a group’s adjudication decides whether and how the
variables are related. It is structural in the sense that an overall structure is extracted from the
complex set of variables based on their relationships. Finally, it is modelling in the sense that
the specific relationships and overall structure are portrayed in a digraph model through a
hierarchical configuration.
The ISM method helps to impose order and direction on the complexity of the relationships
among the variables of a system (Attri et al. 2013; Sage 1977; Warfield 1974). For a complex
and emerging problem, such as innovation through BOLD, a number of factors may be
implicated. However, the direct and indirect relationships between the factors describing the
situation are far more precise than the individual factors considered in isolation. Therefore,
ISM develops insight into the collective understanding of these relationships. For example,
Singh et al. (2007) used ISM to develop structural relationships between competitiveness
factors to aid small and medium enterprises’ strategic decisions. Similarly, Agarwal et al.
(2007) applied ISM to identify and analyse the interrelationships of the variables influencing
supply chain agility. Moreover, Talib et al. (2011) employed ISM to analyse the interactions
among the barriers to total quality management implementation. The application of ISM
typically forces managers to review perceived priorities and improves their understanding of
the linkages among key concerns. The various steps involved in the ISM method are (Singh
et al. 2007):
[1] Identification of elements relevant to the problem or issue; this could be undertaken
through a literature review or any group problem solving technique (such as panel
discussion).
[2] Establishing a contextual relationship between variables with respect to which pairs of
variables will be examined.
6

Driving Innovation through Big Open Linked Data (BOLD)
[3] Developing a Structural Self-Interaction Matrix (SSIM) of elements to indicate pair-wise
relationships between variables of the system.
[4] Developing a reachability matrix from the SSIM and checking the matrix for transitivity.
Transitivity of the contextual relation is a basic assumption in ISM, which states that if
element A is related to B, and B is related to C, then A will be necessarily related to C.
[5] Partitioning of the reachability matrix into different levels.
[6] Based on the relationships given above in the reachability matrix, drawing a directed
graph (digraph), and removing transitive links.
[8] Converting the resultant digraph into an ISM-based model, by replacing element nodes
with statements.
[9] Reviewing the ISM-based model to check for conceptual inconsistency and making the
necessary modifications.
The above outlined steps that lead to the development of the ISM model are discussed below.
Identification of Elements
The literature review revealed that a comprehensive identification of the factors related to
innovation through BOLD has not previously been undertaken. Therefore, expert opinions
were sought to identify elements and develop contextual relationships among relevant
variables.
The first step involved identifying all relevant facets of innovation through BOLD via a panel
session with interested BOLD experts attending the first day of the 14 th IFIP I3E Conference
in Delft, The Netherlands. Every element was discussed thoroughly to develop a common
understanding. The factors that experts finally agreed on were: resistance to change, value,
access to data, awareness, security, privacy, human resource factors, organisational factors,
data licensing, data quality, technology infrastructure, cost, acceptance, risk, competitive
advantage, external pressure, legal aspect, trust, and innovation through BOLD. As the aim of
the research is to identify and analyse factors driving “innovation through BOLD”, it is
considered as an ultimate variable and the impact of all other variables are explored around it.
Table 1 presents the meaning/definition/example/type of various factors as discussed and
finalised by the panel of experts.
Table 1. Description of Identified ElementsF# Factor Meaning/Definition/Example/Type [As discussed by experts]1 Resistance to
changeOpposition to new ideas/processes/systems, boycotting
7

Driving Innovation through Big Open Linked Data (BOLD)
2 Value Perceived worth of BOLD3 Access to data Storing, retrieving or using data
4 AwarenessAwareness of data availability, awareness of platform where it is published and awareness of potential of innovation using the data
5 Security Protecting data from destructive forces and from the unwanted actions of unauthorised users
6 Privacy Confidentiality of sensitive information
7 Human resource factors
Leadership, management competency, knowledge, capacity building, symmetry of information
8 Organisational factors
Culture, strategy, structure, governance, competency, incentives and punishments, ambitions, vision, tactical issues, transparency
9 Data licensing Licensing big data before making it available online
10 Data qualityCompleteness, accuracy, currency, documentation, historical count or context, non-propriety, non-discriminatory, machine processable, interoperability
11 Technical infrastructure
Processing power, legacy systems, software access, storage capability, scalability and performance, fragmentation
12 CostCost for preparing, publishing and maintaining open data, cost of creating innovations, cost for managing change due to innovations, cost to acquire new IT systems to facilitate BOLD
13 Acceptance Acceptance of innovations, acceptance of open data
14 Risk Non-predictable and non-measurable risk of technology, BOLD, processes and innovation
15 Competitive advantage
Advantages over competitors through BOLD
16 External pressure Market pressure, mimetic pressure, coercive pressure
17 Legal aspectLegally compliant big data use across the organisation in a technically enhanced and practical way that allows the business to gain maximum advantage from its data assets
18 Trust Trust in technology, BOLD, processes and innovation
19 Innovation through BOLD
The action or process of innovating through BOLD
[Legend: F# = Factor Number]
Structural Self-Interaction Matrix (SSIM)
Once the elements had been identified it was necessary to determine contextual relationships
between the factors to develop the SSIM. In total seven specialists, including three
professionals with diverse industry experience related to BOLD and four highly proficient
academics with mixed experience of teaching, researching, and advising government on
policy and on BOLD related matters, were chosen to provide their expert views. The diversity
among participants helped to ensure a holistic view was achieved.
To analyse variables associated with innovation through BOLD, a contextual relationship of
‘helps achieve’ or ‘influences’ is chosen. To express the relationships between different
factors on innovation through BOLD, four symbols were used to denote the directions of
relationships between the parameters i and j (here, i < j):
V – Construct i helps achieve or influences j
8

Driving Innovation through Big Open Linked Data (BOLD)
A – Construct j helps achieve or influences i
X – Constructs i and j help achieve or influence each other
O – Constructs i and j are unrelated
For example, the following statements explain the use of symbols V, A, X, O in SSIM:
[1] Resistance to change (Variable 1) helps achieve or influences innovation through BOLD
(Variable 19) = V
[2] Legal aspect (Variable 17) helps achieve or influences security (Variable 5) = A
[3] Technical infrastructure (Variable 11) and privacy (Variable 6) help achieve or influence
each other = X
[4] Data quality (Variable 10) and access to data (Variable 3) are unrelated = O
Based on contextual relationships, the SSIM is developed (see Table 2).
Table 2. Structural Self-Interaction Matrix (SSIM)
V[i/j] 19 18 17 16 15 14 13 12 11 10 9 8 7 6 5 4 3 2 11 V X X A O X V X A A A X X A A O O A2 A X A O X V V X A A A O O A A O A3 V V A A V O V A A O A X X X X V4 V V O A X V V O O O O X X O O5 V V A A O X V X X O A X X X6 X V A A O V V X X O V X X7 V V O A V V V O V O O X8 V V O A X V V O X O O9 V V A A X V O V O O10 V V O O V V V V A11 V O A A V V V V12 X O A A X V O13 V A A A X A14 V X A O O15 X O O O16 X O O17 O V18 V19
[Legend: 1 = Resistance to Change, 2 = Value, 3 = Access to Data, 4 = Awareness, 5 = Security, 6 = Privacy, 7 = HR Factors, 8 = Organisational Factors, 9 = Data Licensing, 10 = Data Quality, 11 = Technical Infrastructure, 12 = Cost, 13 = Acceptance, 14 = Risk, 15 = Competitive Advantage, 16 = External Pressure, 17 = Legal Aspect, 18 = Trust, 19 = Innovation through BOLD, V[i/j] = Variable i/Variable j]
Reachability Matrix
The SSIM is converted into a binary matrix, called the initial reachability matrix, by
substituting V, A, X, and O with 1 and 0 as per the case. The substitution of 1s and 0s are as
per the following rules:
9

Driving Innovation through Big Open Linked Data (BOLD)
[1] If the (i, j) entry in the SSIM is V, the (i, j) entry in the reachability matrix becomes 1 and
the (j, i) entry becomes 0.
[2] If the (i, j) entry in the SSIM is A, the (i, j) entry in the reachability matrix becomes 0 and
the (j, i) entry becomes 1.
[3] If the (i, j) entry in the SSIM is X, the (i, j) entry in the reachability matrix becomes 1 and
the (j, i) entry becomes 1.
[4] If the (i, j) entry in the SSIM is O, the (i, j) entry in the reachability matrix becomes 0 and
the (j, i) entry becomes 0.
Following these rules, the initial reachability matrix for innovation through BOLD is shown
in Table 3.
Table 3. Initial Reachability Matrix
VAR 1 2 3 4 5 6 7 8 9 10 11
12 13 14 15 16 17 18 19
1 1 0 0 0 0 0 1 1 0 0 0 1 1 1 0 0 1 1 12 1 1 0 0 0 0 0 0 0 0 0 1 1 1 1 0 0 1 03 0 1 1 1 1 1 1 1 0 0 0 0 1 0 1 0 0 1 14 0 0 0 1 0 0 1 1 0 0 0 0 1 1 1 0 0 1 15 1 1 1 0 1 1 1 1 0 0 1 1 1 1 0 0 0 1 16 1 1 1 0 1 1 1 1 1 0 1 1 1 1 0 0 0 1 17 1 0 1 1 1 1 1 1 0 0 1 0 1 1 1 0 0 1 18 1 0 1 1 1 1 1 1 0 0 1 0 1 1 1 0 0 1 19 1 1 1 0 1 0 0 0 1 0 0 1 0 1 1 0 0 1 110 1 1 0 0 0 0 0 0 0 1 0 1 1 1 1 0 0 1 111 1 1 1 0 1 1 0 1 0 1 1 1 1 1 1 0 0 0 112 1 1 1 0 1 1 0 0 0 0 0 1 0 1 1 0 0 0 113 0 0 0 0 0 0 0 0 0 0 0 0 1 0 1 0 0 0 114 1 0 0 0 1 0 0 0 0 0 0 0 1 1 0 0 0 1 115 0 1 0 1 0 0 0 1 1 0 0 1 1 0 1 0 0 0 116 1 0 1 1 1 1 1 1 1 0 1 1 1 0 0 1 0 0 117 1 1 1 0 1 1 0 0 1 0 1 1 1 1 0 0 1 1 018 1 1 0 0 0 0 0 0 0 0 0 0 1 1 0 0 0 1 119 0 1 0 0 0 1 0 0 0 0 0 1 0 0 1 1 0 0 1
After including transitivity as explained in Step 4 of the ISM method, the final reachability
matrix is shown in Table 4. Table 4 also shows the driving and dependence power of each
variable. The driving power for each variable is the total number of variables (including
itself), which it may help to achieve. On the other hand, dependence power is the total
number of variables (including itself), which may help in achieving it. These driving and
dependence powers will be used later in the classification of variables into the four groups
including autonomous, dependent, linkage, and drivers.
Table 4. Final Reachability Matrix
VAR 1 2 3 4 5 6 7 8 9 10 11 12 13 14 15 16 17 18 1 DRP
10

Driving Innovation through Big Open Linked Data (BOLD)
91 1 1
* 1* 1* 1* 1* 1 1 1* 0 1* 1 1 1 1* 1* 1 1 1 18
2 1 1 0 1* 1* 1* 1* 1* 1* 0 0 1 1 1 1 0 1* 1 1* 15
3 1* 1 1 1 1 1 1 1 1* 0 1* 1* 1 1* 1 0 0 1 1 164 1* 1
* 1* 1 1* 1* 1 1 1* 0 1* 1* 1 1 1 1* 0 1 1 17
5 1 1 1 1* 1 1 1 1 1* 1* 1 1 1 1 1* 0 1* 1 1 186 1 1 1 1* 1 1 1 1 1 0 1 1 1 1 1* 0 1* 1 1 177 1 1
* 1 1 1 1 1 1 1* 1* 1 1* 1 1 1 1* 1* 1 1 19
8 1 1* 1 1 1 1 1 1 1* 1* 1 1* 1 1 1 1* 1* 1 1 19
9 1 1 1 1* 1 1* 1* 0 1 0 1* 1 1* 1 1 1* 1* 1 1 1710 1 1 1* 1* 1* 1* 1* 1* 1* 1 0 1 1 1 1 1* 1* 1 1 1811 1 1 1 1* 1 1 1* 1 1* 1 1 1 1 1 1 1* 1* 1* 1 1912 1 1 1 1* 1 1 1* 1* 1* 0 1* 1 1* 1 1 1* 1* 0 1 1713 0 1
* 0 1* 0 1* 0 1* 1* 0 0 1* 1 0 1 1* 0 0 1 10
14 1 1* 1* 0 1 1* 1* 1* 0 0 1* 1* 1 1 1* 1* 1* 1 1 16
15 1* 1 1* 1 1* 1* 1* 1 1 0 1* 1 1* 0 1 1* 0 1* 1 1616 1 1
* 1 1 1 1 1 1 1 0 1 1 1 1* 1* 1 1* 1* 1 18
17 1 1 1 1* 1 1 1* 1* 1 1* 1 1 1 1 1* 0 1 1 1* 18
18 1 1 0 0 1* 1* 1* 1* 0 0 0 1* 1 1 1* 1* 1* 1 1 1419 1* 1 1* 1* 1* 1 1* 1* 1* 0 1* 1 1* 1* 1 1 0 1* 1 17
DNP 18 19 16 17 18 19 18 18 17 6 15 19 19 17 19 14 14 17 1
9319
[Legend: 1* shows transitivity, DNP = Dependence Power, DRP = Driving Power, VAR = Variable]
Level Partitions
The matrix is partitioned by assessing the reachability and antecedent sets for each variable
(Warfield, 1974). The final reachability matrix leads to the reachability and antecedent set for
each factor relating to innovation through BOLD. The reachability set R(si) of the variable si
is the set of variables defined in the columns that contained 1 in row s i. Similarly, the
antecedent set A(si) of the variable si is the set of variables defined in the rows, which contain
1 in the column si. Then, the interaction of these sets is derived for all the variables. The
variables for which the reachability and intersection sets are the same are the top-level
variables of the ISM hierarchy. The top-level variables of the hierarchy would not help to
achieve any other variable above their own level in the hierarchy. Once the top-level
variables are identified, they are separated out from the rest of the variables and then the
same process is repeated to find out the next level of variables, and so on. These identified
levels help in building the digraph and the final ISM model (Agarwal et al. 2007; Singh et al.
2007). In the present context, the variables along with their reachability set, antecedent set,
11

Driving Innovation through Big Open Linked Data (BOLD)
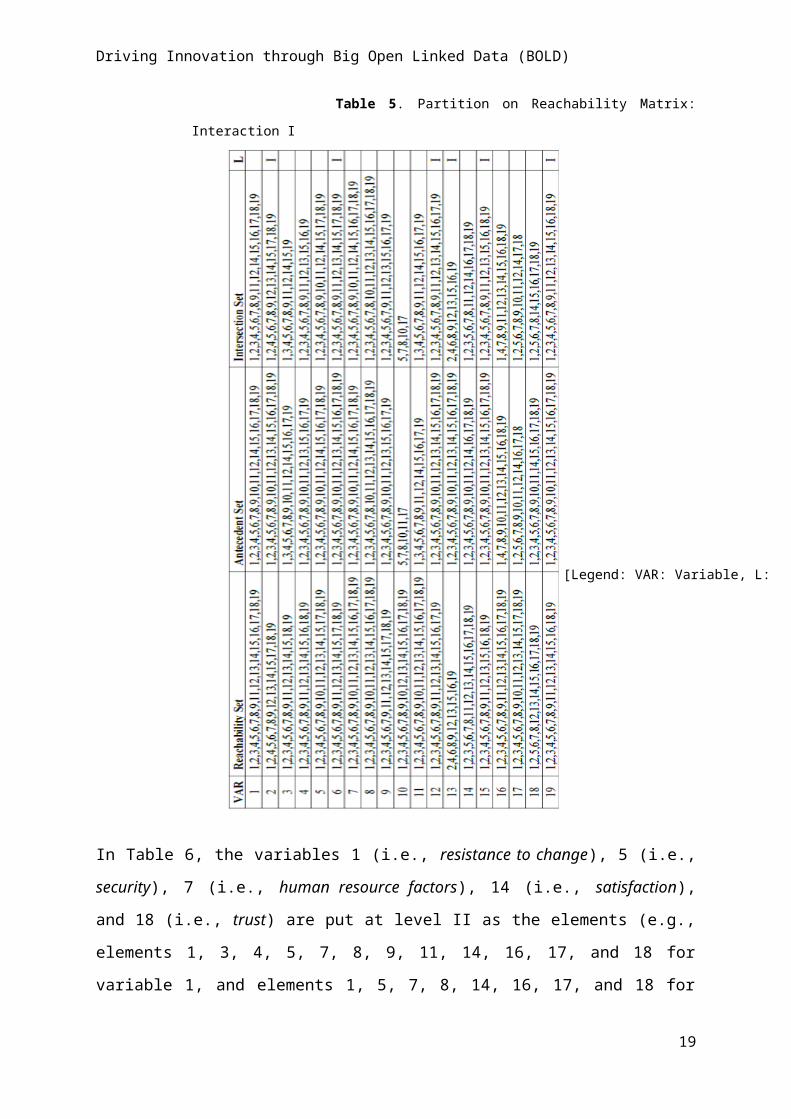
and the top level is shown in Table 5. The process is completed in seven iterations (in Tables
4-10) as follows:
In Table 5, variables 2 (i.e., value), 6 (i.e., privacy), 12 (i.e., cost), 13 (i.e., acceptance), 15
(i.e., competitive advantage), and 19 (i.e., innovation through BOLD) are found at level I as
the elements (e.g., elements 1, 2, 4, 5, 6, 7, 8, 9, 12, 13, 14, 15, 17, 18, 19 for variable 2) for
these variables at reachability and intersection set are the same. So, they will be positioned at
the top of the hierarchy of the ISM model.
12

Driving Innovation through Big Open Linked Data (BOLD)
Table 5. Partition on Reachability Matrix: Interaction I
In Table 6, the variables 1 (i.e., resistance to change), 5 (i.e., security), 7 (i.e., human
resource factors), 14 (i.e., satisfaction), and 18 (i.e., trust) are put at level II as the elements
(e.g., elements 1, 3, 4, 5, 7, 8, 9, 11, 14, 16, 17, and 18 for variable 1, and elements 1, 5, 7, 8,
14, 16, 17, and 18 for variable 18) for these variables as reachability and intersection set are
the same. Thus, they will be positioned at level II in the ISM model. Moreover, we also
remove the rows corresponding to variables 2, 6, 12, 13, 15, and 19 from Table 5, which are
already positioned at the top level (i.e., level I). The same process of deleting the rows
13
[Legend: VAR: Variable, L: Level]

Driving Innovation through Big Open Linked Data (BOLD)
corresponding to the previous level and marking the next level position to the new table is
repeated until we reach the final variable in the table.
Table 6. Partition on Reachability Matrix: Interaction II
VAR Reachability Set Antecedent Set Intersection Set L
1 1,3,4,5,7,8,9,11,14,16,17,181,3,4,5,7,8,9,10,11,14,16,17,18 1,3,4,5,7,8,9,11,14,16,17,18 II
3 1,3,4,5,7,8,9,11,14,18 1,3,4,5,7,8,9,10,11,14,16,17 1,3,4,5,7,8,9,11,144 1,3,4,5,7,8,9,11,14,16,18 1,3,4,5,7,8,9,10,11,16,17 1,3,4,5,7,8,9,11,16
5 1,3,4,5,7,8,9,10,11,14,17,181,3,4,5,7,8,9,10,11,14,16,17,18 1,3,4,5,7,8,9,10,11,14,17,18 II
7 1,3,4,5,7,8,9,10,11,14,16,17,181,3,4,5,7,8,9,10,11,14,16,17,18 1,3,4,5,7,8,9,10,11,14,16,17,18 II
8 1,3,4,5,7,8,9,10,11,14,16,17,18 1,3,4,5,7,8,10,11,14,16,17,18 1,3,4,5,7,8,10,11,14,16,17,189 1,3,4,5,7,9,11,14,17,18 1,3,4,5,7,8,9,10,11,16,17 1,3,4,5,7,9,11,16,1710 1,3,4,5,7,8,9,10,14,16,17,18 5,7,8,10,11,17 5,7,8,10,1711 1,3,4,5,7,8,9,10,11,14,16,17,18 1,3,4,5,7,8,9,11,14,16,17 1,3,4,5,7,8,9,11,14,16,17
14 1,3,5,7,8,11,14,16,17,181,3,4,5,7,8,9,10,11,14,16,17,18 1,3,5,7,8,11,14,16,17,18 II
16 1,3,4,5,7,8,9,11,14,16,17,18 1,4,7,8,9,10,11,14,16,18 1,4,7,8,9,11,14,16,1817 1,3,4,5,7,8,9,10,11,14,17,18 1,5,7,8,9,10,11,14,16,17,18 1,5,7,8,9,10,11,14,17,18
18 1,5,7,8,14,16,17,181,3,4,5,7,8,9,10,11,14,16,17,18 1,5,7,8,14,16,17,18 II
[Legend: VAR = Variable, L = Level]
In Table 7, variables 3 (i.e., access to data), 4 (i.e., awareness), and 9 (i.e., data licensing) are
put at level III as the elements (i.e., elements 3, 4, 8, 9, and 11 for variable 3, elements 3, 4, 8,
9, 11, 16 for variable 4, and elements 3, 4, 9, 11, and 17 for variable 9) at reachability set and
intersection set for these variables are the same. Thus, it will be positioned at level III in the
ISM model.
Table 7. Partition on Reachability Matrix: Interaction III
VAR
Reachability Set Antecedent Set Intersection Set L3 3,4,8,9,11 3,4,8,9,10,11,16,17 3,4,8,9,11 III4 3,4,8,9,11,16 3,4,8,9,10,11,16,17 3,4,8,9,11,16 III8 3,4,8,9,10,11,16,17 3,4,8,10,11,16,17 3,4,8,10,11,16,179 3,4,9,11,17 3,4,8,9,10,11,16,17 3,4,9,11,16,17 III10 3,4,8,9,10,16,17 8,10,11,17 8,10,1711 3,4,8,9,10,11,16,17 3,4,8,9,11,16,17 3,4,8,9,11,16,1716 3,4,8,9,11,16,17 4,8,9,10,11,16 4,8,9,11,1617 3,4,8,9,10,11,17 8,9,10,11,16,17 8,9,10,11,17
[Legend: VAR = Variable, L = Level]
In Table 8, variables 8 (i.e., organisational factors) and 17 (i.e., legal aspect) are put at level
IV as the elements (i.e., elements 8, 10, 11, 16, 17 for variable 8 and elements 8, 10, 11, 17
for variable 17) at reachability set and intersection set for these variables are the same. Thus,
it will be positioned at level IV in the ISM model.
14

Driving Innovation through Big Open Linked Data (BOLD)
Table 8. Partition on Reachability Matrix: Interaction IV
VAR Reachability Set Antecedent Set Intersection Set L8 8,10,11,16,17 8,10,11,16,17 8,10,11,16,17 IV10 8,10,16,17 8,10,11,17 8,10,1711 8,10,11,16,17 8,11,16,17 8,11,16,1716 8,11,16,17 8,10,11,16 8,11,1617 8,10,11,17 8,10,11,16,17 8,10,11,17 IV
[Legend: VAR = Variable, L = Level]
In Table 9, variable 16 (i.e., external pressure) is put at level V, as the elements (i.e., 11 and
16) at reachability set and intersection set for this variable are the same. Thus, it will be
positioned at level V in the ISM model.
Table 9. Partition on Reachability Matrix: Interaction V
VAR Reachability Set Antecedent Set Intersection Set L10 10,16 10,11 1011 10,11,16 11,16 11,1616 11,16 10,11,16 11,16 V
[Legend: VAR = Variable, L = Level]
In Table 10, variable 10 (i.e., data quality) is put at level VI as the element (i.e., 10) at
reachability set and intersection set for this variable is the same. Thus, it will be positioned at
level VI in the ISM model.
Table 10. Partition on Reachability Matrix: Interaction VI
VAR Reachability Set Antecedent Set Intersection Set L10 10 10,11 10 VI11 10,11 11 11
[Legend: VAR = Variable, L = Level]
In Table 11, variable 11 (i.e., technical infrastructure) is put at level VII as the element (i.e.,
11) at reachability set and intersection set for this variable is the same. Thus, it will be
positioned at level VII in the ISM model.
Table 11. Partition on Reachability Matrix: Interaction VII
VAR Reachability Set Antecedent Set Intersection Set L11 11 11 11 VII
[Legend: VAR = Variable, L = Level]
Developing Canonical Matrix
A canonical matrix is developed by clustering variables in the same level, across the rows and
columns of the final reachability matrix as shown in Table 12. This matrix is just another,
more convenient, form of the final reachability matrix (i.e., Table 3) as far as drawing the
ISM model is concerned.
Table 12. Canonical Form of Final Reachability Matrix
15

Driving Innovation through Big Open Linked Data (BOLD)
VAR 2 6 12 13 15 19 1 5 7 14 18 3 4 9 8 17 16 10 11 L2 1 1 1 1 1 1 1 1 1 1 1 0 1 1 1 1 0 0 0 I6 1 1 1 1 1 1 1 1 1 1 1 1 1 1 1 1 0 0 1 I12 1 1 1 1 1 1 1 1 1 1 0 1 1 1 1 1 1 0 1 I13 1 1 1 1 1 1 0 0 0 0 0 0 1 1 1 0 1 0 0 I15 1 1 1 1 1 1 1 1 1 0 1 1 1 1 1 0 1 0 1 I19 1 1 1 1 1 1 1 1 1 1 1 1 1 1 1 0 1 0 1 I1 1 1 1 1 1 1 1 1 1 1 1 1 1 1 1 1 1 0 1 II5 1 1 1 1 1 1 1 1 1 1 1 1 1 1 1 1 0 1 1 II7 1 1 1 1 1 1 1 1 1 1 1 1 1 1 1 1 1 1 1 II14 1 1 1 1 1 1 1 1 1 1 1 1 0 0 1 1 1 0 1 II18 1 1 1 1 1 1 1 1 1 1 1 0 0 0 1 1 1 0 0 II3 1 1 1 1 1 1 1 1 1 1 1 1 1 1 1 0 0 0 1 III4 1 1 1 1 1 1 1 1 1 1 1 1 1 1 1 0 1 0 1 III9 1 1 1 1 1 1 1 1 1 1 1 1 1 1 0 1 1 0 1 III8 1 1 1 1 1 1 1 1 1 1 1 1 1 1 1 1 1 1 1 IV17 1 1 1 1 1 1 1 1 1 1 1 1 1 1 1 1 0 1 1 IV16 1 1 1 1 1 1 1 1 1 1 1 1 1 1 1 1 1 0 1 V10 1 1 1 1 1 1 1 1 1 1 1 1 1 1 1 1 1 1 0 VI11 1 1 1 1 1 1 1 1 1 1 1 1 1 1 1 1 1 1 1 VIIL I I I I I I II II II II II III II
I III IV IV V VI VII
[Legend: VAR = Variable, L = Level]
Classification of Factors Influencing Innovation Using BOLD
The factors for innovation using BOLD are classified into four categories based on driving
power and dependence power: autonomous, dependent, linkage, and drivers (Mandal and
Deshmukh 1994). The driving power and dependence power of each of these BOLD factors
is shown in Table 4. The driver power – dependence power diagram is shown in Figure 1.
This figure has four quadrants that represent the autonomous, dependent, linkage, and driver
categories. For example, a factor that has a driving power of 2 and dependence power of 17 is
positioned at a place with dependence power of 17 in the X-axis and driving power of 2 on
the Y-axis. Based on its position, it can be defined as a dependent variable. Similarly, a factor
having a driving power of 17 and a dependence power of 2 can be positioned at dependence
power of 2 at the X-axis and driving power of 17 on the Y-axis. Based on its position, it can
be defined as a driving variable. The objective behind the classification for innovation
through BOLD is to analyse the driver power and dependency of the factors.
The first cluster includes autonomous factors that have weak driver power and weak
dependence. These factors are relatively disconnected from the system. In the context of the
current research, none of the factors belong to this cluster. The second cluster consists of the
dependent variables that have weak driver power but strong dependence; acceptance is the
only variable that belongs to this cluster. The third cluster has the linkage variables that have
16

Driving Innovation through Big Open Linked Data (BOLD)
strong driver power and dependence. Any action on these variables will have an effect on the
others and also a feedback effect on themselves. The majority of the variables - resistance to
change, value, access to data, awareness, security, privacy, human resource factors,
organisational factors, data licensing, technical infrastructure, cost, risk, competitive
advantage, external pressure, legal aspect, trust, and innovation through BOLD - fall under
this category. The fourth cluster includes drivers or independent variables with strong driving
power and weak dependence. Only one variable, namely data quality, falls under this
category (see Figure 1).
Figure 1. Driving Power and Dependence Diagram
Formation of Structural Model
From the canonical form of the reachability matrix (see Table 12), the structural model is
generated by means of vertices and nodes and lines or edges. If there is a relationship
between the factors i and j responsible for innovation through BOLD, this is shown by an
arrow that points from i to j. This graph is called directed graph or digraph. After removing
the indirect links, the digraph is finally converted into an ISM-based model as shown in
Figure 2.
17

Driving Innovation through Big Open Linked Data (BOLD)
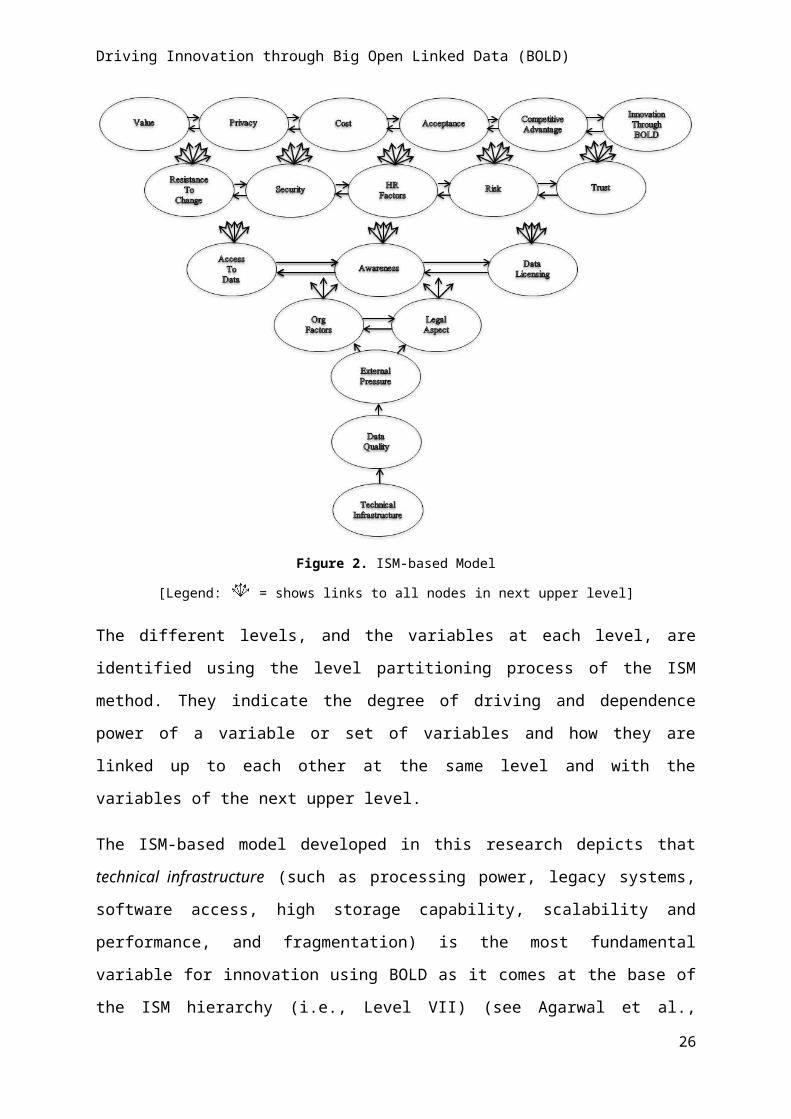
Figure 2. ISM-based Model
[Legend: = shows links to all nodes in next upper level]
The different levels, and the variables at each level, are identified using the level partitioning
process of the ISM method. They indicate the degree of driving and dependence power of a
variable or set of variables and how they are linked up to each other at the same level and
with the variables of the next upper level.
The ISM-based model developed in this research depicts that technical infrastructure (such
as processing power, legacy systems, software access, high storage capability, scalability and
performance, and fragmentation) is the most fundamental variable for innovation using
BOLD as it comes at the base of the ISM hierarchy (i.e., Level VII) (see Agarwal et al.,
2007). Technical infrastructure facilitates data quality, which further helps in building
external pressure to address and maintain it. Collectively, technical infrastructure, data
quality, and external pressure provide the basis for innovation through BOLD. Moreover,
they are also closely linked to each other. These lower level factors lead to shaping the
organisational factors (including culture, strategy, structure, governance, competency,
ambitions, vision etc.) and legal aspect (see level IV).
18
Driving Innovation through Big Open Linked Data (BOLD)
The improvement in middle level variables helps to achieve next-level variables (Agarwal et
al., 2007). Therefore, improvement in organisational factors and legal aspects lead to better
access to data, superior awareness (including awareness of data, the platform where it is
published, and potential of innovation), and data licensing. These factors at Level III directly
influence resistance to change, security, HR factors (such as leadership, management
competency, lack of knowledge, capacity building, and asymmetry of information), risk, and
trust (including trust of technology, data, processes, and innovation) at the next higher level
(i.e., Level II). For example, open access to data can raise questions regarding data security,
especially in relation to sensitive data, and can also raise concerns about the trust of data, so
leading to higher risk for using and implementing it further.
The top level variables demonstrate strong dependence on other variables (Agarwal et al.,
2007). In the present context, the variables value, privacy, cost, acceptance, competitive
advantage and innovation through BOLD which are at the top level (i.e., Level I) show strong
dependence power. The variables at Level II influence the topmost hierarchy (i.e., Level I) of
the ISM model. For example, aspects related to security can better serve the privacy of
BOLD. Similarly, the relationship between risk and innovation through BOLD indicates that
higher the risk involved with access and use of BOLD, weaker will be the innovation using
such data whereas higher trust, on the contrary, can strengthen innovation through BOLD.
DISCUSSION
BOLD opens a world of possibilities for innovation but creating innovations with BOLD is a
complex process. The ISM method has uncovered the relationships between the numerous
variables identified during the brainstorming session at the 14 th IFIP I3E Conference as being
associated with innovation through BOLD. The findings are now discussed in the context of
existing literature as well as discussions undertaken by experts at the 14 th IFIP I3E
Conference panel, and theoretical contributions and practical implications are explored.
Almost all variables were determined to have both strong driving and dependence powers,
determining them as ‘linkage’ variables. Linkage variables can be considered relatively
unstable (Singh et al. 2007; Talib et al. 2011). Therefore, in the context of innovation through
BOLD, any action on almost all the variables will have an effect on the others as well as
feedback on themselves. An explanation for this is that BOLD is in its infancy and
governments and companies are still struggling with how to make sense of it. There is not
one proven or best infrastructure, and data quality is often unclear and needs to be
19

Driving Innovation through Big Open Linked Data (BOLD)
investigated. The hype might result in pressure, but the capabilities to take advantage of this
and to create acceptable and feasible innovations that are not conflicting with legislation are
lacking. Therefore, knowledge about all aspects presented in the ISM-based model is
necessary to drive innovation.
Finding that technical infrastructure comes at the base of the ISM hierarchy is in accordance
with much of the existing research regarding BOLD. Insufficient technical capabilities and
lack of adequate technical infrastructure create a major impediment for data creation as well
as data sharing (Sayogo et al., 2014; Shadbolt et al., 2012). One of the experts at the 14 th IFIP
I3E Conference panel commented that “all too often datasets are not linked and there is a
need for tools to derive links between datasets”. Without the technical infrastructure, BOLD
will not be able to be found, processed and analysed (Zuiderwijk et al. 2015) – an obvious
requirement for innovation through BOLD.
Park et al. (2012) argue that business intelligence systems are of limited value when they deal
with inaccurate and unreliable data, which are common characteristics of self-reported data.
As the only ‘driver’ according to Figure 1, data quality needs consistent attention (Agarwal et
al. 2007) to encourage innovation through BOLD. The results of the ISM-based model
suggest that poor data quality, will eventually lead to less trust, more risk, and ultimately
prohibit innovation through BOLD.
That legal aspects have an effect on access to data and data licensing supports Sayogo et al.’s
(2014) argument that unclear demarcation of legal boundaries can hamper data openness,
which in turn would inhibit innovation through BOLD. Experts at the 14 th IFIP I3E
Conference panel discussion asked questions like “Who is in control of the data?”,
“Who guarantees business continuity and quality?” and “What happens if the people who
open and manage the data are corrupt?”. Often miscellaneous data are combined from
various sources, from different owners, so nobody has responsibility. The use of BOLD poses
high demands on data governance. However, McKinsey & Company (2011) suggest that for
benefits to be realised, policy makers will often also need to push the deployment of big data
innovation and the findings of this study support this. Nevertheless, the ISM-based model
also determined organisational factors to appear on the same level as legal aspects, suggesting
both internal and external governance is equally important.
At the 14th IFIP I3E Conference panel it was expressed that “there is a lot of value that can
be derived [from BOLD] – customers become the product as soon as they use platforms such
20

Driving Innovation through Big Open Linked Data (BOLD)
as Facebook”. Jetzek et al. (2014) suggest that innovation through BOLD creates value
through new structures, which themselves form the foundation for new data and hence
innovation, resulting in a cyclical process where value and innovation through BOLD feed
into each other. Support is found for this value generation framework and conceptual model
of the data driven innovation mechanism given that value, competitive advantage, and
innovation through BOLD appear at the same top level in the ISM-based model and are all
linkage variables.
Theoretical Contributions
BOLD is a relatively new and emerging field of research, thus only a few studies (e.g.,
Dwivedi et al., 2015b; Janssen and Kuk, 2016; Janssen et al., 2015) have been published in
this area. As far as the authors are aware, there has not been any previous attempt to identify
factors driving innovation through BOLD. Therefore, this is the first study in the field that
identifies and links nineteen factors related to innovation through BOLD. The formal
development of these links and further predictive causal links between factors as identified in
this research can be considered as a significant contribution in this area.
A further key theoretical contribution is in the method adopted, being the first study to utilise
ISM to determine the links between constructs steering innovation through BOLD and assess
how these links are represented in the perspective of their driving and dependence power in
relation to the other factors. The hierarchy or level of constructs presented in the ISM-based
model indicates the relative importance of different variables as drivers, relatively dependent
constructs or constructs somewhere in the middle across the levels. The ISM-based model
also provides the correlations between the constructs presented at the upper four levels. The
interdependency of these constructs at the same level indicates how closely they are related to
each other and so will allow researchers to select these constructs for further framework
development and validation.
Practical Implications
The proposed ISM-based model for identification and ranking of factors influencing
innovation through BOLD provides a framework for practitioners and policy makers to help
encourage and manage innovation through BOLD. The utility of the ISM method lies in
imposing order and direction on the complexity of relationships among these factors, which
will help decision-makers to better utilise their available resources for maximising innovation
through BOLD.
21

Driving Innovation through Big Open Linked Data (BOLD)
The driver-dependence matrix (Figure 1) indicates that there is no construct falling in the
autonomous cluster. The constructs under this cluster are the weak drivers and weak
dependents and hence they do not have much influence. The absence of any autonomous
factors in this study indicates that policy makers and practitioners should pay attention to all
factors identified as being related to innovation through BOLD. As acceptance is a factor
with weak driving power and relatively high dependence power, practitioners should give
high priority to understanding the acceptance of innovations and using BOLD. All other
factors except acceptance and data quality fall under the linkage cluster, making them
unstable as any action on these factors will have an impact on the others and also feedback on
themselves (Talib and Rahman, 2011). This reiterates the importance for practitioners to
ensure their attention is shared across all variables identified.
CONCLUSION
In order to attend to the current gap in the literature the key objective of the present study was
to develop a hierarchy of factors influencing innovation through BOLD. The variety of data
sources, the different interests of stakeholders, and unknown outcomes make it a challenge to
drive innovation through BOLD. From a panel of experts, 19 variables relevant to innovation
through BOLD were identified including resistance to change, value, access to data,
awareness, security, privacy, human resource factors, organisational factors, data licensing,
data quality, technology infrastructure, cost, acceptance, risk, competitive advantage, external
pressure, legal aspect, trust, and innovation through BOLD itself. Utilising ISM, the
categorisation of factors was achieved and relationships between the variables were
established. The findings indicate that technical infrastructure, data quality, and external
pressure form the foundations for innovation through BOLD. The placing of value,
competitive advantage, and innovation through BOLD at the same top level in the ISM-based
model reinforces the utility of innovation through BOLD and thus the importance of this
research. However, the high dependencies and linkages among variables show that for many
components there are uncertainties about how to do this as there is no standard infrastructure
for BOLD that can be used to foster innovation. Despite this, organizations need to be able to
deal with all aspects of the ISM-based model to create innovation through BOLD; it is likely
that only a few organizations are able to deal with all these aspects. This suggests that more
proven practices are necessary before innovation through BOLD can fly.
22

Driving Innovation through Big Open Linked Data (BOLD)
Future Lines of Research
Despite the significant contributions of this research, like all studies it is not without
limitations. Although experts were consulted to generate factors relevant to innovation
through BOLD there are likely to be other relevant factors, which could be explored in future
research. Similarly, it would be useful for future research to conceptually develop the factors
further using both inductive and deductive methods before the model is statistically tested
and validated using structural equation modelling. As identified in the literature review, some
research is emerging regarding the overcoming of challenges such as technological
capability, management of heterogeneous data, and quality assessment. Further research
should be conducted on each component of the ISM-based model in order to assess the policy
and practical implications for each.
Aside from the future research directions resulting from the limitations of the study, the
novelty of BOLD presents a wide-range of further lines of research. BOLD innovation might
be conceptualized as a complex adaptive system (CAS). CAS can generally be defined as a
system that emerges over time into a coherent form, and adapts and organizes itself without
any singular entity deliberately managing or controlling it (Holland, 1996). Innovation
through BOLD is a complex process in which many organizations might interact with each
other. Therefore, social interaction among actors and the use of technology are both key
aspects. Users may change over time and innovations will be shaped and reshaped based on
input from different actors. The use of BOLD is a typical situation in which various
stakeholders have different objectives; some might prefer transparency whereas others may
want to keep data private as a strategic asset. Different scenarios or use contexts might focus
on one type of actor or sector, a range of innovation trajectories including deductive and
inductive, and/or different needs and objectives. Therefore, further research is required to
delineate how different actors can successfully interact to achieve innovation through BOLD
as a CAS.
Whereas literature has mainly focussed on the role that technology can play in facilitating
humans in processes of innovation, there is a rise in innovative practices and products that are
shaped by technology. As computational power, networks and algorithms are growing in
terms of speed and strength BOLD can be ordered, reordered and analysed by non-human
intelligent systems. Industry-wide there has been a rise of predictive algorithms that can
automatically detect new business opportunities and can help assess if business concepts or
23

Driving Innovation through Big Open Linked Data (BOLD)
start-ups will succeed or fail. As humans increasingly have to deal with non-human actors in
the form of intelligent BOLD systems more research is needed to understand this relationship
in general, but more specifically it is necessary to understand the role of artificial intelligent
systems in the process of innovation through BOLD.
From a data-management perspective, successful BOLD innovation raises several challenges
including: finding and dealing with large data sets; integrating datasets that were not
originally intended to be integrated; restructuring datasets to fit a common vocabulary; and
building usable data management interfaces for users of various levels of expertise. Future
research is required to uncover the effective data models and existing formalisms to handle
the integration of data and transformations. Moreover, these systems should be able to deal
with both structured and unstructured data. More research is needed to develop new tools for
big data analytics, as existing statistical tools may not facilitate the analysis of large volumes
of unstructured data. The concept of ‘deep learning’ is relevant here where intelligent
algorithms capable of recognizing items of interest in large quantities of unstructured and
binary data, and deducing relationships without needing specific models or programming
instructions, need to be developed. More attention is also required to develop effective user
interfaces that enable non-experts who do not have deep data-management experience to find,
integrate, transform, and visualise data in meaningful ways.
Related to data-management, another area that requires further work in the use of BOLD is
ethics, where tools as well as policies and guidelines are needed that are capable of ensuring
the privacy and security of data. In this respect, more research is needed into anonymization
of organisations and individuals during use and re-use while at the same time ensuring that
transparency and accountability is maintained. For this purpose, regulatory frameworks are
evolving and need to be developed further to help define how to collect, manage and interpret
data for scientific and practical purposes.
More research is needed to identify and define the business case and conditions for small and
medium size enterprises to come up with innovative real time systems that are capable of
extracting, indexing and linking data across multiple data sources, such as internal systems,
data warehouses, sensors, and social media streams, as well as user generated location based
data from mobile devices. A key area that is yet unclear in the BOLD debate is the value
proposition that it offers third party organisations and entrepreneurs who the public sector
rely on for developing applications that can exploit their open data. Moreover, several
24

Driving Innovation through Big Open Linked Data (BOLD)
questions, including, who will be the ultimate end users of public sector open data, who will
pay for the use of the analytical tools and solutions that can make sense of the open data, and
how useful is the public sector open data for end users, still remain to be answered
empirically. Indeed, answers to these questions will form the basis for defining a sustainable
business model in which conditions for exploiting BOLD can be set out in a public sector
context for all stakeholders, including the business community and citizens.
Innovation generally requires, on the one hand, diversity of contexts, actors and evidence,
and, on the other, interaction between these through various forms of experimentation. This
can take place deductively in a designed and top-down manner directed by a particular need
or objective, or more inductively, open-ended, bottom-up and emergent (as in CAS).
Although the former is more common as innovation with or for a purpose, the latter can also
make important contributions. Developing more proven practices of BOLD needs more
research into the array of specific roles it can play in these two contexts to drive or support
innovation, for example by developing real life scenarios which recognise that the context,
purpose and perceived benefits of use are highly important. In turn, this will likely rest on the
recognition that non-BOLD evidence and inputs are both unavoidable and necessary - BOLD
is unlikely to achieve high impact or meaningful innovations on its own.
REFERENCES
Agarwal, A., Shankar, R. & Tiwari, M.K. (2007). Modeling agility of supply chain. Industrial Marketing Management. 36(4), 443-457.
Attri, R., Dev, N. & Sharma, V. (2013). Interpretive structural modelling (ISM) approach: An overview. Research Journal of Management Science. 2(2), 3-8.
Behkamal, B., Kahani, M., Bagheri, E. & Jeremic, Z. (2014). A metrics-driven approach for quality assessment of linked open data. Journal of Theoretical and Applied Electronic Commerce Research. 9(2), 64-79.
Chen, H., Chiang, R. & Storey, V. (2012). Business intelligence and analytics: From big data to big impact. MIS Quarterly. 36(4), 1165-1188.
Dwivedi, YK, Wastell, D, Laumer, S, Henriksen, HZ, Myers, MD, Bunker, D, Elbanna, A, Ravishankar, MN and Srivastava, SC (2015a), ‘Research on Information Systems Failures and Successes: Status Update and Future Directions’, Information Systems Frontiers, 17(1), 143-157
Dwivedi, Y., Weerakkody, V., Janssen, M., Millard, J., Hidders, J., Snijders, D., Rana, N. & Slade, E. (2015b). Driving innovation using big open linked data (BOLD) panel. Proceedings of the 14th IFIP WG 6.11 Conference on e-Business, e-Services, and e-Society. 13-15 October, Delft, The Netherlands.
Ferro, E., Loukis, E., Charalabidis, Y. & Osella, M. (2013). Policy making 2.0: From theory to practice. Government Information Quarterly. 30(4), 359-368.
Gandomi, A. & Haider, M. (2015). Beyond the hype: Big data concepts, methods, and analytics. International Journal of Information Management. 35(2), 137-144.
25
Driving Innovation through Big Open Linked Data (BOLD)
Hauser, J., Tellis, G. & Griffin, A. (2006). Research on innovation: A review and agenda for Marketing Science. Marketing Science. 25(6), 687-717.
Holland, J. H. (1996). Hidden order. How adaptation creates complexity. Reading, MA: Addison Wesley.
Hossain, M. A., Dwivedi, Y. K., & Rana, N. P. (2016). State of the Art in Open Data Research: Insights from Existing Literature and a Research Agenda. Journal of Organizational Computing and Electronic Commerce, 26(1-2), 14-40.
Hota, C., Upadhyaya, S., & Al-Karaki, J. N. (2015). Advances in secure knowledge management in the big data era. Information Systems Frontiers. 17(5), 983-986.
Hughes, D. L., Dwivedi, Y. K., Simintiras, A. C., & Rana, N. P. (2015).Success and Failure of IS/IT Projects: A State of the Art Analysis and Future Directions. SpringerBriefs in Information Systems, Springer International Publishing, available at: http://link.springer.com/book/10.1007%2F978-3-319-23000-9.
Janssen, M. & Kuk, G. (2016). Big and open linked data (BOLD) in research, policy and practice. Journal of Organizational Computing and Electronic Commerce. 26(1-2), 3-13.
Janssen, M., Matheus, R. & Zuiderwijk, A. (2015). Big and open linked data (BOLD) to create smart cities and citizens: Insights from smart energy and mobility cases. Proceedings of the 14th IFIP WG 8.5 International Conference on EGOV. 30 August-2 September, Thessaloniki, Greece.
Janssen, M., Charalabidis, Y. & Zuiderwijk, A. (2012). Benefits, adoption barriers and myths of open data and open government. Information Systems Management. 29(4), 258-268.
Jetzek, T., Avital, M. & Bjorn-Andersen, N. (2014). Data-driven innovation through open government data. Journal of Theoretical and Applied Electronic Commerce Research. 9(2), 100-120.
Jharkharia, S. & Shankar, R. (2005). IT-enablement of supply chains: understanding the barriers. Journal of Enterprise Information Management. 18(1), 11-27.
Kankanhalli, A., Hahn, J., Tan, S., & Gao, G. (2016). Big data and analytics in healthcare: Introduction to the special section. Information Systems Frontiers. 18(2), 233-235.
Lassinantti, J., Bergvall-Kåreborn, B. & Ståhlbröst, A. (2014). Shaping local open data initiatives: Politics and implications. Journal of Theoretical and Applied Electronic Commerce Research. 9(2), 17-33.
Mandal, A., & Deshmukh, S. G. (1994). Vendor selection using interpretive structural modelling (ISM). International Journal of Operations & Production Management, 14(6), 52-59.
McKinsey & Company (2011). Big Data: The Next Frontier for Innovation, Competition and Productivity. Accessed from file:///C:/Users/Emma%20Slade/Downloads/MGI_big_ data_full_report.pdf. Accessed on 8 November 2015.
Nugroho, R. P., Zuiderwijk, A., Janssen, M., & de Jong, M. (2015). A comparison of national open data policies: lessons learned. Transforming Government: People, Process and Policy, 9(3), 286-308.
Open Government Partnership (2014). Annual Report. Accessed from http://www.opengovpartnership.org/sites/default/files/attachments/2014%20OGP%20Annual%20Report.pdf. Accessed on 8 November 2015.
Park, S-H., Huh, S-Y., Oh, W. & Han, S. (2012). A social network-based inference model for validating customer profile data. MIS Quarterly. 36(4), 1217-1237.
Sage, A. P. (1977). Interpretive Structural Modelling: Methodology for Large Scale Systems. New York. New York: McGraw-Hill.
26

Driving Innovation through Big Open Linked Data (BOLD)
Sayogo, D., Zhang, J., Pardo, T., Tayi, G. & Hrdinova, J. (2014). Going beyond open data: Challenges and motivations for smart disclosure in ethical consumption. Journal of Theoretical and Applied Electronic Commerce Research. 9(2), 1-16.
Shadbolt, N., O’Hara, K., Berners-Lee, T., Gibbins, N., Glaser, H., Hall, W. & Schraefel, M. (2012). Linked open government data: Lessons from Data.gov.uk. IEEE Intelligent Systems. 27(3), 16-24.
Singh, R. K., S. K. Garg, & S. G. Deshmukh. (2007). Interpretive structural modelling of factors for improving competitiveness of SMEs. International Journal of Productivity and Quality Management. 2(4), 423-440.
Susha, I., Grönlund, Å., & Janssen, M. (2015). Organizational measures to stimulate user engagement with open data. Transforming Government: People, Process and Policy, 9(2), 181-206.
Talib, F., Rahman, Z. & Qureshi, M.N. (2011). An interpretive structural modelling approach for modelling the practices of total quality management in service sector. International Journal of Modelling in Operations Management. 1(3), 223-250.
Van der Panne, G., Van Beers, C. & Kleinknecht, A. (2003). Success and failure of innovation: A literature review. International Journal of Innovation Management. 7(3), 1-30.
Warfield, J. N. (1974). Toward interpretation of complex structural models. IEEE Transactions on Systems, Man and Cybernetics. 4(5), 405-417.
Zuiderwijk, A., Janssen, M. & Dwivedi, Y. (2015). Acceptance and use predictors of open data technologies: Drawing upon the unified theory of acceptance and use of technology. Government Information Quarterly. Doi:10.1016/j.giq.2015.09.005.
Zuiderwijk, A. & Janssen, M. (2014). The negative effects of open government data – Investiating the dark side of open data. Proceedings of the 15th Annual International Conference on Digital Government Research. 18-21 June, Aguascalientes City, Mexico.
Zuiderwijk, A., Helbig, N., Gil-García, R. & Janssen, M. (2014). Special issue on innovation through open data – A review of the state-of-the-art and an emerging research agenda: Guest editors’ introduction. Journal of Theoretical and Applied Electronic Commerce Research. 9(2), I-XIII.
27

Driving Innovation through Big Open Linked Data (BOLD)
Authors’ Biography
Yogesh K. Dwivedi is a Professor of Digital and Social Media and Director of Research in the School of Management at Swansea University, Wales, UK. His research interests are in the area of Information Systems (IS) including the adoption and diffusion of emerging ICTs and digital and social media marketing. He has published more than 200 articles in a range of leading academic journals and conferences. He has co-edited more than 15 books on technology adoption, e-government and IS theory and had them published by international publishers such as Springer, Routledge, and Emerald. He acted as co-editor of fifteen special issues; organised tracks, mini-tracks and panels in leading conferences; and served as programme co-chair of IFIP WG 8.6 Conference. He is Associate Editor of European Journal of Marketing and Government Information Quarterly, Assistant Editor of JEIM and Senior Editor of Journal of Electronic Commerce Research.
Marijn Janssen is a full Professor in ICT & Governance and chair of the Information and Communication Technology section of the Technology, Policy and Management Faculty of Delft University of Technology. His research interests are in the field of orchestration, (shared) services, open and big data and infrastructures. He is Co-Editor-in-Chief of Government Information Quarterly, conference chair of IFIP EGOV2016 and is chairing mini-tracks at the DG.o, ICEGOV, HICCS and AMCIS conferences. He was ranked as one of the leading e-government researchers in a survey in 2009 and 2014 and has published over 350 refereed publications. More information: www.tbm.tudelft.nl/marijnj.
Dr Emma L. Slade is Deputy Director of Postgraduate Research in the School of Management, Swansea University, UK. She has a PhD and MSc with Distinction in Business Management. Emma is working on a variety of research topics across marketing and information systems, including citizen engagement with political parties on social media, adoption of mobile payment systems, effect of cyber-slacking on student engagement, and diffusion of green IT/IS. Emma has published articles in a number of highly regarded journals including Computers and Human Behaviour, Psychology & Marketing, Journal of Strategic Marketing, and Journal of Computer Information systems.
Nripendra P Rana is an Associate Professor in the School of Management at Swansea University, UK. With an academic and professional background in Mathematics and Computer Science and with PhD in Information Systems, his current research interests focus primarily upon adoption of emerging and cutting edge technology in general and e-government, m-government, e-commerce and m-commerce systems in particular. His work has been published in leading academic journals including European Journal of Marketing, Information Systems Frontiers, Government Information Quarterly and Computers in Human Behavior. He has also presented his research in international conferences such as ECIS, PACIS, AMC, IFIP EGOV, IFIP WG 8.6 and UKAIS.
Vishanth Weerakkody is a Professor of Digital Governance at the Business School in Brunel University London. Prior to his academic career, Vishanth worked in a number of multinational organisations in the area of software engineering and business systems design.
28

Driving Innovation through Big Open Linked Data (BOLD)
His research expertise lies in the area of electronic service delivery, technology adoption, diffusion, evaluation and policy modelling in the public sector context. He has published over 150 peer reviewed articles and guest-edited special issues of leading journals and books on these themes. He is currently involved in several R&D projects funded by the European Commission and other internationally bodies encompassing topics such as citizens' participation in public sector policy making to social innovation and life-long-learning. He is the Editor in chief of the International Journal of Electronic Government Research.
Jeremy Millard, Senior Research Fellow at Brunel University (London), works with governments, development agencies, and private and civil sectors in all parts of the world. In the last twenty years he has focused on how new technical and organisational innovations transform government and the public sector, including the role of big data. Recent assignments for the European Commission include studies on administrative burden reduction and business models for ICT and ageing. Jeremy also works for the UN on eGovernment and meeting the 2030 sustainable development agenda through innovative service delivery, good governance and big data.
Jan Hidders is associate professor in data management in the Web Information Systems Engineering group of the Computer Science Department at Vrije Universiteit Brussel. His research interests include data integration, data indexing, data linking and large scale data processing, particularly in the domain of graph processing. He has published in conferences such as ICDE, CCGRID, ICDT, CIKM, IUI, FoIKS, ICWE and ISWC, and in journals such as Information Systems, Fundamenta Informaticae, Theory of Computing Systems and Journal of Computer and System Sciences. He has organised several workshops on big data processing such as SWEET and BeyondMR, and the EDBT Summer School on Graph Data Management.
Dr. Dhoya Snijders works for STT, the Dutch Study Center for Technology Trends, and is currently carrying out a technology foresight study on big data. He holds an MA in Philosophy from the University of Amsterdam, an MSc in Public Information Management from the Erasmus University Rotterdam and a PhD in Organizational Sciences from the VU University. He worked as a consultant for some years in the field of e-Government and carried out national and international projects on ICT governance, Open Data, and Big Data. During this time he published on the implementation of ICT in a context of multilevel governance.
29