BUPA ANNUAL REPORT 2014 · 2020-02-04 · BUPA ANNUAL REPORT 2014 STRATEGIC REPORT. 79,000...
138
Annual Report 2014 bupa.com/annualreport Lg, הali, happi li
Transcript of BUPA ANNUAL REPORT 2014 · 2020-02-04 · BUPA ANNUAL REPORT 2014 STRATEGIC REPORT. 79,000...

Annual Report 2014
bupa.com/annualreport
Longer, healthier, happier lives
BU
PA A
NN
UA
L RE
PO
RT 20
14

THAT’S RIGH
T FOR
ME
IN HEALTHCARE – MAKING A DIFFERENCE
PROVIDING ACCESS TO A
DV
ICE
AN
D C
AR
E
AF
FO
RD
AB
LE A
ND
ACCESSIBLE
MA
KIN
G Q
UA
LITY
HEA
LTHCARE
L�g�,�al�i�,
happi� li�
TACKLING THE TOUGHEST CHALLENGES
LO
VE
WO
RKING
AT B
UPA
PE
OPLE
MILLIONS MORE PEOPLEA HEALTHCARE PARTNER TO
AROUND THE WORLD
BUSI
NE
SS
PERFOR
MA
NC
E
EXTRAOR
DIN
AR
Y
Our purpose
Longer, healthier, happier lives is Bupa’s purpose and at the heart
of everything we do.
Bupa 2020 is our strategic vision outlining how we will fulfil our purpose and help millions of people enjoy better health.
FIND OUT MORE ABOUT OUR
BUSINESS MODEL OVERLEAF AND
ON PAGE 2
BUPA 2020
READ MORE ABOUT OUR VISION ON PAGE 8
iBUPA ANNUAL REPORT 2014
STRATEGIC REPORT

Our business model
For more information about
Bupa’s purpose, visit: bupa.com/annualreport
Bupa is a global healthcare company with unique breadth, scale, influence and expertise.
We fund healthcare through our insurance and subscriptions
businesses.
We provide healthcare through our clinics, hospitals and care
homes, as well as in the workplace and at home.
We engage people in their health, helping them to adopt healthier
lifestyles and reduce health risks, as well as partnering
with governments and others to improve healthcare systems and policies.
We believe integrated healthcare, with all parts of the healthcare system working together, is the
future of healthcare delivery. We have an unrivalled breadth of healthcare and commercial
expertise which enables us to deliver integrated healthcare in a
number of our markets.
Our status as a private company, limited by guarantee, means
we have no shareholders and are not driven by short-term profit.
This means we behave commercially and focus on
our customers, whilst taking a long-term view and reinvesting our profit to provide more and better healthcare, fulfilling our
purpose: longer, healthier, happier lives.
iiBUPA ANNUAL REPORT 2014
STRATEGIC REPORT
PRO
VID
EFU
ND
ENGAGE
HEALTH AND WELLBEING SERVICES
AND TOOLSincluding telephone
helplines, apps and online tools to encourage
healthier choices
HEALTH INSURANCE
funding quality healthcare for our
customers
Longer,healthier,
happier livesINTERNATIONAL HEALTH
INSURANCEfor people who want access to
insurance products and services
worldwide
OTHER FUNDING PRODUCTS
including medical subscriptions, cash
plans, travel and micro health
insurance
CONSUMER ADVOCACY AND
CAMPAIGNSon subjects including
health system improvements,
dementia care, and healthy lifestyles

Capital reinvested in 2014
£595m
FOR MORE INFORMATION PLEASE GO TO OUR MARKETPLACE ON PAGES 4–5
FOR CUSTOMERS
Delivering accessible quality healthcare products and services to meet a wide
range of healthcare needs.
FOR SOCIETY
Partnering to improve healthcare systems; engaging millions of people with wellness tools and information;
making a positive impact on the environment.
FOR OUR PEOPLE
Helping our people to be healthier because they work at Bupa and make a positive impact in our communities.
REINVESTMENT
With no shareholders we have a long-term perspective and reinvest
our profit to fulfil our purpose.
PRO
VID
EFU
ND
ENGAGE
CLINICSincluding outpatient, diagnostic, dental, optical, primary care, and other wellness services
AGED CAREincluding specialist dementia care, retirement villages, respite care, and long term care
PARTNERSHIPSwith NGOs, companies and others to improve the health of the world
Longer,healthier,
happier livesHOSPITALS AND HOME HEALTHCARE SERVICESincluding 15 hospitals across the world

Our 2014 performance
HEALTHCARE PARTNER TO MILLIONS MORE PEOPLE
We focused on making quality healthcare more affordable and
accessible and cemented stakeholder partnerships to increase our impact
on the world’s health
EXTRAORDINARY BUSINESS PERFORMANCE
We built momentum towards strong and sustainable financial
performance, providing us with the means to fulfil
our purpose
PEOPLE LOVE WORKING AT BUPA
We focused on creating an environment where everyone can perform at their best and be supported to take care of
their health and wellbeing
Employee engagement6
68% 1%
Performance excellence
75% 3%
Leadership7
69%
Customer numbers
28.7m 31%
Health engagement1
134m 34%
Revenue
£9.8bn 8% AER2
15% CER3
Underlying profit4
£637.8m 0% AER 8% CER
Carbon footprint reduction5
14% 1%
CONTENTS
i Strategic report
i Our purpose
ii Our business model
2 Our world
3 Chairman’s statement
4 Our marketplace
6 Our KPIs
8 CEO’s statement
10 Market Unit reports
20 Financial review
24 Risk
28 Governance
28 Governance report
46 Remuneration report
58 Financial statements
1 Our health engagement indicator measures the number of times we have engaged people in their health and wellbeing over the year. See page 7.
2 Actual Exchange Rates. 3 Constant Exchange Rates.
4 For our definition of underlying profit, please see page 21.
5 Our target to reduce absolute carbon emissions by 20% by the end of 2015 is based on a 2009 baseline and is reported in line with the Greenhouse Gas Protocol Standard.
6 The people love working at Bupa metrics come from measures in our Global People Survey, completed by 83% of our people in 2014.
7 We introduced our leadership index in 2014 so we do not have comparable data from previous years.
Good health depends on a healthy environment. This icon highlights our progress towards our sustainable business goals. You can find out more on pages 9, 10, 12, 14, 16, 19 and 23.
FIND OUT MORE ABOUT OUR PERFORMANCE ON PAGES 6-7
STR
AT
EG
IC R
EP
OR
T
1BUPA ANNUAL REPORT 2014
STRATEGIC REPORT

79,000employees
29mcustomers29m
customersin
190countries
in
190countries
Dentists and dental nurses
20,900carers and
healthcare assistants
Customer service and specialist support
Customer service and specialist support
Care servicesProviding care and
support to the elderly
Customer and corporate servicesO�ering customer advice and support
across all our services Medical services
Providing specialist medical and clinical services and
expertise
443 care homes
31retirement villages
125 o�ces
215retail centres
113wellness centres
205clinics
15hospitals
366dental centres
26optical centres
6,300doctors
Sports therapists
Opticians andoptometrists
Dietitians Pharmacists
8,400nurses
Radiographers
CounsellorsCounsellors
PhysiotherapistsPhysiotherapists
Corporate services
Corporate services
Health coaches
Our world
We are a global healthcare company delivering a broad range of services to fund and
provide healthcare for our 29m customers in over
190 countries. Our 79,000 people provide specialist
expertise and support every step of the way.
2BUPA ANNUAL REPORT 2014
STRATEGIC REPORT

79,000employees
29mcustomers29m
customersin
190countries
in
190countries
Dentists and dental nurses
20,900carers and
healthcare assistants
Customer service and specialist support
Customer service and specialist support
Care servicesProviding care and
support to the elderly
Customer and corporate servicesO�ering customer advice and support
across all our services Medical services
Providing specialist medical and clinical services and
expertise
443 care homes
31retirement villages
125 o�ces
215retail centres
113wellness centres
205clinics
15hospitals
366dental centres
26optical centres
6,300doctors
Sports therapists
Opticians andoptometrists
Dietitians Pharmacists
8,400nurses
Radiographers
CounsellorsCounsellors
PhysiotherapistsPhysiotherapists
Corporate services
Corporate services
Health coaches
Chairman’s statement
Lord Leitch Chairman
During 2014 we made good progress towards our Bupa 2020 strategic vision, which
was developed and communicated in 2012. Our diversified portfolio, broad geographic footprint and
increased healthcare expertise means we are well
positioned to fulfil our purpose: longer, healthier,
happier lives.
Over the year we have been focused on delivering growth from all our businesses while continuing the integration of our recent acquisitions.
The acquisitions made in 2013 and early 2014 have expanded our scale and impact and we are pleased with the contributions these businesses have made this year.
In 2015 we will continue to focus on delivering growth from all our businesses.
Our 78,900 people are embracing our Bupa 2020 vision, and we are making progress across the business in realising our long-term ambitions to be a healthcare partner to millions more people, deliver extraordinary business performance, and be a place where people love working.
As part of our efforts to increase our impact on world health, we strengthened our relationships across a wide network of strategic partners, including Alzheimer’s Disease International, the World Heart Federation, the Union for International Cancer Control, the International Telecommunication Union and the World Health Organization. We also continued our efforts to make a positive environmental impact, establishing a dedicated £50m Energy Saver Fund to invest in carbon reduction projects in order to reduce both our underlying operating costs and our carbon footprint, targeting a 20% absolute carbon reduction by the end of 2015.
2014 BOARD AND EXECUTIVE CHANGES
The Rt Hon Patricia Hewitt decided not to seek re-election as a Non-Executive of the Board in April. I’d like to thank her for her valued contribution and the insight she brought. Peter Cawdron also stepped down at the AGM in June 2014, having come to the end of his term of office. To read more about our future plans for the Board, go to page 28.
Within the Bupa Executive Team, Steve John, Corporate Affairs Director, Yasmin Jetha, Chief Information Officer, Alison Platt, Managing Director, International Development Markets, and Denise Collis, Chief People Officer left Bupa. They were succeeded by Alex Cole, Garry Fingland, David Fletcher, and Joy Linton, followed by Elisa Nardi respectively.
Alan Buchanan, the Company Secretary, left in May and Julian Sanders has been appointed to the role.
Our thanks go to Steve, Yasmin, Alison, Denise and Alan for all their contributions.
Bupa is an organisation whose success comes from the passion and care of our extraordinary people. The Board and I would like to thank all of our people for their hard work and commitment, delivering another successful year for Bupa and fulfilling our purpose: longer, healthier, happier lives.
STRATEGIC REPORT
Our 2014 Strategic Report, from pages i to 27, has been reviewed and approved by the Board of Directors on 4 March 2015.
By order of the Board,
Lord Leitch Chairman
STR
AT
EG
IC R
EP
OR
T
3BUPA ANNUAL REPORT 2014
STRATEGIC REPORT

Our marketplace
PERSON-CENTRED CARE
Patients with challenging long-term conditions often have complex needs and require the support of more than one specialist or healthcare provider. In the past, there was typically limited coordination or information sharing between providers of healthcare. This sometimes leads to duplicated efforts and a confusing healthcare experience for consumers. As a result, healthcare is becoming more personalised and delivered to the customer in their chosen setting. Providers are working together to make sure care is high quality and more cost-effective.
CHANGING GOVERNMENT AGENDAS
Growth in healthcare spending continues to surpass GDP growth, which means the sustainability of healthcare costs is prompting public debate in many markets. At the same time, governments recognise that many conditions are preventable through healthier lifestyles. This is leading to greater government focus on prevention, as healthcare systems can no longer afford to focus only on reactive treatment. Governments are increasingly investing in campaigns on issues such as smoking cessation, healthy eating and exercise.
Employers are also beginning to invest in workplace wellness schemes to encourage their people to adopt and maintain healthier lifestyles.
Our aim is to improve the health of millions of people
across the globe. With 28.7m customers in 190 countries,
we are seeing significant changes in the health and care environment. We are
using our expertise, influence, global scale and reach to help address the unprecedented
demands that face healthcare systems, governments,
businesses and people across the world.
CHANGING HEALTHCARE NEEDS
Around the world, people’s healthcare needs continue to evolve. Long-term conditions including heart disease, cancer and diabetes are rising as a result of unhealthy lifestyles and an ageing population. Age-related diseases, such as dementia, are also increasing as people live longer. Urbanisation is contributing to a rise in chronic conditions as people who move to cities increase their healthcare risks through unhealthy diets, limited physical activity and increased exposure to urban air pollution. Although some people are becoming more health conscious, risk factors, such as obesity, are becoming more prevalent. Overall, the changing nature of illness poses significant organisational and cost challenges for healthcare systems and governments across the world, and is driving changes in how healthcare is both funded and delivered.
MOVING CARE OUT OF THE HOSPITAL
The rise in long-term conditions is leading to a shift in care environments as hospitals are not designed to manage long-term conditions. There are growing numbers of integrated care models that use primary and intermediate care services – such as GPs and community nurses – in new ways to bring about high quality, cost effective healthcare that is often more convenient for the customer. Developments in technology are contributing to providers’ ability to deliver care in alternative and even remote locations.
PAYING FOR OUTCOMES RATHER THAN SERVICE
Traditional funding and payment models, such as ‘fee-for-service’, are more suited to unpredictable acute illness or events. Some governments are now looking at new evaluation and payment systems that, they hope, will lead to better outcomes and more efficient use of resources. Funders are also increasingly wary when it comes to paying for unnecessary, expensive treatments, or treatments for which there is little clinical evidence. As a result, there is a shift towards risk-sharing agreements between funders and providers in order to provide better quality healthcare outcomes at sustainable prices for the benefit of the customer.
4BUPA ANNUAL REPORT 2014
STRATEGIC REPORT

MARKET SPECIFICS
Dean Holden MD of Australia and New Zealand Market Unit
AUSTRALIA AND NEW ZEALAND
“In Australia, the private health insurance market is competitive with increasing consumer switching between health insurers. Comprehensive aged care reforms were implemented in 2014, giving consumers greater choice and control over how they pay for care. In New Zealand the economy continues to grow and the government is focused on improving public services. There is increasing government appetite in both markets for collaboration with the private sector.”
GO TO PAGE 10MARKET
UNITREPORT
Richard Bowden MD of United Kingdom Market Unit
UNITED KINGDOM
“The UK health insurance sector continues to be challenging, although we are beginning to see early signs of growth in both the corporate and SME sectors. Sector-wide pressures in care services include increased running costs for staffing, utilities and catering while, in many areas, fees for local authority funded residents continue to increase less than inflation.”
GO TO PAGE 12MARKET
UNITREPORT
Iñaki Ereño MD of Spain and Latin America Domestic Market Unit
SPAIN AND LATIN AMERICA DOMESTIC
“Economic conditions in Spain are still tough and unemployment levels are high. Government budget cuts are continuing to affect the Spanish health system and satisfaction with public healthcare is declining. In the Chilean market, the economic outlook is positive. Health is a high growth sector in Chile, driven by year-on-year increases in healthcare expenditure over more than a decade.”
GO TO PAGE 14MARKET
UNITREPORT
David Fletcher MD of International Development Markets
INTERNATIONAL DEVELOPMENT MARKETS
“In 2014 we saw a general slowdown in emerging market economies and weakening of exchange rates, while political and social changes in the markets in which IDM operates have presented opportunities and challenges.”
GO TO PAGE 16MARKET
UNITREPORT
Robert Lang MD of Bupa Global Market Unit
BUPA GLOBAL
“During 2014, we saw a continued trend towards mandatory health cover regimes in a number of countries in which we operate. We continue to monitor such developments closely to ensure our products remain a distinctive, premium and international alternative, addressing more than minimum local cover requirements and providing competitive advantage.”
GO TO PAGE 18MARKET
UNITREPORT
CHANGES IN PATIENT EXPECTATIONS
Customers are becoming increasingly empowered. There has been a radical transformation in the quantity of health data and information that is available, and digital technology means such information is easily accessible. This has resulted in higher expectations from customers to have a greater involvement in decisions relating to their health. Growing middle classes, particularly in emerging economies, continue to expect more from their healthcare providers in particular. Demand is also growing for increasingly personalised care as well as access to healthcare services, where and when customers need them.
What this means for our customers
Overall, the needs and expectations of our customers continue to evolve. They often have varying levels of need, from focusing on staying healthy to managing long-term conditions. At the same time customers are looking for more flexible and personalised care and guidance in understanding healthcare information and choices, and navigating complex healthcare systems.
What this means for us
In order to meet the changing needs of our customers this means putting them at the centre, listening to what they say and providing guidance that addresses their needs. We are working to ensure that they have a seamless experience between our healthcare funding and provision businesses and we work with other healthcare providers to make sure customers get the right care in a location that meets their needs. We are also focusing on prevention, encouraging people all over the world to adopt healthier lifestyles.
STR
AT
EG
IC R
EP
OR
T
5BUPA ANNUAL REPORT 2014
STRATEGIC REPORT

Our KPIs
We track our performance against a number of key performance indicators which are aligned to our
Bupa 2020 strategic vision.
HEALTHCARE PARTNER TO MILLIONS
MORE PEOPLE
PEOPLE LOVE WORKING AT BUPA
We believe that engaging millions more people in their health is best done in partnership with other organisations, including other companies, non-governmental organisations and the public sector. We work across different sectors so that each organisation makes a unique contribution. For example,we collaborate closely with Alzheimer’s Disease International (ADI) to create public health campaigns on dementia awareness and risk reduction. For the last two years, we have supported ADI’s World Alzheimer Report. In 2014, the report examined the latest evidence on the disease, finding that the risk of developing dementia may be reduced by adopting healthier lifestyles.
We are powered by the purpose, passion and contribution of our people and know we excel when our people love working here. We continue to make the health, safety and wellbeing of our people a priority and we want our people to be healthier because they work at Bupa. This year, we focused on creating a healthy culture through leadership. As part of this, we have run ‘Performance Energy’ workshops in each Market Unit, coaching our leaders on techniques to maintain their energy and effectiveness both inside and outside of work. We have also created an online toolkit so that our leaders can share these techniques more widely within their teams and across Bupa.
EXTRAORDINARYBUSINESS
PERFORMANCE
We are now the Australian government’s medical services delivery partner, providing visa health checks and a range of other medical services. The newly created business, Bupa Medical Visa Services, will carry out an estimated 275,000 visa medical assessments a year. Since opening in August, the business has already made strong contributions to revenue and customer growth in Australia. Health assessments take place in one of our six purpose-built medical clinics and we also manage a network of approved medical clinics for regional areas. Our work ensures that people applying for visas satisfy Australia’s migration health requirements.
6BUPA ANNUAL REPORT 2014
STRATEGIC REPORT

SEE HOW OUR MARKET UNITS ARE PERFORMING ON PAGES 10–19
KPICustomer numbers
28.7m 31%
KPIRevenue
£9.8bn 8% AER 15% CER
KPIEmployee engagement
68% 1%
KPIHealth engagement1
134m 35%
KPIUnderlying profit
£637.8m 0% AER 8% CER
KPIPerformance excellence
75% 3%
KPICarbon footprint reduction2
14% 1%
KPILeadership3
69%
TREND2014 2013 2012
28.7m
21.9m
14m
TREND2014 2013 2012
£9.8bn
£9.1bn
£8.4bn
TREND2014 2013 2012
68%
67%
72%
TREND2014 2013 2012
134m
99m
TREND2014 2013 2012
£637.8m
£638.5m
£609.5m
TREND2014 2013 2012
75%
73%
75%
TREND2014 2013 2012
14%
13%
10%
TREND2014 69%
2014 has seen us make significant progress on our journey to be a healthcare partner to millions more people around the world. The momentum of 2013 continued into 2014, with a 31% increase in customers achieved through both organic growth and acquisition. We saw significant growth in many of our businesses, notably LUX MED, our 2013 Polish acquisition; Bupa Arabia, one of our joint ventures; and our Australian insurance and health provision businesses. We acquired a controlling stake in Chilean healthcare provider Cruz Blanca Salud (now rebranded Bupa Chile), marking Bupa’s entry into one of Latin America’s most attractive markets, and also extended the provision of our micro health insurance scheme in Ghana.
We are committed to delivering solid and sustainable financial performance, and investing in activities that create long-term economic value. We continue to see good revenue growth, up 15% at CER to £9.8bn, reflecting the full year impact of our recent acquisitions and solid performance in our established markets. Over 65% of Bupa’s revenue is generated by international operations, reflecting our truly global footprint. Strong business performance means we are well-resourced to be a healthcare partner to millions more people.
In 2014, 83% of our people completed our Global People Survey (GPS), our biggest response to date with an increase of 6,077 employees compared with 2013. Within the GPS, we measure pride, satisfaction, advocacy and commitment. From this we reach our employee engagement index. This year, employee engagement improved slightly, demonstrating strong understanding and connection to our purpose and the continued commitment of our people to achieving our ambitious goals.
Our ambition is to engage millions of people around the world in their health and wellbeing, enabling them to make simple and positive changes to be healthier. In 2014 we created 134m points of engagement across both our customers and wider society through activities, including health assessments, websites, social and other media, events and health programmes. As well as increasing our activities, we are also now able to measure more of our engagement following improvements to our reporting capabilities. On a like-for-like basis our 2013 figure was 99m, exceeding the 29m reported at the time. Having surpassed our original target of 60m by 2015, we are establishing new Bupa 2020 milestones.
We maintained underlying profit at £637.8m, up 8% at CER. This reflects good growth in both our new and established businesses. With no shareholders, our profit is reinvested to provide more and better healthcare for our current and future customers, to fulfil our purpose more broadly in society.
Please see page 21 for our definition of underlying profit.
Within our GPS, our performance excellence index measures our commitment to delivering high quality products and customer service and how enabled our people feel in delivering for our customers. It draws from a cross-section of indicators including training, speed of response to customers and perception of leadership commitment to high quality products, services and care. We have made good progress in our performance excellence index, up 3% to 75%.
Over 2014 we have invested over £25m in projects to enhance energy efficiency and clean energy generation on our sites. This, along with the certified green electricity we purchase, has led to a reduction of 14% in carbon emissions from our 2009 baseline. We expect to see a further reduction from these projects during 2015. A further £25m will be invested in low carbon technology and renewable energy in the coming year. By measuring and reducing the energy we use and the carbon it generates, we can positively impact illnesses related to air pollution as well as reduce operating costs.
Our leadership index, new for 2014, measures the extent to which our people see our leaders as committed to continuously growing themselves, to grow others, to grow the business, to improve the health of the world. Over the past year, we have focused on expanding our ‘Bupa Leaders Are’ programme to 1,000 leaders around the world. It is also becoming part of the fabric of Bupa through leadership events, performance management, recruitment, and development.
1 2013 has been restated to include all points of engagement on health in line with those measured in 2014. 2012 has not been restated as not all points of engagement were measured in that year.
2 Our target to reduce absolute carbon emissions by 20% by the end of 2015 is based on a 2009 baseline and is reported in line with the Greenhouse Gas Protocol Standard. 2012 and 2013 data has been restated to include acquisitions, disposals and certified green electricity purchase.
3 We introduced our leadership index in 2014 so we do not have comparable data from previous years.
18m
STR
AT
EG
IC R
EP
OR
T
7BUPA ANNUAL REPORT 2014
STRATEGIC REPORT

CEO’s statement
Stuart FletcherChief Executive Officer
In 2014 we continued to deliver good, sustainable financial performance by
focusing on growing all our businesses, integrating
recently acquired companies and improving operational
effectiveness. We grew revenue by 15% to £9.8bn and
underlying profit by 8% to £637.8m at constant exchange rates as we
continued to invest in new products, services
and operations to support future growth.
OUR BUPA 2020 VISION
We have an ambitious strategic vision for what Bupa will look like in 2020 (see page i). It outlines what we will achieve and what Bupa will be known for in that year.
Extraordinary business performance means strong, sustainable revenue and profit growth and, as we have no shareholders, reinvesting our profit to better fulfil our purpose. Financial discipline means we can invest to create long-term economic value and make a positive impact on world health and the environment.
Crucially, we will deliver our purpose by being a healthcare partner to millions more people around the world. Not only will our customers enjoy better health, but we will engage more people around the world in their health and wellbeing.
We also want to make a huge impact for our customers. Our ambition is that by 2020 people will know Bupa for: providing access to advice and care that’s right for them; making quality healthcare affordable and accessible; and tackling the toughest challenges in healthcare.
We know we excel when our people love working at Bupa. We want to create an extraordinary culture and make sure our people are healthier because they work here, and can make a big impact in their communities.
PERFORMANCE
We are making good progress towards our Bupa 2020 vision, creating a strong platform for the future.
We delivered good revenue growth, and grew customer numbers strongly by 31% to 28.7m, with 11% of the growth through the acquisition of Cruz Blanca Salud (now
rebranded Bupa Chile), 6% from joint ventures and associates, 2% from our micro health insurance initiatives in India and Ghana, and 12% from the rest of the business. We maintained underlying profit and reinvested capital totalling £595m to support future growth. At constant exchange rates, revenue grew 15% and underlying profit was up 8%. Excluding recently acquired businesses1 and associated financing costs2, revenue and underlying profit were both up 6% at CER. Statutory profit rose 18% to £609.2m.
This year, we took significant steps to transform the business to enable us to deliver sustainable financial performance and fulfil Bupa 2020. This included increasing operational effectiveness across all Market Units, including delivering £30m of cost savings in the UK, by improving efficiency in key back office processes and procurement, and by streamlining the sales organisation. We also began to restructure and regionalise operations in our Bupa Global Market Unit to better serve our customers in their own language, culture and time zone. In Australia, we significantly expanded our healthcare provision footprint, with the launch of Bupa Medical Visa Services in July and Bupa GP Clinics in October.
In our established markets, we saw a particularly strong performance from Australia and New Zealand, where we are differentiating our business through the quality and breadth of our service. In the UK we delivered a second year of growth, benefiting in particular from our focus on efficiency and management of operating costs. We also continue to lead reform in the UK private healthcare market through our ongoing drive to reduce healthcare costs, including those charged by private hospitals, to deliver better value for customers. In November, we signed a ground-breaking contract with Spire Healthcare, commencing in 2015, agreeing prices until 2021.
We have swiftly embedded recent acquisitions and these businesses made a strong contribution to our performance in 2014. Bupa Chile is performing well and during the final quarter of 2014, we began to migrate the branding of parts of the business to the Bupa brand. In Australia, we began promoting Bupa Dental Corporation’s clinics to our health insurance customers and vice versa. We also increased the number of Bupa Dental Corporation practices that are part of our health insurance customer network to over 110. In Poland, we are focused on developing LUX MED’s integrated healthcare funding
Revenue
£9.8bn 8% AER 15% CER
Underlying profit
£637.8m 0% AER 8% CER
Total customers
28.7m 31%
1 Businesses acquired in 2013 and 2014, most notably Innovative Care, LUX MED, Dental Corporation, Quality HealthCare and Cruz Blanca Salud.
2 Adjusted for the impact on our net financial expense for the cost of additional borrowings used to finance acquisitions.
8BUPA ANNUAL REPORT 2014
STRATEGIC REPORT

and provision offering, as we believe this model brings better oversight of the patient journey and supports more affordable and accessible healthcare. In Hong Kong, we are embedding the Quality HealthCare clinic business into the organisation and in August opened a new premium medical centre.
We have a target to reduce absolute carbon emissions by 20% by the end of 2015 with 2009 being the baseline, measured in line with the Greenhouse Gas Protocol Standard. This year, we
decreased our carbon footprint by a further 1% to 14% despite our business growth. We have made strong improvements in our direct and indirect emissions through energy efficiency, clean energy generation on our sites and sourcing certified green tariff electricity, particularly in Spain. We have established a dedicated £50m Energy Saver Fund to invest in projects over 2014 and 2015 to reduce our operating costs, energy use and carbon emissions (see page 23).
HEALTHCARE PARTNER TO MILLIONS MORE PEOPLE
We continue to develop strategic partnerships to enable millions of people to improve their health and wellbeing.
We are committed to partnering with the public sector where our expertise can benefit patients and public health systems. The successful launch of Bupa Medical Visa Services, which provides health checks on behalf of the Australian Government to an estimated 275,000 visa applicants a year, is an example of this in practice. In the UK, we have developed a pioneering intermediate care service with Central Manchester University Hospital Foundation Trust, helping over 300 people back to good health without the need for a long hospital stay. We have also published an independently verified report about our Public-Private Partnership (PPP) in Valencia, Spain.
We are committed to engaging people more broadly in their health and wellbeing. We continued our partnership with the World Health Organization and the International Telecommunication Union on the global mobile health initiative, Be He@lthy, Be Mobile, to help address non-communicable diseases. We cemented our partnership with Alzheimer’s Disease International, as we continued to lobby for governments to adopt our joint Dementia Charter and develop National Dementia Plans. In
December, we published Cancer – it’s everyone’s business, with the Union for International Cancer Control. This report calls for new PPPs to combat cancer and achieve long-term change through workplace health initiatives. We also established a new Chief Medical Officers’ network to explore how we can combine the experience of a global network of clinicians in corporations to improve health and wellbeing.
A PLACE WHERE OUR PEOPLE LOVE TO WORK
I know that our success comes from the efforts of all of our 78,900 people and I thank them for their hard work and dedication.
We want each and every one of our people to love working at Bupa. Being a great place to work is an essential part of our Bupa 2020 vision. It is important to us as a business and it is also a big part of how we ensure we deliver excellent care and service for our customers. This year we have seen an increase in our employee engagement and performance excellence indices to 68% and 75% respectively.
We place great emphasis on leadership. Our focus is on ensuring our people live our values every day, creating an extraordinary working environment and empowering our people to play their part both at work and more widely in the communities we serve. Throughout 2014, we continued to invest in development and helping our people to be the best they can be. We have introduced a new KPI on leadership to measure progress in this area (see page 7).
Diversity is essential to our business – with customers in 190 countries, it is vital that we are able to better understand and meet their needs. Our executive team is varied in nationality, international experience and gender, with 31% female members. The representation of women in our senior management team is 42%, and across our global workforce is over 70%.
LOOKING FORWARD
In 2015, we will continue to focus on integrating and delivering performance from our acquired businesses, growing and developing all our businesses and driving operating efficiencies across Bupa. We will continue to innovate and develop products and services to meet the changing needs of our customers, with a focus on making healthcare more affordable and accessible. We will remain disciplined with our finances, particularly given ongoing trading conditions in the UK, Spain and Australia. Overall, I believe we are well positioned to drive growth and financial returns over the next year, reaching millions more people in fulfilment of our purpose: longer, healthier, happier lives.
Stuart Fletcher Chief Executive Officer
Hang Seng Bank Partnership
In April, Bupa entered into an exclusive 10-year distribution agreement with Hang Seng Bank to offer their three million customers a new range of health insurance products and services. Hang Seng customers will be offered a range of services that have been co-designed by Bupa and Hang Seng Bank to care for our customers throughout their lives. This opportunity confirms that bancassurance is a viable route to becoming a healthcare partner to millions more people, and creates a repeatable model for us to deliver extraordinary business performance going forwards. The next step in our partnership journey will be the launch of a similar set of products in mainland China in 2015.
Stuart Fletcher with Hang Seng Bank Vice-Chairman and Chief Executive, Rose Lee, at the signing ceremony.
STR
AT
EG
IC R
EP
OR
T
9BUPA ANNUAL REPORT 2014
STRATEGIC REPORT
MARKETUNIT
REPORT
Dean HoldenMD of Australia and New Zealand Market Unit
We have significantly expanded our healthcare
provision capability in Australia, with the launch of Bupa Medical Visa Services
and Bupa GP Clinics, supporting our purpose of
longer, healthier, happier lives. We have also delivered
growth in existing businesses and invested in the expansion of our care home footprint in Australia and New Zealand, increasing the number of
people with a direct customer relationship with Bupa.
In Australia we have Bupa Health Insurance, a leading health insurance provider and Bupa Health Services, our healthcare provision business, including dental, optical, medical visa, chronic disease management and GP services. We are also the largest privately-owned aged care provider in Australia and New Zealand, caring for 35,000 people.
PERFORMANCE
In 2014, Australia and New Zealand performed strongly as we focused on integrating recent acquisitions, launching our new Bupa Medical Visa Services business and delivering an industry-leading customer experience.
We delivered growth in revenue (at CER), customers and underlying profit, despite the increasingly competitive market and challenging political, economic and regulatory environment in Australia. Revenue and customer growth were supported by the full year contribution of Dental Corporation, acquired in 2013 and the launch of Bupa Medical Visa Services, as well as the performance of our Care Services businesses which opened five
new care homes throughout the year. Underlying profit was positively impacted by our 2013 acquisitions, as well as a good performance by our health insurance business and aged care businesses. Profit also benefited from a change in regulation, which enabled us to reassess the amount of money held as a risk margin against the provision for claims.
The integration of our 2013 acquisitions is progressing well. We began promoting Bupa Dental Corporation’s clinics as ‘part of Bupa’ and increased the number of Bupa Dental Corporation practices that are part of our health insurance customer network to over 110.
New care homes acquired as part of our 2013 purchase of Innovative Care are making a significant contribution to the performance of the Australian aged care business, with all key performance metrics ahead of expectations. We have entered into an agreement for the development and operation of six new care homes, consolidating our position as Australia’s largest privately-owned aged care provider. We also opened aged care homes in Runaway Bay (Queensland) and Templestowe (Victoria).
In New Zealand, we completed the purchase of the Cargill Aged Care facility in Invercargill. The new home adds 40 beds and a retirement village to our portfolio, reinforcing our position as the largest provider of aged care beds in New Zealand. The New Zealand business was also well supported by the opening of the Ballarat Village and care home in Rangiora, which opened with strong village sales.
In October, we began operating GP services in Australia for the first time (see the case study opposite).
In 2014, we committed around £4.2m to carbon reduction projects across Australia and New Zealand. All of our Australian care homes – more than 60 in total – now use solar energy, and
have become the largest rooftop solar panel system in Australia. The solar project alone will reduce C02 emissions by c. 2,000 tonnes per annum.
Australia and New Zealand
Revenue
£3,759.6m 1% AER 11% CER
Underlying profit
£309.2m 9% AER 24% CER
Customers
5.7m 16%
Employees
16,300 12%
10BUPA ANNUAL REPORT 2014
STRATEGIC REPORT

HEALTHCARE PARTNER TO MILLIONS MORE PEOPLE
We continue to lead the development of the health insurance sector with our ‘Pay for Quality’ initiative to improve quality and deliver better value for customers. Our partnership with Healthscope Hospitals is working to shift the focus in health insurance from cost to value-for-money, helping to drive quality improvement by creating a funding platform that rewards better healthcare outcomes in clinical quality and safety. During 2014, we also agreed new contracts with a number of hospital networks, assisting improved claims management, while delivering value and quality for customers.
Bupa Health Insurance has embarked on a major transformational agenda by stepping up efforts to retain customers, improving processes to proactively approach customers and providing enhanced training so we can resolve customer concerns the first time they call. We are simplifying all interactions with customers, including our claims processing, and are focused on differentiating ourselves in the market through the quality and breadth of our service.
By partnering with the public sector, we can help millions more people with their health and wellbeing and the launch of Bupa Medical Visa Services (see page 6) is an example of how this can work in practice. In Australia, we are also the primary service provider for the Coordinated Veterans’ Care programme, a contract with the Department of Veterans’ Affairs, which was extended in 2014 for a further two years.
Bupa’s Integrated Healthcare Program continues to represent a significant innovation for the aged care sector. By integrating medical care into our homes through the recruitment of GPs we have refocused the roles of all our care givers to deliver better clinical management. For our residents, this means greater continuity of care and better access to personalised services, improving health outcomes and quality of life. At the end of 2014, 22 care homes in Australia were operating under this new model.
A PLACE WHERE OUR PEOPLE LOVE TO WORK
We aim to have an extraordinary culture and organisation, with people healthier because they work at Bupa and with our people making a positive impact on the environment and the health of their communities.
Our annual Global People Survey in Australia and New Zealand showed an increase in employee engagement (up 1% to 76%). Following the rollout of our company-wide leadership programme, ‘Bupa Leaders Are’, we achieved a leadership index score of 75%, showing the high level of connection and affinity between our people and our leaders.
For more information on employee engagement and our leadership index, see page 7.
OUTLOOK
We expect the economic, political and regulatory environment in Australia and New Zealand to remain stable and anticipate challenges around affordability and consumer sentiment in Australia will continue in 2015. Despite this, we expect to continue to grow our customers, revenue and profit over the course of the year. Greater public and private collaboration will assist in tackling the challenge of rising healthcare expenditure and we believe the Government’s appetite for collaboration with the private sector continues to improve in both Australia and New Zealand.
GP services in Australia
In October, we offered GP services in Australia for the first time through our newly established Bupa Medical business. Currently, GP services are available at a flagship Bupa clinic in Sydney’s Central Business District, with plans to open five more clinics across the broader metropolitan area in 2015, increasing their convenience and accessibility.
The move into general practice is driven by our commitment to improving patient health through greater collective coordination. Our priority will be supporting our doctors to develop strong relationships with their patients and other caregivers, with the aim of helping people better navigate the health system and enhance the overall quality of care.
To find out more, visit bupa.com.au
We will provide health checks to
275,000people applying for visas each year.
80%of our people in Australia
participated in at least one employee wellbeing
activity in 2014.
STR
AT
EG
IC R
EP
OR
T
11BUPA ANNUAL REPORT 2014
STRATEGIC REPORT

Richard BowdenMD of United Kingdom Market Unit
2014 was the second year of growth in the UK, despite
tough trading conditions, as our focus on improving
operational efficiency, innovating to meet the
changing healthcare needs of our customers, and
making healthcare more affordable and accessible
both yielded results in the year and created momentum for 2015.
In the UK we have five business units. Bupa Health Funding provides health insurance and health funding products. We care for around 39,700 people in 280 care homes, and our health clinics business runs wellness centres, clinics, occupational health services and dental clinics. Bupa Cromwell Hospital, Bupa’s acute care hospital based in London, provides care for insured, self-pay and international patients and we also provide out-of-hospital healthcare services through Bupa Home Healthcare.
PERFORMANCE
We delivered good growth in revenue, customers and underlying profit in the UK, despite challenging market conditions. Revenue growth benefited from the opening of 13 new dental centres, the full-year contribution of Richmond Care
Villages, acquired in 2013, and new Bupa Home Healthcare contracts won in 2013.
Customer growth was mainly driven by the expansion of our dental clinics and Bupa Cromwell Hospital, which saw good growth in patient numbers, particularly from overseas. In Bupa Health Funding, we saw customer growth in our SME business and early signs of growth in our corporate business. This was offset by continued tough market conditions in the individual health insurance sector, as experienced across the whole industry.
For the second consecutive year, we delivered profit growth, supported by our focus on improving operational efficiency. Profitability was also positively impacted by growth in our clinics business, Bupa Home Healthcare and Bupa Cromwell Hospital. Growth in Care Services due to the impact of the full year contribution of Richmond Care Villages, was partly offset by higher care home running costs and continued pressure on care homes’ fee rates from local authorities.
We saved more than £1.5m in energy costs as a part of our drive to reduce our carbon footprint. In 2014 we invested over £13.2m in low carbon technologies. We have more
Combined Heat and Power units (CHPs) in our portfolio than any other company in the UK and have installed over 24,000 LED fittings as well as many solar panels. Together, these are projected to avoid the emission of over 5,000 tonnes of CO2 and have already saved over £1m in energy spend compared to 2013.
HEALTHCARE PARTNER TO MILLIONS MORE PEOPLE
We are focused on meeting the changing healthcare needs and concerns of our customers and society. We are developing innovative products and services and campaigning to make healthcare more affordable and accessible to deliver better value for money.
In 2014, Bupa Health Funding corporate customers experienced some of the lowest premium increases on record. Because of our success in healthcare cost containment we were able to reduce or hold premiums level for over half of our renewing corporate customers.
United Kingdom
MARKETUNIT
REPORT
£30mcost savings delivered by improving
operational efficiency.
Revenue
£2,711.2m 5%
Underlying profit
£175.0m 25%
Customers
4.0m 3%
Employees
32,400 -3%
12BUPA ANNUAL REPORT 2014
STRATEGIC REPORT
We provide all our people with Business Fit, as part of our commitment to helping them feel healthier through working at Bupa. Business Fit offers early intervention services to speed up access to diagnosis and treatment and physiotherapy for muscle, bone and joint conditions. It also provides fast, direct self-referral for mental health conditions and access to Bupa Anytime Healthline for round-the-clock medical advice from a nurse or GP.
Changing the face of healthcare
We remain committed to meeting our customers’ changing needs and making quality healthcare more affordable and accessible. During 2014, we have continued campaigning to reform the sector and drive greater transparency for patients on the cost and quality of private healthcare, as well as better value for money. As part of this we continue our ongoing drive to reduce healthcare costs, including those charged by hospitals, for the benefit of customers. We signed a groundbreaking long-term agreement with Spire Healthcare, which we believe will help to address the affordability of private healthcare. Going forward, we will be looking to work with other hospital providers in a similar way.
OUTLOOK
Our focus in 2015 is on growth through making private healthcare more accessible and affordable for more people in the UK. We will do this by focusing on operational efficiency, leading sector reform to deliver better value and innovating to meet changing customer needs. We will launch a three year investment programme to address some of the UK’s toughest healthcare challenges. This will include investing in our Care Services business, with a focus on dementia care and developing our care villages and intermediate care; the development of new products, services and online tools to respond to our customers’ changing needs and engage people in their health and wellbeing and funding projects to reduce our carbon footprint, as we recognise that good health and the environment are interdependent. We will also continue to progress towards our ambition of owning and operating 75 dental centres by the end of 2015.
We will work with the Government and other key parties to clarify and prepare for the implementation of the Care Act to ensure it results in improved care outcomes for residents. In 2015 we will launch The Bupa UK Foundation. This will be a company limited by guarantee and a charity registered with the Charity Commission. The Bupa UK Foundation will be entirely funded by Bupa UK, and will provide funding for practical projects and initiatives which aim to tackle critical challenges in health and social care, and improve people’s health and wellbeing.
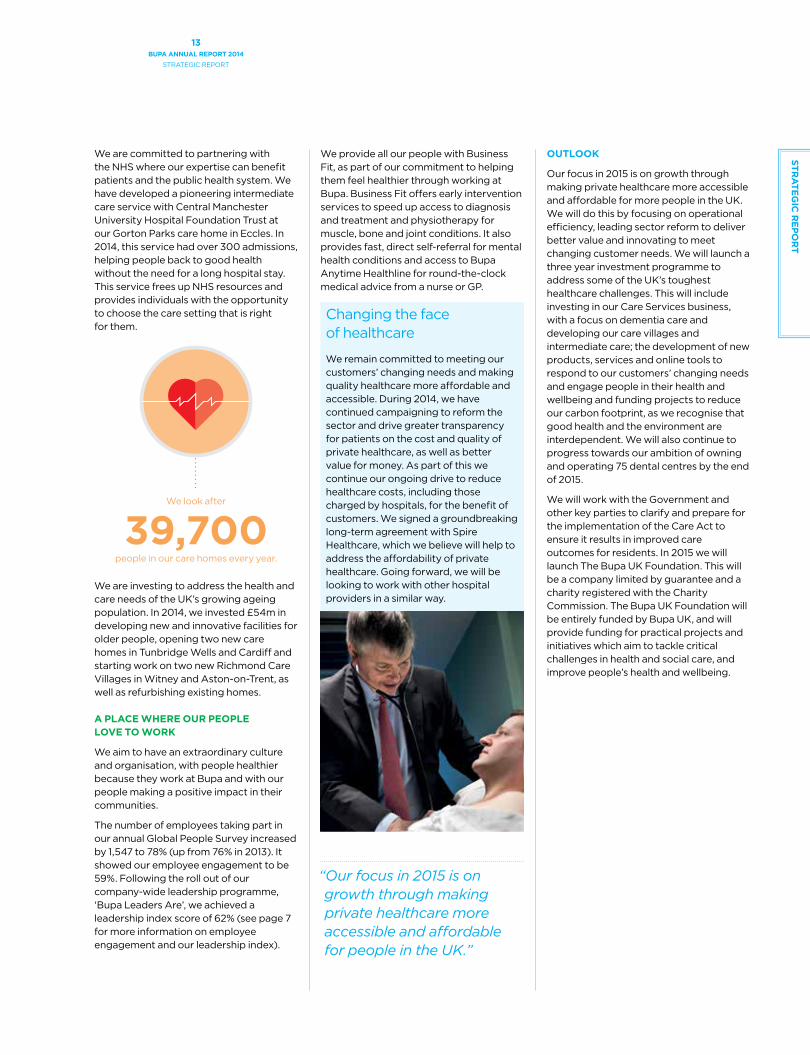
We are committed to partnering with the NHS where our expertise can benefit patients and the public health system. We have developed a pioneering intermediate care service with Central Manchester University Hospital Foundation Trust at our Gorton Parks care home in Eccles. In 2014, this service had over 300 admissions, helping people back to good health without the need for a long hospital stay. This service frees up NHS resources and provides individuals with the opportunity to choose the care setting that is right for them.
We are investing to address the health and care needs of the UK’s growing ageing population. In 2014, we invested £54m in developing new and innovative facilities for older people, opening two new care homes in Tunbridge Wells and Cardiff and starting work on two new Richmond Care Villages in Witney and Aston-on-Trent, as well as refurbishing existing homes.
A PLACE WHERE OUR PEOPLE LOVE TO WORK
We aim to have an extraordinary culture and organisation, with people healthier because they work at Bupa and with our people making a positive impact in their communities.
The number of employees taking part in our annual Global People Survey increased by 1,547 to 78% (up from 76% in 2013). It showed our employee engagement to be 59%. Following the roll out of our company-wide leadership programme, ‘Bupa Leaders Are’, we achieved a leadership index score of 62% (see page 7 for more information on employee engagement and our leadership index).
“Our focus in 2015 is on growth through making private healthcare more accessible and affordable for people in the UK.”
We look after
39,700people in our care homes every year.
STR
AT
EG
IC R
EP
OR
T
13BUPA ANNUAL REPORT 2014
STRATEGIC REPORT

Iñaki Ereño MD of Spain and Latin America
Domestic Market Unit
Spain and Latin America delivered a resilient
performance in 2014, despite tough economic conditions
in Spain. We focused on operational efficiency and innovating to respond to
customer needs, as well as integrating Cruz Blanca Salud,
now Bupa Chile. Our Spain and Latin America Domestic Market Unit provides health funding and healthcare provision services. Sanitas Seguros provides health insurance services in Spain and Sanitas Hospitales and New Services operates four private hospitals, private medical clinics and health and wellbeing services. We also run two public-private partnerships (PPPs) in Spain. Sanitas Dental provides dental insurance services, and Sanitas Residencial cares for around 4,700 people in 40 care homes. We acquired Cruz Blanca Salud, now known as Bupa Chile, in February 2014 – a leading health insurer and provider in Chile with three hospitals and 29 medical clinics. It recently expanded into Peru.
PERFORMANCE
Economic conditions in Spain remain challenging but we have delivered growth in revenue, customers and underlying profit.
Revenue grew with a significant contribution from Bupa Chile, supported by strong growth in Sanitas Dental which benefited from new dental centres opened during the year, and good growth in Sanitas Residencial. Customer growth was also positively impacted by Bupa Chile, Sanitas Dental, and Sanitas Hospitales and New Services, although this was partially offset by challenging conditions in the Spanish health insurance market.
We grew underlying profit by 9% at CER, benefiting from the contribution of Bupa Chile, as well as a strong performance by Sanitas Residencial. However, profit was impacted by low growth rates in private health insurance, a trend seen across the sector1.
The integration of Bupa Chile is progressing as planned and the business is performing ahead of expectations. During the final quarter of 2014, we began to migrate parts of the business to the Bupa brand, commencing with the hospitals business.
In Spain, we acquired the Virgen del Mar hospital in Madrid in September. We are now fully integrating Virgen del Mar into the business.
We have invested over £3.4m in projects that will improve the energy efficiency of our facilities, particularly our hospitals, ensuring we make a positive impact on the environment. This year, our
hospitals joined the Global Green and Healthy Hospitals Network, sharing best practice and promoting environmentally friendly healthcare.
HEALTHCARE PARTNER TO MILLIONS MORE PEOPLE
We are working hard to make healthcare more affordable and accessible for our customers. In Spain we have reviewed our product portfolio to help reduce the cost of our co-payment health insurance products, which require contributions from our customers at the point of treatment.
In the current economic climate, this move has been well received with strong sales of co-payment products.
We are also looking closely at our own costs, and have made our sales channels more
efficient by signing new
Spain and Latin America
Domestic
MARKETUNIT
REPORT
2.4m customers in Chile.
Revenue
£1,842.5m 35% AER 42% CER
Underlying profit
£130.6m 3% AER 9% CER
Customers
4.9m 104%
Employees
17,300 94%
1 Source: ICEA, the institute for statistics and studies of the insurance sector in Spain, a part of UNESPA, the Spanish trade association for insurance companies.
2 IASIST provides management information on the clinical and economic performance of healthcare providers in Spain. It has the largest, most detailed and up-to-date clinical databases in Spain.
14BUPA ANNUAL REPORT 2014
STRATEGIC REPORT

for digestive system surgery and management in the IASIST2 hospital index, in the large general hospital category. Our Manises hospital was also awarded a prize in the hospital management category.
In Sanitas Residencial, our care services business, we have developed a day care service to respond to the needs of customers – and their families – for more flexible care options. This service, which has been rolled out to 15 care homes, is increasing our customer reach as part of our strategy of creating ‘care hubs’ in the communities in which we operate.
A PLACE WHERE OUR PEOPLE LOVE TO WORK
We are committed to helping our people to be healthier because they work for Bupa. Our ‘Smile’ programme is focused on providing employees with health and wellbeing support for themselves and their families, including nutritional advice, online personal training plans, smoking cessation guidance and stress management workshops. In 2014, 2,685 employees participated in the programme, with independent research by Universidad Europea showing that their health
indicators improved within six months of enrolment, while productivity also increased by 43.3%. Due to the success of the programme for our own people, Sanitas has now developed ‘Smile’ as a new product offering for corporate customers.
In our annual Global People Survey, we maintained excellent levels of employee engagement (81%) and achieved a leadership index score of 73%.
For more information on employee engagement and our leadership index, see page 7.
OUTLOOK
We will continue to focus on the integration of Bupa Chile, driving operational efficiency, developing products and services to respond to our customers’ needs and exploring entry into further markets in Latin America where we see strong growth potential. In our Spanish health insurance business we expect tough trading conditions to persist in 2015. We will continue to manage medical costs
carefully to ensure that our products are affordable and we deliver sustainable growth. We expect an improved performance from our hospitals, PPPs and New Services as established
facilities grow and new facilities become fully operational, particularly the CIMA and Virgen del Mar hospitals.
distribution agreements with leading insurance brokers to boost productivity and renewing our co-insurance partnership with BBVA, Spain’s second largest bank. This partnership provides Sanitas with a major distribution channel to reach potential new customers, through BBVA’s 3,400 retail offices in Spain.
We continue to invest in developing market leading products, services and facilities for our customers as a key point of differentiation. We opened 25 new dental centres across Spain, bringing our total number of dental clinics to 173 and further openings are planned for 2015. In our Spanish health insurance business, we focused on strengthening sales channels for independent dental insurance products and now have over 91,000 members. In particular, we saw a significant increase in sales made in dental centres.
In our hospitals and PPPs we are investing in services and focusing on quality to attract patients to our facilities. In our CIMA hospital in Barcelona, we opened a new Obstetrics Unit, including a neonatal intensive care unit. Our PPP hospitals in Manises and Torrejón have also added new services, including a new radiotherapy unit in Torrejón. Both PPPs continue to attract patients from outside their catchment areas, which is testament to the quality of service patients receive in our hospitals. As a result of our sustained focus on quality, our Torrejón hospital was named the number one hospital in Spain
Transforming perceptions of disability
We were delighted to receive a Telefónica Ability Award for the commitment and leadership of the Spain and Latin America executive team to people with disabilities. The award recognised our dedication to developing products and services for people with disabilities, adapting our network of hospitals and medical centres, and our knowledge in sports medicine for Paralympic athletes.
The judges praised our efforts to promote the wider employment of people with disabilities outside of Bupa, for example through our purchase agreements with Grupo ONCE, Spain’s national organisation for blind and visually impaired people.
For more information, read Iñaki Ereño’s blog about the award: bupa.com/abilityaward
Iñaki Ereño, MD of Spain and Latin America Domestic, with Her Majesty Queen Letizia of Spain at the Telefónica Ability Award ceremony.
2,685 employees participated in Sanitas Smile in 2014.
STR
AT
EG
IC R
EP
OR
T
15BUPA ANNUAL REPORT 2014
STRATEGIC REPORT

David Fletcher MD of International Development Markets
IDM performed strongly, growing revenue, customers
and underlying profit. We have focused on delivering our strategy of growing and
developing our existing markets, while exploring
opportunities to enter new territories where we see
potential to deliver strong growth and increase
standards of healthcare for millions more people.
International Development Markets (IDM) consists of domestic health insurance businesses in Hong Kong, Thailand, India and Saudi Arabia, as well as a representative office in China; LUX MED, the largest private healthcare business in Poland; and Quality HealthCare, the largest private clinic network in Hong Kong.
PERFORMANCE
In 2014, IDM delivered strong growth in revenue, customers and underlying profit. Growth in revenue has been driven by the full year contribution of our LUX MED and Quality HealthCare acquisitions made in 2013, supported by strong sales in Thailand and Hong Kong. Revenues from our Bupa Arabia associate and our Max Bupa joint venture are not included in our revenue figures1. This growth was partly offset by the sale of the US operations of Health Dialog to Rite Aid in March.
We have seen strong customer growth, particularly from our 2013 acquisitions, as well as Bupa Arabia and Max Bupa. Bupa Arabia has seen significant corporate wins including a contract to provide health insurance to Saudi Basic Industries Corporation, Bupa’s largest ever corporate
win in terms of customers. Our micro health insurance initiatives in India and Ghana have also contributed positively to customer growth.
Our significant rise in underlying profit was largely due to the strong performance of Bupa Arabia, the impact of earnings from our 2013 acquisitions, and the divestment of the US operations of Health Dialog.
This year, a key area of focus has been developing LUX MED’s integrated healthcare funding and provision offering, as we believe the integrated model brings better oversight of the patient journey and makes healthcare more affordable and accessible. We are investing in the development of the business, completing several local acquisitions during the year and launching a new specialist dental centre in Wroclaw, one of Poland’s biggest cities. In Hong Kong, we are embedding the Quality HealthCare clinic business into the organisation and in August opened a new premium medical centre.
Max Bupa has completed a new project to install solar panels at its head office in Delhi. The panels will generate around 50MWh of electricity annually and save approximately 50 tonnes of
CO2 each year. We are investing in low energy projects in our locations all across the globe including in Poland where two of LUX MED’s largest clinics will undergo a retrofit programme to increase energy efficiency within their properties.
HEALTHCARE PARTNER TO MILLIONS MORE PEOPLE
In April, together with our Bupa Global Market Unit, we significantly increased our reach to millions more people in Hong Kong, when we launched a 10-year distribution partnership with Hang Seng Bank to reach their three million customers, further strengthening our market position in Hong Kong.
In India, Max Bupa launched bancassurance partnerships with Deutsche Bank, Standard Chartered, Ratnakar Bank and Federal Bank, significantly increasing our distribution network in the market and enabling us to access up to 14m potential new customers.
During 2014, Bupa Arabia and LUX MED both developed high profile sporting partnerships providing a platform to extend the reach and impact of our brand beyond our customers and to engage more
International Development
Markets
MARKETUNIT
REPORT
Revenue
£506.7m 34% AER 42% CER
Underlying profit
£17.1m 190% AER 235% CER
Customers
12.1m 39%
Employees
11,100 1%
1 While revenues from our associate and joint venture are excluded from our reported figures, customer numbers and the appropriate share of profit from these businesses are included in our reported numbers.
16BUPA ANNUAL REPORT 2014
STRATEGIC REPORT

We are focused on developing new products and services that answer our customers’ needs. In July, Max Bupa launched an enhanced version of its popular Heartbeat Health Insurance plan to respond to India’s strong family focus. The enhanced product offers individuals the opportunity to insure many members and generations of their family on one policy.
A PLACE WHERE OUR PEOPLE LOVE TO WORK
Our annual Global People Survey in IDM showed a significant increase in employee engagement (up 17% to 75%) and following the roll out of our company-wide leadership programme, ‘Bupa Leaders Are’, we achieved an overall leadership index score of 77% (see page 7 for more information about our leadership index).
As a healthcare leader, the continuous learning and development of our medical personnel is a focus area and in 2014 over 1,400 doctors and nurses took part in LUX MED’s ‘Academy’ medical training lectures on family medicine, surgery, lifesaving and midwifery.
Following investment in employee wellbeing initiatives, we saw a significant increase in GPS scores with our people saying they are healthier because they work at Bupa (up 54% to 60%). In Bupa Arabia, we introduced a business-wide initiative to increase employee fitness levels, reduce body fat and increase muscle mass through tailored fitness and nutritional programmes.
OUTLOOK
Building on the momentum of 2014, our focus is on consolidating and growing existing markets and exploring opportunities to enter emerging territories where we see strong, sustainable growth potential with significant opportunities to increase standards of healthcare for millions more people. We are confident in the long-term economic outlook in all of IDM’s markets. We anticipate Bupa Arabia will continue to demonstrate strong growth and we will continue the integration of our 2013 acquisitions, LUX MED and Quality HealthCare.
people in their health and wellbeing. In addition to our partnership with Riyadh’s Al-Hilal FC (see case study above), LUX MED became the first private healthcare provider to partner with the Polish Olympic Committee. This partnership provides LUX MED with a platform to engage with sportspeople and fans alike about improving their health and wellbeing through sport and physical activity.
In India, Max Bupa hosted its Walk for Health event in Delhi and Mumbai for the third consecutive year, involving more than 15,000 families, 5,000 school children and numerous businesses. All participants walked 5km and pledged to incorporate more walking into their daily routine. The event aims to educate the public about the benefits of walking to bring about positive and sustainable behaviour change.
Bupa Arabia partnership with Al-Hilal FC
Bupa Arabia formed a strategic partnership with Saudi Arabia’s largest football club, Al-Hilal FC. We provide health insurance and healthcare services to players and their families and consulting and technical support for the ongoing improvement of the club’s medical facilities.
Bupa Arabia will also send players and members of Al-Hilal’s medical team to Bupa’s High Performance Centre in Spain, to participate in innovative programmes that improve players’ performance and stamina. In Spain, we have had a similar, long-standing partnership with Real Madrid Football Club since 2008.
3mpeople will be offered a new range of health insurance products we have developed in partnership
with Hang Seng Bank.
1,400doctors and nurses took part in the LUX MED Academy’s medical training lectures.
STR
AT
EG
IC R
EP
OR
T
17BUPA ANNUAL REPORT 2014
STRATEGIC REPORT

Robert Lang MD of Bupa Global Market Unit
2014 was a year in which we began the transformation
of our Bupa Global Market Unit, as we regionalised our operations to better serve our customers, delivered operational efficiencies,
focused on strategic partnerships and developed new tiered products in key markets to provide access to high quality healthcare
anytime, anywhere.
The Bupa Global Market Unit provides products and services worldwide to people who want access to premium healthcare at home or as they study, live, travel or work abroad. Bupa Global provides international health insurance, travel insurance and medical assistance to individuals, small businesses and global corporate customers all around the world.
Bupa Global is comprised of three operating units: Bupa Global Latin
America, the largest provider of international health insurance
in the Latin America region; Bupa Global North America, responsible for Bupa’s significant (49%) investment in Highway to
Health, Inc. in the US and the strategic global
partnership with the Blue Cross and Blue Shield® (BCBS) system, the
largest US-based health insurance group; and Bupa Global Business Unit, which oversees Bupa Global’s new regional operations in Greater China and the Middle East, as well as retaining responsibility for the remaining regions of Africa, South East Asia and Europe.
PERFORMANCE
This year, Bupa Global has seen an increase in revenue, supported by several major corporate account wins. Customer numbers also increased with growth in all segments, a significant contribution by Highway to Health, Inc., and continued growth in key markets such as the United Arab Emirates and Hong Kong, combined with a year-on-year improvement in individual customer retention rates1. Underlying profit decreased due to higher claims costs on certain large corporate accounts. We reviewed, re-priced and in some cases decided to discontinue these accounts, while strengthening our claims provision.
Profitability was also impacted by our investment in transformation. This transformation will enable our continued move to a regional operating model, bringing our resources closer to our customers. We are streamlining our business to integrate previously separate Bupa businesses into a single Market Unit, delivering operational efficiencies, removing duplication and reducing the number of managerial layers.
To support our integration, in July, we completed our global brand migration from legacy trading names to our new trading name, Bupa Global, which is now used in all customer communications. Our new name better reflects our customer base and our products and services, and enables a more consistent customer experience globally.
We are also ensuring our customer service, sales and marketing capabilities are closer to our customers. To better serve our customers in their own language, culture and time zone, we continued to regionalise our operations in 2014.
HEALTHCARE PARTNER TO MILLIONS MORE PEOPLE
We will engage millions more people with their health and wellbeing through our strategic partnerships. In 2014, we began a global partnership with the Blue Cross Blue Shield Association, an association of 37 independent local Blue Cross and Blue Shield Plans which collectively constitutes the largest US-based health insurance group. As a result of the partnership, our customers in all but a few countries worldwide will benefit by accessing the Blue Cross and Blue Shield network of over 5,700 hospitals and 800,000 providers when travelling or working in the US; and Blue Cross and Blue Shield members in
Bupa Global
MARKETUNIT
REPORT
3new regions established in
North America, Greater China and the Middle East to oversee our
expansion in these geographies.
Revenue
£958.7m 1% AER 4% CER
Underlying profit
£97.9m 14% AER 12% CER
Customers
2.1m 11%
Employees
1,500 -12%
1 While revenue from our associate is excluded from our reported figures, customer numbers and the appropriate share of profit from this business are included in our reported numbers.
2 Source: Census and Statistics Department, Hong Kong Special Administrative Region. Published December 2014. www.statistics.gov.hk/pub/B11301622014XXXXB0100.pdf
18BUPA ANNUAL REPORT 2014
STRATEGIC REPORT

Premier, Elite and Ultimate Health Plans. These products allow customers to tailor their level of cover to their healthcare needs and expectations, with similar propositions to be rolled out in a number of our priority markets in 2015.
A PLACE WHERE OUR PEOPLE LOVE TO WORK
We aim to have an extraordinary culture and organisation, with people healthier because they work at Bupa and with our people making a positive impact in their communities.
Our annual Global People Survey showed an overall decrease in employee engagement (down 14% to 63%). This is the result of an average decrease across the entire Bupa Global Market Unit as we launched our change programme, but we saw some strong areas of performance including a score of 87% for Bupa Global Latin America, ranking it above other peer organisations of similar sizes.
Through our change programme, we maintained our focus on employee engagement with a series of internal events and communication campaigns to help our people grow their understanding of our strategy and engage in how their functions and roles are contributing to our success. Following the roll out of our company-wide leadership programme, ‘Bupa Leaders Are’, we achieved a leadership index score of 68%.
We also created opportunities for our people to have a positive impact in their communities. For example, in September, we held our first ‘Wellbeing in my Community Day’ for Brighton-based
employees in partnership with MIND, a UK mental health charity. In October, our Miami-based employees participated in a number of events for Cancer Awareness Week.
Bupa Global Latin America has moved to a new office in Miami that has been designed to support an extraordinary working culture. Our plumbing uses 30% less water than conventional fixtures,
meaning we will conserve approximately 300,000 gallons of fresh water each year. The office’s lighting is around 35% more efficient than conventional designs and we used LED lighting technology, daylight, and occupancy sensors to reduce our electricity usage. This is part of delivering on Bupa’s commitment to a 20% reduction in carbon emissions by 2015.
OUTLOOK
In 2015, the transformation of Bupa Global will continue. We will maintain our focus on our regionalisation strategy, in particular on building our new regions – Bupa Global North America, Bupa Global Greater China, and Bupa Global Middle East.
We will launch tiered products in a number of priority markets, including Hong Kong and Mexico, to offer customers greater choice and access to quality healthcare. The integration of our global provider network will continue to give customers access to leading hospitals and healthcare professionals wherever they are in the world, as it has done in the past. Lastly, sustained collaboration with other parts of Bupa will ensure that we all benefit from our joint scale and expertise.
GeoBlue, a product offered to Americans leaving the US to study, work or live abroad, will benefit from an expanded international network.
In partnership with IDM’s domestic health insurance business in Hong Kong, we launched a range of individual and corporate products and services, as a part of our new 10-year distribution agreement with Hang Seng Bank. Services include support for those with, or at risk of developing, a chronic condition, such as heart disease or diabetes, helping to address Hong Kong’s escalating incidence of chronic disease2. Services are designed to empower people to better understand and manage their condition. Other services include a stand-alone medical concierge service, which provides professional healthcare support and assistance, including a 24/7 health line, and a second expert medical opinion service.
In the UK we launched our first range of tiered products – Bupa Global Select,
Meeting our customers’ needs
In 2014, Bupa Global launched a new range of global health plans that aim to make global healthcare simpler for our customers. The products are tiered by price, cover and service, allowing our customers to choose the right level of cover for their individual healthcare needs. As well as insurance, the products include a number of wellness services to help our customers to maintain their own health.
In December, we launched our first range of tiered products for the UK. We followed with launches in Hong Kong and Mexico shortly afterwards and have developed similar products for a number of our key markets over the course of 2015. Early sales have been encouraging, confirming that these products are the right approach for many of our customers.
To find more about our new products, go to: bupaglobal.com or bupaglobalplans.com
More than
11,500hospitals in our global network, accessible to our customers in
more than 190 countries.
STR
AT
EG
IC R
EP
OR
T
19BUPA ANNUAL REPORT 2014
STRATEGIC REPORT

We achieved strong revenue growth of 15% at constant exchange rates (CER), with our underlying profit before tax increasing by 8% to £637.8m (2013: £588.7m). After the impact of foreign exchange is considered, notably a weakening of the Australian dollar, we delivered 8% revenue growth, while underlying profit remained flat.
A sharpened focus resulted in very strong cash generation, with net cash generated from operating activities increasing 69% to £789.5m (2013: £467.6m). This was made possible by a strong focus on cash management, tightening controls around working capital management processes and cash collection in our businesses.
Our recent acquisition programme culminated with the purchase of a controlling stake in Chilean integrated healthcare funding and provision group Bupa Chile, formerly Cruz Blanca Salud, in February 2014. Once again, we furthered our reach by entering a new geographical market, emphasising our growth ambition. We continued our ongoing plans to successfully integrate all of our recent acquisitions in order to realise synergies and deliver business value, while strengthening our risk and internal audit capabilities to ensure robust risk management and governance across Bupa.
In our established markets, we are investing to transform our customer propositions, refining our operational models and changing the way we interact with customers to ensure that we are well positioned for further growth.
1 Profit before taxation is adjusted for amortisation and impairment of intangible assets arising on business combinations, impairment of goodwill, net property revaluation gains or losses, realised and unrealised foreign exchange gains and losses, gains or losses on return seeking assets, profits or losses on the sale of businesses and fixed assets, restructuring costs and transaction costs on acquisitions and disposals.
Financial review
SUMMARY OF RESULTS
2014 £m
2013 £m
Total revenue
Underlying profit before taxationNon-underlying items
9,777.8
637.8
(28.6)
9,058.7
638.5
(124.1)
Profit before taxationTaxation
609.2(86.4)
514.4(103.0)
Profit for the year 522.8 411.4
CURRENCY
2014 2013%
Change
AUD average rate 1.8265 1.6228 13%
AUD closing rate 1.9082 1.8557 3%
EUR average rate 1.2411 1.1775 5%
EUR closing rate 1.2877 1.2014 7%
USD average rate 1.6475 1.5647 5%
USD closing rate 1.5581 1.6566 -6%
Evelyn Bourke Chief Financial Officer
2014 proved to be a year of good growth for Bupa. We delivered good underlying
revenue, profit and cash flow, reduced our leverage, and continued to integrate our
recent acquisitions and transform our operations to
fulfil our purpose: longer, healthier, happier lives.
UNDERLYING PROFITBEFORE TAX1
£637.8m
£638.5m
£559.0m
£464.9m
£609.5m
2014
2013
2012
2011
2010
£637.8m
GROUP REVENUE
£9.8bn
£9.1bn
£8.0bn
£7.6bn
£8.4bn
2014
2013
2012
2011
2010
£9.8bn
20BUPA ANNUAL REPORT 2014
STRATEGIC REPORT

REVENUE AND CUSTOMERS
Exceptional customer growth of 31% was the result of both the acquisition of Cruz Blanca Salud and organic growth. This increase in our customer numbers has not been directly reflected in our revenue growth due to a number of factors.
The strengthening of sterling against our key operational currencies (see table opposite) has seen our revenue growth decrease from 15% to 8% on an actual exchange rate basis. This was particularly significant for Australia and New Zealand, where revenue growth decreased from 11% at CER to -1%.
For our joint ventures and associates, we recognise the total population of customers, but in accordance with IFRS accounting standards, we do not recognise any revenue where we have a non-controlling interest, and only report our share of profit. This affects our IDM and Bupa Global Market Units, which incorporate Bupa Arabia, Max Bupa and our recent acquisition of 49% of Highway to Health in North America.
We have 1.7m customers from our micro health insurance initiatives in India and Ghana, which provide an insurance product for low income individuals with limited disposable income. The nature of this business is that we generate minimal revenue, at very low cost, from these customers.
NUMBER OF CUSTOMERSBY MARKET UNIT
Australia and New Zealand (ANZ)
United Kingdom (UK)
Spain and Latin America Domestic (SLA)
International Development Markets (IDM Owned subsidiaries)
International Development Markets (IDM JVs & Associates)
International Development Markets (IDM Micro health insurance)
Bupa Global (BG Owned subsidiaries)
Bupa Global (BG Associates)
ANZ20%
UK14%
SLA17%
IDM(Owned
subsidiaries)22%
BG(Owned
subsidiaries)3%
IDM(JVs &
Associates)14%
IDM (Micro healthinsurance)
6%
BG(Associates)4%
UNDERLYING PROFITBY MARKET UNIT
Australia and New Zealand (ANZ)
United Kingdom (UK)
Spain and Latin America Domestic (SLA)
International Development Markets (IDM)
Bupa Global (BG)
ANZ42%
UK24%
SLA18%
IDM2%
BG14%
REVENUE BY MARKET UNIT
ANZ38%UK
28%
SLA19%
IDM5%
BG10%
0
5
10
15
20
25
30
CUSTOMER AND REVENUE GROWTH: PERCENTAGE POINT SPLIT
Customers
Revenue*
* Revenue growth calculated at constant exchange rate
23
31
1515
62 0 0
Micro healthinsurance
Jointventures &
associations
Bupaowned
subsidiaries
Bupa total
UNDERLYING PROFIT
To derive underlying profit, profit before taxation is adjusted for amortisation and impairment of intangible assets arising on business combinations, impairment of goodwill, net property revaluation gains or losses, realised and unrealised foreign exchange gains and losses, gains or losses on return seeking assets, profits or losses on the sale of businesses and fixed assets, restructuring costs and transaction costs on acquisitions and disposals.
The performance of our established businesses and the addition of Bupa Chile have helped us achieve good underlying profit growth of 8% (to £637.8m at CER).
Despite the challenging trading conditions that persist in Australia, our Australia and New Zealand Market Unit achieved double-digit profit growth (CER), with a significant contribution from the 2013 acquisitions and a strong performance in
STR
AT
EG
IC R
EP
OR
T
21BUPA ANNUAL REPORT 2014
STRATEGIC REPORT
REPORTED PROFIT
In order to reflect trading performance in a consistent manner, we remove a number of non-trading items from our reported profit that limit comparability to arrive at underlying profit. These are presented in the table below.
Most notably, we removed £27.1m (2013: £nil) net profit on disposal of businesses, mainly as a result of the sales of Health Dialog and Surgichem, and the amortisation of intangible assets which has increased to £51.5m (2013: £37.3m), due to the impact of the 2013 and 2014 acquisitions.
The return seeking assets generated gains of £13.8m (2013: £nil) in a favourable year for credit markets. We made various changes to our portfolio, which increased its diversification and improved its position for an expected rising interest rate environment. In 2015, we will continue to actively manage the portfolio, consistent with our investment risk appetite and in line with our views of prospective asset class returns.
As a result, our reported profit before taxation was £609.2m, an 18% increase on 2013.
TAXATION
Bupa’s taxation expense of £86.4m (2013: £103.0m) represents a headline effective tax rate of 14.2%. The reduction from last year is largely due to the release of prior year tax provisions and recognition of tax credits following the settlement of historic matters, together amounting to £63.4m (2013: £40.3m). Excluding the prior year credits, the current year Group effective rate of 24.6% is in line with the Group rate of 25.0%, representing the corporate tax rates in the jurisdictions in which we operate.
BALANCE SHEET AND FUNDING
We manage our funding prudently to secure a sustainable platform for our continued growth. A key element of our funding policy is to target an A-/A3 senior credit rating for Bupa Finance plc, the main issuer of Bupa debt, over the long-term. In 2014 there were no changes to our ratings, leaving Bupa Finance plc rated A- (stable) and Baa2 (stable) by Fitch and Moody’s respectively.
In 2014, we proactively sought to refinance our short-term borrowings by accessing the bond markets for the third time since 2009. In June, we issued a 7-year £350.0m senior unsecured note with a coupon of 3.375%, with a well oversubscribed book. The proceeds were used in part to repay a £300.0m short-term acquisition financing facility taken out to complete the acquisition of Cruz Blanca Salud.
We also drove enhanced cash generation across Bupa through improved working capital management practices and this has contributed to our strong cash flow performance in 2014. This enabled cash to be repatriated back to the UK such that no drawings remained outstanding under our £800.0m committed bank facility at the end of 2014, reducing our interest payments on short-term borrowings.
We focus on managing leverage in line with our rating target. Leverage inevitably increased during 2013 and in early 2014 as a result of the significant level of acquisitions. Our strong focus on cash management has reduced this to below 2013 levels, notwithstanding our acquisition of Cruz Blanca Salud. At year end, leverage stood at 27.6% (2013: 28.9%), compared to 31.5% at half year.
the Australia insurance business. Profit benefited from a change in regulation, which enabled us to reduce our claims provisions.
In the UK, where trading conditions are also challenging, improvements in the efficiency of our operations supported a second successive year of profit growth, while in Spain, profit growth was primarily due to the addition of Bupa Chile.
The benefit of a first full year of ownership of LUX MED and Quality HealthCare, supported by strong performances in Arabia, Hong Kong and Thailand drove exceptional growth in our International Development Markets business. Bupa Global Market Unit’s profitability was impacted by higher claims costs on certain large corporate accounts. These have now been reviewed, re-priced and, in some cases, discontinued. The business also started its investment and transformation programme to streamline and bring resources closer to our customers.
Our net financial expense increased in the year, largely due to the interest payable on the bonds issued in June 2014 and in 2013, as well as lower interest rates on cash held in Australia, though this was offset in part by the return seeking assets performance.
Financial review
NON-UNDERLYING PROFIT ITEMS
2014 £m
2013 £m
Amortisation of intangible assets arising on business combinations 51.5 37.3Impairment of goodwill and intangible assets arising on business combinations 0.7 33.5Restructuring costs 14.5 21.7Transaction costs on acquisitions and disposals 5.4 28.6Net gains on disposal of businesses (27.1) –Gains on return seeking assets, net of hedging (13.8) –Other* (2.6) 3.0
Total 28.6 124.1
* Includes foreign exchange gains or losses, net property revaluation gains or losses, loss on sale of equity accounted investments, losses on sale of fixed assets and central non-underlying items.
“Our strong focus on cash management reduced leverage to below 2013 levels”
22BUPA ANNUAL REPORT 2014
STRATEGIC REPORT

CASH FLOW
Our net cash generated from operating activities increased by 69% to £789.5m (2013: £467.6m), and our operating cashflows were 162% of our profit before tax (2013: 113%). We have concentrated on improving working capital controls throughout Bupa, most notably ensuring efficient cash collection, particularly of overdue debts across our Market Units.
2013 cash flows were depressed by a one-off change in regulation in Australia which encouraged our customers to pre-pay their 2013 insurance premiums in 2012 and therefore while 2014 was very strong, the annual growth in cash flow is higher than the underlying performance.
We acquired Cruz Blanca Salud for £162.4m (net of cash on its balance sheet), and also invested £391.8m in capital expenditure around the business, including the continued expansion and refurbishment of our care homes.
We reduced leverage by repaying short-term bank debt through the strong cash repatriations made to the centre during the year.
Cash and cash equivalents increased by 26% to £1,187.6m. These funds, in addition to our financial investments, continue to be
managed conservatively and in line with a clearly articulated risk appetite. We actively manage our counterparty exposures as part of our ongoing risk management, and cash is only invested with A/A2 counterparties unless approved by the Investment Committee.
SOLVENCY
We monitor Bupa’s solvency on an ongoing basis and maintained Bupa’s strong solvency headroom in 2014. The estimated surplus under the Insurance Groups Directive (IGD) was £1.8bn (2013: £1.7bn), representing a solvency coverage ratio of 319% (2013: 309%).
2015 is a key year for Solvency II, with the preparatory reporting due to be submitted to the Prudential Regulatory Authority for the first time in July, and implementation of the new regime from 1 January 2016. We stepped up the pace of our Solvency II preparations in 2014 to ensure readiness for the 2015 preparatory reporting. In 2015, we will focus on gaining internal and external reviews of our processes and methodologies. In addition, and to reflect this critical stage of the process, we have enhanced the governance structure around the Solvency II programme and are
Energy Saver Fund
In January, we launched the £50m Energy Saver Fund (ESF), a new financing model that enables our Market Units to build low carbon technologies into our properties. We invested £25m in 350 projects in 2014. These included solar panels, LED lighting, combined
heat and power systems, and will deliver annual savings of around £2m and 10,000 tonnes of CO2 emissions.
We have now integrated a structured financial model, enabling us to implement projects that deliver both business and customer benefits. In 2015, we will invest the remaining £25m, helping to ensure we meet our 20% reduction target by the end of the year.
This year we have also maintained accreditation to the Carbon Trust Standard, which recognises our successful carbon reduction.
Solar panels at Bupa Kyneton, part of our aged care business in Australia.
designing appropriate governance structures for Solvency II in implementation.
We continue to monitor our solvency capital under both Solvency I and Solvency II regimes, incorporating the impacts in all material business decisions.
OUTLOOK
2014 has been a good year for trading performance, strengthening our cash flows and reducing leverage. We will develop all our businesses and drive operational efficiencies across Bupa, whilst maintaining a strong focus on our balance sheet and solvency and preparing for the regulatory changes ahead.
STR
AT
EG
IC R
EP
OR
T
23BUPA ANNUAL REPORT 2014
STRATEGIC REPORT

Our core risk appetite statements relate to:
°° The clinical and conduct risk outcomes that support Bupa’s purpose;
°° The holding of an appropriate buffer of capital resources above group regulatory capital requirements;
°° The return on capital we look to achieve;
°° The maintenance of a solid investment grade credit rating and prudent levels of liquidity.
Our risk appetite statements are a central reference point for key decisions and provide a governance and assessment framework for all significant investment decisions.
RISK FRAMEWORK AND GOVERNANCE
We adopt a ‘three lines of defence’ approach to risk management with each function responsible for managing their own risks in the first instance. Oversight is provided by Market Unit and Centre risk teams and additional assurance is provided by internal audit. Market Unit risk teams report on risks and control issues to local Market Unit level and entity level risk committees, and to the Centre risk function which in turn raises these with senior executives who sit on the Bupa Enterprise Risk Committee (BERC); and from there to the Bupa Risk Committee (BRC). All of our Market Units have experienced risk directors who support our businesses in delivering Bupa’s purpose. As part of our second line of defence, they report directly to me and also to the Managing Director or Finance Director of their Market Unit to bring executive level risk oversight.
The BRC is held accountable for the oversight of risk by the Board. It recommends risk appetite to the Board for approval in the form of risk appetite statements.
The BERC takes ownership for the whole of Bupa’s risk profile and risk culture. It also recommends to the BRC where risk appetite needs to change. The BRC is supported by a governance framework of Market Unit risk committees and Bupa-wide risk committees and forums focused on specific key categories of risk. These forums include the Clinical Governance and Quality Steering Committee shown in the diagram opposite.
Over the last year, we have reviewed our business standards and policies. These define the way we do business and apply to all our businesses, wherever they operate.
OUR RISKS
The profile of risk differs across our businesses, reflecting the different mix of funding and provision, and varied political, legal and economic contexts. We manage the risks to Bupa as a whole by understanding the risk drivers for individual businesses and assessing how they interact.
Understanding our risks enables us to maximise opportunities to benefit from risk diversification while identifying any emerging concentrations of risk.
Through the development of our Own Risk and Solvency Assessment we have integrated our risk, capital management and planning processes. This means that our strategies can be developed with insight into the impact of different risk scenarios on our capital position, taking into account the Board’s risk appetite. We apply this approach on a Bupa-wide basis to cover both our funding and healthcare provision businesses and we consider all of Bupa’s inherent risks in this assessment. These inherent risks are defined in the table on page 26.
Delivering consistently good outcomes for our customers is central to our risk management approach so the effective management of clinical risk is of utmost importance.
The most significant quantifiable risks facing Bupa are insurance and property risk, reflecting potential volatility arising from claims patterns, and our significant property portfolio, particularly care homes.
Movements in property markets aside, exposure to investment market fluctuations is relatively low, reflecting our conservative investment strategy. Other significant risks to Bupa include some that cannot readily be quantified, for example, the importance of managing brand value and reputation, and the potential impact of future changes to government and regulation.
RISK APPETITE
Our risk appetite framework reflects our purpose and expresses the degree of risk we are prepared to accept as we work to deliver on our strategy.
Risks and uncertainties
Gerry Kelly Chief Risk Officer
We are committed to strong risk management. This is how
we will deliver the best outcomes for our customers. We make risk management
part of our culture so that we can grow our business safely
and sustainably. Our understanding of risk informs the decisions we make and
reinforces our values.
24BUPA ANNUAL REPORT 2014
STRATEGIC REPORT

Managing Clinical Risk
In October 2013 we completed the acquisition of Quality HealthCare in Hong Kong and began a full clinical governance audit the following month. We made 92 recommendations for improvements including in patient and employee safety, quality management systems, and medical equipment. We took action to mitigate risks identified, overseen by the Clinical Audit Advisory Group.
As part of this, we looked at quality management in their diagnostic and imaging centres. Double reporting of CT/MRI scans and X-rays was introduced and patient safety procedures during X-rays were consistently graded and reported to the Executive Clinical Governance Committee.
In 2014, the Hong Kong Health Authority was seeking a diagnostic and imaging services provider for its own staff. Our new quality and patient safety initiatives were seen as key differentiators and this led to Quality HealthCare being selected despite considerable competition. This is now Quality HealthCare’s largest outsourced imaging contract and has also strengthened our relationship with the Health Authority.
SOLVENCY II AND REGULATORY CHANGE
We seek to apply both the letter and the spirit of new and changing regulation across all of our businesses. Solvency II drives a programme of change that goes well beyond pure capital and solvency measures, and we are using this as a catalyst to enhance and embed strong governance and control across Bupa. Following the global financial crisis, jurisdictions are enhancing both their prudential and conduct regimes. This is having a significant impact on the regulatory landscapes in which our insurance businesses operate and driving increased interest in Bupa’s broader activities from insurance supervisors.
Solvency II will bring a significantly enhanced regulatory regime for European insurers. In Australia, supervisory responsibility for private medical insurance is moving to the lead financial services prudential regulator (APRA), and in Hong Kong a new independent insurance regulator is being created. In addition to this, regulators for our healthcare provision businesses are responding to increasing political and societal expectations on health systems. We support the additional stability and safeguards that these enhancements are intended to bring and will work with our regulators on implementation of the changes to deliver the best outcomes for customers, markets and Bupa.
Bupa risk governance structure
BUPA RISK COMMITTEE
MEDICAL ADVISORY PANEL
BUPA ENTERPRISE RISK COMMITTEE
CLINICAL GOVERNANCE AND QUALITY STEERING
COMMITTEE
MARKET UNITENTERPRISE RISK
COMMITTEES
MARKET UNIT RISK DIRECTORS
MARKET UNIT MEDICAL DIRECTORS
STR
AT
EG
IC R
EP
OR
T
25BUPA ANNUAL REPORT 2014
STRATEGIC REPORT

OUR RISKS The table below reflects the main risks for which we hold economic capital, as well as risks which could cause harm to our customers or our reputation, if not managed effectively.
Risk Comment and Outlook
Property Risk Risk of volatility in property markets leading to a material devaluation of Bupa’s property portfolio such as head offices, hospitals and care homes.
Bupa generally owns rather than rents property, which keeps lease commitments down but leaves Bupa exposed to falling values.
As Bupa expands its care provision businesses, its property portfolio will grow and with it property risk exposure.
H H M L L
Insurance Risk Risks relating to Bupa’s insurance businesses. Risks of inadequate pricing and underwriting of insurance policies, and of claims experience being materially different to expectations.
Bupa’s health insurance is short-tailed with outstanding claims a relatively low percentage of premiums compared with most insurers.
Bupa retains most insurance risk rather than reinsuring.
Insurance risk exposure will grow as premium income grows for funding businesses.
H H H M H
Currency Risk Risk arising from changes in the level, or volatility, of currency exchange rates impacting on cash flows and assets held in currencies other than sterling, and on the financial statements.
As the value of overseas business grows there will be a corresponding growth in currency risk.
There will also be transactional risk relating to policies where premiums and claims are in difference currencies.
Currency risk is partially mitigated through a hedging programme run by the central treasury function.
H L M M M
Credit Spread and Counterparty Default Risks Risk of a loss of value of bond assets and/or the risk that a counterparty fails to pay its obligations in the face of difficult economic conditions.
Bupa’s funding businesses have modest holdings of corporate and other bonds to provide an additional return on investments. These are exposed to the risk of widening spreads and defaults.
There is banking counterparty default risk in respect of cash on deposit.
M H M L L
Operational Risk (including Conduct Risk) Risk of loss arising from inadequate or failed internal processes, or from personnel, systems or external events. This includes conduct risk – the risk that Bupa’s behaviour or actions result in detriment or unfair outcomes for customers.
We are committed to managing operational risk effectively. This includes continued close attention to management of regulatory risk and proactive engagement with regulators.
The inherent regulatory compliance and conduct risk profile for Bupa is high due to extensive geographical footprint and the volume and pace of new and changing regulation.
H H H H H
Clinical Risk Risk of injury, loss or harm due to a failure of clinical care, or inadequate governance, of the clinical networks used when funding treatment through health insurance.
As Bupa expands its care provision businesses, there will naturally be an increase in inherent exposure to this risk. This is being actively managed through continued refinement of our approach to clinical risk governance.
H H H M M
Liquidity Risk Risk that there will not be available funds to meet liabilities when they fall due.
Market Unit risk is inherently low due to central management of this risk.
Funding businesses hold significant cash assets to meet liabilities.
Key risk relates to borrowings where the amount and timing of outflows are known and are actively managed by the central treasury function.
L L L L L
Au
stralia an
d N
ew
Ze
aland
UK
Sp
ain and
L
atin
Am
erica
Inte
rnatio
nal
Deve
lop
me
nt
Marke
ts
Bu
pa
Glo
bal
KEYH The business has high inherent exposure to this risk.M The business has moderate inherent exposure to this risk.L The business has low inherent exposure to this risk.
Risks and uncertainties
26BUPA ANNUAL REPORT 2014
STRATEGIC REPORT

CURRENT PRINCIPAL RISKS AND UNCERTAINTIES The table below lists the key risks and uncertainties that are of the greatest significance and debate for the Board and Enterprise Risk Committees.
Risk Mitigating action
Clinical Bupa’s responsibilities as a provider of healthcare services mean that management of risks relating to customer wellbeing and safety is always in the spotlight.
All Market Units have a Medical Director responsible for ensuring clinical quality and governance within the business. They are accountable to the Chief Medical Officer (CMO) for clinical governance and, along with the Chief Risk Officer’s function, are part of our ‘second line of defence’. The CMO works closely with the Market Unit Medical Directors to seek ways to share best practice in the management of clinical risk across Bupa’s businesses.
Our structure of clinical risk committees means that there is oversight both within Market Units and across Bupa at Group level, including through the Medical Advisory Panel. This oversight is informed by quarterly reporting of key quality indicators; a schedule of clinical quality audits; and reporting and analysis of clinical incidents.
Organisational capacity and capability Bupa’s growth agenda brings with it increased risk of failing to manage the overall volume and pace of organisational change. This could lead to excessive management stretch, inadequate capability within the business, failure to identify and manage key risks, and loss of ownership of culture.
This is an important area of focus for the BERC which takes ownership of the risk culture and drives action in relation to the factors that influence it.
Management of transformational change is a key leadership accountability. Leaders are supported in this with specific change management resources and by the results of a regular Global People Survey which aims to capture the views of as large a proportion of Bupa people as possible.
Government and regulatory policy Changes to government and regulatory policy in one or more of the key geographies in which we operate may damage the interests of our customers or viability or profitability of the business model. With general elections forthcoming in some of our key territories and changes of regulator in others, the risk of policy change remains high. This is particularly the case where Bupa is dependent on public sector relationships and funding.
Bupa maintains a diversified business model to lessen the potential impact of changes affecting one product or service in any geography.
We seek to maintain competitive positions to enable us to respond to government and regulatory policy change from a position of relative strength.
On areas of policy significant to Bupa and our customers, we make our positions understood through both direct and collective means to inform decision-making.
Operational systems and processes Failures of our systems and processes in relation to areas such as information governance, maintenance of IT systems, prevention of financial crime, regulatory compliance and the reporting of financial information are key risks. Such failures could cause unanticipated financial loss, customer detriment, reputational damage and failure to meet regulatory expectations. While we continue to strengthen our risk and control framework and have a low appetite for operational risks, some degree of risk exposure will always remain. We focus on operational risks to ensure that our risk management approach is proportionate, and that incidents and trends are identified and acted upon.
The profile of key operational risk exposures against risk appetite is overseen by Market Unit Risk Committees and aggregate exposures across Bupa are reported to the BERC.
Bupa’s global framework of risk policies and policy owners ensures that principles for the management of key risks are clear and consistent across Bupa so that these can be meaningfully implemented within our businesses.
Risk Committees are kept up-to-date on regulatory requirements as these evolve. Bupa’s businesses seek to maintain strong relationships with all local regulators.
Bupa has a zero appetite for systemic or repeated detriment or unfair outcomes for our customers arising from our behaviours or actions in pursuit of our business objectives and purpose.
STR
AT
EG
IC R
EP
OR
T
27BUPA ANNUAL REPORT 2014
STRATEGIC REPORT

Chairman’s introduction to
Governance
We aim to operate to the same standards of governance as those expected of large, global public companies.
Bupa complies with the principles and provisions of the UK Corporate Governance Code and associated guidance, and our governance arrangements are continually reviewed in line with developments in best practice. Having no shareholders, the role of the Bupa Board and Bupa’s Association Members is even more significant in governance terms. The Board currently comprises myself as Chairman, six independent Non-Executive Directors and two Executive Directors.
At the end of 2014 there were 98 Association Members who hold the Board to account. They fulfil a crucial oversight role, providing challenge to the Board on matters of strategy and performance.
“We have put renewed efforts into building the international experience of the Association Membership body during the year”
2014 DEVELOPMENTS
Peter Cawdron retired from the Board as a Non-Executive Director and as Chairman of the Remuneration Committee at our Annual General Meeting (AGM) on 11 June 2014. The Board wishes to express its thanks for Peter’s contribution and is grateful that he served for an additional year beyond the originally envisaged two terms of three years. The Rt Hon Patricia Hewitt also stepped down as a Non-Executive Director at the AGM in 2014 and the Board also expresses its thanks for her contribution whilst on the Board.
Martin Houston was appointed to the Board in January 2014. He brings experience in international business and expertise in running the operations of a major, multinational company and was appointed as Chairman of the Remuneration Committee in June 2014.
During 2014, Bupa considered the appropriate composition of the Board and began the recruitment of new Non-Executive Directors as part of the continued development of its succession plans. We also made good progress during the second half of 2014 in building the international experience of the Association Membership body.
Also during 2014, we continued the development of an enhanced corporate governance framework for Bupa’s major operating subsidiaries; the key drivers being effective oversight and the further mitigation of risk.
Gender is a publicised measure of diversity when making Board appointments. Women are well represented on both the Board and in management positions throughout the business and we actively continue to encourage initiatives within the organisation which seek to enhance the pipeline of women at senior levels. It is, however, only one measure and Bupa believes diversity should be considered more broadly, including diversity of skills, experience, race, gender, disability and age, for example. All these factors are, among others, taken into consideration in appointments to the Board and to roles within Bupa.
Lord Leitch Chairman
Bupa’s distinctive structure enables us to focus entirely on the original objects including ‘to prevent, relieve and cure
sickness and ill-health of every kind…’, which we have
crystallised into ‘longer, healthier, happier lives’ as our purpose today. Our corporate
structure underpins this.
28BUPA ANNUAL REPORT 2014
GOVERNANCE REPORT
Finally, following the introduction of new legislation in 2013 to improve directors’ remuneration reporting, Bupa included a re-designed Remuneration Report in the 2013 Annual Report. We continue to support these initiatives in their intent to further enhance the standards and quality of corporate reporting. Although aspects of this legislation are not strictly applicable to Bupa, to the extent practicable, we have sought to mirror its requirements. For 2014, we have further developed and enhanced the Remuneration Report, in line with developing best practice in this area. For the forthcoming AGM on 14 May 2015, we will include an advisory vote on the Remuneration Report.
The Board discussed the results of the 2014 Board Evaluation at its meeting in February 2015. Details of this review are contained in the report on Effectiveness on page 36. Following the externally facilitated review in 2013, this year the review was undertaken as a survey and confirmed that the Board and its committees continue to develop and be effective.
THE FUTURE
We will continue to monitor our governance arrangements and make changes where beneficial. The continued review, development and implementation of our succession plans will ensure an orderly refreshment of the Board and continuity when Non-Executive Directors come to the end of their tenure.
George Mitchell has informed the Board that he intends to step down as a Non-Executive Director at the conclusion of the AGM, following eight years of service. We have begun the search to recruit a successor. George has provided tremendous support to Bupa over his tenure. Lawrence Churchill will become our Senior Independent Director.
John Lorimer will be stepping down as a Non-Executive Director and as Chairman of the Audit Committee at the end of June 2015 when he relocates to Australia. John has provided excellent service to the Board
and will continue as a Non-Executive Director of subsidiary companies in Bupa. Clare Thompson will join the Board as a Non-Executive Director on 1 May 2015 and become Chairman of the Audit Committee from 1 July 2015.
STATEMENT OF COMPLIANCE
Our stated aim is to operate with the same governance standards as are required of FTSE 100 companies. I am pleased to report that we have applied the main principles, and have complied with all of the relevant provisions of the UK Corporate Governance Code published in September 2012 (the Code) throughout the year except in two areas. Code Section E: Relations with Shareholders, which is not wholly possible for a company without shareholders and Section C.3.7: Audit Committee and Auditors, where Bupa has not yet placed its audit out to tender, with KPMG having been in post for over 20 years. Bupa is considering the impact of new legislation from the EU on compulsory auditor rotation and the Audit Committee will consider this during 2015.
We recognise the importance of maintaining effective relationships with our Association Members. In keeping with the full spirit of the Code, effort is made to engage fully with our Association Members, particularly through the constructive use of the AGM each year, financial results calls at the full year and half year points and briefing sessions organised each Autumn. We ensure that Association Members are kept informed of Bupa’s strategy and performance and that their views are communicated to the Board on an ongoing basis.
The publication of revisions to the Code in September 2014 has also been taken into account when considering compliance with the Code and the actions that need to be taken to enable Bupa to comply with these new provisions, as appropriate, during 2015.
Board refreshment The development of our Non-Executive Director succession plans are continuing to bring about the refreshment of the Board in an orderly fashion and to ensure continuity when Non-Executive Directors retire from the Board.
On 1 January 2014, the Board appointed Martin Houston (profile set out overleaf). Martin was also appointed Chairman of the Remuneration Committee in June 2014. Martin brings international operational experience to the Board from a variety of technical, commercial and management roles.
Clare Thompson will be joining the Board as a Non-Executive Director from 1 May 2015 and will Chair the Audit Committee from 1 July 2015 when John Lorimer steps down from the Board. Clare brings strong financial and insurance expertise, having been a Partner at PwC for many years.
George Mitchell will step down at the AGM as he reaches the end of his tenure as a Non-Executive Director and as the Senior Independent Director. Lawrence Churchill will become the Senior Independent Director from the conclusion of the AGM.
Further appointments will be announced in due course as the ongoing Board refreshment programme continues.
This Corporate Governance Report on pages 28 to 44, together with the Remuneration Report on pages 45 to 54, describe how we have applied the main principles of the Code during the year.
Lord Leitch Chairman
29BUPA ANNUAL REPORT 2014
GOVERNANCE REPORT
GO
VE
RN
AN
CE
RE
PO
RT

Governance continued
COMMITTEE KEY
A Audit Committee
M Medical Advisory Panel
N Nomination & Governance Committee
Re Remuneration Committee
Ri Risk Committee
The Board of Directors
George Mitchell, CBE Senior Independent Director
A/N/Re/Ri Joined the Board in May 2007; appointed Senior Independent Director from May 2013. George is currently Chairman of The Malcolm Group and Non-Executive Director of Intrinsic Financial Services. Previously he was an Executive Director of HBOS plc and the former Governor of the Bank of Scotland plc. George has worked in financial services for over 40 years and brings an in-depth knowledge of capital management and banking, including financial discipline and control, to the Board.
Evelyn Bourke, Chief Financial Officer Executive Director
Appointed CFO in September 2012. Evelyn joined from Friends Life where she was Chief Executive Officer of its Heritage division. Previously at Friends Provident, she was the Executive Director responsible for strategy, capital and risk and, before that, Chief Financial Officer. A qualified actuary, Evelyn is also a Non-Executive Director of the IFG Group in Ireland. Evelyn has a strong track record and extensive experience in financial services, risk and capital management, and mergers and acquisitions.
Lord Leitch, Chairman Non-Executive Chairman
N(Chair)/Re Joined the Board in May 2005; appointed Chairman in November 2006. Lord Leitch is currently Chairman of Intrinsic Financial Services, Chairman of FNZ (UK), Non-Executive Director of Old Mutual Wealth, and member of the House of Lords. Previously Deputy Chairman of Lloyds Banking Group plc, Chairman of Scottish Widows plc, Senior Independent Director at United Business Media plc, Chairman and Chief Executive Zurich Financial Services UK, Ireland, South Africa and Asia Pacific, and Chairman of the Association of British Insurers. Lord Leitch has a deep and broad knowledge of insurance and financial services gained over 45 years as a senior executive in a number of major international businesses.
Stuart Fletcher, Chief Executive Officer Executive Director
M/N Appointed CEO in March 2012. Stuart joined from Diageo where, most recently, he was President, Diageo International. Other senior management positions at Diageo include Global Finance Director of Guinness. Previously, he held financial roles at Procter & Gamble and United Glass. Stuart has over 25 years’ experience in senior management and a strong international track record having lived and worked in Japan, USA and Hong Kong. He is accomplished in setting and executing growth strategies, developing strategic partnerships, embedding employee engagement, and leader and team capability development across complex and international businesses.
30BUPA ANNUAL REPORT 2014
GOVERNANCE REPORT

Rita Clifton, CBE Independent Non-Executive Director
M/N/Re Joined the Board in July 2010. Formerly Chief Executive and then Chairman of Interbrand UK, Rita is currently on the Board of Nationwide Building Society and ASOS Plc and is Chairman of Populus, the opinion pollster, and of BrandCap. Before this, she was Vice Chairman and Strategy Director at Saatchi & Saatchi. Previous board appointments have included Judge Business School in Cambridge and EMAP plc. She also served on the Sustainable Development Commission, is a Fellow of WWF-UK and a visiting Professor of Henley Business School. Rita is an expert in brand management, marketing, strategy and sustainability.
John Lorimer Independent Non-Executive Director
A(Chair)/Ri Joined the Board in July 2011. John is currently a Non-Executive Director of Aberdeen New Dawn Investment Trust plc and was formerly a Non-Executive Director of International Personal Finance plc. Of his extensive commercial career of over three decades, 22 years were spent in financial services, including time with Standard Chartered and Citigroup. He has considerable experience working in Asia and Australasia. John brings expertise in governance and oversight, regulation, risk management and financial services.
Julian Sanders Company Secretary
Appointed as Company Secretary in July 2014. Julian was formerly Deputy Company Secretary, having joined Bupa in 1988. Prior to joining Bupa he was a Supervisor in the Business Services Group at Coopers & Lybrand (now PwC).
Lawrence Churchill, CBE Independent Non-Executive Director
Ri(Chair)/A/N Joined the Board in July 2009. Lawrence is Chairman of the Board of the Financial Services Compensation Scheme, Chairman of Applegate Marketplace Limited, Chairman of the Independent Governance Committee of Prudential Assurance Company and a Trustee of Prudential Corporate Trustee Limited. Previously Chairman of the NEST Corporation and the Pension Protection Fund, a member of the Board for Actuarial Standards, Chief Executive of Zurich Financial Services UK, Executive Chairman of UNUM and CEO of NatWest Life and Investments. Lawrence brings considerable expertise from operating in large, complex organisations and has extensive knowledge of financial services, risk management, general management and public policy.
Martin Houston Independent Non-Executive Director
Re(Chair)/A/Ri Joined the Board in January 2014. Martin is Chairman of TPH International and Parrallax Energy and is a Non-Executive Director of CC Energy Development. Previously he was Chief Operating Officer and Executive Director of BG Group plc from 2011 to 2013 where he was responsible for the operational performance of BG Group’s assets, the energy marketing business, as well as group wide business development. He gained extensive international experience at BG Group from a wide variety of technical, commercial and management roles. He is a Fellow of the Geological Society of London, a Companion of the Institution of Gas Engineers and Managers and a former Non-Executive Director of Severn Trent plc.
Professor Sir John Tooke Independent Non-Executive Director
M(Chair) Joined the Board in July 2009. A consultant physician, Sir John is President of the Academy of Medical Sciences and holds a number of positions at University College London (UCL), including Vice-Provost (Health), Head of the School of Life and Medical Sciences, and Academic Director of the academic health science system, UCL Partners. He is currently Non-Executive Director of UCL Hospitals NHS Foundation Trust. Sir John brings his medical expertise, gained over 40 years, to advise the Board on clinical governance and advances in healthcare practices and treatments.
31BUPA ANNUAL REPORT 2014
GOVERNANCE REPORT
GO
VE
RN
AN
CE
RE
PO
RT

Stuart Fletcher Chief Executive Officer
Stuart was appointed as CEO in March 2012. He has extensive experience of leading complex international organisations. Stuart was previously President, Diageo International between 2004-2011 and held various senior management roles with Diageo as well as financial roles with Procter & Gamble.
The Executive team
Governance continued
Evelyn Bourke Chief Financial Officer
Evelyn was appointed as CFO in September 2012. Evelyn is a qualified actuary with an MBA from London Business School with significant experience in financial services, including at Standard Life, Friends Provident/Life plc, Chase de Vere Investments plc (an IFA) and Tillinghast-Towers Perrin.
Robert Lang Managing Director, Bupa Global
Robert joined Bupa in February 2013. Robert holds an MBA from London Business School and Economics and Arts (Hons) degrees from Monash University. Robert has extensive international experience in the insurance sector spanning Australia, Europe and Asia.
Alex Cole Director of Corporate Affairs
Alex joined Bupa in July 2014. She has over 20 years’ experience across communications and public affairs and was Corporate Affairs Director at J Sainsbury plc and Cadbury plc.
David Fletcher Managing Director, International Development Markets (IDM)
David joined as Chief Internal Auditor in March 2014 and has been Managing Director of IDM since September 2014. David has extensive international financial services experience, having held various senior positions in Nigeria, China, Hong Kong, Singapore, Indonesia and London.
Paul Newton Chief Legal Officer
Paul joined Bupa as a legal adviser in 1987. He became Bupa’s General Counsel in 2005 and joined the Executive Team in 2013. Paul leads the legal functions globally for Bupa. Paul is a qualified solicitor.
32BUPA ANNUAL REPORT 2014
GOVERNANCE REPORT

Iñaki Ereño Managing Director, Spain and Latin America Domestic (SLA)
Iñaki joined Sanitas in 2005 and has been Managing Director for SLA since October 2012. Iñaki formerly held senior positions at Acerinox, the Telefónica Group and Carrefour as well as founding an online start-up. He has a Degree in Law and an MBA from IESE.
Elisa Nardi Chief People Officer
Elisa joined Bupa on 1 February 2015 and takes up the role from Joy Linton, our Interim Chief People Officer, on 1 May 2015. Elisa’s broad international business experience includes being Chief People & Services Officer at Virgin Media and HR executive at Lloyds Bank and Marconi. She ran a consulting business for seven years.
Garry Fingland Chief Information Officer
Garry joined Bupa in September 2014. Garry has extensive experience in IT transformation on a global basis having held a number of senior IT leadership roles at both Serco and Diageo. He is a Chartered Accountant and holds an MBA from Strathclyde Business School.
Theresa Heggie Chief Marketing and Strategy Officer
Theresa was appointed in June 2013. She has over 25 years’ experience in the pharmaceutical and biotech industry, including Shire Human Genetic Therapies, Janssen Pharmaceuticals (part of Johnson & Johnson), Ohmeda Pharmaceutical Products (part of BOC) and Baxter. She has a BSc from Cornell University.
Dean Holden Managing Director, Australia and New Zealand
Dean has been at Bupa for over 25 years, during which time he has overseen operations in Australia, Spain, Hong Kong, Saudi Arabia, Latin America and Thailand. He has also led Bupa’s development into new markets including China and India.Dean is a Chartered Certified Accountant.
Richard Bowden Managing Director, United Kingdom
Richard has 30 years’ experience in the health sector, having previously served as Managing Director for Bupa Australia for 15 years, under the ownership of Bupa for 10 years and 5 years with AXA Asia Pacific. Richard was also Chairman and President of Private Healthcare Australia.
Paul Zollinger-Read Chief Medical Officer
Paul became Chief Medical Officer of Bupa in July 2012. Paul has led a distinguished medical career within the UK’s National Health Service, both as a GP and latterly as CEO of a number of Primary Care Trusts. Paul has previously been the Medical and Primary Care Advisor at the King’s Fund.
33BUPA ANNUAL REPORT 2014
GOVERNANCE REPORT
GO
VE
RN
AN
CE
RE
PO
RT

Leadership
Governance continuedTHE ROLE OF THE BOARD
The Board is responsible for the oversight of the management of Bupa, including:
°° agreeing Bupa’s long-term direction and objectives;
°° determining the nature and extent of the significant risks it is willing to take in achieving its strategic objectives;
°° oversight of Bupa’s operations;
°° oversight of Bupa’s values and standards;
°° appointment and retention of the Executive Directors, and ensuring that succession plans are in place;
°° ensuring that the appropriate and necessary financial and people resources are in place to meet Bupa’s objectives;
°° providing constructive challenge to the Executive Directors and senior management; and
°° responsibility to ensure that the highest standards of both corporate and clinical governance are followed.
THE ROLE OF THE CHAIRMAN
The Chairman is responsible for the leadership of the Board and is pivotal in the creation of the conditions necessary for overall Board and individual Director effectiveness, both in and outside the boardroom, including:
°° embedding constructive relations between Non-Executive and Executive Directors;
°° ensuring clear, accurate and timely information is provided to the Board;
°° facilitating contributions from Non-Executive Directors;
°° effective Board Governance;
°° succession planning and recruitment of Non-Executive Directors;
°° setting agendas;
°° ensuring adequate time in meetings to discuss agenda items, in particular strategic items;
°° management of the CEO; and
°° oversight of major subsidiary chairmen.
It is also the Chairman’s role to ensure effective communication with Association Members and to chair General Meetings.
BUPA’S GOVERNANCE FRAMEWORK
Bupa’s Board normally meets ten times a year and at other occasions as required. It devotes much of its time to overseeing Bupa’s strategy and policies, the approval of business plans and significant capital expenditure, acquisitions and disposals, as well as monitoring business performance. Minutes of all Board and Committee meetings are recorded and reflect the substance of the discussion as well as the decisions made.
Bupa has a schedule of matters reserved for the Board’s approval, last updated in 2012, and all other items are delegated to the CEO. The levels of authority delegated to management are regularly reviewed and updated when appropriate. The roles of the Board, the Chairman, the CEO, the Senior Independent Director and the Non-Executive Directors are clearly defined and set out in detail on bupa.com. The role of the Chairman and the CEO are clearly defined and separated.
Bupa’s governance structure is designed to enable the Board to lead Bupa within a framework of prudent and effective controls which enables risk to be assessed and managed. All Board and Committee members are provided with sufficient resources to undertake their duties, including access to both internal and external specialist advice at Bupa’s expense. The Directors individually and collectively act in accordance with their duties under the Companies Act 2006. Bupa has a directors’ and officers’ insurance policy in place as well as a deed of indemnification.
THE ROLE OF THE CEO
The CEO is responsible for the day-to-day leadership and management of the business, in line with the strategy and long-term and annual objectives approved by the Board. The CEO may make decisions in all matters affecting the operations, performance and strategy of Bupa’s businesses, with the exception of those matters reserved for the Board or specifically delegated by the Board to its Committees, executive committees or subsidiary company boards.
THE ROLE OF THE SENIOR INDEPENDENT DIRECTOR (SID)
The role of the SID includes the following key elements:
°° acting as a sounding board for the Chairman and CEO on Board and Association Member matters;
°° leading the Non-Executive Directors in the annual review of the Chairman’s performance;
°° being the focal point for Board members for any concerns regarding the Chairman, or the relationship between the Chairman and the CEO;
°° acting as a trusted intermediary for Non-Executive Directors; and
°° being available to Association Members.
THE ROLE OF THE NON-EXECUTIVE DIRECTORS
The role of the Non-Executive Directors has the following key elements:
°° constructively challenging and helping to develop proposals on longer-term direction and strategy;
°° scrutinising the performance of management in meeting agreed goals and objectives, and monitoring the reporting of performance;
°° satisfying themselves on the integrity of financial information, and that financial controls and systems of risk management are robust and defensible; and
°° having a prime role in appointing and, where necessary removing, Executive Directors, in executive succession planning, and determining appropriate levels of remuneration, for those roles.
34BUPA ANNUAL REPORT 2014
GOVERNANCE REPORT

BOARD COMPOSITION AS AT31 DECEMBER 2014
Independent78%
Executive22%
2 Executive Directors (2013: 3) 7 Independent Directors (2013: 8)
The Independent Directors include the Chairman, SID and Non-Executive Directors
The Executive Directors are the CEO and CFO
A copy of the standard Non-Executive Director Terms of Appointment, which set out their expected time commitment, is available on bupa.com, at Bupa’s registered office and is available for inspection before and during the AGM.
BOARD COMPOSITION, TENURE AND DIVERSITY
Bupa’s Board consists primarily of Independent Non-Executive Directors, who substantially outnumber the Executive Directors. The independence of Non-Executive Directors from management and any other business or relationship which could materially interfere with their independence, is considered and confirmed on an annual basis. All Directors offer themselves for annual re-election by the Association Members, save for those retiring at the AGM.
Lord Leitch, Bupa’s Chairman, who was independent on appointment, holds a small number of other appointments, none of which are considered to impede his role at Bupa. Details of his other appointments are set out on page 30.
An annual review of all Directors’ actual or potential conflicts of interest is undertaken. Any conflicts must be authorised and a Director would abstain from discussions on any matter where they may be conflicted. Many of Bupa’s Non-Executive Directors hold appointments at other organisations, as does the CFO, as set out in their profiles on pages 30 and 31. Each Non-Executive Director annually confirms that they are able to devote sufficient time to perform their role effectively.
Following the continual review by the Board of succession plans for Non-Executive Directors a phased replacement of Non-Executive Directors coming to the end of their tenure has been agreed. This approach gives continuity to the Board as well as maintaining an appropriate balance of skills and experience on the Board and its committees. This is continually assessed and updated to meet the needs of the business.
A policy on Board diversity was adopted by the Board in 2012, which sets out Bupa’s policy to ensure that there is broad experience and diversity on the Board. Diversity in Bupa embraces knowledge and understanding of relevant diverse geographies, peoples and their backgrounds, including race, disability, gender, sexual orientation, religion, belief
and age, as well as culture, personality and work-style. In particular, Bupa’s Board is focused upon increasing Board diversity. Appointments to the Board are based on merit as well as complementing and expanding the skills, knowledge and experience of the Board as a whole. Within this context the Board aspires to have an appropriate proportion of Directors who have direct experience of some of Bupa’s key markets.
Following any appointment to the Board, a personalised induction programme is drawn up, which includes Bupa-specific knowledge building, site visits to Bupa’s businesses in both the UK and overseas, information and discussion on strategy and development plans for the business.
Board and Committee members also receive specific training and development on topics which are of relevance during the year. These can take the form of presentations on specific markets from leading academics and economists to more detailed training on forthcoming developments. During 2014, this included a session on risk management; evolving insurance regulation and the evolving risk landscape.
LENGTH OF TENURE (YEARS)
Stuart Fletcher, Evelyn Bourke, John Lorimer, Martin Houston (2013: 4)
Lawrence Churchill, Prof Sir John Tooke, Rita Clifton (2013: 5)
Lord Leitch, George Mitchell (2013: 1)
1-3 4
4-6 3
7+ 2
SECTOR EXPERIENCE
Financial Services (2013: 5)
Clinical and Healthcare Systems (2013: 2)
Strategy and Development (2013: 5)
Brand and Marketing (2013: 2)
International Business (2013: 5)
5
1
2
4
5
35BUPA ANNUAL REPORT 2014
GOVERNANCE REPORT
GO
VE
RN
AN
CE
RE
PO
RT

Effectiveness
Governance continued°° a rolling programme of strategic discussions throughout the year; and
°° greater interaction between the Board’s committees and Bupa’s major subsidiary company committees.
This evaluation was conducted by Dr Tracy Long of Boardroom Review. Boardroom Review has no connection with Bupa, other than having facilitated the external reviews in 2010 and in 2013.
We are pleased to report that the factors identified continue to be addressed through the ongoing development of succession planning and the subsidiary governance framework, together with a rolling programme of strategic discussion topics forming part of the Board’s agenda for the year.
In 2014, the Board and its Committees undertook an internally managed survey with support from Independent Audit Limited. This process concluded that
BOARD PERFORMANCE AND EVALUATION
The results of the Board’s externally facilitated evaluation in 2013 showed that the Board and its Committees continued to operate effectively, with a small number of areas identified for further development. These centred on three key factors, which were monitored throughout 2014:
°° continued development of succession planning to include a review of the future skill set and diversity needs of the Board;
Bupa’s Board continued to operate effectively in an open and transparent manner, providing support and challenge to executive management.
A plan is being developed based on these recommendations which will be monitored throughout 2015 by the Nomination & Governance Committee and we will report progress against these recommendations in our 2015 Annual Report.
ATTENDANCE AT BOARD MEETINGS
The Board holds ten scheduled meetings each year (both in the UK and overseas) and others as necessary, plus an annual strategy offsite session. Set out below are some examples of the items discussed over and above standing items of review and approval of minutes, CEO Report, CFO Report and reports from the committees. Set out below is a table showing the high levels of attendance at the Board meetings held during 2014.
ATTENDANCE IN 2014
February March April June July August September October November December
LORD LEITCH1 A A
STUART FLETCHER1 A
EVELYN BOURKE
PETER CAWDRON2 – – – – – – –
LAWRENCE CHURCHILL A
RITA CLIFTON A
PATRICIA HEWITT3 A – – – – – – –
MARTIN HOUSTON
JOHN LORIMER
GEORGE MITCHELL
PROF SIR JOHN TOOKE A
ITEMS COVERED INCLUDED:
February Global Brand Growth/Global People Survey Results/Risk Capability and Plan
August Approval of Half Year Results
March Approval of Annual Report and Accounts September Micro Health Pilot Update/Health & Safety and Employee Health & Wellbeing Update/Association Member Engagement/Bupa People: Liberating Talent
April (meeting held in Warsaw)
Bupa’s Participation in Provision/Clinical Leadership in the UK/IDM MU Strategy & Business Update
October (meeting held in Manchester)
Heart Healthcare at Bupa/UK MU Strategy and Business Update/Chief Risk Officer’s Report/Bupa in India
June ANZ MU Strategy and Business Update/UK Clinical Quality Update/Dementia Care at Bupa
November Internal Audit Transformation Plan and Charter/ Tax and Treasury Updates/Bupa Global MU Business Update
July Follow-up from Board Strategy Session/SLA MU Strategy & Business Update/NED Fees
December Approval of 2015 Plan/Cancer Care at Bupa/ Approval of Bupa’s ORSA
A Apologies1 Both Lord Leitch and Stuart Fletcher were absent in late 2014 due to illness. The Senior Independent Director, George Mitchell, chaired those meetings.2 Peter Cawdron stepped down from the Board at the AGM on 11 June 2014.3 Patricia Hewitt stepped down from the Board at the AGM on 11 June 2014.
36BUPA ANNUAL REPORT 2014
GOVERNANCE REPORT

Engagement Voting at the AGM is conducted on a show of hands with the numbers of votes for, against or withheld on each resolution being made available on bupa.com after the AGM. The questions raised by Association Members at the 2014 AGM covered areas such as global brand and culture, business margins, bribery and corruption, Solvency II readiness and directors’ remuneration.
Bupa also runs a series of Autumn Briefing sessions for the Association Members which gives another opportunity for engagement with representatives of the Board on matters of strategy and performance. These sessions are also well attended and include rigorous challenge and questioning by the Association Members with a summary of the questions circulated to all Association Members, the Board and Bupa’s executive management team. This ensures that the views of Association Members are well communicated and understood within the business. These more formal sessions are combined with regular correspondence on key changes and developments within Bupa, such as major acquisitions.
Bupa runs an induction session for new Association Members each year. This is an opportunity for newly appointed Association Members to gain a further understanding of Bupa, our strategy and their role in our governance.
In 2014, we developed a secure website for Association Members to access useful information and updates, as well as daily media briefings from two of Bupa’s key markets and a calendar of forthcoming events. We also started to run briefing calls following the announcement of financial results, the first of which was held following the Half Year results in 2014. This was well received and these calls are now part of the calendar of events for Association Members.
BondholdersBupa also has a number of debt securities in issue by subsidiary companies and is therefore required to operate in accordance with the UK Listing Rules, Disclosure Rules and Transparency Rules in respect of its announcements of financial results and operations. Bupa’s bondholders and other interested parties are formally made aware of the Half Year and Full Year results via briefing calls, and have the opportunity to question management on the financial performance and strategy of Bupa.
WHO BUPA ENGAGES WITH
Association Members Bupa maintains a register of around 100 (98 as at 31 December 2014) Association Members who perform a key governance role similar to that which would normally be undertaken by shareholders in a FTSE 100 company. They generally serve for a period of ten years. The key difference for Bupa is that Association Members have no equity interest and, consequently, no right to dividends.
Association Members are eminent individuals in their own field, coming from a diverse range of sectors, including health and social care, business, regulatory, academia, as well as charities and the public sector. Their expertise enables them to provide significant challenge to the Board on matters of performance and strategy, and furthermore, to draw upon their skills, knowledge and experience to help inform future strategy and development.
Fundamentally, their role is to hold the Board to account in delivering on our purpose of longer, healthier, happier lives.
A number of steps have been taken during 2014 to identify new Association Members with greater experience of the key markets in which Bupa operates. A professional search firm was retained to help identify potential candidates and this recruitment drive will continue into 2015. It is likely that the number of Association Members will increase by approximately 20% in the short term as a result of these activities.
Bupa’s Association Members have a number of opportunities to engage with the entire Board, including at the AGM which will be held in May in 2015, which will be preceded by a seminar update in respect of one of Bupa’s business areas.
The AGM is traditionally well attended by the Association Members and is also attended by all members of the Board. At the AGM, Bupa proposes a resolution on each substantially separate issue, including a resolution on the Annual Report.
Other stakeholdersAcross our markets, we engage regularly with policymakers and regulators, healthcare professionals, consumer groups, NGOs and other key stakeholders. This engagement enables us to contribute to the health policy debate and to build an understanding of issues relevant to our customers and to healthcare generally. We also partner with a number of bodies, largely NGOs, to address and positively impact on specific health issues as part of our commitment to help more people access better healthcare.
ENGAGEMENT WITH ASSOCIATION MEMBERS
AGM seminar and AGM°° In 2014, the AGM seminar was hosted by the Bupa Executive Team and focused on Bupa 2020 and how it was being implemented.
°° 54% of Association Members attended the 2014 AGM (2013: 49%).
Autumn Briefing sessionsThree briefing sessions were held with between six and 12 Association Members attending each session.
A short presentation on Bupa’s performance and development was followed by an in-depth Q&A at each session.
InductionAn induction briefing was held in September 2014 for six of the newly appointed Association Members on the role that they perform and how they can assist Bupa to achieve its purpose.
Developments in 2014The development of a secure website containing key information for Association Members and copies of regular updates has been extremely well received. The first of the financial results briefing calls was held in September and will continue to be part of the ongoing engagement programme.
37BUPA ANNUAL REPORT 2014
GOVERNANCE REPORT
GO
VE
RN
AN
CE
RE
PO
RT

The remit of the Audit Committee includes monitoring the integrity of Bupa’s financial statements, the effectiveness of internal control systems and reviewing the effectiveness, performance and objectivity of the internal and external auditors.
All members of the Committee are Non-Executive Directors and this applied throughout the year. Martin Houston joined the Committee with effect from 13 February 2014. The majority of the members of the Committee have recent and relevant financial experience. The CEO, CFO, Corporate Controller, Chief Internal Auditor, Chief Risk Officer and external auditors are routinely invited to attend meetings. The Committee regularly holds discussions with the external auditors and without management present.
A copy of the Committee’s Terms of Reference are available on bupa.com.
2014 ACTIVITIES
In discharging its responsibilities, the Committee met seven times during the year. In addition to ensuring the integrity of the financial results, the Committee was also active throughout the year in other key areas, including:
°° reviewing the preliminary announcement, Annual Report and Half Year results announcement, including the going concern statements;
°° considering reports from the external auditors reviewing any accounting or judgemental issues requiring its attention, as well as any other matters the external auditors wished to bring to the Committee’s attention;
°° approving audit plans for the external and internal auditors; considering reports from the Chief Internal Auditor on the results of internal audit reviews, significant findings, management action plans, and timeliness of resolution;
°° reviewing the company’s internal financial controls;
°° meeting with external auditors without the executives;
°° monitoring and reviewing the effectiveness of the internal audit activities, and reviewing the independence and performance of the external auditors; and
John Lorimer Committee Chairman
The Audit Committee is responsible for the integrity of the financial statements, the
effectiveness of internal control systems and auditor
performance review.
Audit Committee report
ATTENDANCE
February March June July August September December
JOHN LORIMER
PETER CAWDRON 1 – – – – –
LAWRENCE CHURCHILL A
MARTIN HOUSTON
GEORGE MITCHELL
ITEMS COVERED INCLUDES:
February Key Accounting Issues and Areas of Judgement/Financial Highlights/Outstanding Claims Provision Update
March Internal Audit Update/Annual Report Approval/Review of Systems of Internal Control and Risk Management
June Internal Audit Update/KPMG Audit Plan 2014/Financial Controls Update/Review of External Audit Firm and Audit Fees/Segregation of Duties
July Key Accounting Issues for Half Year Report
August Half Year Report Approval
September Internal Audit Update/Australia Outstanding Claims Provision/Review of Non-Audit Services Policy
December Key Accounting Issues for Year End/Internal Audit Update/KPMG Update/Review of Outstanding Claims Provision/Financial Controls Update
1 Peter Cawdron stepped down from the Committee wef 11 June 2014.A Apologies.
Governance continued
38BUPA ANNUAL REPORT 2014
GOVERNANCE REPORT

to ensure that the carrying value did not differ significantly from the fair value at the balance sheet date. Directors’ valuations are performed in interim years, where impairment indicators exist. The principal assumptions underpinning these valuations are: quantifying a fair, maintainable level of trade and profitability; levels of competition; and assumed ability to renew existing licences, consents, certificates or permits. Revaluations are carried out by external surveyors (Knight Frank and Extensor). The Committee considered the results from the external valuations and discussed these with management in light of current trading performance of the businesses in which the properties are used and the external environment. The Committee considered the need for directors’ impairment reviews in periods where no external valuation had been carried out but where there had been indicators of impairment and receives information from management about any potential impairments identified. The Committee also reviewed reporting from the external auditors addressing the valuations.
°° Goodwill and intangible asset valuations: Goodwill and intangible assets are recognised on business combinations. Intangible assets recognised on business combinations are valued at their fair value at the date of acquisition. For acquisitions made in the period, the Committee considered the appropriateness of the assumptions used to determine the fair value of intangible assets arising and their useful lives. In forming its conclusion the Committee reviewed reports from management and from external valuers. Goodwill and intangible assets with indefinite lives are tested for impairment on an annual basis; other intangible assets are tested for impairment if a trigger of impairment is identified. Impairment tests measure carrying value against value in use. In arriving at the value in use, key assumptions are made regarding future cash flows based on management forecasts, discount rates and terminal growth rates which take into account long-term business plans and macroeconomic conditions. The Committee reviewed and discussed management reports outlining the basis of the assumptions used for our most sensitive Cash Generating Units (CGUs) and considers these in light of business
°° reporting to the Board on how it has discharged its responsibilities.
FINANCIAL REPORTING
The Committee reviewed the appropriateness of the Half Year and Annual financial statements, which it carried out with both management and the external auditors and included:
°° whether the Annual Report represents a fair, balanced and understandable view of the information;
°° the clarity of disclosures and whether compliance with financial reporting standards is acceptable; and
°° the material areas in which significant judgements have been applied.
In carrying out the review, the Committee regularly considers independent papers from the Corporate Controller and the external auditors highlighting any significant areas of risk or judgement that have arisen in the period.
The significant areas of judgement raised in these reports for 2014 and how they were addressed were:
°° Claims provisioning: Claims provisioning primarily relates to the determination of the estimate that is made of the expected claims payments and expense required to settle existing insurance contract obligations. Calculation of the outstanding claims provision is based on assumptions including claims development, margin of prudence, claims cost inflation, medical trends and seasonality. The Committee received reports from management detailing claims reserving methodologies and reviewed and approved the approach to claims reserving. In particular, the Committee reviewed and approved the assessment of margins of prudence, with a focus into areas where there have been changes in methodology or practice. In making these judgements, the Committee also considered reports from the external auditor.
°° Property valuations: Bupa has a significant portfolio of care home, hospital and office properties and fluctuations in the value of this portfolio can have a significant impact on the Statement of Financial Position, Income Statement and solvency position of the Group. Revaluations of the freehold and leasehold property portfolio are carried out on a periodic, at least triennial, basis
performance, the current valuations of comparable companies and any other relevant external information available. Reporting from the external auditors is also considered.
°° Taxation: The Group is subject to tax audits in the jurisdictions in which it operates and considers each issue on its merits when determining whether to raise a provision for any potential tax liability that may arise. The Committee reviewed reports from management outlining where significant judgements have been made in determining the tax provision. The Committee also received periodic reporting from the external auditor on these matters.
EXTERNAL AUDITORS
In relation to Bupa’s external auditors, KPMG, the Committee assessed the scope, fee, objectivity and effectiveness of the audit process annually. In assessing the effectiveness of the audit process, prior to making any recommendation on the appointment or re-appointment of the external auditors, the Committee reviewed the effectiveness of their performance against criteria which it agrees, in liaison with executive management, at the outset of each year’s audit. In so doing, the Committee also considered feedback on the prior year’s external audit obtained through a satisfaction survey. This considers a number of areas such as the overall quality of service, timeliness of the resolution of issues, the quality of the audit resource and whether the audit plan was followed.
Prior to agreeing the auditors’ proposed audit fee, having been reviewed by executive management, the Committee considered cost comparisons to ensure that it is fair and appropriate for Bupa. There are no contractual obligations that restrict the Committee’s capacity to recommend a particular firm as Bupa’s external auditors.
During the year, the Committee discussed placing the audit out to tender and considered whether benefits such as increased independence or financial savings were likely and, if so, whether these would outweigh the significant management time and effort needed to conduct a thorough tender process. KPMG has been Bupa’s auditor since 1985. There was a rotation of audit partner after the conclusion of the 2013 audit. After consideration of cost, effectiveness and
39BUPA ANNUAL REPORT 2014
GOVERNANCE REPORT
GO
VE
RN
AN
CE
RE
PO
RT
The Committee carried out a review of the effectiveness of the systems of internal control and risk management in place during the year, which considered all aspects of internal control arising during the period. This included the work of internal audit and operation of material controls (financial, operational and regulatory compliance). During this review, the Committee identified a number of weaknesses, however, none which it determined to be significant to the financial statements. The Committee noted the steps that had already been, and were planned to be, taken by management, to address those areas identified, and the plans to further enhance the internal control systems and strengthen risk management and the three lines of defence.
Key features of the internal controls and risk management processes include:
°° a framework of internal controls covering both financial and non-financial controls, the effectiveness of which is regularly reviewed by executive management and the Board; and
°° the ‘three lines of defence’ model. The risk management function, under the leadership of the Chief Risk Officer, provides the primary second line of defence. Internal audit acts as a third line of defence. The medical function, reporting to the Chief Medical Officer, provides the second line of defence in relation to clinical risk. It provides independent and objective assurance to the Committee over the adequacy of systems of internal control, risk and governance established by management (the first line of defence) and monitored by the risk management function based in the Centre and Market Units. Bupa’s internal audit team acts in accordance with the Global Institute of Internal Auditors’ professional standards and has unrestricted access to the Chairman of the Committee. Where specific skills are not available in-house, the Chief Internal Auditor and Committee Chairman have the ability to procure the services of expert external advisers.
The system of financial control includes:
°° a comprehensive system for budgeting and planning, together with monitoring and reporting the performance to the Board;
°° appraising major investment projects, including M&A;
°° a Financial Control Framework, which provides a consistent standard for financial controls across the businesses;
°° a suite of financial control and financial accounting policies, operating alongside a periodic attestation process;
°° key controls over major business risks including reviews against performance indicators and exception reporting, and the preparation of monthly management accounts; and
°° monthly reporting of treasury activities and risks, for review by senior executives.
Additional non-financial controls include:
°° the risk management function, working with the business to assess risks and introduce systems to mitigate them. Details of major business incidents are reported to both the Risk and Audit Committees and all notified accidents are investigated;
°° a commitment by Bupa to ensure that its personnel meet high standards of integrity and competence as well as systems covering recruitment, training and development, and the communication of policies and procedures throughout the organisation;
°° Business continuity plans to enable the business to continue with minimum disruption to customers in the event of a disaster; and
°° strict guidelines for the use of confidential customer data.
Internal audit provides assurance over adequacy in the operation of internal controls, reviews their effectiveness by undertaking an agreed schedule of internal audits each year and reporting its findings to management and the Committee. The schedule of internal audits forms part of an annually approved audit plan. During 2014 an enhanced approach to internal audit was adopted, as part of the transformation programme, designed to draw out thematic issues and areas for development and additional internal audit resourcing was reviewed and approved.
PLANS FOR 2015
In 2015, the Committee plans to focus on the continued development of the internal audit approach following the adoption of a new Audit Charter and the appointment of the new Chief Internal Auditor in 2014.
KPMG’s independence, and taking account of the rotation of the lead audit partner, the Committee was satisfied that KPMG continue to be independent and agreed that it would likely be disruptive to place the audit out to tender during 2014. The Committee will continue to keep the position under review, in light of forthcoming changes to legislation in this area.
To ensure that their objectivity and independence is safeguarded, the Committee has a formal policy on Bupa’s relationship with KPMG, which includes financial approval limits for non-audit services and restrictions on the nature of work that can be performed. This policy is reviewed regularly. As part of the evaluation of the external auditors, the Directors confirmed that they were satisfied that the external auditors had maintained their independence. In addition, KPMG also annually reports on whether and why it deems itself to be independent. Fees paid to KPMG for non-audit services are shown in Note 2.3 to the Accounts. The Committee is satisfied that KPMG continues to provide an effective audit service.
INTERNAL CONTROL AND RISK MANAGEMENT ASSURANCE
The Board has overall responsibility for ensuring Bupa’s system of internal control and risk management is maintained and for reviewing its effectiveness. Such a system is designed to manage or mitigate, rather than eliminate the risk of failure to achieve business objectives, and can only provide reasonable, and not absolute, assurance against material misstatement or loss. There is an ongoing process for identifying, evaluating and managing principal risks faced by Bupa. This process was in place throughout the year under review and up to the date of approval of the Annual Report and Accounts, and accords with the revised guidance on internal control published in October 2005 (formerly referred to as the ‘Turnbull Guidance’).
Audit Committee report
Governance continued
40BUPA ANNUAL REPORT 2014
GOVERNANCE REPORT
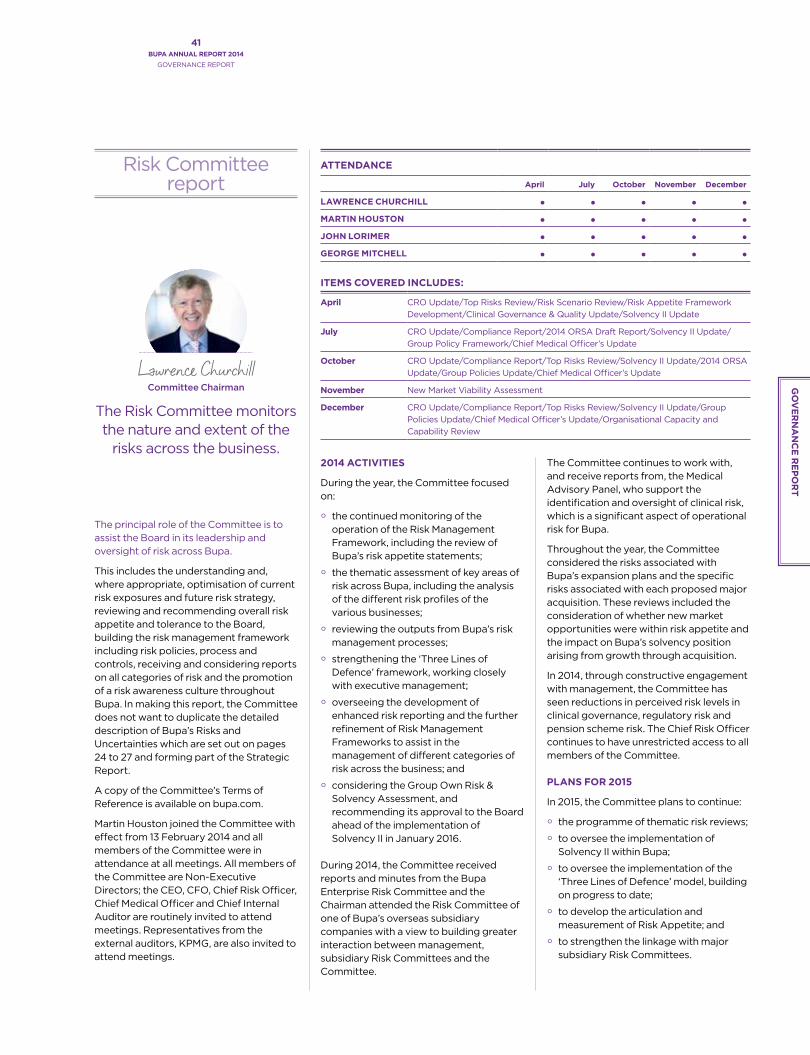
The principal role of the Committee is to assist the Board in its leadership and oversight of risk across Bupa.
This includes the understanding and, where appropriate, optimisation of current risk exposures and future risk strategy, reviewing and recommending overall risk appetite and tolerance to the Board, building the risk management framework including risk policies, process and controls, receiving and considering reports on all categories of risk and the promotion of a risk awareness culture throughout Bupa. In making this report, the Committee does not want to duplicate the detailed description of Bupa’s Risks and Uncertainties which are set out on pages 24 to 27 and forming part of the Strategic Report.
A copy of the Committee’s Terms of Reference is available on bupa.com.
Martin Houston joined the Committee with effect from 13 February 2014 and all members of the Committee were in attendance at all meetings. All members of the Committee are Non-Executive Directors; the CEO, CFO, Chief Risk Officer, Chief Medical Officer and Chief Internal Auditor are routinely invited to attend meetings. Representatives from the external auditors, KPMG, are also invited to attend meetings.
2014 ACTIVITIES
During the year, the Committee focused on:
°° the continued monitoring of the operation of the Risk Management Framework, including the review of Bupa’s risk appetite statements;
°° the thematic assessment of key areas of risk across Bupa, including the analysis of the different risk profiles of the various businesses;
°° reviewing the outputs from Bupa’s risk management processes;
°° strengthening the ‘Three Lines of Defence’ framework, working closely with executive management;
°° overseeing the development of enhanced risk reporting and the further refinement of Risk Management Frameworks to assist in the management of different categories of risk across the business; and
°° considering the Group Own Risk & Solvency Assessment, and recommending its approval to the Board ahead of the implementation of Solvency II in January 2016.
During 2014, the Committee received reports and minutes from the Bupa Enterprise Risk Committee and the Chairman attended the Risk Committee of one of Bupa’s overseas subsidiary companies with a view to building greater interaction between management, subsidiary Risk Committees and the Committee.
The Committee continues to work with, and receive reports from, the Medical Advisory Panel, who support the identification and oversight of clinical risk, which is a significant aspect of operational risk for Bupa.
Throughout the year, the Committee considered the risks associated with Bupa’s expansion plans and the specific risks associated with each proposed major acquisition. These reviews included the consideration of whether new market opportunities were within risk appetite and the impact on Bupa’s solvency position arising from growth through acquisition.
In 2014, through constructive engagement with management, the Committee has seen reductions in perceived risk levels in clinical governance, regulatory risk and pension scheme risk. The Chief Risk Officer continues to have unrestricted access to all members of the Committee.
PLANS FOR 2015
In 2015, the Committee plans to continue:
°° the programme of thematic risk reviews;
°° to oversee the implementation of Solvency II within Bupa;
°° to oversee the implementation of the ‘Three Lines of Defence’ model, building on progress to date;
°° to develop the articulation and measurement of Risk Appetite; and
°° to strengthen the linkage with major subsidiary Risk Committees.
Risk Committee report
Lawrence Churchill Committee Chairman
The Risk Committee monitors the nature and extent of the
risks across the business.
ATTENDANCE
April July October November December
LAWRENCE CHURCHILL
MARTIN HOUSTON
JOHN LORIMER
GEORGE MITCHELL
ITEMS COVERED INCLUDES:
April CRO Update/Top Risks Review/Risk Scenario Review/Risk Appetite Framework Development/Clinical Governance & Quality Update/Solvency II Update
July CRO Update/Compliance Report/2014 ORSA Draft Report/Solvency II Update/Group Policy Framework/Chief Medical Officer’s Update
October CRO Update/Compliance Report/Top Risks Review/Solvency II Update/2014 ORSA Update/Group Policies Update/Chief Medical Officer’s Update
November New Market Viability Assessment
December CRO Update/Compliance Report/Top Risks Review/Solvency II Update/Group Policies Update/Chief Medical Officer’s Update/Organisational Capacity and Capability Review
41BUPA ANNUAL REPORT 2014
GOVERNANCE REPORT
GO
VE
RN
AN
CE
RE
PO
RT

The principal role of the Medical Advisory Panel is to advise the Board on clinical governance, professional standards, quality of care and the development of Bupa’s medical policy. The Panel provides oversight and assurance of Bupa’s clinical governance arrangements and assurance to Bupa’s Risk Committee on clinical risk.
This advice is underpinned by a framework of responsibility and accountability that continuously measures, monitors and improves the safety and quality of all clinical services, promoting optimal customer health outcomes and clinical excellence.
2014 has seen the continuation of the Panel’s work to build on the achievements of the past in order to deliver Bupa 2020.
A copy of the Panel’s Terms of Reference is available on bupa.com.
PANEL MEMBERSHIP
The Panel comprises the CEO, two Non-Executive Directors and three independent members. During 2014, the Rt Hon Patricia Hewitt stepped down from the Panel in June 2014 when leaving the Board. The independent members, highly respected individuals from clinical practice and academia, provide invaluable input into the clinical governance standards and strategy at Bupa. The Panel is supported by the Chief Medical Officer and the Chief Nurse who attend all Panel meetings. The Chief Risk Officer also attends Panel meetings.
2014 ACTIVITIES
In 2014, the Panel continued to develop Bupa’s Clinical Governance and Quality Strategy. This was approved in 2013, and sets out a three-year plan founded on Bupa’s purpose: longer, healthier, happier lives. This strategy continues Bupa’s journey to excellence in the delivery of care either through direct provision by Bupa or through Bupa’s network of approved hospitals.
Medical Advisory Panel report
Prof Sir John TookePanel Chairman
The Panel seeks to ensure that Bupa inspires
a culture of innovation and excellence to achieve
the very best in care for all our customers,
patients and residents.
ATTENDANCE
March May June October November
PROF SIR JOHN TOOKE (CHAIRMAN)
RITA CLIFTON A
STUART FLETCHER A
PATRICIA HEWITT1 A A – – –
TESSA GREEN*
PROF GILLIAN LENG CBE* A A A
PROF MARY WATKINS*
ITEMS COVERED INCLUDES:
March Clinical Governance in Quality HealthCare, Hong Kong/Cost Effective Treatment Review/Critical Clinical Incident Review/Clinical Governance & Quality Update
May Annual Quality Accounts 2013 Review/Clinical Governance & Quality Update
June Presentation on Dementia/Clinical Governance in Sanitas Hospitals, Spain/Clinical Governance & Quality Update
October Care Services UK Review/Clinical Governance & Quality Update
November UK Consultant Engagement Update/Presentation on Influencing Health-Related Behaviours/Clinical Governance & Quality Update
1 Patricia Hewitt stepped down from the Panel wef 11 June 2014.* Independent Panel Member.A Apologies.
Governance continued
42BUPA ANNUAL REPORT 2014
GOVERNANCE REPORT

In discharging its responsibilities during 2014, the Panel oversaw:
°° the implementation of a more comprehensive Global Clinical Governance Audit programme. The profile of the audits can be broken down into: Scheduled (27%); Outcome Driven (45%) and Thematic (28%). During 2014 the Clinical Governance Programme made a significant contribution to the post-acquisition due diligence and integration process for new businesses;
°° the refinement of quarterly reporting of key quality indicators in order to provide a more comprehensive understanding of global clinical performance. Performance radars were introduced to show the performance for each business in relation to different areas of clinical practice;
°° a drive to develop how Bupa operates through third-party providers to ensure high levels of clinical governance and quality reporting.
°° Several in-depth reviews were received and considered by the Panel, including:
°— A Global Complaints Review to consider how Bupa could use the feedback received, including complaints, as a means of improving Bupa’s customer experience and quality of service and care;
°— A review on staffing in the aged care businesses, which focused on whether a multidisciplinary, clinical staffing model and higher staffing costs resulted in better quality performance of care homes; and
°— An aggregate global review of ‘Never Events’ and an understanding of these serious incidents which should never occur when the available preventable measures are implemented;
°° the results of research undertaken into engagement with medical consultants in the UK. This was undertaken in order to help further improve Bupa’s relationships with clinical providers and to ensure that Bupa’s communication with consultants was as effective and supportive as possible; and
°° reports on topical and pertinent issues, including a presentation and discussion on dementia. The report highlighted Bupa’s capacity to help improve standards of care for people with dementia and to help change the public perception of the importance of brain health so that the diagnosis of dementia or identification of the relevant dementia risk factors occur earlier, and can then be treated or better managed at an earlier stage. This is in line with Bupa’s commitment to tackle the toughest challenges in healthcare.
PLANS FOR 2015
In 2015, the Panel will focus on a number of key issues which will include:
°° the development of a Global Clinical Risk Framework within the Three Lines of Defence approach. This will ensure that robust foundations of risk management are in place for the delivery of Bupa 2020;
°° the development of a quality schedule for all third-party providers;
°° further enhancement of the Global Quality Performance Report; and
°° the appointment of new independent Panel members.
43BUPA ANNUAL REPORT 2014
GOVERNANCE REPORT
GO
VE
RN
AN
CE
RE
PO
RT

The Committee leads the process for Board appointments and makes recommendations, together with reviewing the balance of skills, experience, knowledge, structure and composition of the Board and its Committees.
The Committee keeps Bupa’s governance structures under review and makes appropriate recommendations to ensure that Bupa’s arrangements are, where appropriate, consistent with best practice governance standards. The Committee also identifies and selects suitable Association Member candidates.
The Committee’s Terms of Reference are available on bupa.com. These were reviewed and updated during 2014.
All members of the Committee are Non-Executive, save for Stuart Fletcher as CEO. The Chief People Officer is invited to attend meetings where the recruitment of new Directors is discussed. Peter Cawdron stepped down from the Committee on 11 June 2014 following his retirement from the Board and Lawrence Churchill was appointed to the Committee on 11 June 2014.
2014 ACTIVITIES
During the year, the Committee undertook significant work on Board recruitment. The Committee considered the role specification for the recruitment of new Non-Executive Directors to enhance the diversity of skills, knowledge and experience of the Board, particularly seeking further international experience. The process involved establishing two role specifications, followed by a formal and rigorous interview process of shortlisted candidates, against set objective criteria. The Zygos Partnership, Odgers Berndtson and Ridgeway Partners LLP, all of whom have also provided other executive recruitment services to Bupa, were retained to provide a shortlist of candidates who met the role criteria.
Following the extensive work undertaken to identify new Non-Executive Directors, the Board expects to be able to make announcements in the coming months on the new appointments to the Board.
The process for the identification and selection of new Association Members has also been a key activity during 2014, with 12 new Association Members appointed during the year. This recruitment exercise
continues to form a major part of the programme of Association Member refreshment. Odgers Berndtson were retained to assist with the process of identifying potential new Association Members with greater international experience in many of Bupa’s key markets. The Committee also reviewed our Association Member engagement approach.
The Committee also monitored Bupa’s compliance with the UK Corporate Governance Code and continued to develop the governance arrangements of Bupa’s major subsidiary companies, including the approval of a subsidiary governance policy.
PLANS FOR 2015
In 2015, the Committee plans to focus on:
°° Board succession planning, including the recruitment of new Non-Executive Directors to replace current Non-Executive Directors at the end of their tenure, as well as identifying the key skills, knowledge and experience that the Board requires for the future; and
°° continued development of Bupa’s major subsidiary governance arrangements.
Nomination & Governance
Committee report
ATTENDANCE
February May July September October November December
LORD LEITCH A A
PETER CAWDRON 1 – – – – –
LAWRENCE CHURCHILL 2 – –
RITA CLIFTON
STUART FLETCHER A
GEORGE MITCHELL A
ITEMS COVERED INCLUDES:
February Association Member Review and Update/Board Succession Planning and Committee Membership Review/Corporate Governance Report Approval
May Non-Executive Director Recruitment Specification/Committee Membership Review
July Association Member Recruitment Update/Approval of new Subsidiary Company Chairman
September Non-Executive Director Recruitment Update/Association Member Update/Approval of new Subsidiary Company Non-Executive Directors/Board Evaluation Process
October Review of Major Subsidiary Governance Framework
November Non-Executive Director Recruitment Update/Approval of new Subsidiary Company Non-Executive Directors
December Non-Executive Director Recruitment Update/Subsidiary Governance Update/Review of Compliance with UK Corporate Governance Code/Association Member Update
1 Peter Cawdron stepped down from the Committee wef 11 June 2014.2 Lawrence Churchill joined the Committee wef 11 June 2014.A Apologies. Both Lord Leitch and Stuart Fletcher were absent in late 2014 due to illness.
Lord Leitch Committee Chairman
The Committee oversees Board appointments and
governance arrangements.
Governance continued
44BUPA ANNUAL REPORT 2014
GOVERNANCE REPORT

Martin Houston Committee Chairman
Our principal role is to devise and govern remuneration
packages that drive sustainable, long-term
performance.
REMUNERATION POLICY AND LINK TO PERFORMANCE & STRATEGY
As noted, one of our guiding principles is to ensure that pay is reflective of the performance of Bupa. We achieve this by linking the remuneration framework to delivering longer term, strong and sustainable financial performance, meaning we can reach more people and fulfil our purpose: longer, healthier, happier lives.
The link to the company’s strategic objectives is important and we have outlined below some of the key features of our remuneration framework and their link to our strategy:
°° Longer term, strong sustainable performance – under our Long Term Incentive Plan (LTIP) from 2014 onwards, payouts are based on profit, revenue and quality and sustainability measures which include elements related to our customers, people and culture. These measures are key in ensuring the successful delivery of our strategic objectives.
°° Risk – our remuneration framework incorporates a number of features, which ensure that performance is achieved within Bupa’s risk appetite. These include malus and clawback provisions on variable pay arrangements, deferral under our bonus and a holding period on our LTIP.
PERFORMANCE AND PAY IN 2014
As summarised in the CEO’s statement from page 8, 2014 has been a good year for Bupa. During the year we have delivered growth from our existing businesses as well as realising growth from the integration of recent acquisitions. Over the year, we grew revenues by 8% and maintained underlying profit at £637.8m. We continued to invest in new products, services and operations to support future growth.
Annual bonus and LTIP payouts are fully reflective of this performance and are explained in more detail in this report. We have increased our disclosure around bonus payouts to demonstrate the clear link between pay and performance. Specifically, in the discussion around the payouts from the 2014 LTIP, we used a consistent approach from 2013, carefully considered all adjustments and followed the rules of the plan. With the 2014 bonus awards, we applied the new rules for performance above plan, which we have approved for 2015 and beyond. Both of these discussions were rigorous and challenging.
Dear Association Members,
As Chairman of Bupa’s Remuneration Committee, I am pleased to present our Directors’ Remuneration Report for 2014.
When I took over the role as Chairman of the Committee on 11 June 2014, I set out my three key focus areas for the Committee going forward:
1. We are guided in our work by best FTSE practice;
2. In all but exceptional cases, we follow UK corporate governance regulations, guidelines, codes and rules as though we were a FTSE listed company; and
3. We have the right processes in place for determining executive pay, engage in robust challenge and debate, and as a result, we pay for performance.
We are committed to being open and transparent with our Association Members. As such, we will be submitting our Remuneration Policy once again for an advisory vote at the 2015 AGM in keeping with the best practice features we have adopted. As usual, our Annual Report on Remuneration will also be tabled for an advisory vote.
KEY DECISIONS FOR 2015
The Committee decided to award a salary increase of 2.94% to the CEO, which is in line with the average increase for the wider workforce.
On appointment in September 2012, the CFO’s salary was set at a level which was lower than typical market rates, with anticipated scope for progression. Over the past two years, her performance has been excellent and the scope of her role has increased to include responsibility for Company Secretarial and Global Procurement. On this basis and using the market comparators as a guide, the Committee decided to award her a salary increase of 9.88%.
During 2014, a review of the annual bonus plan was undertaken and this work continues. An outcome of this review, from 2015, is the introduction of deferral for our Executive Directors such that 50% of any bonus earned will be deferred for three years. During the deferral period, the payment will be indexed at the Bank of England Base Rate, but be at risk in certain circumstances. We believe this further aligns our remuneration framework with the long-term nature of our strategic goals.
We have strengthened our malus and clawback provisions on all variable pay arrangements to be in line with the recent update of the UK Corporate Governance Code.
LOOKING FORWARD
In the Committee’s 2014 effectiveness self-assessment, we identified some areas in which we saw the opportunity to improve, particularly around the link of strategy to reward. We are working hard to ensure that remuneration reflects the success of achieving our long-term ambitions of delivering exceptional performance, being a healthcare partner to millions more people and being a place where people love to work.
Finally, the Committee’s independent adviser, Deloitte, provided guidance and challenge and I am pleased with their contribution in helping to deliver continuous improvement in the quality of our discussions and decision-making.
Martin Houston Committee Chairman4 March 2015
Remuneration report
45BUPA ANNUAL REPORT 2014
GOVERNANCE REPORT
GO
VE
RN
AN
CE
RE
PO
RT

PAY POLICY TABLE – EXECUTIVE DIRECTORS
ElementPurpose and link to strategy Operation Maximum Opportunity Performance metrics
Base Salary Core element of remuneration set to attract and retain Executive Directors, reflecting their role and contribution.
Salary levels are reviewed annually with any changes becoming effective in April.
Factors taken into account include:
°° level of skill, experience and scope of responsibilities of the individual;
°° overall business performance, scarcity of talent, economic climate and market conditions;
°° increases across Bupa; and°° external market data.
Salary increases are normally in line with those of the Bupa employee population.
Larger increases may be given in certain circumstances including where a new recruit has been appointed on lower than market rate salary with the expectation of phased increases to bring it up to market level.
The Committee does not consider it appropriate to set a maximum salary level.
None
Annual Bonus To drive behaviour and communicate the business priorities for the year.
To motivate and incentivise delivery of performance over the one-year operating cycle.
Bonus levels and the appropriateness of measures and weightings are reviewed annually to ensure they continue to support the business strategy.
Performance over the financial year is measured against stretching financial and non-financial performance targets set at the start of the financial year.
Typically 50% of any bonus awarded will be deferred for a period of up to three years, with the remaining 50% paid in cash. To account for any loss of value over time, a modest uplift will be applied to the deferred amount.
The maximum bonus opportunity will not exceed 150% of base salary.
Annual bonus payments are based on the achievement of challenging financial, non-financial and personal objectives. No less than 75% of the annual bonus will be subject to the achievement of financial measures which will be aligned to the strategic priorities of the business.
Long Term Incentive Plan
To motivate and incentivise delivery of sustained performance over the long term aligned to Bupa’s purpose and strategic objectives.
As Bupa cannot provide incentives based on equity participation, it provides an LTIP in the form of a deferred cash incentive that is broadly reflective of equity-based plans in comparable companies.
Awards are usually made on an annual basis and relate to performance over a three-year period.
Vesting of awards is based on the extent to which performance targets, set and assessed by the Committee, are achieved.
Any payments will be made at the end of the performance period and a portion may be deferred for up to two years.
The maximum award will not exceed 275% of base salary.
Vesting of awards is based on performance against a combination of financial and non-financial measures.
Threshold performance results in a payment of 15% of the maximum.
No less than 75% of the LTIP will be based on financial measures with the remainder based on measures linked to key strategic priorities of the business.
Pension To provide an income after retirement, health security and family protection benefits.
For the current Executive Directors and new appointments, the Company operates a defined contribution pension scheme, called The Bupa Retirement Savings Plan. Executive Directors have the option to take any employer contribution as a cash allowance or a combination of pension and cash allowance.
Although the Company has closed its UK defined benefit scheme (The Bupa Pension Scheme) to new members, a small number of current employees continue to accrue benefits under this plan.
Executive Directors who are eligible to be members of The Bupa Retirement Savings Plan receive employer contributions of up to 30% of base salary.
Members of The Bupa Pension Scheme accrue benefits in line with their contractual terms up to a maximum of 1/30th accrual.
None
Benefits To attract and retain Executive Directors by providing health and wellbeing benefits and providing security for families.
Executive Directors are entitled to a number of benefits which may include private health cover for themselves and their family, an annual health assessment for themselves and their partner, life assurance, income protection insurance, car allowance and 30 days’ annual holiday. The CEO is also entitled to the use of a car and driver.
The benefits offered may need to be changed from time to time to reflect changing circumstances.
There is no specific maximum benefit spend. None
CONTEXT
The aim of Bupa’s remuneration policy is to promote the long-term success of the Company and to motivate management to deliver strong and sustainable business performance aligned with Bupa’s purpose: longer, healthier, happier lives. The policy is intended to deliver a competitive level and mix of remuneration compared with companies of a similar scale and complexity to Bupa.
The Committee reserves the right to make any remuneration payments or payments for loss of office, notwithstanding that they are not in line with the policy set out to the right where the terms of the payment were agreed (i) before the policy came into effect or (ii) at a time when the relevant individual was not a director of the Company and, in the opinion of the Committee, the payment was not in consideration for the individual becoming a director of the Company.
As noted in the Chairman’s letter, we are resubmitting our policy for an advisory vote at our AGM on 14 May 2015 in light of some best practice features we have adopted. This revised policy will be effective from the date of the AGM, subject to Association Member approval.
Policy
Remuneration report continued
46BUPA ANNUAL REPORT 2014
GOVERNANCE REPORT

PAY POLICY TABLE – EXECUTIVE DIRECTORS
ElementPurpose and link to strategy Operation Maximum Opportunity Performance metrics
Base Salary Core element of remuneration set to attract and retain Executive Directors, reflecting their role and contribution.
Salary levels are reviewed annually with any changes becoming effective in April.
Factors taken into account include:
°° level of skill, experience and scope of responsibilities of the individual;
°° overall business performance, scarcity of talent, economic climate and market conditions;
°° increases across Bupa; and°° external market data.
Salary increases are normally in line with those of the Bupa employee population.
Larger increases may be given in certain circumstances including where a new recruit has been appointed on lower than market rate salary with the expectation of phased increases to bring it up to market level.
The Committee does not consider it appropriate to set a maximum salary level.
None
Annual Bonus To drive behaviour and communicate the business priorities for the year.
To motivate and incentivise delivery of performance over the one-year operating cycle.
Bonus levels and the appropriateness of measures and weightings are reviewed annually to ensure they continue to support the business strategy.
Performance over the financial year is measured against stretching financial and non-financial performance targets set at the start of the financial year.
Typically 50% of any bonus awarded will be deferred for a period of up to three years, with the remaining 50% paid in cash. To account for any loss of value over time, a modest uplift will be applied to the deferred amount.
The maximum bonus opportunity will not exceed 150% of base salary.
Annual bonus payments are based on the achievement of challenging financial, non-financial and personal objectives. No less than 75% of the annual bonus will be subject to the achievement of financial measures which will be aligned to the strategic priorities of the business.
Long Term Incentive Plan
To motivate and incentivise delivery of sustained performance over the long term aligned to Bupa’s purpose and strategic objectives.
As Bupa cannot provide incentives based on equity participation, it provides an LTIP in the form of a deferred cash incentive that is broadly reflective of equity-based plans in comparable companies.
Awards are usually made on an annual basis and relate to performance over a three-year period.
Vesting of awards is based on the extent to which performance targets, set and assessed by the Committee, are achieved.
Any payments will be made at the end of the performance period and a portion may be deferred for up to two years.
The maximum award will not exceed 275% of base salary.
Vesting of awards is based on performance against a combination of financial and non-financial measures.
Threshold performance results in a payment of 15% of the maximum.
No less than 75% of the LTIP will be based on financial measures with the remainder based on measures linked to key strategic priorities of the business.
Pension To provide an income after retirement, health security and family protection benefits.
For the current Executive Directors and new appointments, the Company operates a defined contribution pension scheme, called The Bupa Retirement Savings Plan. Executive Directors have the option to take any employer contribution as a cash allowance or a combination of pension and cash allowance.
Although the Company has closed its UK defined benefit scheme (The Bupa Pension Scheme) to new members, a small number of current employees continue to accrue benefits under this plan.
Executive Directors who are eligible to be members of The Bupa Retirement Savings Plan receive employer contributions of up to 30% of base salary.
Members of The Bupa Pension Scheme accrue benefits in line with their contractual terms up to a maximum of 1/30th accrual.
None
Benefits To attract and retain Executive Directors by providing health and wellbeing benefits and providing security for families.
Executive Directors are entitled to a number of benefits which may include private health cover for themselves and their family, an annual health assessment for themselves and their partner, life assurance, income protection insurance, car allowance and 30 days’ annual holiday. The CEO is also entitled to the use of a car and driver.
The benefits offered may need to be changed from time to time to reflect changing circumstances.
There is no specific maximum benefit spend. None
MALUS AND CLAWBACK
Malus and clawback provisions may be operated at the discretion of the Committee in respect of awards granted under the annual bonus and LTIP. Malus (under which awards may be reduced, cancelled or made subject to additional conditions) may be applied prior to the satisfaction of the award. Clawback (requiring a repayment of cash which has been delivered) may be operated for up to three years following payment of the non-deferred element of the annual bonus and five years from grant for the LTIP.
Circumstances in which the operation of these provisions may be considered include:
°° misstatement of results;
°° an error in assessing any relevant performance metric or in the information or assumptions on which the annual bonus or LTIP is determined;
°° serious reputational damage to Bupa or a relevant business unit;
°° a scenario in which significant risk has been taken which is outside of Bupa’s or a relevant business unit’s risk appetite;
°° gross misconduct or material breach of employment contract;
°° any other circumstance which the CEO or the Remuneration Committee in its discretion considers to be similar in nature or effect to the above.
REMUNERATION COMMITTEE DISCRETION
The Remuneration Committee has ultimate discretion in relation to payments to Executive Directors under the Company’s incentive plans. With respect to the annual bonus, if the Committee determines that a minimum level of performance has not been achieved, no bonus will be payable; and with respect to the LTIP, the Committee may adjust the level of vesting to ensure that it is aligned to the underlying performance of the business.
47BUPA ANNUAL REPORT 2014
GOVERNANCE REPORT
GO
VE
RN
AN
CE
RE
PO
RT

SERVICE CONTRACTS FOR EXECUTIVE DIRECTORS
Executive Directors have a 12-month rolling employment contract. The notice requirements are 12 months on either side, which may be payable in lieu. The contracts also include specific post-termination restrictions. Executive Directors are usually permitted, subject to approval, to have one external Non-Executive Director role and to accept and retain the fee for this appointment. This is on the basis that any external appointment does not give rise to a conflict of interest.
PERFORMANCE MEASURES AND TARGET SETTING
The performance measures for the annual bonus are aligned to delivery of Bupa’s annual operating plan and may include personal objectives that change from year to year.
Targets for the LTIP are set by the Remuneration Committee taking into account a number of internal and external reference points which include historic Bupa performance, internal forward looking plans and broader market trends. Targets are set for vesting at threshold, ‘on-target’ and out-performance levels.
ILLUSTRATIONS OF THE APPLICATION OF THE REMUNERATION POLICY
Bupa aims to provide a balance of fixed and variable compensation that provides stability while also incentivising superior business performance. At target, over 50% of Executive Directors’ remuneration is based on individual and company performance.
The graphs illustrate the possible variation for different levels of performance. The percentages represent each element as a percentage of base salary.
APPROACH TO REMUNERATION ON RECRUITMENT
Our approach to remuneration on recruitment is to pay no more than is necessary and appropriate to attract the right talent to the role.
The remuneration policy table on pages 46 to 47 sets out the various components which would be considered for inclusion in the remuneration package for the appointment of an Executive Director. Typically a new appointment will have (or be transitioned onto) the same framework that applies to other Executive Directors as set out in the policy table. Salary would reflect the skills and experience of the individual, and may be set at a level to allow future salary progression to reflect performance in the role.
It would be expected that the structure and quantum of the variable pay elements would reflect those set out in the policy table.
To facilitate recruitment, the Committee may make compensatory payments and/or awards for any remuneration arrangements subject to forfeit on leaving a previous employer. We will seek to replicate, as far as practicable, the potential value and time horizon of such remuneration, as well as performance conditions that may apply. In some circumstances, it might also be necessary to set up additional or alternative arrangements including but not limited to:
°° relocation-related expenses; and
°° international assignment allowances and expenses.
In the case of internal promotions, any commitments made before appointment may continue to be honoured unless an alternative approach, more closely aligned to the prevailing policy, is agreed by the Remuneration Committee.
Any special joining arrangement payments may include clawback tied to leaving within a certain period.
Policy
Remuneration report continued
0
500
1000
1500
2000
2500
3000
3500
4000
4500
Potential maximumOn targetFixed pay Potential maximumOn targetFixed pay
LTIP Annual Bonus Other Benefits Pension Salary
150%
100%
137.5%
275%
150%
100%
200%
112.5%
75%
REMUNERATION AT VARIOUS PERFORMANCE LEVELS (£’000)
Chief Executive O�cer Chief Financial O�cer
48BUPA ANNUAL REPORT 2014
GOVERNANCE REPORT

POLICY ON PAYMENTS FOR LOSS OF OFFICE
In the table to the right, we summarise the key elements of our policy on payment for loss of office, which will comply with the relevant plan rules and will consider local employment legislation.
Any payments made due to loss of office may include malus or clawback provisions as described under malus and clawback on page 47.
DIFFERENCES IN REMUNERATION POLICY FOR EXECUTIVE DIRECTORS COMPARED WITH OTHER EMPLOYEES
The Remuneration Policy for the Executives is designed to be broadly similar to the policy applicable to Bupa employees to ensure that they are all aligned to delivering sustainable business performance. Although the size of the opportunity varies, the underlying principles of the salary review cycle, annual incentive and LTIP remain the same for the senior employee population. Junior employees are not eligible for LTIP awards, although most have an annual bonus opportunity. In some cases, additional flexibility has been introduced for the Executive Directors and senior employees (e.g. to provide the choice to receive cash in lieu of pension contributions) to allow for personal circumstances. Employees have not been consulted when drawing up the Remuneration Policy.
SERVICE CONTRACTS FOR NON-EXECUTIVE DIRECTORS
Terms of engagement for the Non-Executive Directors of Bupa set out the fees and benefits to which they are entitled as well as the expectation of the time commitment required to effectively perform their role. Copies of the standard terms of engagement are available on bupa.com.
The table to the right describes the pay policy as it applies to the Chairman and Non-Executive Directors.
POLICY ON PAYMENTS FOR LOSS OF OFFICE
Provision Policy
Notice period and compensation for loss of office in service contracts
°° 12 months’ notice from the Company to the Executive Director.
°° Up to 12 months’ base salary (in line with the notice period). Notice period payments will either be made as normal (if the Executive Director continues to work during the notice period or is on garden leave) or at the termination date for any unexpired notice period.
Treatment of annual bonus on loss of office under plan rules
°° The Committee may make an annual bonus payment for the year of cessation depending on the reason for leaving. Typically, the Committee will take into consideration the period served during the year and the individual’s performance up to cessation. Any such payment is at the discretion of the Committee.
°° If an Executive Director leaves the Company after the end of the financial year but before the bonus payment date, for reason of redundancy, pre-agreed retirement, death, or as part of the sale of a Bupa business, they will be eligible for a bonus payment for the previous financial year. For any other reason, they will not be eligible for a bonus payment.
°° Any bonus will be paid at the normal time following the end of the bonus year.
Treatment of LTIP on loss of office under plan rules
°° An Executive Director’s award will vest in accordance with the terms of the plan and satisfaction of performance conditions measured at the normal completion of the performance period if the reason for leaving is redundancy, pre-agreed retirement, early retirement on the grounds of ill health, death or any other special circumstance agreed by the Committee. In these cases, final awards will be pro-rated based on completed months of service, in 36ths for the actual period of active employment during the plan performance period. The period of active employment excludes any period of garden leave or other such period when the Executive Director was legally employed but not required to actively carry out their duties. For any other reason, they will not be eligible for an LTIP payment.
°° Any LTIP payment will be paid at the normal time, e.g. in April following the end of the performance period, or two years later for any deferral.
Pension and benefits
°° Generally pension and benefit provisions will continue to apply until the termination date.
PAY POLICY TABLE – NON-EXECUTIVE DIRECTORS
ElementPurpose and link to strategy Operation
Fees To attract and provide stability, reflecting the complexity of the role and time commitment required
The Chairman receives an all inclusive fee.
NEDs receive a fixed basic fee. Additional fees are paid for chairing and membership of Board Committees and/or additional work in relation to subsidiaries, and for the Senior Independent Director role.
Fees are reviewed annually by the Board with any changes implemented in July. Key factors taken into account include:
°° overall business performance;
°° scope and responsibility of the role; and
°° appropriate market data.
Benefits To provide health and wellbeing benefits aligned with Bupa’s purpose
During their time in office, NEDs are entitled to private health cover for themselves and their family and an annual health assessment for themselves and their partner. The Chairman is also entitled to the use of a car and driver.
49BUPA ANNUAL REPORT 2014
GOVERNANCE REPORT
GO
VE
RN
AN
CE
RE
PO
RT

Implementation (audited)
Remuneration report continued
EXECUTIVE DIRECTORS: SINGLE TOTAL FIGURE OF REMUNERATION (£’000)
Stuart Fletcher Evelyn BourkeRay King
(Former Director)
2014 2013 2014 2013 2014 2013
Salary 711 700 484 475 – –
Benefits 43 45 13 13 – –
Annual bonus 882 748 464 588 – –
LTIP 963 – 219 – 156 493
Pension 213 210 145 143 – –
Total 2,812 1,703 1,325 1,219 156 493
NOTES
* Annual bonus refers to bonus payments earned during that year, and LTIP refers to payouts from the plan which ended in that year.
Stuart Fletcher’s salary was £714,000 from 1 April 2014. He was not a participant in the 2011-2013 LTIP, and he received cash in lieu of a pension.
Evelyn Bourke’s salary was £486,875 from 1 April 2014. Her bonus figure for 2013 included a payment of £202,500 which was a contractual commitment made at the time of her appointment. She was not a participant in the 2011-2013 LTIP. Her 2012-2014 LTIP award was adjusted to reflect the fact that she joined Bupa in September 2012, and includes an additional on-target award of £120,000 which was a contractual commitment made at the time of her appointment. In 2014 she received cash in lieu of a pension. In 2013 she received a combination of pension contribution and cash in lieu – the amount has been restated by an increase of £10,000. She is a Non-Executive Director of IFG and received a fee of €46,000 in respect of her position, which is not disclosed in the table above.
Ray King retired from the Company on 30 June 2012 and in accordance with the plan rules, he received pro-rata payments for time served under the 2011-2013 LTIP and the 2012-2014 LTIP.
2014 ANNUAL BONUS PAYOUT
CEO CFO
On Target Performance
Level £(m)
Actual Performance
Level £(m)
Max bonus (% of
salary)
Actual payout
(% of salary)
Max bonus (% of
salary)
Actual payout
(% of salary)
Group profit 591.9 636.3 75.0% 59.4% 56.3% 44.5%
Group revenue 10,776.9 10,727.3 37.5% 28.3% 28.1% 21.3%
Key personal objectives 37.5% 35.8% 28.1% 29.5%
Total 150.0% 123.5% 112.5% 95.3%
Financial targets are assessed at constant exchange rates, set at the start of the year.
financial targets for the annual bonus, and actual performance of the Company are shown in the table above. For both Executive Directors, their achievement against key personal objectives was assessed independently by the Committee.
The resulting payout reflects Bupa’s strong performance during 2014 as the organisation has made significant steps towards transforming the business to achieve our Bupa 2020 vision. At constant exchange rates, underlying profit has grown 8%, however, adverse movements in the rates have cancelled out this growth meaning that on an unadjusted basis underlying profit was maintained compared to 2013. We have also made
significant capital investments during the year and delivered cost savings.
The revenue growth in 2014 has been particularly promising which was achieved both through acquisitions such as Cruz Blanca Salud, as well as from the existing business.
The assessment of performance against key personal objectives considered, for the CEO, his leadership, financial delivery, executive team development and delivery, contributions to culture, and strengthening of risk and controls, and for the CFO, her capital management, successful bond launch, leadership of a very strong drive for cash delivery, role in M&A activity, and strengthening of risk and controls.
The Implementation Report sets out details of Executive Directors’ pay and shows how the Executive Directors’ remuneration policy has been implemented in 2014 and how it will be applied for 2015. As well as disclosing remuneration figures for the Executive Directors, it includes details on the degree to which performance targets have been achieved and the resulting level of annual bonus payout and vesting of long-term awards.
Set out to the right is a table showing a single total figure of remuneration for each Executive Director in 2014. Comparable figures for 2013 are also included in this table.
DETAIL OF PERFORMANCE AGAINST METRICS FOR VARIABLE AWARDS
For 2014, the CEO’s target bonus opportunity was 100% of salary with a maximum of 150% of salary. The CFO’s target bonus opportunity was 75% of salary with a maximum of 112.5% of salary. The performance measures used to determine the 2014 annual bonus for our Executive Directors were as follows:
°° Group profit (50% of award) – similar to underlying profit before taxation, with the most significant differences being the inclusion of restructuring and transaction costs on acquisitions and disposals;
°° Group revenue (25% of award) – includes Bupa’s proportionate share of revenue from associates and joint ventures, which is not included within reported revenue; and
°° key personal objectives (25% of award).
The Committee assessed the profit and revenue elements against the targets set at the start of the year and are comfortable that the amounts earned reflect Bupa’s underlying financial performance. The
50BUPA ANNUAL REPORT 2014
GOVERNANCE REPORT

2012-2014 LTIP VESTING
Vesting of the 2012-2014 LTIP is based on performance over the three-year period ending 31 December 2014. Performance is assessed against targets for growth in the Income and Expenditure Reserve (75% weighting) and Risk Adjusted Profit (25% weighting). These metrics are calculated using reported exchange rates.
Over the performance period, the Reserve grew to a total of £1,450.6m compared to the target of £1,493.3m. The Risk Adjusted Profit grew to a total of £157.0m compared to the target of £200.1m. Overall, these achievements lead to a calculated payout at 91.7% of the target award, 70.5% of the maximum award.
The Committee determined this was an appropriate payout level.
INTERESTS AWARDED DURING 2014
During the year, LTIP awards for the 2014-2016 Plan were made to Executive Directors. The Plan covers the three-year performance period to 31 December 2016. Subject to the achievement of performance conditions, up to 50% of the award may be paid in April 2017 with any excess being deferred for a further two years.
Approximately 240 senior managers across Bupa participate in the plan, based on the same framework as the Executive Directors, with award levels calculated as a percentage of salary which is scaled down based on their level of seniority and accountability. Vesting of the awards is dependent upon performance against specific financial and non-financial measures over a three-year performance period.
Profit after tax is weighted at 75% and revenue is weighted at 15%. In order for any level of payout to occur for revenue performance achievement, a performance gateway applies in that the profit after tax threshold must be achieved. The remaining 10% weighting for the LTIP is based on the achievement of quality and sustainability measures (non-financial measures) which cover key customer, people and culture, and sustainability measures.
The targets and weightings for both the financial and non-financial measures comprising the 2014 awards are set out in the tables to the right above.
FINANCIAL TARGETS 2014-2016 LTIP (90% WEIGHTING)
Profit after tax Weighted 75%
Revenue Weighted 15%
Below threshold performance 0% vesting
< 6% p.a. < 6% p.a.
Threshold performance 15% vesting
6% p.a. 6% p.a.
On-target performance 50% vesting
9% p.a. 10% p.a.
Out-performance 100% vesting
20% p.a. 15% p.a.
Growth is measured as a compound annual growth rate.Straight-line vesting occurs between the discrete levels of achievement.
NON-FINANCIAL TARGETS 2014-2016 LTIP (10% WEIGHTING)
0% vesting Outcomes and improvements are significantly below expectations
30% – 70% vesting Outcomes and improvements are broadly in line with expectations
70% – 100% vesting Outcomes and improvements are significantly above expectations
The table below shows the detail of the awards made to the Executive Directors in the year.
LONG-TERM INCENTIVE PLAN
Scheme Type 2014-2016 Long-Term Incentive Plan
CEO CFO
Basis of award 275% of base salary 200% of base salary
Face value of award (100% of award) £1,925,000 £950,000
Amount that would vest at on-target performance (50% of award)
£962,500 £475,000
Amount that would vest at threshold performance (15% of award)
£288,750 £142,500
Date performance period ends 31 December 2016
Payment due date April 2017, and April 2019 (if applicable)
51BUPA ANNUAL REPORT 2014
GOVERNANCE REPORT
GO
VE
RN
AN
CE
RE
PO
RT

Remuneration report continued
HISTORICAL PAYOUT TABLE
The table to the right shows levels of payout to the CEO against the maximum opportunity for the last five years.
PERCENTAGE CHANGE IN REMUNERATION OF THE CEO
The table to the right shows the change in salary, benefits and short term incentives (annual bonus) for the CEO in 2014 compared to 2013 alongside a corresponding average figure for the Bupa employee comparator group. The UK salaried population has been chosen as the comparator group as the market trends and economic environment are most closely aligned to a UK based CEO (*).
RELATIVE IMPORTANCE OF SPEND ON PAY
The table to the right shows the relative importance of spend on pay. Given that Bupa does not have shareholders and therefore does not pay dividends, cash flow used in investing activities has been shown as an alternative measure.
HISTORICAL PAYOUT
Year CEO
Single figure of total
remuneration(£’000)
Annual bonus payout against
maximum opportunity %
Long-term incentive vesting
rates against maximum
opportunity %
2014 Stuart Fletcher 2,812 124% 71%
2013 Stuart Fletcher 1,703 71% **N/A
2012* Stuart Fletcher 1,670 100% **N/A
2012* Ray King 1,797 67% 83%
2011 Ray King 3,099 67% 83%
2010 Ray King 2,715 100% 100%
* Stuart Fletcher joined Bupa on 1 March 2012 and Ray King retired on 30 June 2012.** Stuart Fletcher did not receive payouts from these plans. However, the payment to other eligible
participants was 83% in 2012 and 84% in 2013 respectively.
PERCENTAGE CHANGE IN REMUNERATION OF THE CEO
CEO Employees
Salary 2.00% 2.41%
Benefits (excluding pensions) No material change No material change
Short Term Incentives 17.91% 10.80%
* The UK salaried population refers to the UK based permanent employees whose records are held on the HR database.
RELATIVE IMPORTANCE OF SPEND ON PAY
2014 (£m)
2013 (£m)
Difference (£m)
Remuneration paid to all employees 1,390.4 1,326.6 63.8
Cash flow used in investing activities 372.7 1,167.6 (794.9)
Implementation (audited)
52BUPA ANNUAL REPORT 2014
GOVERNANCE REPORT

STATEMENT OF IMPLEMENTATION OF REMUNERATION POLICY IN 2015
In the current financial year (2015) Bupa intends to implement the remuneration policy as described in the Pay Policy Table on pages 46 to 47.
The CEO’s and CFO’s salaries were reviewed by the Committee and they have determined that with effect from 1 April 2015 their new annual base salaries will be £735,000 (2.94% increase) and £535,000 (9.88% increase), respectively. The CEO’s salary increase is in line with the average increase for the wider workforce.
The Committee considered that Ms Bourke had been appointed to her role in 2012 on a lower than market rate salary with anticipated scope for progression. Since that time her role in Bupa has expanded, and her performance has been excellent which warranted the increase to bring her total remuneration package in line with the market.
The Annual Bonus was reviewed during 2014 to ensure it remained aligned with Bupa’s strategy and best practices from the Listed market. The revised plan will operate from 1 January 2015. The main changes for the Executive Directors were (i) to introduce deferral of 50% of any annual bonus earned for a period of three years and subject to malus; and (ii) introduction of clawback provisions.
The target and maximum individual opportunities remain unchanged (i.e. the CEO target bonus is 100% salary and the CFO’s is 75% salary, both with a maximum of 150% of the target opportunity). In addition the performance measures and weights remain unchanged for the CEO and CFO.
The LTIP for 2015-2017 remains similar to the plan for 2014-2016. It is intended that an award of £1,963,500 (275% of salary) is made to the CEO and an award of £973,750 (200% of salary) is made to the CFO. The fair (on-target) value of these awards is £981,750 (137.5% of salary) for the CEO and £486,875 (100% of salary) for the CFO.
The targets and weightings for both the financial and non-financial measures comprising the 2015 awards are set out in the tables to the right above.
FINANCIAL TARGETS 2015-2017 LTIP (90% WEIGHTING)
Profit after tax Weighted 75%
Revenue Weighted 15%
Below threshold performance 0% vesting
< 7% p.a. < 5% p.a.
Threshold performance 15% vesting
7% p.a. 5% p.a.
On-target performance 50% vesting
10% p.a. 8% p.a.
Out-performance 100% vesting
20% p.a. 17% p.a.
Growth is measured as a compound annual growth rate.
Straight-line vesting occurs between threshold and target levels of achievement, with accelerated vesting occurring between target and out-performance levels of achievement.
NON-FINANCIAL TARGETS 2015-2017 LTIP (10% WEIGHTING)
0% vesting Outcomes and improvements are significantly below expectations
30% – 70% vesting Outcomes and improvements are broadly in line with expectations
70% – 100% vesting Outcomes and improvements are significantly above expectations
NON-EXECUTIVE DIRECTORS: SINGLE TOTAL FIGURE OF REMUNERATION (£’000)
Fees Benefits Total
2014 2013 2014 2013 2014 2013
Lord Leitch (Chairman) a 330 325 45 47 375 372
Peter Cawdron b 34 80 – 1 34 81
Lawrence Churchill 118 115 1 1 119 116
Rita Clifton c 66 65 1 1 67 66
Patricia Hewitt d 27 29 – – 27 29
Martin Houston e 73 – 1 – 74 –
John Lorimer 117 115 1 1 118 116
George Mitchell 169 164 1 1 170 165
Prof Sir John Tooke 79 78 1 1 80 79
Total 1,013 971 51 53 1,064 1,024
NOTES a Lord Leitch’s fees for 2013 have been restated.b Peter Cawdron ceased to be a Non-Executive Director with effect from 11 June 2014.c Rita Clifton ceased to be a member of the Executive Sustainability Committee with effect from
1 September 2014.d Patricia Hewitt ceased to be a Non-Executive Director with effect from 11 June 2014.e Martin Houston was appointed as a Non-Executive Director with effect from 1 January 2014. He joined
the Risk and Audit Committees on 13 February 2014 and was appointed Chairman of the Remuneration Committee on 11 June 2014.
53BUPA ANNUAL REPORT 2014
GOVERNANCE REPORT
GO
VE
RN
AN
CE
RE
PO
RT

Remuneration report continued
Implementation (audited)
REMUNERATION COMMITTEE
Peter Cawdron chaired the Committee until the conclusion of the AGM on 11 June 2014 when he stepped down from the Board. Martin Houston then became the Committee Chairman. Patricia Hewitt also left the Committee on 11 June 2014 when she stepped down from the Board.
In addition to the Company Secretary, regular attendees at the Remuneration Committee meetings who have provided comment and advice were the CEO, the CFO, the Chief People Officer and the Reward Director.
The Committee review the quality and independence of their advisors on a regular basis. Our current independent advisers, Deloitte, were initially appointed in 2012.
Deloitte is a member of the Remuneration Consultants’ Group and voluntarily operate under their code of conduct when providing advice on executive remuneration in the UK. The total fees paid to Deloitte for the provision of independent advice to the Committee in 2014 were £71,950, charged on a time and materials basis. During the year, Deloitte also provide miscellaneous taxation, corporate finance and consulting advice to Bupa.
The Terms of Reference for the Committee were reviewed by the Committee in December 2014 and adopted by the Board in February 2015. A copy of the Committee’s Terms of Reference is available on bupa.com.
PLANS FOR 2015
During 2015, we intend to continue our review of the annual bonus scheme, with consideration given to introducing a more balanced scorecard of measures aligned with our strategic objectives for the 2016 annual bonus scheme.
ATTENDANCE
13 February 27 February October December
PETER CAWDRON1 – –
MARTIN HOUSTON2 – –
LORD LEITCH A
RITA CLIFTON
PATRICIA HEWITT3 – –
GEORGE MITCHELL
ITEMS COVERED INCLUDED:
February Annual Remuneration Proposals for Executives/Review Design of 2014-2016 LTIP Performance Measures and Targets/Review of the Committee’s Independent Advisor
Determining LTIP Payout Level for the 2011-2013 Plan
October Proposed redesign of Annual Bonus scheme
December 2015 Annual Bonus Deferral/LTIP Update/Outperformance Incentives for 2014/2016 Annual Bonus Design/Malus and Clawback Provisions/2014 Directors’ Remuneration Report/Committee Terms of Reference
1 Peter Cawdon left the Committee on 11 June 2014.2 Martin Houston joined the Committee on 11 June 2014.3 Patricia Hewitt left the Committee on 11 June 2014.A Apologies.
VOTING AT THE ANNUAL GENERAL MEETING
The Association Members will be invited to vote at the Annual General Meeting on 14 May 2015 on the revised Remuneration Policy and the Implementation Report.
The revisions to the Remuneration Policy only apply to the clarification of clawback and deferral provisions in the annual bonus arrangements for Executive Directors. It is proposed in the revised Policy that, for awards made from 2015 onwards, there will be further flexibility permitted so that the Committee will have the discretion to determine:
°° clawback amount – the basis on which the clawback amount is calculated, including whether and to what extent any tax or social security liability will be taken into account; and
°° deferral – any partial deferral in relation to the annual bonus amount.
If the revised Policy is approved, this would mean that for the 2015 performance year, 50% of the annual bonus would be paid in cash and 50% deferred for a further three years and will be subject to malus during the deferral period. To account for any loss of value over time, an uplift based on the Bank of England Base Rate will be applied to the deferred amount.
54BUPA ANNUAL REPORT 2014
GOVERNANCE REPORT

Biographical details of the Non-Executive Chairman, two Executive Directors and seven Non-Executive Directors who held office at the end of the year, are set out on pages 30 to 31. Martin Houston was appointed as a Non-Executive Director with effect from 1 January 2014. The Rt Hon Patricia Hewitt and Peter Cawdron both stepped down from the Board at the AGM on 11 June 2014.
As at the date of this report, indemnities are in force under which the Company has agreed to indemnify the Directors and certain senior managers, to the extent permitted by law and the Company’s articles of association, in respect of all losses arising out of, or in connection with, the execution of their powers, duties and responsibilities, as Directors of the Company or any of its subsidiaries.
GOING CONCERN
The Directors confirm that they are satisfied that the Company and the Group has adequate resources to continue in operation for the foreseeable future. Accordingly, they continue to adopt a going concern basis in preparing the financial statements.
POLITICAL CONTRIBUTIONS
No political donations were made, nor any political expenditure incurred.
EMPLOYMENT POLICIES
Bupa continues to regard communication with its employees as a key aspect of its policies. Information is given to employees about employment matters and about the financial and economic factors affecting the Company’s performance through management channels. Employees are encouraged to discuss operational and strategic issues with their line management and to make suggestions aimed at improving performance. Every effort is made by the Directors and management to inform, consult and encourage the full involvement of staff on matters concerning them as employees and affecting the Company’s performance.
Bupa is committed to providing equal opportunities to employees. The employment of disabled persons is included in this commitment; and the recruitment, training, career development and promotion of disabled persons is based on the aptitudes and abilities of the individual. Should employees become disabled during employment, every effort
The Strategic Report and the audited Financial Statements are presented on pages 1 to 27, and from page 58, respectively. The Governance Report on pages 28 to 54, including the Remuneration Report on pages 45 to 54, all form part of this report.
The Directors have chosen, in accordance with section 414C(11) of the Companies Act 2006, to set out in the Strategic Report on pages 1 to 27 the following information which would otherwise be required by Schedule 7 of the Large and Medium-Sized Companies and Groups (Accounts and Reports) Regulations 2008 to be disclosed in the Directors’ Report: Disclosures concerning Greenhouse Gas Emissions.
FINANCIAL RESULTS
The results of the Group for 2014 are reported on pages 60 to 118. The profit for the financial year of £522.8m (2013: profit £411.4m) has been transferred to equity.
ACQUISITIONS AND DISPOSALS
Details of the acquisitions and disposals made during the year are shown in Note 4.0.
BOARD OF DIRECTORS
The Board is responsible for the good standing of the Company, the management of its assets, including the management of risk and the strategy for its future development. There are ten Board meetings each year and other meetings are convened as needed.
would be made to continue their employment and, if necessary, appropriate training would be provided.
DISCLOSURE OF INFORMATION TO AUDITORS
The Directors who held office at the date of approval of this Directors’ report confirm that, so far as they are each aware, there is no relevant audit information of which the Company’s auditors are unaware; and each Director has taken all the steps which they ought to have taken as a Director to make themselves aware of any relevant audit information, and to establish that the Company’s auditors are aware of that information.
AUDITORS
A resolution to re-appoint KPMG LLP as auditors will be put to the forthcoming Annual General Meeting of the Company.
HEALTH & SAFETY
In the UK there were 87 RIDDOR (Reporting of Injuries, Diseases and Dangerous Occurrences Regulations 2013) reportable incidents in 2014, compared with 98 in 2013. There were 6,290 employee incidents in total in 2014. This equates to 8.3 injuries per 100 employees compared to 8.1 in 2013. Our continued focus on driving incident reporting and incident rates in our new businesses have contributed to this increase.
By order of the Board.
Julian Sanders Company Secretary4 March 2015
Company number: 432511
Report of the Board
of Directors
The Directors of The British United Provident Association Limited (‘Bupa’) present their
reports and the financial statements for the year
ended 31 December 2014.
GO
VE
RN
AN
CE
RE
PO
RT
55BUPA ANNUAL REPORT 2014
DIRECTORS’ REPORT

IN RESPECT OF THE ANNUAL REPORT AND THE FINANCIAL STATEMENTS
The Directors are responsible for preparing the Annual Report and the Group and Parent Company financial statements in accordance with applicable law and regulations.
Company law requires the Directors to prepare Group and Parent Company financial statements for each financial year. Under that law they have elected to prepare the Group and the Parent Company financial statements in accordance with IFRS as adopted by the EU and applicable law.
Under company law the Directors must not approve the financial statements unless they are satisfied that they give a true and fair view of the state of affairs of the Group and Parent Company and of their profit or loss for that period. In preparing each of the Group and Parent Company financial statements, the Directors are required to:
°° select suitable accounting policies and then apply them consistently;
°° make judgements and estimates that are reasonable and prudent;
°° state whether they have been prepared in accordance with IFRS as adopted by the EU; and
°° prepare the financial statements on the going concern basis unless it is inappropriate to presume that the Group and the Parent Company will continue in business.
The Directors are responsible for keeping adequate accounting records that are sufficient to show and explain the Parent Company’s transactions and disclose with reasonable accuracy at any time the financial position of the Parent Company and to enable them to ensure that its financial statements comply with the Companies Act 2006. They have a general responsibility for taking such steps as are reasonably open to them to safeguard the assets of the Group and to prevent and detect fraud and other irregularities.
The Directors consider that the Annual Report and financial statements taken as a whole is fair, balanced and understandable and provides the information necessary for Association Members to assess the Group’s performance, business model and strategy.
The Directors have decided to prepare voluntarily a Directors’ Remuneration Report in accordance with Schedule 8 to The Large and Medium-Sized Companies and Groups (Accounts and Reports) Regulations 2008 made under the Companies Act 2006, as if those requirements were to apply to the Company.
The Directors have also decided to prepare, voluntarily, a Corporate Governance Statement as if the Company was required to comply with the Listing Rules and the Disclosure Rules and Transparency Rules of the Financial Conduct Authority in relation to those matters.
The Directors are responsible for the maintenance and integrity of the corporate and financial information included on the Company’s website. Legislation in the UK governing the preparation and dissemination of financial statements may differ from legislation in other jurisdictions.
Statement of Directors’
Responsibilities
56BUPA ANNUAL REPORT 2014
DIRECTORS’ REPORT

FIN
AN
CIA
L STAT
EM
EN
TS
57BUPA ANNUAL REPORT 2014
Accounting policies that are relevant to the financial statements as a whole are
described in Section 1 ‘Basis of preparation’. Thereafter, the notes to the financial statements have been
presented under five key headings: ‘Results for the year’, ‘Operating assets and liabilities’, ‘Business
combinations and disposals’, ‘Risk management and Capital management’,
and ‘Other notes’.
For The British United Provident Association
Limited on a standalone basis (the ‘Company’) primary
statements and associated notes are set out in Section 7.
Each section sets out the relevant accounting policies
applied in producing the notes, along with disclosures of any key judgements and
estimates used.
Independent Auditors’ report 58
Primary statements 60
Section 1 – Basis of preparation 65
Section 2 – Results for the year
Operating segments 67Revenues 69Insurance claims 70Other operating expenses 71 Other income and charges 72 Financial income and expenses 72 Taxation expense 73
Section 3 – Operating assets and liabilities
Working capital 74Intangible assets 76Property, plant and equipment 79Investment properties 83Provisions and other liabilities 84 under insurance contracts issued Provisions for liabilities and charges 86Post employment benefits 87Deferred taxation assets and liabilities 91
Section 4 – Business combinations and disposals 93
Equity accounted investments 100
Section 5 – Risk management and Capital management
Financial investments 102Borrowings 105Derivatives 107Capital management 107Risk management 108Insurance risk 108Market risk 109Credit risk 114Liquidity risk 116
Section 6 – Other notes
Related party transactions 118Commitments and contingencies 118
Section 7 – Company primary statements and associated notes
Primary statements 119Intangible assets 121Property, plant and equipment 122Investment in subsidiaries 123Additional subsidiary disclosure 124Post employment benefits 125Provisions for liabilities and charges 127Working capital 127Risk management 128Deferred taxation assets and liabilities 128Related party transactions 130Commitments and contingencies 130
Section 8 – Five year financial summary 131
Financial Statements

58BUPA ANNUAL REPORT 2014
INDEPENDENT AUDITORS' REPORT
OUR OPINION ON THE FINANCIAL STATEMENTS IS UNMODIFIEDWe have audited the financial statements of The British United Provident Association Limited for the year ended 31 December 2014 set out on pages 60 to 130. In our opinion:
°° the financial statements give a true and fair view of the state of the Group’s and of the Parent Company’s affairs as at 31 December 2014 and of the Group’s profit for the year then ended;
°° the Group financial statements have been properly prepared in accordance with International Financial Reporting Standards as adopted by the European Union (IFRS as adopted by the EU);
°° the Parent Company financial statements have been properly prepared in accordance with IFRS as adopted by the EU and as applied in accordance with the provisions of the Companies Act 2006; and
°° the financial statements have been prepared in accordance with the requirements of the Companies Act 2006.
OUR ASSESSMENT OF RISKS OF MATERIAL MISSTATEMENTIn arriving at our audit opinion above on the Group financial statements the risks of material misstatement that had the greatest effect on our audit were as follows:
Valuation of General Insurance contracts – Provisions for Claims, within Provisions under Insurance Contracts Issued (refer to pages 38 to 40 (Audit Committee Report) and Section 3.4)°° The risk – The Group’s operations include a number of general insurance entities writing health insurance policies primarily in the UK, Spain, Australia and Latin America. The process of recognising the provision for claims arising from general insurance contracts is an inherently complex area, requiring judgement and actuarial expertise to determine the provision. This complexity arises from the need to estimate the provision using historical data which is sensitive to external inputs, such as claims cost inflation and medical trends, as well as the actuarial assumptions on current and future experience.
°° Our response – Our audit procedures included evaluating and testing the key controls over the provisioning process, including controls over the completeness and accuracy of the data that supports key reserving calculations, such as the accuracy of data in respect of current and historical claims. This provides us with evidence over trends in claims and their costs which drive the assumptions for claims, in current and preceding financial years which have not yet been paid at the date of the financial statements. We used our own actuarial specialists to assist us in evaluating and challenging the assumptions and methodologies used by the Group in each territory, comparing them to expectations based on the Group’s historical experience, current trends and our own industry knowledge in each territory. These assumptions include trends in the cost of claims over time, claims cost inflation and medical trends and current claims experience. We applied sensitivities to the assumptions in assessing the appropriateness and adequacy of the provisions recognised by the Group. We used our industry knowledge to benchmark the Group’s reserving methodologies and claims experience. We assessed whether the Group’s disclosures in relation to the assumptions in respect of provisions for claims in respect of general insurance business were appropriate.
Carrying value of goodwill in Bupa Care Services UK and New Zealand, Bupa Chile, LUX MED and Quality HealthCare businesses (refer to pages 38 to 40 (Audit Committee Report) and Section 3.1)°° The risk – the performance of impairment reviews of goodwill within the Bupa Care Services UK and New Zealand cash-generating units is complex and typically requires a high level of judgement, particularly in the current economic climate, as growth in some markets has slowed in recent years and the cost base in the care services sector may increase faster than revenues, reducing future profitability. In the Bupa Chile, LUX MED and Quality HealthCare cash-generating units the impairment review also requires a high level of judgement as these businesses were acquired more recently and there is a low level of headroom in the impairment calculations. The most significant judgements arise from the inherent uncertainty
involved in forecasting future cash flows and the discount rate applied in calculating the present value of future cash flows.
°° Our response – In this area our audit procedures included challenging the cash flow forecasts and the underlying assumptions, based on our understanding of the relevant business and the sector and economic environment in which it operates. We compared forecasts to business plans and also previous forecasts to actual results to assess the performance of the business and the accuracy of forecasting. We compared the Group’s assumptions to externally derived data as well as our own sector knowledge in relation to key inputs such as the projected cash flows for these cash generating units, terminal growth rates, cost inflation and discount rates and applied sensitivities in evaluating the Group’s assessments. Our own valuation specialists assisted us in evaluating the assumptions and methodologies used by the Group, in particular those relating to terminal growth rates and in evaluating these assumptions with reference to valuations of similar businesses. Our focus has been on the valuation of goodwill in respect of the businesses that are most sensitive to the assumptions underlying the impairment reviews performed, which are the Bupa Care Services businesses in the UK and New Zealand and also the Bupa Chile, LUX MED and Quality HealthCare businesses. We assessed whether the Group’s disclosures over the goodwill impairment review including the disclosures regarding the sensitivity of the outcome of the impairment reviews to changes in key assumptions were appropriate.
Valuation of properties (refer to pages 38 to 40 (Audit Committee Report) and Sections 3.2 and 3.3)°° The risk – The Group revalues its freehold, leasehold and investment properties, including care homes, hospitals and offices primarily in the UK, Spain, Australia and New Zealand, to fair value on a periodic basis with external valuations being performed on at least a triennial basis and retirement villages in New Zealand being subject to an external valuation annually. Freehold and leasehold properties are used to perform business activities and generate revenue and profits. A full external valuation of freehold, leasehold and investment properties was performed by chartered surveyors, during 2013. Directors’ valuations are performed in interim years. The principal assumptions underpinning these valuations including operating cash flows, future profitability and competitor activity require the exercise of a high level of judgement to enable the carrying value does not differ significantly from the fair value at the balance sheet date whilst demonstrating that the carrying value is recoverable from future cash flows to be generated from the use of the properties.
°° Our response – Our audit procedures included critically assessing the reasonableness of directors’ assumptions by reference to external benchmarks and forecasts, along with any reports from external chartered surveyors. We reviewed any external valuers’ reports and assessed the qualifications of the external valuers and the appropriateness of the assumptions applied by the external valuers. Where appropriate, we also performed detailed testing to challenge the value in use models, which are driven by assessing the operating cash flows generated by the businesses which occupy the properties. We used our own valuation specialists to assist us in challenging the key assumptions relating to operating cash flows, future profitability and competitor activity used in the valuations. We also considered the completeness of the Group’s disclosures regarding valuation basis applied, revaluation gains and any impairment losses.
Independent Auditors' Report to the Members of
the British United Provident Association Limited only
opinions and conclusions arising from our audit

FIN
AN
CIA
L STAT
EM
EN
TS
59BUPA ANNUAL REPORT 2014
INDEPENDENT AUDITORS' REPORT
OUR APPLICATION OF MATERIALITY AND AN OVERVIEW OF THE SCOPE OF OUR AUDITThe materiality for the Group financial statements as a whole was set at £26 million determined with reference to a benchmark of Group profit before taxation (of which it represents 4.3%).
We report to the Audit Committee any corrected or uncorrected identified misstatements exceeding £1.5m, in addition to other identified misstatements that warranted reporting on qualitative grounds.
We subjected 8 of the Group’s reporting components to audits for Group reporting purposes. These components were located in UK, Spain, Poland, Latin America, Australia, New Zealand, Hong Kong and Chile. These audits were all performed by component auditors and covered 90% of total Group revenue; 93% of Group profit before taxation; and 87% of total Group assets. The segment disclosures in Section 2.0 set out the individual significance of specific countries.
The Group audit team instructed component auditors as to the significant areas to be covered, including the relevant risks detailed above and the information to be reported back. The Group audit team approved the component materiality of £19 million, having regard to the mix of size and risk profile of the Group across the components.
The Group audit team visited component locations in UK, Spain, Australia, Hong Kong and Chile. Telephone conference meetings were also held with these component auditors and others that were not physically visited. At these visits and meetings, the findings reported to the Group audit team were discussed in more detail, and any further work required by the Group audit team was then performed by the component auditor.
OUR OPINION ON OTHER MATTERS PRESCRIBED BY THE COMPANIES ACT 2006 IS UNMODIFIEDIn addition to our audit of the financial statements, the directors have engaged us to audit the information in the Directors’ Remuneration Report that is described as having been audited, which the directors have decided to prepare as if the company were required to comply with the requirements of Schedule 8 to The Large and Medium-sized Companies and Groups (Accounts and Reports) Regulations 2008 (SI 2008 No. 410) made under the Companies Act 2006.
In our opinion:
°° the part of the Directors’ Remuneration Report which we were engaged to audit has been properly prepared in accordance with Schedule 8 to The Large and Medium-sized Companies and Groups (Accounts and Reports) Regulations 2008 made under the Companies Act 2006, as if those requirements were to apply to the company; and
°° the information given in the Strategic Report and the Directors’ Report for the financial year for which the financial statements are prepared is consistent with the financial statements.
WE HAVE NOTHING TO REPORT IN RESPECT OF MATTERS ON WHICH WE ARE REQUIRED TO REPORT BY EXCEPTION Under ISAs (UK and Ireland) we are required to report to you if, based on the knowledge we acquired during our audit, we have identified other information in the annual report that contains a material inconsistency with either that knowledge or the financial statements, a material misstatement of fact, or that is otherwise misleading.
In particular, we are required to report to you if:
°° we have identified material inconsistencies between the knowledge we acquired during our audit and the directors’ statement that they consider that the annual report and financial statements taken as a whole is fair, balanced and understandable and provides the information necessary for shareholders to assess the Group’s performance, business model and strategy; or
°° the Audit Committee Report on pages 38 to 40 does not appropriately address matters communicated by us to the Audit Committee.
Under the Companies Act 2006 and under the terms of our engagement we are required to report to you if, in our opinion:
°° adequate accounting records have not been kept by the Parent Company, or returns adequate for our audit have not been received from branches not visited by us; or
°° the Parent Company financial statements and the part of the Directors’ Remuneration Report which we were engaged to audit are not in agreement with the accounting records and returns; or
°° certain disclosures of directors’ remuneration specified by law are not made; or
°° we have not received all the information and explanations we require for our audit.
In addition to our audit of the financial statements, the directors have engaged us to review their Corporate Governance Statement as if the company were required to comply with the Listing Rules and the Disclosure Rules and Transparency Rules of the Financial Conduct Authority in relation to those matters. Under the terms of our engagement we are required to review:
°° the directors’ statement, set out on page 55, in relation to going concern; and
°° the part of the Corporate Governance Statement on pages 28 to 29 in relating to the company’s compliance with the ten provisions of the 2012 UK Corporate Governance Code specified for our review.
We have nothing to report in respect of the above responsibilities.
SCOPE OF REPORT AND RESPONSIBILITIES As explained more fully in the Directors’ Responsibilities Statement set out on page 56, the directors are responsible for the preparation of the financial statements and for being satisfied that they give a true and fair view. A description of the scope of an audit of financial statements is provided on the Financial Reporting Council’s website at www.frc.org.uk/auditscopeukprivate. This report is made solely to the Company’s members as a body and is subject to important explanations and disclaimers regarding our responsibilities, published on our website at www.kpmg.com/uk/auditscopeukco2014b, which are incorporated into this report as if set out in full and should be read to provide an understanding of the purpose of this report, the work we have undertaken and the basis of our opinions.
Daniel Cazeaux(Senior Statutory Auditor) for and on behalf of KPMG LLP, Statutory Auditor Chartered Accountants 15 Canada Square London E14 5GL
4 March 2015

60BUPA ANNUAL REPORT 2014
PRIMARY STATEMENTS
Section2014
£m2013
£m
RevenuesGross insurance premiums 2.1 7,091.4 6,895.8Premiums ceded to reinsurers 2.1 (41.1) (37.1)Net insurance premiums earned 7,050.3 6,858.7
Revenues from insurance service contracts 2.1 42.7 13.5Care, health and other revenues 2.1 2,684.8 2,186.5Total revenues 9,777.8 9,058.7
Claims and expensesInsurance claims incurred 2.2 (5,544.1) (5,312.1)Reinsurers’ share of claims incurred 2.2 29.7 27.7Net insurance claims incurred (5,514.4) (5,284.4)Share of post-taxation results of equity accounted investments 9.0 5.0Other operating expenses 2.3 (3,638.5) (3,218.4)Impairment of goodwill 3.1 – (20.7)Impairment of intangible assets arising on business combinations 3.1 (0.7) (12.8)Other income and charges 2.4 12.9 (7.1)Total claims and expenses (9,131.7) (8,538.4)
Profit before financial income and expense 646.1 520.3
Financial income and expenseFinancial income 2.5 80.8 82.1Financial expense 2.5 (117.7) (88.0)Net financial expense (36.9) (5.9)
Profit before taxation expense 609.2 514.4
Taxation expense 2.6 (86.4) (103.0)
Profit for the financial year 522.8 411.4
Attributable to:Bupa 515.7 405.6Non-controlling interests 7.1 5.8Profit for the financial year 522.8 411.4
Sections 2 to 6 form part of these financial statements.
Consolidated Income Statement
for the year ended 31 December 2014

FIN
AN
CIA
L STAT
EM
EN
TS
61BUPA ANNUAL REPORT 2014
PRIMARY STATEMENTS
Section2014
£m2013
£m
Profit for the financial year 522.8 411.4
Other Comprehensive Income / (Expense)
Items that will not be reclassified to the Income StatementRemeasurement gains / (losses) on pension schemes 3.6 171.3 (10.3)Taxation on remeasurement losses on pension schemes 2.6 (34.1) (0.1)Unrealised gains on revaluation of property 3.2 6.5 94.3
Items that may be reclassified subsequently to the Income StatementForeign exchange translation differences on goodwill 3.1 (52.9) (257.7)Other foreign exchange translation differences (75.2) (152.9)Net gain on hedge of net investment in overseas subsidiary companies 17.5 0.1Change in fair value of underlying derivative of cash flow hedge (2.7) 1.2Cash flow hedge on acquisition of subsidiary companies 5.4.2 (1.5) (1.0)Taxation credit / (expense) on income and expenses recognised directly in Other Comprehensive Income 2.6 7.3 (22.3)Disposal of subsidiaries (12.0) –Other Comprehensive Income / (Expense) for the year, net of taxation 24.2 (348.7)Total Comprehensive Income for the year 547.0 62.7
Attributable to:Bupa 541.4 56.6Non-controlling interests 5.6 6.1Total Comprehensive Income for the year 547.0 62.7
Sections 2 to 6 form part of these financial statements.
Consolidated Statement of
Comprehensive Income
for the year ended 31 December 2014

62BUPA ANNUAL REPORT 2014
PRIMARY STATEMENTS
Section2014
£m
2013(Restated1)
£m
Non-current assetsIntangible assets 3.1 3,072.1 2,782.7Property, plant and equipment 3.2 2,915.6 2,697.1Investment property 3.3 242.0 184.2Equity accounted investments 4.1 208.9 232.6Financial investments 5.0 734.0 755.5Derivative assets 5.2 62.1 50.0Assets arising from insurance business 3.0.2 0.6 0.6Deferred taxation assets 3.7 2.5 0.9Trade and other receivables 3.0.1 110.7 134.9Restricted assets 3.0.4 40.9 39.3Post employment benefit net assets 3.6 351.4 130.5
7,740.8 7,008.3Current assetsFinancial investments 5.0 1,254.0 1,305.8Derivative assets 5.2 6.9 12.9Inventories 3.0.5 62.2 52.8Assets arising from insurance business 3.0.2 933.6 942.6Trade and other receivables 3.0.1 549.4 505.5Restricted assets 3.0.4 12.3 13.4Cash and cash equivalents 3.0.3 1,187.6 939.8
4,006.0 3,772.8Total assets 11,746.8 10,781.1
Non-current liabilitiesSubordinated liabilities 5.1 (919.7) (907.4)Other interest bearing liabilities 5.1 (1,086.9) (766.4)Derivative liabilities 5.2 (73.1) (3.6)Provisions under insurance contracts issued 3.4.1 (26.4) (24.4)Post employment benefit net liabilities 3.6 (66.1) (58.0)Provisions for liabilities and charges 3.5 (31.6) (31.1)Deferred taxation liabilities 3.7 (253.6) (213.3)Other payables 3.0.6 (16.2) (17.9)
(2,473.6) (2,022.1)Current liabilitiesSubordinated liabilities 5.1 (9.9) (9.9)Other interest bearing liabilities 5.1 (67.7) (298.8)Derivative liabilities 5.2 (3.8) (1.2)Provisions under insurance contracts issued 3.4.1 (2,182.5) (2,171.6)Other liabilities under insurance contracts issued 3.4.2 (57.6) (17.2)Provisions for liabilities and charges 3.5 (101.9) (119.4)Current taxation liabilities (48.4) (157.8)Trade and other payables 3.0.6 (1,333.0) (1,112.3)
(3,804.8) (3,888.2)Total liabilities (6,278.4) (5,910.3)Net assets 5,468.4 4,870.8EquityProperty revaluation reserve 707.9 700.2Income and expenditure reserve 4,590.7 3,940.6Cash flow hedge reserve 20.0 25.0Foreign exchange translation reserve 71.4 182.8Equity attributable to Bupa 5,390.0 4,848.6Equity attributable to non-controlling interests 78.4 22.2Total equity 5,468.4 4,870.8
1 The Consolidated Statement of Financial Position has been restated see section 1.7 for further details.
Lord Leitch Evelyn Bourke Chairman Chief Financial Officer
Approved by the Board of Directors and signed on its behalf on 4 March 2015 by
Consolidated Statement of
Financial Position
as at 31 December 2014

FIN
AN
CIA
L STAT
EM
EN
TS
63BUPA ANNUAL REPORT 2014
PRIMARY STATEMENTS
Section2014
£m2013
£m
Operating activitiesProfit before taxation expense 609.2 514.4
Adjustments for:Net financial expense 36.9 5.9Depreciation, amortisation and impairment 262.0 259.6Other non-cash items (37.5) 18.6
Changes in working capital and provisions:Increase / (decrease) in provisions and other liabilities under insurance contracts issued 15.7 (84.2)Decrease / (increase) in assets arising from insurance business 14.4 (93.1)Change in net pension asset / liability (41.6) (40.7)Increase in trade and other receivables, and other assets (20.2) (92.7)Increase in trade and other payables, and other liabilities 145.1 95.1Cash generated from operations 984.0 582.9
Income taxation paid (193.5) (115.3)Increase in cash held in restricted assets (1.0) –Net cash generated from operating activities 789.5 467.6
Cash flow from investing activitiesAcquisition of subsidiary companies, net of cash acquired 4.0 (199.3) (808.7)Acquisition of equity accounted investments 4.1 (3.9) (168.4)Dividends received from associates – 1.8Disposal of subsidiary companies net of cash disposed of 4.0 12.8 –Disposal of equity accounted investments 4.1 38.0 0.5Purchase of intangible assets 3.1 (84.5) (68.9)Purchase of property, plant and equipment (266.3) (241.8)Proceeds from sale of property, plant and equipment 9.5 1.2Purchase of investment property 3.3 (41.0) (20.2)Net purchase of financial investments, excluding deposits with credit institutions (143.7) (29.8)Net withdrawal from deposits with credit institutions 257.6 88.1Interest received 48.1 79.0Net cash used in investing activities (372.7) (1,167.2)
Cash flow from financing activitiesProceeds from issue of interest bearing liabilities and drawdowns on other borrowings 379.2 868.5Repayment of interest bearing liabilities (447.4) (334.5)Interest paid (116.1) (81.4)Receipts from / (payments for) hedging instruments 22.5 (11.7)Dividends paid to non-controlling interests (2.0) (8.9)Net cash (used in) / generated from financing activities (163.8) 432.0
Net increase / (decrease) in cash and cash equivalents 253.0 (267.6)Cash and cash equivalents at beginning of year 939.7 1,253.4Effect of exchange rate changes (5.1) (46.1)Cash and cash equivalents at end of year 3.0.3 1,187.6 939.7
Sections 2 to 6 form part of these financial statements.
Consolidated Statement of Cash Flows
for the year ended 31 December 2014

64BUPA ANNUAL REPORT 2014
PRIMARY STATEMENTS
Section
Property revaluation
reserve £m
Income and expenditure
reserve £m
Cash flow
hedge reserve
£m
Foreign exchange
translation reserve
£m
Total attributable
to Bupa £m
Non-controlling
interests £m
Total equity
£m
2014At beginning of year 700.2 3,940.6 25.0 182.8 4,848.6 22.2 4,870.8 Retained profit for the financial year – 515.7 – – 515.7 7.1 522.8
Other comprehensive income / (expense) Unrealised profit on revaluation of property 3.2 6.5 – – – 6.5 – 6.5 Realised revaluation profit on disposal of property (1.9) 1.9 – – – – – Remeasurement gain on pension schemes 3.6 – 171.3 – – 171.3 – 171.3 Foreign exchange translation differences on goodwill 3.1 – – – (52.9) (52.9) – (52.9)Other foreign exchange translation differences (4.9) 1.4 – (70.2) (73.7) (1.5) (75.2)Net gain on hedge of net investment in overseas
subsidiary companies – – – 17.5 17.5 – 17.5 Cash flow hedge on acquisition of subsidiary companies 5.4.2 – – (1.5) – (1.5) – (1.5)Change in fair value of underlying derivative of
cash flow hedge – – (2.7) – (2.7) – (2.7)Taxation credit / (expense) on income and expenses
recognised directly in other comprehensive income 2.6 8.0 (34.1) (0.8) 0.1 (26.8) – (26.8)Disposal of subsidiaries – (6.1) – (5.9) (12.0) – (12.0)Other comprehensive income / (expense) for the year,
net of taxation 7.7 134.4 (5.0) (111.4) 25.7 (1.5) 24.2
Total comprehensive income / (expense) for the year 7.7 650.1 (5.0) (111.4) 541.4 5.6 547.0
Acquisition of subsidiary companies attributable to non-controlling interest 4.0 – – – – – 52.6 52.6
Dividends paid to non-controlling interests – – – – – (2.0) (2.0)At end of year 707.9 4,590.7 20.0 71.4 5,390.0 78.4 5,468.4
2013At beginning of year 631.9 3,544.9 25.1 590.1 4,792.0 25.9 4,817.9Retained profit for the financial year – 405.6 – – 405.6 5.8 411.4
Other comprehensive income / (expense) Unrealised profit on revaluation of property 3.2 94.3 – – – 94.3 – 94.3Realised revaluation profit on disposal of property (0.5) 0.5 – – – – –Remeasurement loss on pension schemes 3.6 – (10.3) – – (10.3) – (10.3)Foreign exchange translation differences on goodwill 3.1 – – – (257.7) (257.7) – (257.7)Other foreign exchange translation differences (4.0) – – (149.2) (153.2) 0.3 (152.9)Net gain on hedge of net investment in overseas
subsidiary companies – – – 0.1 0.1 – 0.1Cash flow hedge on acquisition of subsidiary companies 5.4.2 – – (1.0) – (1.0) – (1.0)Change in fair value of underlying derivative of
cash flow hedge – – 1.2 – 1.2 – 1.2Taxation expense on income and expenses recognised
directly in other comprehensive income 2.6 (21.5) (0.1) (0.3) (0.5) (22.4) – (22.4)Other comprehensive income / (expense) for the year,
net of taxation 68.3 (9.9) (0.1) (407.3) (349.0) 0.3 (348.7)
Total comprehensive income / (expense) for the year 68.3 395.7 (0.1) (407.3) 56.6 6.1 62.7
Acquisition of subsidiary companies attributable to non-controlling interest 4.0 – – – – – (0.9) (0.9)
Dividends paid to non-controlling interests – – – – – (8.9) (8.9)At end of year 700.2 3,940.6 25.0 182.8 4,848.6 22.2 4,870.8
Sections 2 to 6 form part of these financial statements.
Consolidated Statement of
Changes in Equity
for the year ended 31 December 2014

FIN
AN
CIA
L STAT
EM
EN
TS
65BUPA ANNUAL REPORT 2014
NOTES TO THE FINANCIAL STATEMENTS
1.0Basis of preparation
BASIS OF PREPARATION IN BRIEFThis section describes the Group’s significant accounting policies and accounting estimates and judgements that relate to the financial statements and notes as a whole. Where accounting policies relate to a specific note, the applicable accounting policies and estimates are contained within the note.
1.1 BASIS OF PREPARATIONThe British United Provident Association Limited (‘Bupa’ or the ‘Company’), the ultimate parent entity of the Group, is a company incorporated in England and Wales. The Company is limited by guarantee.
Both the Company financial statements and the Group’s consolidated financial statements have been prepared under International Financial Reporting Standards (IFRS) as adopted by the EU. The appropriate provisions of the Companies Act 2006 applicable to companies reporting under IFRS have also been complied with.
A summary of IFRS that are relevant for the Group is included on page 132.
The financial statements were approved by the Board of Directors on 4 March 2015. The Directors have reviewed and approved the Group’s accounting policies which have been applied consistently to all the years presented, unless otherwise stated. For the purposes of consolidation, the accounting policies of subsidiary companies have been aligned with those of the Parent Company.
The financial statements are prepared on a going concern basis, and under the historical cost convention, as modified by the revaluation of property, investment property, financial investments at fair value through profit or loss and derivative instruments.
1.2 BASIS OF CONSOLIDATIONThe consolidated financial statements for the year ended 31 December 2014 comprise those of the Company and its subsidiary companies (together referred to as the ‘Group’), and the share of results of equity accounted investments.
The financial statements of subsidiaries are included in the consolidated financial statements from the date that control commences to the date that control ceases. Non-controlling interests in the net assets of subsidiaries are identified separately from the Group’s equity. Non-controlling interests consist of the amount of those interests at the date of the original acquisition and the non-controlling shareholder’s share of changes in equity since this date.
Intra Group related party transactions and outstanding balances are eliminated in the preparation of the consolidated financial statements of the Group.
The consolidated financial statements are presented in Sterling, which is the Group’s presentation currency. The functional currency is identified at statutory entity level. These vary across the Group and include Sterling, Australian Dollars and Euros. Each group entity then translates its results and financial position into the Group's presentational currency, Sterling, for presentation in the Group consolidated financial statements.
1.3 ACCOUNTING ESTIMATES AND JUDGEMENTSThe preparation of financial statements requires the use of certain accounting estimates and assumptions that affect the reported assets, liabilities, income and expenses. It also requires management to exercise judgement in applying the Group’s accounting policies.
The areas involving a higher degree of judgement or complexity, or where assumptions are significant to the consolidated financial statements, are set out below and in more detail in the related sections:
°° Claims provisioning includes the estimate that is made of the expected claims payments and expense required to settle existing insurance contract obligations. Calculation of the outstanding claims provision is based on assumptions including claims development, margin of prudence, claims costs inflation, medical trends and seasonality. See section 3.4.
°° Property valuations. Bupa has a significant portfolio of care home, hospital and office properties and fluctuations in the value of this portfolio can have a significant impact on the Statement of Financial Position, Income Statement and solvency position of the Group. Further detail on the revaluation process are explained in sections 3.2 and 3.3.
°° Goodwill and intangible assets are recognised on business combinations with the latter valued at the date of acquisition at fair value. Goodwill and intangible assets with indefinite lives are tested for impairment on an annual basis; other intangible assets are tested for impairment if a trigger of impairment is identified. See section 3.1.
Other judgements:
°° Taxation (Section 2.6)
°° Provisions (Section 3.5)
°° Pension assumptions (Section 3.6.2)
°° Business combinations (Section 4.0)
°° Financial Investments (Section 5.0)
1.4 GOING CONCERNManagement has conducted a detailed assessment of the Group’s going concern status based on its current position and forecast results. They have concluded that the Group has adequate resources to operate for the foreseeable future. In making this assessment, management have considered the discussions with the relationship banks as well as forecasts which take account of reasonably possible changes in trading performance, solvency capital and recently announced acquisitions.
Details of the Group's business activities, together with the factors likely to affect its future development, performance and position are set out in the Business Review on pages 1 to 27. The financial position of the Group, its cash flows, liquidity position and borrowing facilities are described in the Financial Review on pages 20 to 23.
The Group’s £800.0m committed bank facility, which was renegotiated in October 2012 and matures in October 2017, was undrawn at 31 December 2014 with the exception of £6.4m of outstanding letters of credit for general business purposes.
Notes to the Financial Statements
for the year ended 31 December 2014

66BUPA ANNUAL REPORT 2014
NOTES TO THE FINANCIAL STATEMENTS
1.5 NEW FINANCIAL REPORTING REQUIREMENTS(a) IFRS 10 Consolidated financial statementsIFRS 10 introduces a new definition of control and when to consolidate interests in other entities and became effective 1 January 2014. The additional considerations when establishing control have not impacted how any of the Group's investments have been consolidated within these accounts.
(b) IFRS 11 Joint arrangementsIFRS 11 supersedes IAS 31 Interest in Joint Ventures and establishes principles for financial reporting of interests in jointly controlled arrangements with 2014 being the first full year of adoption for Bupa.
The previous types of joint arrangement have been replaced with joint operations and joint ventures and IFRS 11 considers the investors' rights in addition to the structure of the arrangement, when determining the classification.
All the Group’s joint arrangements are reported as joint ventures and accounted for using the equity method, the new reporting requirements and additional considerations have had no impact on how the Group accounts for these.
(c) IFRS 12 Disclosure of interests in other entitiesIFRS 12 supersedes the disclosure requirements within IAS 27 Consolidated and separate financial statements, IAS 28 Investments in associates and IAS 31 Interests in joint ventures and became effective 1 January 2014.
The new standard requires the disclosure of the nature of, and risks associated with, its interests in other entities and the effects of those interests on its financial position, financial performance and cash flows.
For disclosures required by IFRS 12, please see specific sections;
°° Section 4.0 – Business combinations and disposals
°° Section 4.1 – Equity accounted investments
°° Section 7.3 – Investment in subsidiaries
(d) Amendments to IAS 39 Financial Instruments Recognition and MeasurementNovation of Derivatives and Continuation of Hedge Accounting (Amendments to IAS 39) was issued on 27 June 2013 and came into effect for annual periods beginning on or after 1 January 2014. The Group has reviewed the effect of this change and there has been no material impact on the financial statements as a result of the application in the year ended 31 December 2014.
(e) Amendments to IAS 36 Impairment of AssetsRecoverable Amount Disclosures for Non-Financial Assets (Amendments to IAS 36) was issued on 29 May 2013 and came into effect for annual periods beginning on or after 1 January 2014. The Group has reviewed the effect of this change and there has been no material impact on the financial statements as a result of the application in the year ended 31 December 2014.
1.6 FORTHCOMING FINANCIAL REPORTING REQUIREMENTSThe following financial reporting standards have been issued but are not effective for the year ended 31 December 2014 and have not been early adopted by the Group. The Group has reviewed the effect of all other amendments to IFRS and interpretations effective for accounting periods beginning on or after 1 January 2015 and do not expect them to have a significant impact on the financial statements.
(a) IFRS 9 Financial Instruments IFRS 9 modifies the classification and measurement of financial assets, the recognition of impairment and hedge accounting. The mandatory effective date for applying IFRS 9 is for annual periods beginning on or after 1 January 2018. The standard has not yet been endorsed by the EU and therefore is not currently available for early adoption in the EU. The impact of IFRS 9 on the financial statement is currently being evaluated by the Group.
(b) IFRS 15 Revenue Recognition IFRS 15 establishes principles that an entity can apply to report information about the nature, amount, timing and uncertainty of revenue and cash flows arising from a contract with a customer.It replaces IAS 11: Construction Contracts, IAS 18: Revenue, IFRIC 13: Customer Loyalty Programmes, IFRIC 15: Agreements for the Construction of Real Estate and IFRIC 18: Transfers of Assets from Customers.
The Group has reviewed the effect of this change and does not expect a significant impact to the financial statements. The standard will come into effect for annual periods beginning on or after 1 January 2017 and the Group is not considering early adoption therefore there is no impact on the 2014 financial statements.
(c) IFRIC 21 LeviesIFRIC 21 provides guidance on recognition of liabilities in connection with levies imposed by government other than those levies within the scope of other standards. The standard became effective for periods beginning on or after 17 June 2014. There has been no material impact on the financial statements as a result of the application in the year ended 31 December 2014.
1.7 RESTATEMENT OF 2013 FINANCIAL INFORMATIONThe acquisition Statements of Financial Position for Dental Corporation and Quality HealthCare have been restated following fair value accounting adjustments applied within 12 months of the respective dates of acquisition.
In Quality HealthCare, additional intangible assets of £140.1m, comprising customer relationships (£101.2m) and brands (£38.9m), have been identified, net of the £23.1m resulting deferred tax, which has reduced the goodwill arising from this acquisition to £104.5m.
Following a review of the fair value of the investment in Dental Corporation Canada, Dental Corporation Group's goodwill was reduced by £19.8m, resulting in £327.7m overall goodwill from the acquisition. See section 4.0.
Notes to the Financial Statements (CONTINUED)
for the year ended 31 December 2014

FIN
AN
CIA
L STAT
EM
EN
TS
67BUPA ANNUAL REPORT 2014
NOTES TO THE FINANCIAL STATEMENTS
2.0Operating segments
OPERATING SEGMENTS IN BRIEFThe Group is managed through five Market Units based on geographic locations and customers. Management monitors the operating results of the Market Units separately to assess performance and make decisions about the allocation of resources. The segmental disclosures below are reported on a basis that is consistent with the way the business is managed and reported internally.
The operating results of each Market Unit, which form the operating segments on which the information in this section has been prepared, are regularly reviewed by the Chief Executive Officer (the Group’s chief operating decision maker) to assess performance and make decisions about the allocation of resources.
The segmental underlying profit includes items directly attributable to a segment as well as those that can be allocated on a reasonable basis. Underlying profit is based on reported profit before taxation expense, adjusted for non-underlying items to reflect trading performance.
In order to arrive at underlying profit, profit before taxation expense is adjusted for amortisation and impairment of intangible assets arising on business combinations, impairment of goodwill, net property revaluation gains and losses, gains or losses on return seeking assets, realised and unrealised foreign exchange gains and losses, profit or loss on sale of businesses and fixed assets, restructuring costs and transaction costs on acquisitions and disposals.
Central expenses and net interest margin comprise income and expenses generated at the Centre, which cannot be specifically allocated to the operating segments.
Reportable segments Services and products
Australia and New Zealand
Health insurance, health assessments, health coaching and international health cover
Dental provision in Australia and New Zealand, optical care within Australia
Nursing, residential and respite care in Australia and New Zealand
Retirement villages and telecare services within New Zealand
UK Health insurance, dental services, health assessments and related products
Nursing, residential, care villages and respite care
Management and operation of a private hospital providing medical and ancillary services to patients
Home healthcare products and services
Spain and Latin America Domestic
Health insurance and related products sold in Spain
Management and operation of hospitals, clinics and dental centres in Spain providing medical and ancillary services to patients
Provision of nursing, residential and respite care in Spain
Health insurance and operation of outpatient diagnostic clinics, hospitals and medical laboratories in Chile and clinics in Peru
International Development Markets
Domestic health insurance and related products within Hong Kong, Thailand, China, Saudi Arabia and India
Medical subscription, health insurance, diagnostics and the operation of clinics and hospitals in Poland
Diagnostics, primary healthcare and day care clinics in Hong Kong
Bupa Global International health insurance to individuals, small businesses and corporate customers in over 190 countries, as well as provision of worldwide medical assistance services

68BUPA ANNUAL REPORT 2014
NOTES TO THE FINANCIAL STATEMENTS
The total underlying profit of the reportable segments is reconciled below to profit before taxation expense in the Consolidated Income Statement.
Australia and New Zealand UK
Spain and Latin America
Domestic
International Development
Markets Bupa Global Total
2014 £m
2013 £m
2014 £m
2013 £m
2014 £m
2013 £m
2014 £m
2013 £m
2014 £m
2013 £m
2014 £m
2013 £m
(i) RevenuesTotal revenues for
reportable segments 3,759.6 3,791.8 2,711.6 2,575.3 1,842.5 1,363.5 506.8 378.1 958.7 953.0 9,779.2 9,061.7Inter segment income – – (0.4) (1.8) – – (0.1) (0.8) – – (0.5) (2.6)External revenues for
reportable segments 3,759.6 3,791.8 2,711.2 2,573.5 1,842.5 1,363.5 506.7 377.3 958.7 953.0 9,778.7 9,059.1
Net reclassifications to other expenses or financial income and expense (0.9) (0.4)
Consolidated total revenues 9,777.8 9,058.7
(ii) Segment resultUnderlying profits for
reportable segments1 309.2 284.1 175.0 139.5 130.6 126.5 17.1 5.9 97.9 114.0 729.8 670.0Central expenses and net
interest margin (92.0) (31.5)Consolidated underlying profit
before taxation 637.8 638.5
Non-underlying items:Amortisation of intangible
assets arising on business combinations (14.1) (15.8) (4.6) (4.0) (7.1) (2.1) (20.8) (10.4) (4.9) (5.0) (51.5) (37.3)
Impairment of goodwill arising on business combinations – – – (20.7) – – – – – – – (20.7)
Impairment of intangible assets arising on business combinations – – – (12.1) (0.7) (0.7) – – – – (0.7) (12.8)
Restructuring costs (0.2) – (3.7) (17.9) – – (2.1) (0.8) (8.5) (3.0) (14.5) (21.7)Transaction costs on
acquisitions and disposals (0.7) (11.4) (0.6) (2.2) (3.3) (1.7) (0.8) (11.9) – (1.4) (5.4) (28.6)Realised and unrealised foreign
exchange gains / (losses) 0.4 – (0.1) (0.1) (2.1) – 0.1 (0.2) 8.8 (11.6) 7.1 (11.9)Net property revaluation
(losses) / gains 10.7 7.9 (9.9) (3.6) (1.5) 2.1 – – – – (0.7) 6.4Net losses on disposal of fixed
assets (0.5) (1.4) (0.4) (0.1) (0.7) (0.3) – (0.1) (0.2) (0.1) (1.8) (2.0)Net gains on disposal of
businesses – – 10.9 – – – 16.2 – – – 27.1 –Gains on return seeking assets,
net of hedging 13.8 –Other2 (2.0) 4.5
(28.6) (124.1)Consolidated profit before
taxation expense 609.2 514.4
(iii) Other informationAmortisation and depreciation
costs for reportable segments 53.8 50.2 101.3 99.4 51.3 33.9 36.3 23.7 18.7 15.5 261.4 222.7Non-cash (expense) / income
for reportable segments (134.9) (31.4) (78.3) (19.5) (123.1) 57.7 (2.1) (6.0) (39.3) 13.2 (377.7) 14.0Unallocated non-cash income /
(expense) 3.0 (16.6)Total non-cash expenses (374.7) (2.6)
1 Underlying profit for reportable segments includes share of post-taxation results of equity accounted investments.2 Includes central non-underlying items and loss on sale of equity accounted investments.
Notes to the Financial Statements (CONTINUED)
for the year ended 31 December 2014

FIN
AN
CIA
L STAT
EM
EN
TS
69BUPA ANNUAL REPORT 2014
NOTES TO THE FINANCIAL STATEMENTS
(iv) Geographic information
Australasia UK Spain Rest of the World Total
2014 £m
2013 £m
2014 £m
2013(Restated)
£m2014
£m2013
£m2014
£m
2013(Restated)
£m2014
£m2013
£m
Consolidated total revenues 3,759.6 3,791.8 3,241.1 3,086.9 1,311.2 1,363.5 1,465.9 816.5 9,777.8 9,058.7Consolidated non-current
assets1 2,749.0 2,692.0 1,896.1 1,877.5 458.8 504.4 1,507.5 984.5 6,611.4 6,058.4
1 Consolidated non-current assets excludes financial investments, restricted assets, assets arising from insurance business, deferred taxation assets and post employment benefit net assets.
2.1Revenues
REVENUES IN BRIEFThe Group generates revenues from its underwriting activities (insurance premiums), trading activities through the provision of insurance management services (insurance service contracts) and the provision of healthcare services (care, health, dental and other).
Revenue stream Recognition policy
Insurance premiums
Gross insurance premiumsGross insurance premiums represent the premiums earned relating to risk exposure for the reported financial year. They comprise gross premiums written, adjusted for the change in the provision for unearned premiums for premiums written relating to periods of risk in subsequent financial years.
Premiums are shown gross of commissions payable and net of insurance premium taxes that may apply in certain jurisdictions.
Premiums ceded to reinsurersPremiums ceded to reinsurers represent reinsurance premiums payable for contracts entered into that relate to risk mitigation for the reported financial year. These comprise written premiums ceded to reinsurers, adjusted for the reinsurers’ share of the movement in the gross provision for unearned premiums.
Premiums, losses and other amounts relating to reinsurance treaties are recognised over the period from inception of a treaty to expiration of the related business.
Insurance service contracts
Contracts entered into by the Group’s general insurance entities that do not result in the transfer of significant insurance risk to the Group are accounted for as insurance service contracts. These contracts mainly relate to the administration of claims funds on behalf of corporate customers. Revenues from service contracts are recognised as the services are provided.
Some of these contracts contain financial liabilities representing deposits repayable to the customer. These are measured at amortised cost. The claims fund deposit held on behalf of customers is reported within other payables, accruals and deferred income as appropriate.
Care, health, dental and other
The Group generates income from fees receivable from the operation of its care homes, hospitals, dental centres and other healthcare and wellbeing centres. Revenues from service contracts are recognised as the services are provided.
Service concession receivablesThe Group also operates two public hospitals in Spain under separate service concession arrangements granted by the local governments (the grantors). Revenue is recognised from the construction of infrastructure and for operation of the hospitals. Construction revenues are recognised in line with the stage of completion of the work performed. Operational revenues are recognised in the period in which the services are provided, in line with the service concession arrangements. The accounting policy for the service concession receivables is explained in Section 3.0.1.

70BUPA ANNUAL REPORT 2014
NOTES TO THE FINANCIAL STATEMENTS
TOTAL REVENUES
2014 £m
2013 £m
Gross premiums written 7,120.9 6,892.9Change in gross provision for unearned premiums (29.5) 2.9Gross insurance premiums 7,091.4 6,895.8
Gross premiums written ceded to reinsurers (42.9) (37.9)Reinsurers’ share of change in gross provision for unearned premiums 1.8 0.8Premiums ceded to reinsurers (41.1) (37.1) Net insurance premiums earned 7,050.3 6,858.7
Revenues from insurance service contracts 42.7 13.5Care, health and other revenues 2,684.8 2,186.5Total revenues 9,777.8 9,058.7
2.2Insurance claims
INSURANCE CLAIMS IN BRIEFInsurance claims relate to the Group’s insurance underwriting activities. Insurance claims incurred are amounts payable under insurance contracts arising from the occurrence of an insured event.
INSURANCE CLAIMSInsurance claims incurred comprise insurance claims paid during the year together with related handling costs, the movement in the gross provision for claims in the period and the Risk Equalisation Trust Fund levy for Australian health insurance businesses. See Section 3.4 for details of the claims provision.
In Australia, the Risk Equalisation Trust Fund charges a levy to all registered private health insurers and then allocates a proportion of the cost of eligible claims between all fund participants.
REINSURERS’ SHARE OF CLAIMS INCURREDReinsurers’ share of claims incurred represents recoveries from reinsurers on claims paid, adjusted for the reinsurers’ share of the change in the gross provision for claims.
See ‘Assets arising from insurance business’ within Section 3.0.2 for the related balance sheet item and detail of impairments.
NET INSURANCE CLAIMS INCURRED
2014 £m
2013 £m
Insurance claims paid 5,657.3 5,497.7Change in gross provisions for claims (35.4) (80.7)
5,621.9 5,417.0Risk Equalisation Trust Fund levy (net of recoveries) (77.8) (104.9)Insurance claims incurred 5,544.1 5,312.1
Recoveries from reinsurers on claims paid (30.2) (27.1)Reinsurers’ share of change in gross provisions for claims 0.5 (0.6)Reinsurers’ share of claims incurred (29.7) (27.7) Net insurance claims incurred 5,514.4 5,284.4
Notes to the Financial Statements (CONTINUED)
for the year ended 31 December 2014

FIN
AN
CIA
L STAT
EM
EN
TS
71BUPA ANNUAL REPORT 2014
NOTES TO THE FINANCIAL STATEMENTS
2.3Other operating expenses
OTHER OPERATING EXPENSES IN BRIEFOther operating expenses include staff costs, overheads, depreciation, amortisation of intangible assets, and gains or losses on foreign exchange transactions incurred as a consequence of operating our businesses. Costs in relation to handling claims are included within claims.
Operating expenses exclude insurance claims, finance costs and taxation.
OTHER OPERATING EXPENSES
2014£m
2013£m
Staff costs (a) 1,543.0 1,474.9Acquisition costs (b) 205.9 220.0Cost of sales 463.8 309.2Medical supplies and fees 348.9 244.0Property costs 161.7 167.4Operating lease rentals 131.8 95.4Marketing costs 118.9 106.5Catering and housekeeping costs 68.5 62.0Physician costs 56.1 15.4Consultancy fees 38.2 28.9Net (gain) / loss on foreign exchange transactions (24.6) 11.7Amortisation of intangible assets 3.1 119.6 99.4Depreciation expense 3.2 141.7 123.4Other operating expenses (including auditors’ remuneration) (c) 265.0 260.2Total other operating expenses 3,638.5 3,218.4
(a) Staff costs and employee numbers
(i) Staff costs
2014 £m
2013 £m
Wages and salaries 1,390.4 1,326.6Social security costs 111.9 107.1Contributions to defined
contribution scheme 3.6 29.2 26.4Other pension costs 3.6 11.5 14.8Total staff costs 1,543.0 1,474.9
Directors’ Remuneration Report is described in pages 45 to 54 of this report.
(ii) Employee numbersThe average number of full time equivalent employees, including Executive Directors, employed by the Group during the year was:
Average employee numbers 2014 2013
Australia and New Zealand 11,002 10,328UK 26,569 27,597Spain and Latin America Domestic 16,392 8,344International Development Markets 6,323 4,202Bupa Global 1,553 1,618Centre 252 293Total employee numbers 62,091 52,382
The total employee headcount as at 31 December 2014 was 78,917 (2013: 69,644).
(b) Acquisition costs2014
£m2013
£m
Commission for direct insurance 204.7 210.8Other acquisition costs paid 12.3 13.7Changes in deferred acquisition costs (11.1) (4.5)Total acquisition costs 205.9 220.0
The movement in deferred acquisition costs is detailed in section 3.0.2.
(c) Auditors’ remuneration2014
£m2013
£m
Fees payable to the Company’s auditor for the audit of the Company’s annual accounts 0.7 0.7
Fees payable to the Company’s auditor and its associates for: – the audit of the Company’s subsidiaries
pursuant to legislation 4.0 3.4– audit-related assurance services 0.7 0.7
Total audit fees payable to the Company’s auditors, KPMG LLP and its associates 5.4 4.8
Fees payable to other auditors:Audit of overseas subsidiary companies 0.1 0.3
Total audit fees 5.5 5.1Fees payable to the Company’s auditor and its
associates for other services: Tax compliance services 0.3 0.4Tax advisory services 0.1 0.1
Corporate finance services 0.6 0.1All other non-audit services 1.4 1.5
Total non-audit fees 2.4 2.1Total auditors’ remuneration 7.9 7.2
In addition, fees in respect of the audit of The Bupa Pension Scheme were £42,000 (2013: £38,000).

72BUPA ANNUAL REPORT 2014
NOTES TO THE FINANCIAL STATEMENTS
2.4Other income and charges
OTHER INCOME AND CHARGES IN BRIEFOther income and charges comprise income or expenses that are related to the investing and divesting activities of the Group.
OTHER INCOME AND CHARGES
2014 £m
2013 £m
Net gain on disposal of businesses 4.0.b 27.1 –Net (loss) / gain on sale of equity accounted investments 4.1 (0.7) 0.5Deficit on revaluation of property 3.2 (1.8) (5.3)Impairment of property 3.2 (9.9) –Net loss on disposal of property, plant and equipment (1.8) (2.3)Total other income and charges 12.9 (7.1)
2.5Financial income
and expense
FINANCIAL INCOME AND EXPENSE IN BRIEFFinancial income and expenses are earned / (incurred) from the Group’s financial assets and liabilities, and non-financial assets such as investment property.
FINANCIAL INCOMEInterest income, except in relation to assets classified at fair value through profit or loss, is recognised in the Income Statement as it accrues, using the effective interest method.
Interest income is calculated based on coupon amounts and any mark to market movements are split between realised or unrealised.
Changes in the value of financial assets designated as at fair value through profit or loss are recognised within financial income as an unrealised gain or loss while the asset is held. Upon realisation of these assets, the change in fair value since the last valuation is recognised within financial income as a realised gain or loss.
2014 £m
2013 £m
Interest income: Loans and receivables 46.6 64.1Investments held to maturity 2.5 1.9Investments designated at fair value
through profit or loss 3.5 2.5Net realised gains on financial investments
designated at fair value through profit or loss 8.3 3.2
Net increase / (decrease) in fair value:Investments designated at fair value
through profit or loss 9.1 (5.3)Investment property 3.3 10.9 11.7
Net foreign exchange (losses) / gains (0.1) 4.0Total financial income 80.8 82.1
Included within financial income are net gains, net of hedging, on the Group’s return seeking asset portfolio of £13.8m (2013: £nil).
FINANCIAL EXPENSEInterest payable on borrowings is calculated using the effective interest method.
The net amount of foreign exchange differences recognised in financial expenses for the year, excluding those arising on financial assets and financial liabilities measured at fair value through profit or loss was £nil (2013: £nil).
2014 £m
2013 £m
Interest expense on financial liabilities at amortised cost 113.6 85.3
Finance charges in respect of finance leases 1.3 0.5Other financial expense 2.8 2.2Total financial expense 117.7 88.0
Notes to the Financial Statements (CONTINUED)
for the year ended 31 December 2014
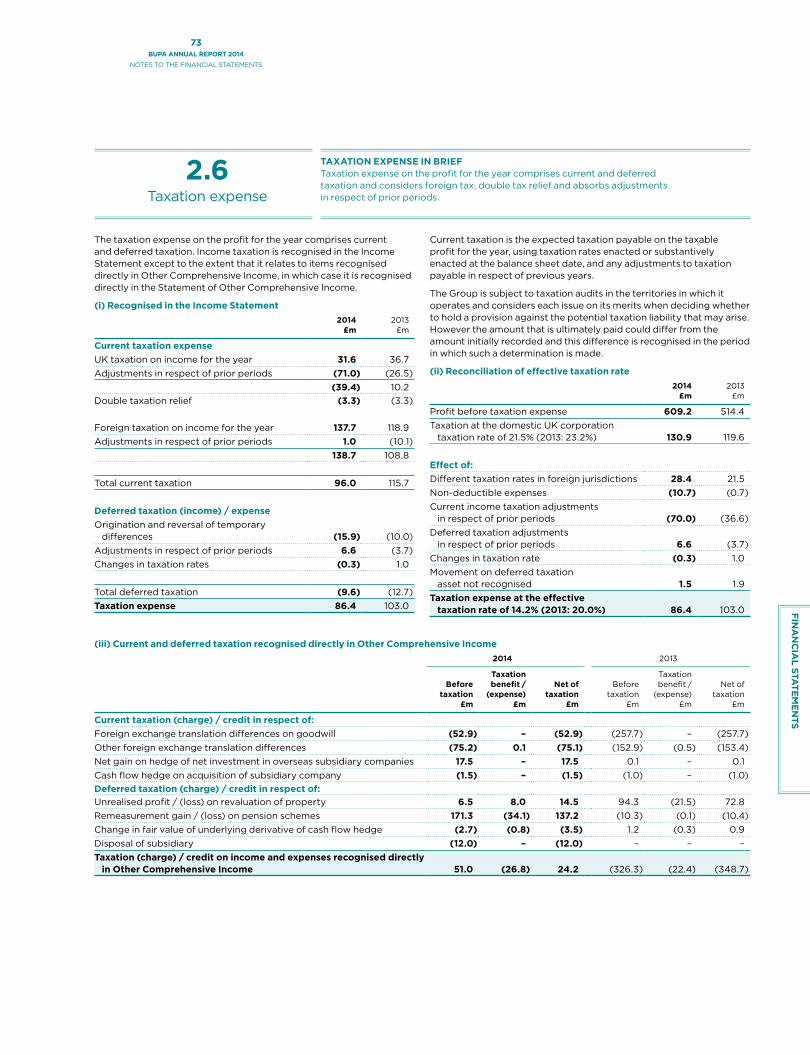
FIN
AN
CIA
L STAT
EM
EN
TS
73BUPA ANNUAL REPORT 2014
NOTES TO THE FINANCIAL STATEMENTS
2.6Taxation expense
TAXATION EXPENSE IN BRIEFTaxation expense on the profit for the year comprises current and deferred taxation and considers foreign tax, double tax relief and absorbs adjustments in respect of prior periods.
The taxation expense on the profit for the year comprises current and deferred taxation. Income taxation is recognised in the Income Statement except to the extent that it relates to items recognised directly in Other Comprehensive Income, in which case it is recognised directly in the Statement of Other Comprehensive Income.
(i) Recognised in the Income Statement
2014 £m
2013 £m
Current taxation expenseUK taxation on income for the year 31.6 36.7Adjustments in respect of prior periods (71.0) (26.5)
(39.4) 10.2Double taxation relief (3.3) (3.3)
Foreign taxation on income for the year 137.7 118.9Adjustments in respect of prior periods 1.0 (10.1)
138.7 108.8 Total current taxation 96.0 115.7
Deferred taxation (income) / expenseOrigination and reversal of temporary
differences (15.9) (10.0)Adjustments in respect of prior periods 6.6 (3.7)Changes in taxation rates (0.3) 1.0
Total deferred taxation (9.6) (12.7)Taxation expense 86.4 103.0
Current taxation is the expected taxation payable on the taxable profit for the year, using taxation rates enacted or substantively enacted at the balance sheet date, and any adjustments to taxation payable in respect of previous years.
The Group is subject to taxation audits in the territories in which it operates and considers each issue on its merits when deciding whether to hold a provision against the potential taxation liability that may arise. However the amount that is ultimately paid could differ from the amount initially recorded and this difference is recognised in the period in which such a determination is made.
(ii) Reconciliation of effective taxation rate
2014£m
2013£m
Profit before taxation expense 609.2 514.4Taxation at the domestic UK corporation
taxation rate of 21.5% (2013: 23.2%) 130.9 119.6
Effect of:Different taxation rates in foreign jurisdictions 28.4 21.5Non-deductible expenses (10.7) (0.7)Current income taxation adjustments
in respect of prior periods (70.0) (36.6)Deferred taxation adjustments
in respect of prior periods 6.6 (3.7)Changes in taxation rate (0.3) 1.0Movement on deferred taxation
asset not recognised 1.5 1.9Taxation expense at the effective
taxation rate of 14.2% (2013: 20.0%) 86.4 103.0
(iii) Current and deferred taxation recognised directly in Other Comprehensive Income
2014 2013
Before taxation
£m
Taxation benefit /
(expense) £m
Net of taxation
£m
Before taxation
£m
Taxation benefit /
(expense) £m
Net of taxation
£m
Current taxation (charge) / credit in respect of:Foreign exchange translation differences on goodwill (52.9) – (52.9) (257.7) – (257.7)Other foreign exchange translation differences (75.2) 0.1 (75.1) (152.9) (0.5) (153.4)Net gain on hedge of net investment in overseas subsidiary companies 17.5 – 17.5 0.1 – 0.1Cash flow hedge on acquisition of subsidiary company (1.5) – (1.5) (1.0) – (1.0)Deferred taxation (charge) / credit in respect of:Unrealised profit / (loss) on revaluation of property 6.5 8.0 14.5 94.3 (21.5) 72.8Remeasurement gain / (loss) on pension schemes 171.3 (34.1) 137.2 (10.3) (0.1) (10.4)Change in fair value of underlying derivative of cash flow hedge (2.7) (0.8) (3.5) 1.2 (0.3) 0.9Disposal of subsidiary (12.0) – (12.0) – – –Taxation (charge) / credit on income and expenses recognised directly
in Other Comprehensive Income 51.0 (26.8) 24.2 (326.3) (22.4) (348.7)

74BUPA ANNUAL REPORT 2014
NOTES TO THE FINANCIAL STATEMENTS
3.0Working capital
WORKING CAPITAL IN BRIEFWorking capital represents the assets and liabilities the Group generates through its trading activity. The Group therefore defines working capital as trade and other receivables, assets arising from insurance business, inventory, cash and trade and other payables.
3.0.1 TRADE AND OTHER RECEIVABLESCurrent trade and other receivables are carried at amortised cost less impairment losses. Non-current trade and other receivables are carried at present value based on discounted cash flows.
2014 £m
2013 £m
Non-currentService concession receivables (a) 88.5 110.0Other receivables 8.9 9.9Prepayments 8.6 9.7Accrued income – 2.7Investment receivables and
accrued investment income 4.7 2.6Total non-current other receivables 110.7 134.9
CurrentTrade receivables
– net of impairment losses (b) 242.5 189.9Service concession receivables (a) 150.5 188.5Other receivables 72.0 60.2Prepayments 57.1 48.6Accrued income 26.8 18.0Investment receivables and
accrued investment income 0.5 0.3Total current trade and other
receivables 549.4 505.5
Total trade and other receivables 660.1 640.4
The above balance is stated net of provisions for impairment losses. Information regarding the ageing of trade and other receivables is shown in Section 5.4.3.
The fair value of non-current investment receivables and accrued investment income is £4.4m (2013: £2.1m). The carrying value of the other non-current receivable balances are a reasonable approximation of the fair value.
(a) Service concession receivables The Group has recognised two service concession receivables in respect of the public-private partnership arrangement with the Valencian and Madrid Governments (the grantors). Under the arrangement with the Valencian Government, the Sanitas business was contracted to build and operate the Manises hospital for the grantor for 15 years. Under the current arrangement with the Madrid Government, the Sanitas business was contracted to operate the Torrejón hospital for the grantor for 30 years.
A financial asset has been recognised for each arrangement to the extent that the Group has an unconditional contractual right to receive cash from, or at the direction of, the grantors for the services provided per capita head of the population covered. At the end of the contracts, ownership of the hospitals revert to the grantors. The service concession receivables are carried at amortised cost less impairment losses.
(b) Impairment of financial assetsFinancial assets comprise of trade and other receivables and financial investments. Refer to Section 5.0 for financial investments.
If they are not already held at fair value, financial assets are assessed at each reporting date to determine whether there is any objective evidence that they are impaired. A financial asset is considered impaired if objective evidence indicates that one or more events that have occurred since the initial recognition of the asset have had a negative impact on the estimated future cash flows of that asset.
An impairment loss in respect of a financial investment measured at amortised cost is calculated as the difference between its carrying amount and the present value of the estimated future cash flows discounted at the effective interest rate at the date the investment was made.
Significant financial assets are tested for impairment on an individual basis. The remaining financial assets are assessed collectively in groups that share similar credit risk characteristics.
All impairment losses are recognised in the Income Statement. Impairment losses on trade receivables amounting to £1.0m (2013: £0.9m) and on investment receivables amounting to £nil (2013: £nil) have been charged to other operating expenses in the Income Statement.
Notes to the Financial Statements (CONTINUED)
for the year ended 31 December 2014

FIN
AN
CIA
L STAT
EM
EN
TS
75BUPA ANNUAL REPORT 2014
NOTES TO THE FINANCIAL STATEMENTS
3.0.2 ASSETS ARISING FROM INSURANCE BUSINESSFinancial assets arising from insurance business, excluding reinsurance debtors, are held at amortised cost less impairment losses. The valuation of reinsurance debtors is discussed in section 3.4.
2014 £m
2013 £m
Non-currentDeferred acquisition costs (a) 0.6 0.6Total non-current assets arising from
insurance business 0.6 0.6
CurrentInsurance debtors (b) 736.9 759.9Reinsurers’ share of insurance provisions (c) 15.8 14.7Deferred acquisition costs (a) 84.0 73.2Medicare rebate (d) 77.2 74.8Risk Equalisation Trust Fund recoveries 19.7 20.0Total current assets arising from
insurance business 933.6 942.6
Total assets arising from insurance business 934.2 943.2
The above balance is stated net of provision for impairment losses. Information regarding the ageing of insurance debtors, Medicare rebate and Risk Equalisation Trust Fund recoveries is shown in Section 5.4.3.
(a) Deferred acquisition costs Acquisition costs represent commissions payable and other expenses related to the acquisition of insurance contract revenues written during the financial year. Acquisition costs that have been paid that relate to subsequent periods are deferred and recognised in the Income Statement in the relevant period on a straight line basis.
The movement in deferred acquisition costs is as follows:
2014 £m
2013 £m
At beginning of year 73.8 69.3Acquisition costs deferred 309.4 311.8Acquisition costs released to Income
Statement (298.3) (307.3)Foreign exchange (0.3) –At end of year 84.6 73.8
(b) Insurance debtorsImpairment releases in respect of insurance debtors amounting to £1.2m (2013: charge of £12.9m) have been recognised in other operating expenses in the Income Statement, detailed in Section 2.3.
(c) Reinsurers’ share of insurance provisions The recoverables due from reinsurers are shown within assets arising from insurance business and are assessed for impairment at each balance sheet date. Impairments are accounted for within the Income Statement on an incurred loss basis.
Reinsurers’ share of insurance provisions are further analysed in Section 3.4.
(d) Medicare rebateIn Australia, the Government provides a rebate to health insurers in respect of the premiums paid for private health insurance. Rebates due from the Government but not received at the balance sheet date are recognised in assets arising from insurance business.
3.0.3 CASH AND CASH EQUIVALENTSCash and cash equivalents comprise cash balances, call deposits and other short-term highly liquid investments (including money market funds) with original maturities of three months or less which are subject to an insignificant risk of change in value.
Bank overdrafts that are repayable on demand and form an integral part of the Group’s capital management (see Section 5.3) are included as a component of cash and cash equivalents for the purpose of the statement of cash flows.
2014 £m
2013 £m
Cash at bank and in hand 650.0 561.8Short-term deposits 537.6 378.0Cash and cash equivalents 1,187.6 939.8
Bank overdrafts – (0.1)Cash and cash equivalents
in the statement of cash flows 1,187.6 939.7
3.0.4 RESTRICTED ASSETSRestricted assets are amounts held in respect of specific obligations and potential liabilities and may be used only to discharge those obligations and potential liabilities if and when they crystallise.
2014 £m
2013 £m
Non-current restricted assets 40.9 39.3Current restricted assets 12.3 13.4Total restricted assets 53.2 52.7
The non-current restricted assets balance of £40.9m (2013: £39.3m) consists of cash deposits held to secure a charge over the non-registered pension arrangement maturing after 2022 (see Section 6.0). Included in current restricted assets is £2.5m (2013: £3.3m) in respect of claims funds held on behalf of corporate customers.
3.0.5 INVENTORIESInventories are stated at the lower of cost and net realisable value. Cost is determined using the first-in-first-out method, or methods that approximate this and includes costs incurred in acquiring the inventories and in bringing them to their current location and condition.
Inventories relating to drugs, prostheses, consumables and housing stock were £62.2m (2013: £52.8m).
Inventory write downs of £0.2m (2013: £0.1m) were made during the year. The Group consumed £463.5m (2013: £309.8m) of inventories, which are recognised within other operating expenses in the Income Statement.

76BUPA ANNUAL REPORT 2014
NOTES TO THE FINANCIAL STATEMENTS
3.0.6 TRADE AND OTHER PAYABLESTrade and other payables (excluding deferred income) are carried at amortised cost.
2014 £m
2013 £m
Non-currentAccruals 9.6 9.7Other payables 5.4 6.9Deferred income (a) 1.2 1.3Total non-current other payables 16.2 17.9
CurrentAccruals 418.6 350.7Accommodation bond liabilities (b) 313.9 279.3Trade payables 246.3 175.9Other payables 241.7 204.3Deferred income (a) 66.4 67.7Social security and other taxes 46.1 34.4Total current trade and other payables 1,333.0 1,112.3 Total trade and other payables 1,349.2 1,130.2
The fair value of other payables and accruals are £246.6m (2013: £210.5m) and £428.0m (2013: £360.2m) respectively. The carrying value of the other trade and other payables is a reasonable approximation of the fair value. Information regarding the ageing of trade payables, other payables, accommodation bond liabilities and accruals is shown in Section 5.4.4.
(a) Deferred incomeIn respect of the Group’s revenue and deferred revenue for performance based health service contracts, estimates are made by the Group based on the most recent performance evaluation data available at the year end and these estimates are utilised if they are determined to be reliable. Reliable estimates can only be made on an individual contract basis once the results of an initial performance evaluation are available, and revenue is deferred until the first reliable evaluation is available.
Where the results of the final performance assessment differ from the estimation or if an updated reliable estimate is available, the difference is recognised in the period in which such determination is made. Where reliable estimates are not available, the Group recognises revenue only to the extent of the contract costs recognised that the Group believes are recoverable.
(b) Accommodation bond liabilities Accommodation bonds are non-interest bearing deposits paid by some residents of care homes held in Bupa Care Services Australia as payment for a place in the care home facility. These deposits are repayable when the resident leaves the facility. The bonds are recorded as the proceeds received, net of retention and any other amounts deducted at the election of the bondholder.
3.1Intangible assets
INTANGIBLE ASSETS IN BRIEFIntangible assets, including goodwill, are the non-physical assets used by the Group to generate revenues.
GOODWILLGoodwill represents the excess of the cost of a business combination over the fair value of the Group’s share of identifiable assets, liabilities and contingent liabilities of the acquired subsidiary company or associated company at the date of business combination. The carrying value of goodwill may be adjusted up to 12 months from the date of acquisition, as the allocation of the purchase price to identifiable intangible assets is finalised within that period. Goodwill arising on business combinations is capitalised and presented as part of intangible assets in the Consolidated Statement of Financial Position.
Goodwill is stated at cost less accumulated impairment losses. Impairment reviews are performed annually or more frequently if there is an indication that the carrying value may be impaired. Impairment reviews are performed at the level of the relevant cash generating unit (CGU). A CGU is the smallest identifiable group of assets generating cash inflows and outflows measured for goodwill. Where the fair value of net assets acquired is greater than the consideration paid, the excess is recognised immediately in the Income Statement.
OTHER INTANGIBLE ASSETSIntangible assets, other than goodwill, that are acquired as part of a business combination are capitalised at fair value. Intangible assets acquired separately are stated at cost less accumulated amortisation and impairment.
Amortisation is charged to the Income Statement on a straight line basis as follows:
°° Computer software 2 to 10 years
°° Brand and trademarks 10 to indefinite
°° Technology and databases 10 years
°° Distribution networks 10 to 11 years
°° Customer relationships 4 to 21 years
°° Present value of acquired in-force business 13 to 20 years
°° Customer contracts 4 to 6 years
°° Order backlogs 1 year
°° Licences to operate care homes term of licence
°° Non-compete agreements term of agreement
°° Leases term of lease
Intangible assets that are subject to amortisation are reviewed for impairment if circumstances indicate that the carrying amount may not be recoverable. An impairment loss is recognised in the Income Statement to reduce the carrying amount to the recoverable amount.
Bed licences held by the Group have been attributed an indefinite useful life due to the fact that these licences, which are issued by the Australian Government, have no expiry date. Assets with an indefinite useful life are subject to annual impairment reviews.
Notes to the Financial Statements (CONTINUED)
for the year ended 31 December 2014

FIN
AN
CIA
L STAT
EM
EN
TS
77BUPA ANNUAL REPORT 2014
NOTES TO THE FINANCIAL STATEMENTS
INTANGIBLE ASSETS
Goodwill £m
Computer software
£m
Customer relation-
ships £m
Other £m
Total £m
2014CostAt beginning of year 2,587.6 618.0 483.8 435.7 4,125.1 Assets arising on business combinations 188.9 13.7 37.7 156.4 396.7 Additions – 67.8 3.2 13.5 84.5 Disposals of subsidiary companies (307.8) (97.5) (44.4) (12.0) (461.7)Disposals – (6.6) – – (6.6)Other – 3.4 – – 3.4 Foreign exchange (52.2) (5.9) (8.0) (11.8) (77.9)At end of year 2,416.5 592.9 472.3 581.8 4,063.5
Amortisation and impairment lossAt beginning of year 595.5 416.5 166.9 163.5 1,342.4 Amortisation for year – 67.7 33.3 18.6 119.6Impairment loss – – – 0.7 0.7 Disposals of subsidiary companies (307.8) (94.8) (44.4) (12.0) (459.0)Disposals – (6.2) – – (6.2)Other – 1.9 – – 1.9 Foreign exchange 0.7 (2.6) (2.3) (3.8) (8.0)At end of year 288.4 382.5 153.5 167.0 991.4
Net book value at end of year 2,128.1 210.4 318.8 414.8 3,072.1 Net book value at beginning of year 1,992.1 201.5 316.9 272.2 2,782.7
2013 (Restated1)CostAt beginning of year 2,200.4 553.9 322.3 329.4 3,406.0Assets arising on business combinations 662.6 7.5 199.8 136.2 1,006.1Additions – 65.4 – 3.5 68.9Disposals – (2.7) – – (2.7)Other 0.6 0.7 (0.6) – 0.7Foreign exchange (276.0) (6.8) (37.7) (33.4) (353.9)At end of year 2,587.6 618.0 483.8 435.7 4,125.1
Amortisation and impairment lossAt beginning of year 593.2 358.6 146.2 161.9 1,259.9Amortisation for year – 62.1 23.1 14.2 99.4Impairment loss 20.7 3.3 12.1 0.7 36.8Disposals – (2.6) – – (2.6)Foreign exchange (18.4) (4.9) (14.5) (13.3) (51.1)At end of year 595.5 416.5 166.9 163.5 1,342.4
Net book value at end of year 1,992.1 201.5 316.9 272.2 2,782.7Net book value at beginning of year 1,607.2 195.3 176.1 167.5 2,146.1
1 Goodwill and other intangibles have been restated. See section 1.0.

78BUPA ANNUAL REPORT 2014
NOTES TO THE FINANCIAL STATEMENTS
Intangible assets of £3,072.1m (2013: £2,782.7m) includes £733.6m (2013: £589.1m) which is attributable to other intangible assets arising on business combinations (included within Customer relationships and Other) as follows:
2014 £m
2013(Restated)
£m
Customer relationships 318.8 316.9 Bed licences (within Bupa Aged Care Australia) 103.3 102.3 Brands and trademarks 241.5 96.1 Licences to operate care homes 38.4 43.2 Customer contracts 10.2 15.0 Leases 11.3 10.4 Distribution networks 9.0 4.0 Present valuation of acquired in-force business 1.1 1.1 Order backlogs – 0.1Total 733.6 589.1
Impairment testing of goodwill and intangible assetsGoodwill and intangible assets with indefinite useful lives are tested at least annually for impairment by comparing the net carrying value with the recoverable amount using value in use calculations. In arriving at the value in use for each CGU, key assumptions have been made regarding future projected cash flows, discount rates and terminal growth rates. The main assumptions upon which the cash flow projections are based include premiums and claims costs for our health insurance businesses, fee rate and occupancy for our care services businesses and revenue growth and gross margins for our hospitals and clinics. As a result of these valuation techniques, the assets are classified as level three within the IFRS 13 fair value hierarchy.
Aside from those mentioned below, cash flow projections have been based on management operating profit projections for a three year period which have been approved by the Board. Cash flow projections for Bupa Care Services UK, Quality HealthCare and Bupa Chile are based on five years with LUX MED and Bupa Care Services New Zealand based on periods of eight and eleven years respectively. The longer projection periods reflect the nature of the business models of these CGU's which rely on continual capital investment and expansion.
Taxation has been applied to the pre-taxation management operating profits based on the statutory taxation rates in the country of operation.
Future post-taxation cash flows have been discounted at post-taxation discount rates. Discount rates used for the value in use calculations for each of the Group’s CGUs are based on considerations of the specific risks associated with the business plans of each CGU, as well as external factors. These include the market assessment of the time value of money and the risks inherent in the relevant country where the cash flows are generated.
Cash flow projections beyond the forecast periods have been extrapolated by applying a terminal growth rate between 2.0% and 3.0% (2013: 2.4% and 4.6%) for all CGUs. The terminal growth rates represent an estimate of the long-term growth rate for each of the CGUs, taking into account the future and past growth rates and external sources of data. They are conservative estimates which do not exceed the long-term average growth rate for the respective industries, countries or markets in which the CGUs operate.
The values assigned to the key assumptions are based on past experience of the CGUs and assessment of future trends in the relevant industry.
The following table summarises the pre-taxation discount rates used for impairment testing:
2014 %
2013 %
Bupa Australia Health Insurance 9.7 10.6Bupa Health Services Australia 12.4 13.4Bupa Aged Care Australia 8.2 9.2Bupa Care Services New Zealand 8.7 9.4Bupa Cromwell Hospital 9.9 11.1Bupa Care Services UK 8.6 9.1Sanitas Seguros 11.3 13.2Bupa Chile 11.6 –Quality HealthCare 9.6 –LUX MED 9.6 11.1Bupa Global 10.0 11.7
Impairment of goodwillThe discounted cash flows together provide the recoverable amount of the CGU. The recoverable amount of all CGUs is determined to be higher than their respective carrying amounts, resulting in no impairment to goodwill or intangible assets with indefinite useful lives.
The following table summarises goodwill by CGU as at 31 December:
2014 £m
2013£m
Australia and New Zealand
Bupa Australia Health Insurance 832.2 859.7
Bupa Health Services Australia 244.6 239.6
Bupa Aged Care Australia 253.9 261.1
Bupa Care Services New Zealand 34.0 33.8
UK
Bupa Cromwell Hospital 16.2 16.2
Bupa Care Services UK 190.8 190.8
Other 17.0 8.4
Spain and Latin America Domestic
Sanitas Seguros 28.6 28.0
Bupa Chile 157.2 –
Other 5.5 5.8International Development Markets
Quality HealthCare 98.1 92.3
LUX MED 182.2 188.6
Bupa Global 67.8 67.8Total 2,128.1 1,992.1
In the prior year a full impairment of the goodwill relating to Bupa Home Healthcare (£20.7m) along with a write down of associated intangible assets of £12.1m occurred.
Notes to the Financial Statements (CONTINUED)
for the year ended 31 December 2014

FIN
AN
CIA
L STAT
EM
EN
TS
79BUPA ANNUAL REPORT 2014
NOTES TO THE FINANCIAL STATEMENTS
Sensitivity to changes in key assumptionsA sensitivity analysis has been performed on the key assumptions used to determine the value in use for each CGU as at 31 December 2014.
Other than as disclosed below, management believes that no reasonably probable change in any of the key assumptions would cause the carrying value of any goodwill or intangible asset with an indefinite useful life to exceed its recoverable amount.
It is possible that a change in key assumptions could cause the impairment of goodwill for Bupa Care Services New Zealand, Bupa Care Services UK, LUX MED, Quality HealthCare and Bupa Chile. The table below shows the decrease required in the terminal growth rate or increase required in discount rate for the recoverable amount of the CGU to equal the carrying amount.
Headroom £m
Terminal growth rate
%
Decrease in terminal
growth rate %
Increase in discount
rate %
Bupa Care Services New Zealand 33.0 2.8 0.5 0.5
Bupa Care Services UK 126.6 2.2 0.6 0.5LUX MED 58.5 3.0 1.3 0.8Quality HealthCare 3.7 3.0 0.1 0.1Bupa Chile 42.3 3.0 1.1 0.8
Impairment of other intangible assetsDuring the year, impairment of other intangible assets arising on business combinations totalled £nil (2013: £0.2m). Licences to operate Spanish care homes have been impaired by £0.7m (2013: £0.2m) in relation to the Sagrada Familia Licence due to lower projected average care home fees. There have been no other impairments of intangible assets with indefinite lives (2013: £nil).
3.2Property, plant and equipment
PROPERTY, PLANT AND EQUIPMENT IN BRIEFProperty, plant and equipment are the physical assets utilised by the Group to carry out business activities and generate revenues and profits.
The majority of the assets held relate to care homes and hospital properties, and equipment, and office buildings.
EQUIPMENTEquipment (including leasehold improvements) is stated at historical cost less subsequent depreciation and impairment losses.
DEPRECIATIONFreehold land and assets under construction, included within freehold or leasehold properties as appropriate, are not depreciated. Depreciation on other items of property, plant and equipment is calculated using the straight line method to allocate cost or revalued amount less residual value over estimated useful lives, as follows:
°° Freehold buildings 50 years
°° Leasehold buildings shorter of useful life and lease term
°° Equipment shorter of useful life (leasehold improvements) and lease term
°° Equipment 3 to 10 years
IMPAIRMENT Impairment reviews are undertaken where there are indications that the carrying value of an asset may not be recoverable. An impairment loss on assets carried at cost is recognised in other income and charges to reduce the carrying value to the recoverable amount. An impairment loss on assets carried at the revalued amount is recognised in the revaluation reserve, except where an asset is revalued below historical cost, in which case the loss is recognised in the Income Statement within other income and charges.
LEASED ASSETSLeases are classified as finance leases when the terms of the lease substantially transfer all the risks and rewards of ownership to the lessee. All other leases are classified as operating leases.
Assets obtained under finance leases are capitalised within property, plant and equipment at fair value at acquisition.
On initial recognition, the leased asset is measured at the amount equal to the lower of its fair value and the present value of the minimum lease payments. Subsequent to initial recognition, the asset is accounted for in accordance with the accounting policy applicable to that asset. Finance lease liabilities, net of finance charges in respect of future periods, are included within other interest bearing liabilities (see Section 5.1). The interest element of the obligation is allocated over the lease term to reflect a constant rate of interest on the outstanding obligation.
Leasehold land, where no option to obtain title exists, is treated as an operating lease. Assets classified as being under operating lease are not capitalised and therefore not recognised within the balance sheet (Section 6.1). Payments made under operating leases are recognised as prepayments within trade and other receivables within Section 3.0.1 and are recognised in the Income Statement on a straight line basis over the term of the lease within other operating expenses (section 2.3).
The amounts included in property, plant and equipment in respect of equipment held under finance leases is £0.3m (2013: £0.7m).

80BUPA ANNUAL REPORT 2014
NOTES TO THE FINANCIAL STATEMENTS
PROPERTY, PLANT AND EQUIPMENT
Freehold property
£m
Leasehold property
£mEquipment
£mTotal
£m
2014Cost or valuationAt beginning of year 2,108.9 184.2 888.2 3,181.3 Additions through business combinations 49.2 – 90.6 139.8 Additions 120.2 27.0 138.4 285.6 Disposals (6.5) (11.0) (83.2) (100.7)Disposal of subsidiaries – – (25.5) (25.5)Revaluations 15.3 (0.1) – 15.2 Other1 (6.0) 3.1 0.8 (2.1)Foreign exchange (30.2) (1.2) (23.0) (54.4)At end of year 2,250.9 202.0 986.3 3,439.2
Depreciation and impairment lossAt beginning of year 8.6 43.4 432.2 484.2 Depreciation charge for year 31.8 13.6 96.3 141.7 Disposals (0.2) (10.2) (79.4) (89.8)Disposal of subsidiaries – – (23.7) (23.7)Revaluations (1.9) – – (1.9)Impairments 21.6 0.7 – 22.3 Other (0.7) 2.6 (1.8) 0.1Foreign exchange (0.8) 0.2 (8.7) (9.3)At end of year 58.4 50.3 414.9 523.6
Net book value at end of year 2,192.5 151.7 571.4 2,915.6 Net book value at beginning of year 2,100.3 140.8 456.0 2,697.1
2013Cost or valuationAt beginning of year 2,017.4 169.6 736.5 2,923.5Additions through business combinations 177.8 7.4 78.8 264.0Additions 107.0 15.0 118.3 240.3Disposals (1.2) (7.2) (37.6) (46.0)Revaluations (87.1) (0.4) – (87.5)Other (11.3) 6.7 10.8 6.2Foreign exchange (93.7) (6.9) (18.6) (119.2)At end of year 2,108.9 184.2 888.2 3,181.3
Depreciation and impairment lossAt beginning of year 151.6 52.1 396.4 600.1Depreciation charge for year 29.5 10.2 83.7 123.4Disposals (0.5) (6.0) (36.1) (42.6)Revaluations (167.8) (9.7) – (177.5)Other (0.6) 0.3 (0.1) (0.4)Foreign exchange (3.6) (3.5) (11.7) (18.8)At end of year 8.6 43.4 432.2 484.2Net book value at end of year 2,100.3 140.8 456.0 2,697.1Net book value at beginning of year 1,865.8 117.5 340.1 2,323.4
1 Included in Other is £0.7m (2013: £6.8m), which represents a reclassification from Investment Properties (Section 3.3).
Notes to the Financial Statements (CONTINUED)
for the year ended 31 December 2014

FIN
AN
CIA
L STAT
EM
EN
TS
81BUPA ANNUAL REPORT 2014
NOTES TO THE FINANCIAL STATEMENTS
FREEHOLD AND LEASEHOLD PROPERTIES Freehold and leasehold properties are comprised of care homes, care villages, clinics, hospitals and offices. These properties are shown at fair value based on periodic valuations performed by external independent valuers, less subsequent depreciation and impairment losses. Borrowing costs relating to the acquisition or construction of qualifying assets are capitalised as part of the cost of that asset.
Revaluation of propertiesValuations are performed with sufficient regularity, at least triennially, to ensure that the carrying value does not differ significantly from fair value at the balance sheet date. Revaluations are effective as of 31 December in the year in which they were undertaken. The Directors’
valuations are performed in interim years where impairment indicators exist. The revaluation of properties carried out in 2014 was performed independently by Knight Frank Chartered Surveyors. The majority of the Group's freehold and leasehold properties were revalued during 2013 by Knight Frank or another independent, certified chartered surveyor.
Care homes and hospitals are valued with regard to their trading potential based on value in use techniques, the principal assumptions are: quantifying a fair, maintainable level of trade and profitability; levels of competition; and assumed ability to renew existing licences, consents, certificates or permits.
The significant assumptions used in the calculation of the fair values of the material level three freehold and leasehold properties in the Group are:
Freehold and Leasehold Property AustraliaNew
Zealand UK SpainAverage occupancy rate 95.5% 92.1% 88.8% 88.6%
Average capitalisation rate 15.1% 15.0% n/a n/aAverage yield price n/a n/a 7.6 8.3
UKProperties within Bupa Care Services UK are classified as level three, these properties are valued using reliable estimates of future cash flow projections. Observable inputs include average occupancy and average weekly fees. Unobservable inputs include the average yield price.
Other UK properties are classified as level two with fair values being determined by an external valuer based on market values of similar properties.
AustraliaThe Australian business values land on a market value basis, which reflects the amount the land could be expected to be sold for in an arm’s length transaction. Therefore they are classified as level two in the three level hierarchy.
The Australian buildings are classified as level three as valuations are on a capitalisation of earnings approach. This approach applies a multiple to each facility’s earnings in order to project the financial performance of the facility to determine its value in use. The multiple applied for each facility is set based on qualitative and quantitative indicators of the facility’s current and future performance and assumes normal prudent management of the facility. Observable inputs include occupancy levels, trends in earnings, land values and rental yields in the surrounding area.
New ZealandIn the New Zealand business, all property is classified as level three. Observable inputs include average occupancy and average weekly fees. Unobservable inputs include the average capitalisation rate.
Spain and Latin America
Hospitals and care homes within the Spanish business are classified as level three. The valuation is determined using reliable estimates of future cash flows. Observable inputs include occupancy rates and average monthly fees. Unobservable inputs include the average yield price.
Regional offices and clinics in Spain are valued by external valuers based on market value and these are classified as level two.
Properties acquired as part of the Cruz Blanca Salud acquisition are valued based on replacement cost and market comparables which are observable inputs and therefore these properties are classified as level two.
International Development Markets (IDM)Properties within IDM are classified as level three, with fair values being determined using reliable estimates of future cash flows. Observable inputs used include occupancy rates and average rental rates and unobservable inputs include discount rates.
Sensitivity AnalysisThe sensitivity analysis below considers the impact on the year end valuation of level three properties, and are based on a change in assumption while holding all other assumptions constant. In practice, this is unlikely to occur and changes in assumptions may be correlated.
Australia 0.5% increase 0.5% decrease
Average occupancy rate £2.4m increase £2.4m decrease
Average capitalisation rate £16.1m decrease £17.2m increase
New Zealand 0.5% increase 0.5% decrease
Average occupancy rate £1.1m increase £1.1m decrease
Average capitalisation rate £5.5m decrease £6.0m increase
UK 0.5% increase 0.5% decrease
Average occupancy rate £22.7m increase £22.7m decrease
Average yield price £6.5m increase £6.6m decrease
Spain 0.5% increase 0.5% decrease
Average occupancy rate £3.0m increase £3.0m decrease
Average yield price £0.3m increase £0.3m decrease
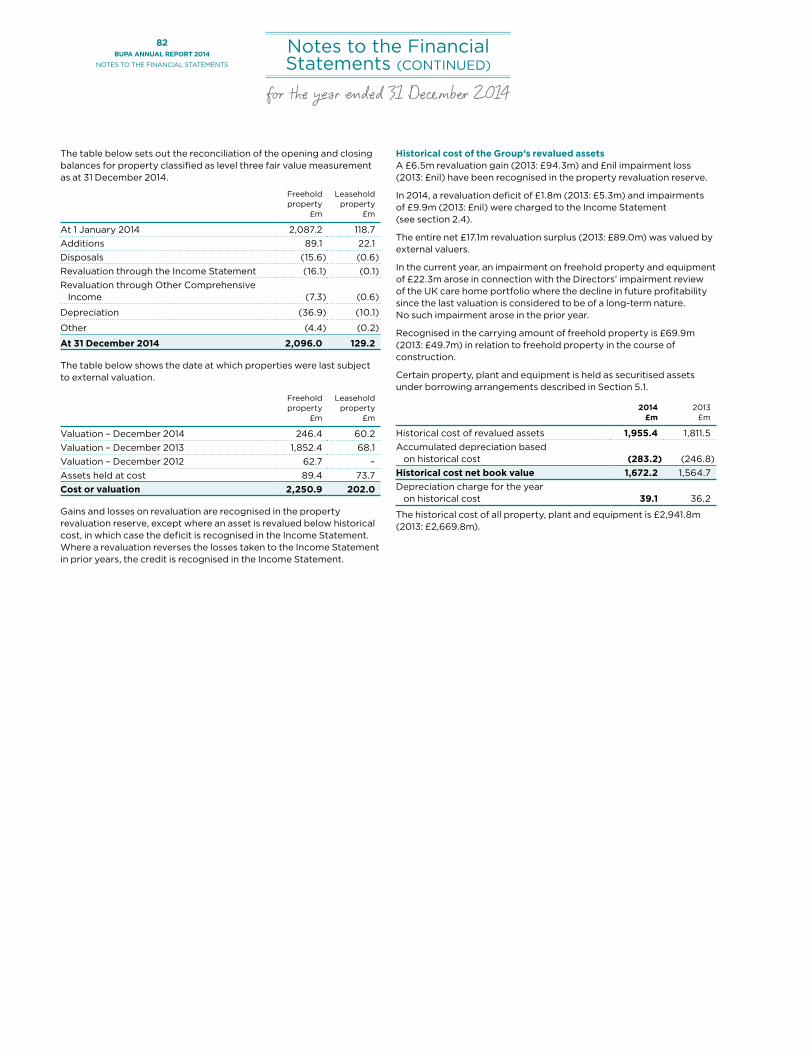
82BUPA ANNUAL REPORT 2014
NOTES TO THE FINANCIAL STATEMENTS
The table below sets out the reconciliation of the opening and closing balances for property classified as level three fair value measurement as at 31 December 2014.
Freeholdproperty
£m
Leaseholdproperty
£m
At 1 January 2014 2,087.2 118.7Additions 89.1 22.1Disposals (15.6) (0.6)Revaluation through the Income Statement (16.1) (0.1)Revaluation through Other Comprehensive
Income (7.3) (0.6)
Depreciation (36.9) (10.1)
Other (4.4) (0.2)
At 31 December 2014 2,096.0 129.2
The table below shows the date at which properties were last subject to external valuation.
Freeholdproperty
£m
Leaseholdproperty
£m
Valuation – December 2014 246.4 60.2 Valuation – December 2013 1,852.4 68.1Valuation – December 2012 62.7 – Assets held at cost 89.4 73.7 Cost or valuation 2,250.9 202.0
Gains and losses on revaluation are recognised in the property revaluation reserve, except where an asset is revalued below historical cost, in which case the deficit is recognised in the Income Statement. Where a revaluation reverses the losses taken to the Income Statement in prior years, the credit is recognised in the Income Statement.
Historical cost of the Group’s revalued assetsA £6.5m revaluation gain (2013: £94.3m) and £nil impairment loss (2013: £nil) have been recognised in the property revaluation reserve.
In 2014, a revaluation deficit of £1.8m (2013: £5.3m) and impairments of £9.9m (2013: £nil) were charged to the Income Statement (see section 2.4).
The entire net £17.1m revaluation surplus (2013: £89.0m) was valued by external valuers.
In the current year, an impairment on freehold property and equipment of £22.3m arose in connection with the Directors’ impairment review of the UK care home portfolio where the decline in future profitability since the last valuation is considered to be of a long-term nature. No such impairment arose in the prior year.
Recognised in the carrying amount of freehold property is £69.9m (2013: £49.7m) in relation to freehold property in the course of construction.
Certain property, plant and equipment is held as securitised assets under borrowing arrangements described in Section 5.1.
2014 £m
2013 £m
Historical cost of revalued assets 1,955.4 1,811.5Accumulated depreciation based
on historical cost (283.2) (246.8)Historical cost net book value 1,672.2 1,564.7Depreciation charge for the year
on historical cost 39.1 36.2
The historical cost of all property, plant and equipment is £2,941.8m (2013: £2,669.8m).
Notes to the Financial Statements (CONTINUED)
for the year ended 31 December 2014

FIN
AN
CIA
L STAT
EM
EN
TS
83BUPA ANNUAL REPORT 2014
NOTES TO THE FINANCIAL STATEMENTS
3.3Investment properties
INVESTMENT PROPERTIES IN BRIEFInvestment properties are physical assets that are not occupied by the Group and are leased to third parties to generate rental income.
The vast majority of investment properties held by the Group relate to a portfolio of retirement villages in New Zealand.
Investment properties are measured at fair value, determined individually, on a basis appropriate to the purpose for which the property is intended and with regard to recent market transactions for similar properties in the same location.
In an active market, an independent valuer, holding a recognised and relevant professional qualification, and with recent experience in the location and category of investment property being valued, values the portfolio annually.
In New Zealand, the retirement village market is fragmented. Growth in new developments is also restricted due to a lack of suitable sites. As a result, no active market exists for the retirement villages from which values can be derived. These properties are valued using discounted cash flow projections based on reliable estimates of future cash flows.
Any gain or loss arising from a change in the fair value is recognised in the Income Statement within financial income and expenses.
(i) Investment properties
2014 £m
2013 £m
At 1 January 2014 184.2 159.9Additions through business combinations 4.6 5.3Additions 41.0 20.2Increase in fair value 10.9 11.2Reclassification from Property, Plant and
Equipment 0.7 (6.8)Foreign exchange 0.6 (5.6)At 31 December 2014 242.0 184.2
The historical cost of investment properties is £148.9m (2013: £147.8m).
Of the £242.0m (2013: £184.2m) of investment properties in the balance sheet as at 31 December 2014, £7.9m (2013: £3.8m) was either valued based on active market prices by external valuers, Knight Frank, Chartered Surveyors or acquired in the year. These properties are categorised as level two within the fair value hierarchy.
The remaining carrying value of investment properties of £234.1m (2013: £180.4m), primarily consisting of the Group's portfolio of retirement villages, was valued by management using internally prepared discounted cash flow projections, supported by the terms of any existing lease and other contracts, and when possible, by external evidence such as current market rents for similar properties in the same location and condition. Discount rates are used to reflect current market assessments of the uncertainty in the amount or timing of the cash flows. The discounted cash flow projections are reviewed by an independent valuer, Deloitte. These properties are categorised as level three within the fair value hierarchy.
Significant assumptions used in the valuation include:
Australia and New Zealand
Discount rate 9.0%Capital growth rate 2.4%Provision for capital replacement 0.4%Vacancy period 3 monthsTurnover in apartments and villas 4–7 years
The following table sets out the reconciliation of the opening and closing balances for investment properties classified as level three fair value measurements as at 31 December 2014.
Total £m
At 1 January 2014 180.4Additions through business combinations 2.8 Additions 39.3 Unrealised gains recognised in financial income 10.9Foreign exchange 0.7 At 31 December 2014 234.1
The sensitivity analysis below consider the impact on the year end valuation of level three investment properties, and are based on a change in assumption while holding all other assumptions constant. In practice, this is unlikely to occur and changes in assumptions may be correlated.
Australia and New Zealand 0.5% increase 0.5% decrease
Discount rate £5.1m decrease £6.1m increaseCapital growth rate £14.3m increase £12.3m decrease
(ii) Leases as lessor
Investment properties include commercial properties which are leased to third parties. The leases contain an initial non-cancellable period of between one and three years. Subsequent renewals are negotiated with the lessee.
The Group leases out its investment properties under operating leases. The future lease receipts under non-cancellable leases are as follows:
2014 £m
2013 £m
Less than one year 0.2 0.1Between one and five years 0.9 0.1More than five years 1.1 –Total 2.2 0.2
During the year ended 31 December 2014, the Group’s retirement village portfolio generated £8.7m (2013: £7.5m) of income which was recognised as revenue in the Income Statement. Total direct operating expenses of these retirement villages amounted to £5.9m (2013: £5.4m). £0.3m (2013: £0.6m) was recognised as rental income in the Income Statement for other investment properties held by the Group. Direct operating expenses of these properties amounted to £0.1m (2013: £0.1m).

84BUPA ANNUAL REPORT 2014
NOTES TO THE FINANCIAL STATEMENTS
Notes to the Financial Statements (CONTINUED)
for the year ended 31 December 2014
3.4Provisions and other
liabilities under insurance contracts issued
PROVISIONS AND OTHER LIABILITIES UNDER INSURANCE CONTRACTS ISSUED IN BRIEFThe provisions and other liabilities under insurance contracts issued arise from the Group’s underwriting activities.
The provisions mainly relate to unearned premiums, which are deferred revenues that relate to future periods; and claims, where an estimate is made of the expense required to settle existing insurance contract obligations. The other liabilities primarily consist of deposits and commissions payable.
3.4.1 PROVISIONS UNDER INSURANCE CONTRACTS ISSUEDUnearned premiumsThe unearned premium provision represents premiums written that relate to periods of risk in future accounting periods. It is calculated on a straight line basis, which is not materially different from a calculation based on the pattern of incidence of risk.
Provision for claimsThe gross provision for claims represents the estimated liability arising from claims episodes in current and preceding financial years which have not yet given rise to claims paid. The provision includes an allowance for claims management and handling expenses.
The gross provision for claims is estimated based on current information, and the ultimate liability may vary as a result of subsequent information and events.
Adjustments to the amount of claims provision for prior years are included in the Income Statement in the financial year in which the change is made. In setting the provisions for claims outstanding, a best estimate is determined on an undiscounted basis and then a margin of prudence is added such that there is confidence that future claims will be met from the provisions. The level of prudence set is either one required by regulation or one that provides an appropriate degree of confidence.
A provision is made for unexpired risks where the claims and administrative expenses are likely to arise after the end of the financial year, in respect of contracts commencing before that date, are expected to exceed the related unearned premiums, less related deferred acquisition costs. The methods used and estimates made for claims provisions are reviewed regularly.
2014 2013
Gross £m
Re- insurance
£mNet £m
Gross £m
Re- insurance
£mNet £m
General insurance businessProvisions for unearned premiums 1,499.4 (9.2) 1,490.2 1,488.8 (7.7) 1,481.1Provisions for claims 683.1 (5.7) 677.4 684.7 (6.2) 678.5
Long-term businessProvisions for life insurance benefits 26.4 (0.9) 25.5 22.5 (0.8) 21.7Total insurance provisions 2,208.9 (15.8) 2,193.1 2,196.0 (14.7) 2,181.3
Non-current 26.4 – 26.4 24.4 – 24.4
Current 2,182.5 (15.8) 2,166.7 2,171.6 (14.7) 2,156.9Total insurance provisions 2,208.9 (15.8) 2,193.1 2,196.0 (14.7) 2,181.3
(a) Analysis of movements in provisions for unearned premiumsAt beginning of year 1,488.8 (7.7) 1,481.1 1,547.7 (7.5) 1,540.2Additions through business combinations – – – 0.5 – 0.5Premiums deferred 7,118.0 (41.2) 7,076.8 6,889.6 (36.2) 6,853.4Deferred premiums released to income (7,088.5) 39.4 (7,049.1) (6,892.5) 35.5 (6,857.0)Foreign exchange (18.9) 0.3 (18.6) (56.5) 0.5 (56.0)At end of year 1,499.4 (9.2) 1,490.2 1,488.8 (7.7) 1,481.1
(b) Analysis of movements in provisions for claimsAt beginning of year 684.7 (6.2) 678.5 809.4 (5.4) 804.0Additions through business combinations 44.7 – 44.7 0.1 – 0.1Cash paid to settle claims (5,462.6) 29.6 (5,433.0) (5,390.8) 25.7 (5,365.1)Decrease for prior years’ claims (17.0) 0.1 (16.9) (42.0) (0.5) (42.5)Increase for current year claims 5,521.5 (29.2) 5,492.3 5,456.3 (25.8) 5,430.5Risk Equalisation Trust Fund levy (77.8) – (77.8) (104.9) – (104.9)Foreign exchange (10.4) – (10.4) (43.4) (0.2) (43.6)At end of year 683.1 (5.7) 677.4 684.7 (6.2) 678.5

85BUPA ANNUAL REPORT 2014
NOTES TO THE FINANCIAL STATEMENTS
FIN
AN
CIA
L STAT
EM
EN
TS
Assumptions for general insurance businessThe process of recognising liabilities arising from general insurance contracts requires the exercise of judgement in relation to estimating future claims payments, claims handling expenses and unexpired risk provisions. The principal assumption affecting the measurement of liabilities is that the nature of recent claims development profiles of the Group’s insurance entities, and current claims experience, will be consistent with recent trends. Other assumptions are also applied in measuring the Group’s insurance liabilities but have a less material effect. The aim of these assumptions is to arrive at the best estimate of future obligations and cash outflows of the Group. A margin for adverse deviation is reflected within the estimates.
Claims development patterns are analysed in each of the Group’s general insurance entities and, in some cases, are further sub-analysed where an entity has distinct portfolios of general insurance with distinct characteristics. The characteristics may differ by product line, risk profile, geographic sector or market sector. The analysis is used to determine a claims settlement pattern using recent experience, adjusted where appropriate by observed trends over time. Claims are assessed on a case by case basis. Extrapolation methods based on the claims settlement pattern are used: these are recognised methods described in the Institute and Faculty of Actuaries Claims Reserving Manual (1997). Large homogeneous sections of insurance business (e.g. corporate business in a specific region) are often analysed by more than one method, such as the chain ladder, Bornhuetter-Ferguson and paid claim loss ratio methods. Additional industry accepted refinements are made to allow for, but not limited to, the treatment of large claims, claim seasonality, claims inflation and currency conversions.
While there is some diversity in the claims development profile across the Group, the Group’s general insurance contracts principally relate to healthcare benefits that occur with stable frequencies and exhibit very short development patterns that can be characterised in months rather than years. Less automated medical insurance portfolios may have development patterns extending out from 12 to 18 months, whereas pre-authorisation, electronic claims settlement and network provider arrangements may produce development patterns of four to six months.
Insurance provisions are estimates. Actual experience may vary, primarily as a result of claims or administrative expenses being different than expected.
The following table shows the sensitivities to such variation from expectations.
Increase in claims
Increase in expenses
2014Change in variable % 5.0 10.0Reduction in profit net of
reinsurance before taxation £m 58.4 16.3
2013Change in variable % 5.0 10.0Reduction in profit net of
reinsurance before taxation £m 57.0 18.5
These variances would lower the amount of profit that would otherwise be expected to emerge in subsequent periods. Since premium provisions include profit margins and claims provisions include margins of prudence, variance from expectations by the amounts shown will be absorbed by these margins for the current book of business.
The long-term insurance business does not form a part of the core operations.
Liability adequacy testsLiability adequacy tests are performed for insurance portfolios on the basis of estimates of future claims, costs and premiums earned. For short duration contracts, a premium deficiency is recognised if the sum of expected claim costs and claim adjustment expenses, capitalised deferred acquisition costs, and maintenance expenses exceeds related unearned premiums while considering anticipated investment income. Such deficiencies would be immediately recognised in the Income Statement.
3.4.2 OTHER LIABILITIES UNDER INSURANCE CONTRACTS ISSUEDOther liabilities under insurance contracts issued consists of payables to insurance creditors other than policyholders.
2014 £m
2013 £m
Reinsurers’ deposits 2.1 6.1Reinsurance payables 17.9 0.2Commissions payable 8.7 8.4Other insurance payables 28.9 2.5Total other liabilities under insurance
contracts issued 57.6 17.2
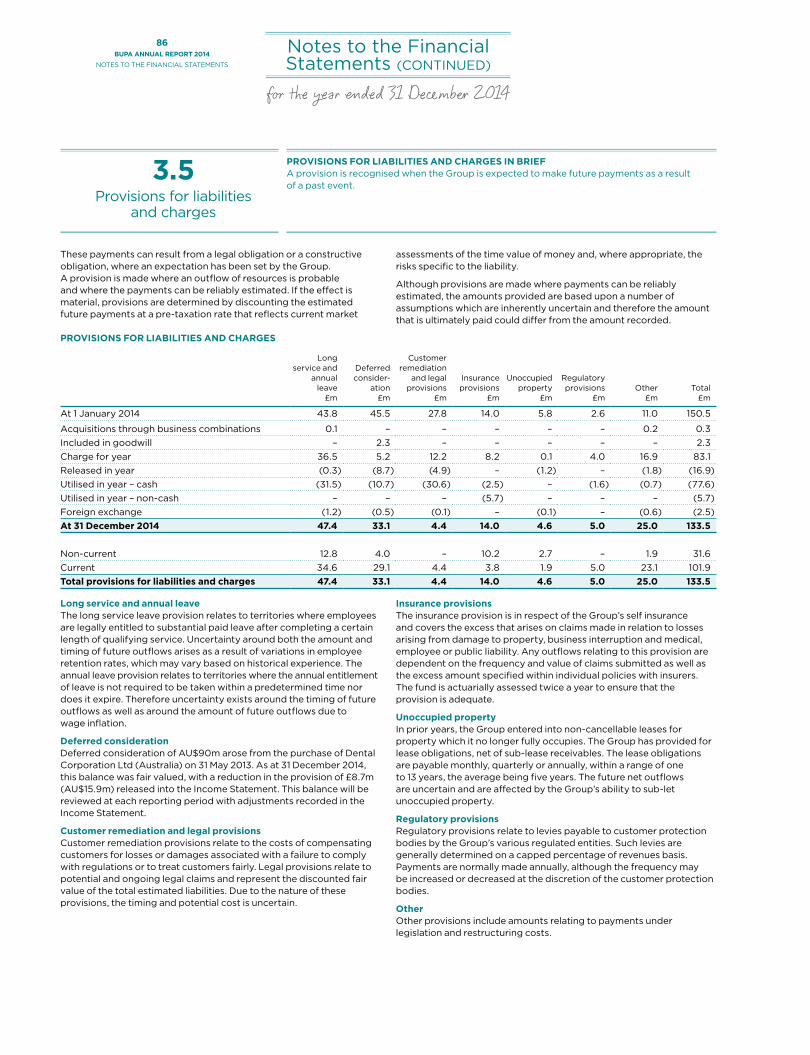
86BUPA ANNUAL REPORT 2014
NOTES TO THE FINANCIAL STATEMENTS
Notes to the Financial Statements (CONTINUED)
for the year ended 31 December 2014
3.5Provisions for liabilities
and charges
PROVISIONS FOR LIABILITIES AND CHARGES IN BRIEFA provision is recognised when the Group is expected to make future payments as a result of a past event.
These payments can result from a legal obligation or a constructive obligation, where an expectation has been set by the Group. A provision is made where an outflow of resources is probable and where the payments can be reliably estimated. If the effect is material, provisions are determined by discounting the estimated future payments at a pre-taxation rate that reflects current market
assessments of the time value of money and, where appropriate, the risks specific to the liability.
Although provisions are made where payments can be reliably estimated, the amounts provided are based upon a number of assumptions which are inherently uncertain and therefore the amount that is ultimately paid could differ from the amount recorded.
PROVISIONS FOR LIABILITIES AND CHARGES
Long service and
annual leave
£m
Deferredconsider-
ation£m
Customer remediation
and legal provisions
£m
Insurance provisions
£m
Unoccupied property
£m
Regulatory provisions
£mOther
£mTotal
£m
At 1 January 2014 43.8 45.5 27.8 14.0 5.8 2.6 11.0 150.5
Acquisitions through business combinations 0.1 – – – – – 0.2 0.3 Included in goodwill – 2.3 – – – – – 2.3 Charge for year 36.5 5.2 12.2 8.2 0.1 4.0 16.9 83.1 Released in year (0.3) (8.7) (4.9) – (1.2) – (1.8) (16.9)Utilised in year – cash (31.5) (10.7) (30.6) (2.5) – (1.6) (0.7) (77.6)Utilised in year – non-cash – – – (5.7) – – – (5.7)Foreign exchange (1.2) (0.5) (0.1) – (0.1) – (0.6) (2.5)At 31 December 2014 47.4 33.1 4.4 14.0 4.6 5.0 25.0 133.5
Non-current 12.8 4.0 – 10.2 2.7 – 1.9 31.6 Current 34.6 29.1 4.4 3.8 1.9 5.0 23.1 101.9 Total provisions for liabilities and charges 47.4 33.1 4.4 14.0 4.6 5.0 25.0 133.5
Long service and annual leaveThe long service leave provision relates to territories where employees are legally entitled to substantial paid leave after completing a certain length of qualifying service. Uncertainty around both the amount and timing of future outflows arises as a result of variations in employee retention rates, which may vary based on historical experience. The annual leave provision relates to territories where the annual entitlement of leave is not required to be taken within a predetermined time nor does it expire. Therefore uncertainty exists around the timing of future outflows as well as around the amount of future outflows due to wage inflation.
Deferred considerationDeferred consideration of AU$90m arose from the purchase of Dental Corporation Ltd (Australia) on 31 May 2013. As at 31 December 2014, this balance was fair valued, with a reduction in the provision of £8.7m (AU$15.9m) released into the Income Statement. This balance will be reviewed at each reporting period with adjustments recorded in the Income Statement.
Customer remediation and legal provisionsCustomer remediation provisions relate to the costs of compensating customers for losses or damages associated with a failure to comply with regulations or to treat customers fairly. Legal provisions relate to potential and ongoing legal claims and represent the discounted fair value of the total estimated liabilities. Due to the nature of these provisions, the timing and potential cost is uncertain.
Insurance provisions The insurance provision is in respect of the Group’s self insurance and covers the excess that arises on claims made in relation to losses arising from damage to property, business interruption and medical, employee or public liability. Any outflows relating to this provision are dependent on the frequency and value of claims submitted as well as the excess amount specified within individual policies with insurers. The fund is actuarially assessed twice a year to ensure that the provision is adequate.
Unoccupied propertyIn prior years, the Group entered into non-cancellable leases for property which it no longer fully occupies. The Group has provided for lease obligations, net of sub-lease receivables. The lease obligations are payable monthly, quarterly or annually, within a range of one to 13 years, the average being five years. The future net outflows are uncertain and are affected by the Group’s ability to sub-let unoccupied property.
Regulatory provisionsRegulatory provisions relate to levies payable to customer protection bodies by the Group’s various regulated entities. Such levies are generally determined on a capped percentage of revenues basis. Payments are normally made annually, although the frequency may be increased or decreased at the discretion of the customer protection bodies.
OtherOther provisions include amounts relating to payments under legislation and restructuring costs.
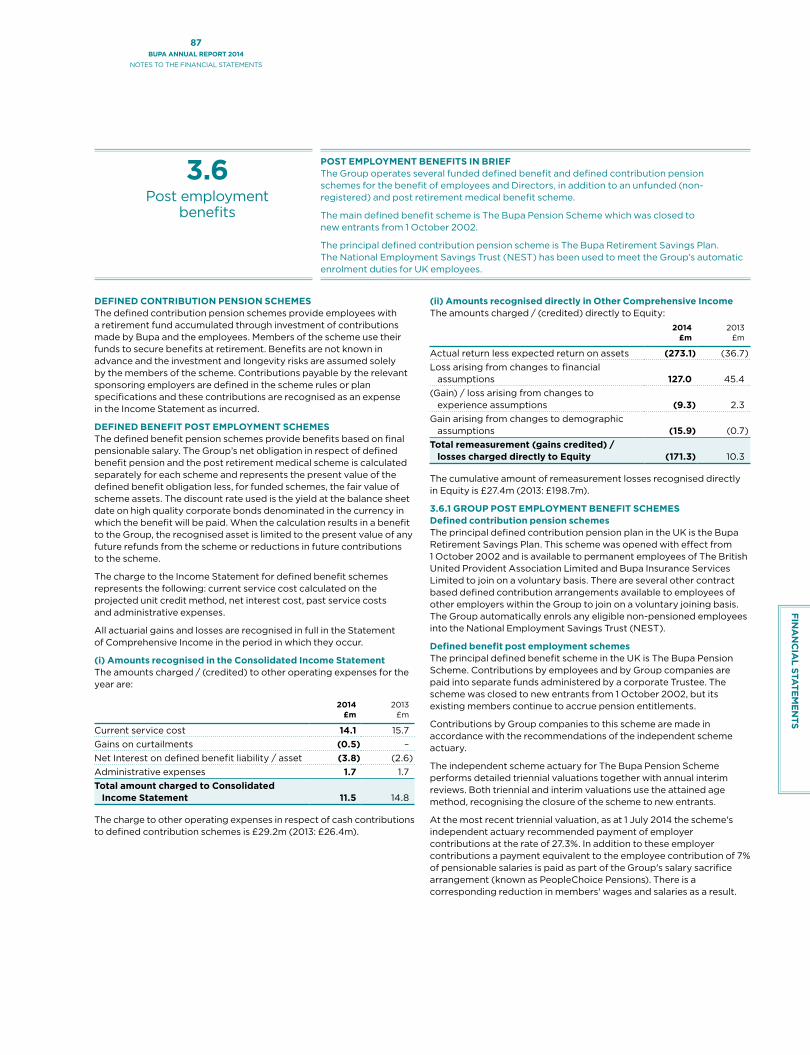
87BUPA ANNUAL REPORT 2014
NOTES TO THE FINANCIAL STATEMENTS
FIN
AN
CIA
L STAT
EM
EN
TS
3.6Post employment
benefits
POST EMPLOYMENT BENEFITS IN BRIEFThe Group operates several funded defined benefit and defined contribution pension schemes for the benefit of employees and Directors, in addition to an unfunded (non-registered) and post retirement medical benefit scheme.
The main defined benefit scheme is The Bupa Pension Scheme which was closed to new entrants from 1 October 2002.
The principal defined contribution pension scheme is The Bupa Retirement Savings Plan. The National Employment Savings Trust (NEST) has been used to meet the Group’s automatic enrolment duties for UK employees.
DEFINED CONTRIBUTION PENSION SCHEMESThe defined contribution pension schemes provide employees with a retirement fund accumulated through investment of contributions made by Bupa and the employees. Members of the scheme use their funds to secure benefits at retirement. Benefits are not known in advance and the investment and longevity risks are assumed solely by the members of the scheme. Contributions payable by the relevant sponsoring employers are defined in the scheme rules or plan specifications and these contributions are recognised as an expense in the Income Statement as incurred.
DEFINED BENEFIT POST EMPLOYMENT SCHEMESThe defined benefit pension schemes provide benefits based on final pensionable salary. The Group’s net obligation in respect of defined benefit pension and the post retirement medical scheme is calculated separately for each scheme and represents the present value of the defined benefit obligation less, for funded schemes, the fair value of scheme assets. The discount rate used is the yield at the balance sheet date on high quality corporate bonds denominated in the currency in which the benefit will be paid. When the calculation results in a benefit to the Group, the recognised asset is limited to the present value of any future refunds from the scheme or reductions in future contributions to the scheme.
The charge to the Income Statement for defined benefit schemes represents the following: current service cost calculated on the projected unit credit method, net interest cost, past service costs and administrative expenses.
All actuarial gains and losses are recognised in full in the Statement of Comprehensive Income in the period in which they occur.
(i) Amounts recognised in the Consolidated Income StatementThe amounts charged / (credited) to other operating expenses for the year are:
2014£m
2013£m
Current service cost 14.1 15.7Gains on curtailments (0.5) –Net Interest on defined benefit liability / asset (3.8) (2.6)Administrative expenses 1.7 1.7Total amount charged to Consolidated
Income Statement 11.5 14.8
The charge to other operating expenses in respect of cash contributions to defined contribution schemes is £29.2m (2013: £26.4m).
(ii) Amounts recognised directly in Other Comprehensive Income The amounts charged / (credited) directly to Equity:
2014£m
2013£m
Actual return less expected return on assets (273.1) (36.7)Loss arising from changes to financial
assumptions 127.0 45.4(Gain) / loss arising from changes to
experience assumptions (9.3) 2.3Gain arising from changes to demographic
assumptions (15.9) (0.7)Total remeasurement (gains credited) /
losses charged directly to Equity (171.3) 10.3
The cumulative amount of remeasurement losses recognised directly in Equity is £27.4m (2013: £198.7m).
3.6.1 GROUP POST EMPLOYMENT BENEFIT SCHEMESDefined contribution pension schemesThe principal defined contribution pension plan in the UK is the Bupa Retirement Savings Plan. This scheme was opened with effect from 1 October 2002 and is available to permanent employees of The British United Provident Association Limited and Bupa Insurance Services Limited to join on a voluntary basis. There are several other contract based defined contribution arrangements available to employees of other employers within the Group to join on a voluntary joining basis. The Group automatically enrols any eligible non-pensioned employees into the National Employment Savings Trust (NEST).
Defined benefit post employment schemesThe principal defined benefit scheme in the UK is The Bupa Pension Scheme. Contributions by employees and by Group companies are paid into separate funds administered by a corporate Trustee. The scheme was closed to new entrants from 1 October 2002, but its existing members continue to accrue pension entitlements.
Contributions by Group companies to this scheme are made in accordance with the recommendations of the independent scheme actuary.
The independent scheme actuary for The Bupa Pension Scheme performs detailed triennial valuations together with annual interim reviews. Both triennial and interim valuations use the attained age method, recognising the closure of the scheme to new entrants.
At the most recent triennial valuation, as at 1 July 2014 the scheme's independent actuary recommended payment of employer contributions at the rate of 27.3%. In addition to these employer contributions a payment equivalent to the employee contribution of 7% of pensionable salaries is paid as part of the Group's salary sacrifice arrangement (known as PeopleChoice Pensions). There is a corresponding reduction in members' wages and salaries as a result.

88BUPA ANNUAL REPORT 2014
NOTES TO THE FINANCIAL STATEMENTS
Notes to the Financial Statements (CONTINUED)
for the year ended 31 December 2014
The expected contributions payable in 2015, with regards to the accumulation of future benefits, are £49.2m in respect of The Bupa Pension Scheme and £1.4m in respect of PeopleChoice Pensions.
During the year the company made an additional contribution of £40.0m to The Bupa Pension Scheme.
There are several other smaller defined benefit pension schemes operated by UK and overseas subsidiaries. The defined benefit pension schemes are assessed by independent scheme actuaries in accordance with UK or local practice and under IAS 19 as at 31 December 2014 for the purposes of inclusion in the Group's consolidated financial statements. Complete disclosure of these other defined benefit pension schemes is not practicable within this report but they are disclosed within the financial statements of the relevant sponsoring employer of each scheme.
Unfunded schemes Unfunded defined benefit pension arrangements exist for certain employees and former employees to provide benefits in addition to the funded pension arrangements provided by the Group. There are no separate funds or assets in the Statement of Financial Position to support the unfunded schemes; however, provisions are included in the Statement of Financial Position in respect of these liabilities and assets are ring-fenced to support these liabilities.
The latest valuation of these arrangements was performed as at 31 December 2014 under IAS 19 by the Group's independent actuary. The charge to the Consolidated Income Statement in respect of these arrangements and the assessment of the related pension liability as at 31 December 2014 have been made in accordance with this latest valuation, which used the same principal assumptions as adopted at 31 December 2014 under IAS 19 for The Bupa Pension Scheme.
Post retirement medical benefit schemeThe Group also provides unfunded post retirement medical benefits for certain former employees. These benefits were granted under an agreement which closed to new entrants in 1992. The latest valuation of this scheme was carried out as at 31 December 2014 by an actuary employed by the Group using the same key assumptions as adopted at 31 December 2014 under IAS 19 for The Bupa Pension Scheme.
(iii) Assets and liabilities of schemes
Pension schemesPost retirement medical
benefit scheme Total
Note2014
£m2013
£m2014
£m2013
£m2014
£m2013
£m
Present value of funded obligations (iv) (1,388.6) (1,250.7) – – (1,388.6) (1,250.7)Fair value of scheme assets (v) 1,728.5 1,373.6 – – 1,728.5 1,373.6Net assets / (liabilities) of funded schemes 339.9 122.9 – – 339.9 122.9Present value of unfunded obligations (iv) (43.2) (39.4) (11.4) (11.0) (54.6) (50.4)Net recognised assets / (liabilities) 296.7 83.5 (11.4) (11.0) 285.3 72.5
Represented on the statement of financial positionNet liabilities (66.1) (58.0)Net assets 351.4 130.5Net recognised assets 285.3 72.5

89BUPA ANNUAL REPORT 2014
NOTES TO THE FINANCIAL STATEMENTS
FIN
AN
CIA
L STAT
EM
EN
TS
(iv) Present value of the schemes' obligationsThe movements in the present value of schemes’ obligations are:
Pension schemesPost retirement medical
benefit scheme Total
2014£m
2013 £m
2014£m
2013£m
2014£m
2013£m
At beginning of year 1,290.1 1,203.1 11.0 14.9 1,301.1 1,218.0Current service cost 14.1 15.7 – – 14.1 15.7Interest on obligations 59.3 53.2 0.5 0.7 59.8 53.9Contributions by employees 0.6 0.7 – – 0.6 0.7Loss / (gain) arising from changes to financial assumptions 127.0 49.2 – (3.8) 127.0 45.4(Gain) / loss arising from changes to experience assumptions (9.3) 2.5 – (0.2) (9.3) 2.3(Gain) / loss arising from changes to demographic assumptions (16.2) (0.7) 0.3 – (15.9) (0.7)
Benefits paid (32.8) (30.1) (0.4) (0.6) (33.2) (30.7)Gains on curtailment (0.5) – – – (0.5) –Foreign exchange (0.5) (3.5) – – (0.5) (3.5)At end of year 1,431.8 1,290.1 11.4 11.0 1,443.2 1,301.1
(v) Fair value of funded schemes’ assetsThe movements in the fair value of the funded schemes’ assets are:
2014£m
2013£m
At beginning of year 1,373.6 1,260.4Interest income 63.6 56.5
Return on assets excluding interest income 273.1 36.7Contributions by employer 51.3 53.4Contributions by employees 0.6 0.7Administration expenses (1.7) (1.7)Benefits paid (31.4) (28.7)Foreign exchange (0.6) (3.7)At end of year 1,728.5 1,373.6
The market values of the assets of the funded schemes' are as follows:2014
£m2013
£m
Equities 245.4 579.4Government bonds 3.5 3.2Property 2.2 3.0Corporate bonds 337.3 717.2Cash / Other assets 351.6 62.8Gilts 764.6 1.2Diversified growth funds 23.9 6.8Total market value of the assets of the funded schemes 1,728.5 1,373.6
All assets have a quoted market price.
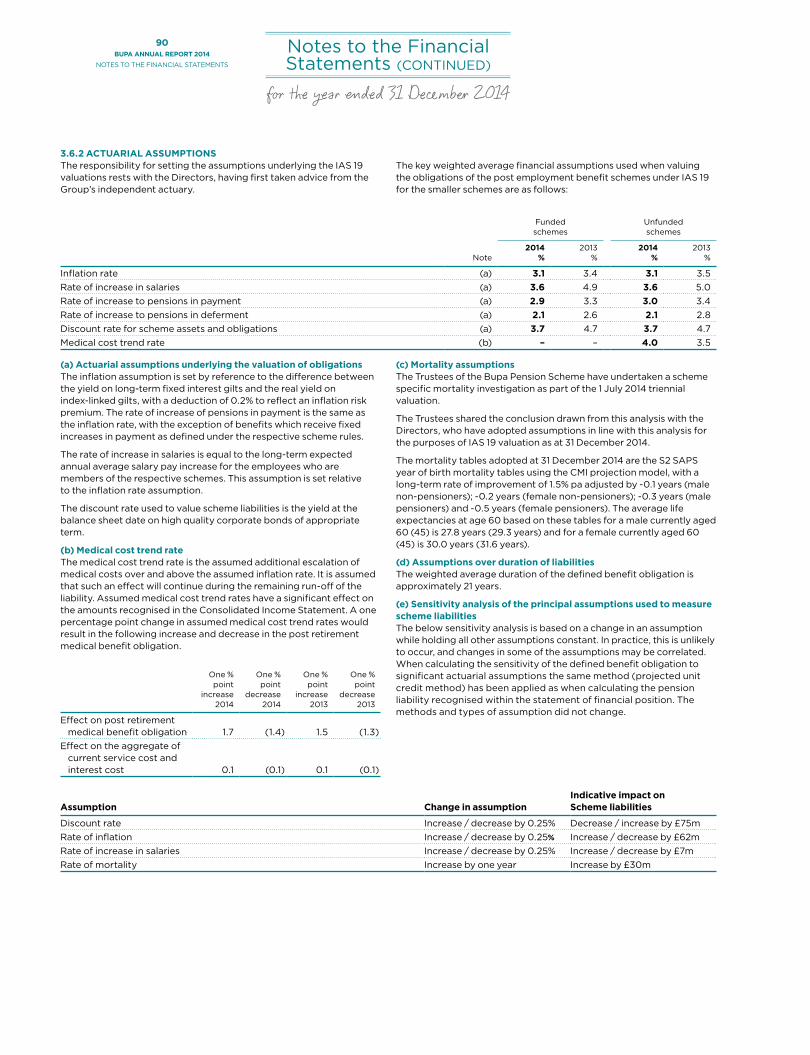
90BUPA ANNUAL REPORT 2014
NOTES TO THE FINANCIAL STATEMENTS
Notes to the Financial Statements (CONTINUED)
for the year ended 31 December 2014
3.6.2 ACTUARIAL ASSUMPTIONS The responsibility for setting the assumptions underlying the IAS 19 valuations rests with the Directors, having first taken advice from the Group’s independent actuary.
The key weighted average financial assumptions used when valuing the obligations of the post employment benefit schemes under IAS 19 for the smaller schemes are as follows:
Funded schemes
Unfunded schemes
Note2014
%2013
%2014
%2013
%
Inflation rate (a) 3.1 3.4 3.1 3.5Rate of increase in salaries (a) 3.6 4.9 3.6 5.0Rate of increase to pensions in payment (a) 2.9 3.3 3.0 3.4Rate of increase to pensions in deferment (a) 2.1 2.6 2.1 2.8Discount rate for scheme assets and obligations (a) 3.7 4.7 3.7 4.7Medical cost trend rate (b) – – 4.0 3.5
(a) Actuarial assumptions underlying the valuation of obligationsThe inflation assumption is set by reference to the difference between the yield on long-term fixed interest gilts and the real yield on index-linked gilts, with a deduction of 0.2% to reflect an inflation risk premium. The rate of increase of pensions in payment is the same as the inflation rate, with the exception of benefits which receive fixed increases in payment as defined under the respective scheme rules.
The rate of increase in salaries is equal to the long-term expected annual average salary pay increase for the employees who are members of the respective schemes. This assumption is set relative to the inflation rate assumption.
The discount rate used to value scheme liabilities is the yield at the balance sheet date on high quality corporate bonds of appropriate term.
(b) Medical cost trend rate The medical cost trend rate is the assumed additional escalation of medical costs over and above the assumed inflation rate. It is assumed that such an effect will continue during the remaining run-off of the liability. Assumed medical cost trend rates have a significant effect on the amounts recognised in the Consolidated Income Statement. A one percentage point change in assumed medical cost trend rates would result in the following increase and decrease in the post retirement medical benefit obligation.
One % point
increase 2014
One % point
decrease 2014
One % point
increase 2013
One % point
decrease 2013
Effect on post retirement medical benefit obligation 1.7 (1.4) 1.5 (1.3)
Effect on the aggregate of current service cost and interest cost 0.1 (0.1) 0.1 (0.1)
(c) Mortality assumptionsThe Trustees of the Bupa Pension Scheme have undertaken a scheme specific mortality investigation as part of the 1 July 2014 triennial valuation.
The Trustees shared the conclusion drawn from this analysis with the Directors, who have adopted assumptions in line with this analysis for the purposes of IAS 19 valuation as at 31 December 2014.
The mortality tables adopted at 31 December 2014 are the S2 SAPS year of birth mortality tables using the CMI projection model, with a long-term rate of improvement of 1.5% pa adjusted by -0.1 years (male non-pensioners); -0.2 years (female non-pensioners); -0.3 years (male pensioners) and -0.5 years (female pensioners). The average life expectancies at age 60 based on these tables for a male currently aged 60 (45) is 27.8 years (29.3 years) and for a female currently aged 60 (45) is 30.0 years (31.6 years).
(d) Assumptions over duration of liabilities The weighted average duration of the defined benefit obligation is approximately 21 years.
(e) Sensitivity analysis of the principal assumptions used to measure scheme liabilitiesThe below sensitivity analysis is based on a change in an assumption while holding all other assumptions constant. In practice, this is unlikely to occur, and changes in some of the assumptions may be correlated. When calculating the sensitivity of the defined benefit obligation to significant actuarial assumptions the same method (projected unit credit method) has been applied as when calculating the pension liability recognised within the statement of financial position. The methods and types of assumption did not change.
Assumption Change in assumptionIndicative impact on Scheme liabilities
Discount rate Increase / decrease by 0.25% Decrease / increase by £75m
Rate of inflation Increase / decrease by 0.25% Increase / decrease by £62mRate of increase in salaries Increase / decrease by 0.25% Increase / decrease by £7mRate of mortality Increase by one year Increase by £30m
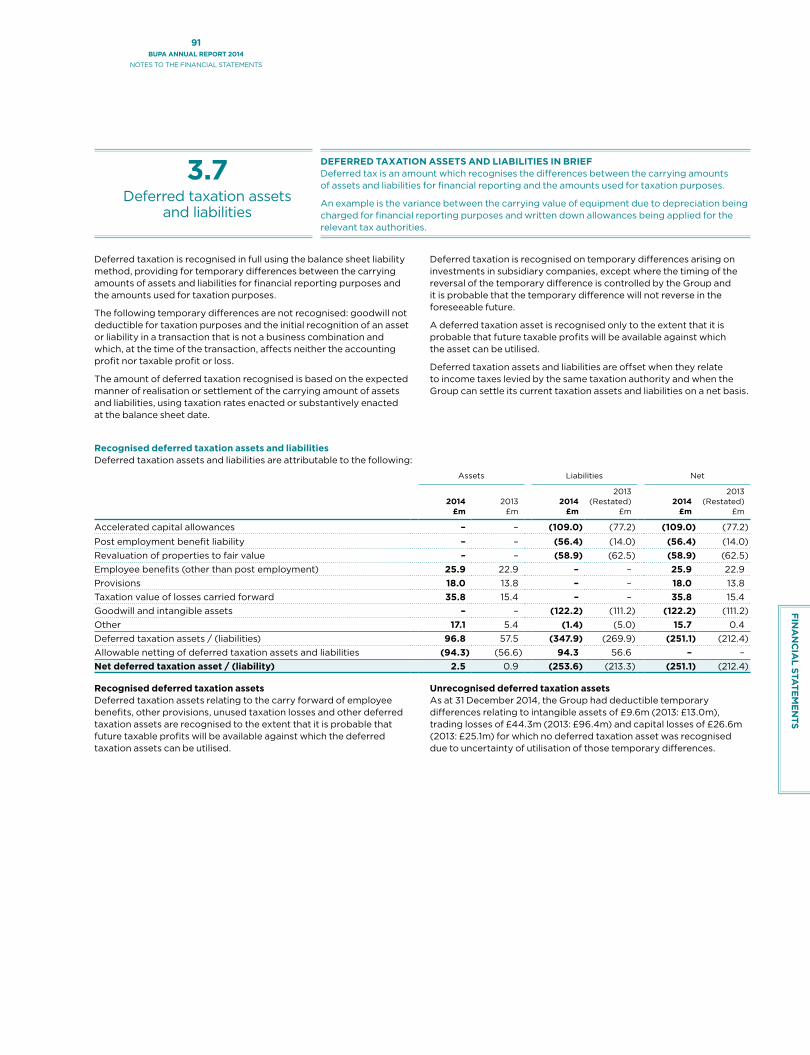
91BUPA ANNUAL REPORT 2014
NOTES TO THE FINANCIAL STATEMENTS
FIN
AN
CIA
L STAT
EM
EN
TS
3.7Deferred taxation assets
and liabilities
DEFERRED TAXATION ASSETS AND LIABILITIES IN BRIEFDeferred tax is an amount which recognises the differences between the carrying amounts of assets and liabilities for financial reporting and the amounts used for taxation purposes.
An example is the variance between the carrying value of equipment due to depreciation being charged for financial reporting purposes and written down allowances being applied for the relevant tax authorities.
Deferred taxation is recognised in full using the balance sheet liability method, providing for temporary differences between the carrying amounts of assets and liabilities for financial reporting purposes and the amounts used for taxation purposes.
The following temporary differences are not recognised: goodwill not deductible for taxation purposes and the initial recognition of an asset or liability in a transaction that is not a business combination and which, at the time of the transaction, affects neither the accounting profit nor taxable profit or loss.
The amount of deferred taxation recognised is based on the expected manner of realisation or settlement of the carrying amount of assets and liabilities, using taxation rates enacted or substantively enacted at the balance sheet date.
Deferred taxation is recognised on temporary differences arising on investments in subsidiary companies, except where the timing of the reversal of the temporary difference is controlled by the Group and it is probable that the temporary difference will not reverse in the foreseeable future.
A deferred taxation asset is recognised only to the extent that it is probable that future taxable profits will be available against which the asset can be utilised.
Deferred taxation assets and liabilities are offset when they relate to income taxes levied by the same taxation authority and when the Group can settle its current taxation assets and liabilities on a net basis.
Recognised deferred taxation assets and liabilitiesDeferred taxation assets and liabilities are attributable to the following:
Assets Liabilities Net
2014 £m
2013 £m
2014 £m
2013(Restated)
£m2014
£m
2013(Restated)
£m
Accelerated capital allowances – – (109.0) (77.2) (109.0) (77.2)
Post employment benefit liability – – (56.4) (14.0) (56.4) (14.0)Revaluation of properties to fair value – – (58.9) (62.5) (58.9) (62.5)Employee benefits (other than post employment) 25.9 22.9 – – 25.9 22.9Provisions 18.0 13.8 – – 18.0 13.8Taxation value of losses carried forward 35.8 15.4 – – 35.8 15.4Goodwill and intangible assets – – (122.2) (111.2) (122.2) (111.2)Other 17.1 5.4 (1.4) (5.0) 15.7 0.4Deferred taxation assets / (liabilities) 96.8 57.5 (347.9) (269.9) (251.1) (212.4)Allowable netting of deferred taxation assets and liabilities (94.3) (56.6) 94.3 56.6 – –Net deferred taxation asset / (liability) 2.5 0.9 (253.6) (213.3) (251.1) (212.4)
Recognised deferred taxation assetsDeferred taxation assets relating to the carry forward of employee benefits, other provisions, unused taxation losses and other deferred taxation assets are recognised to the extent that it is probable that future taxable profits will be available against which the deferred taxation assets can be utilised.
Unrecognised deferred taxation assetsAs at 31 December 2014, the Group had deductible temporary differences relating to intangible assets of £9.6m (2013: £13.0m), trading losses of £44.3m (2013: £96.4m) and capital losses of £26.6m (2013: £25.1m) for which no deferred taxation asset was recognised due to uncertainty of utilisation of those temporary differences.
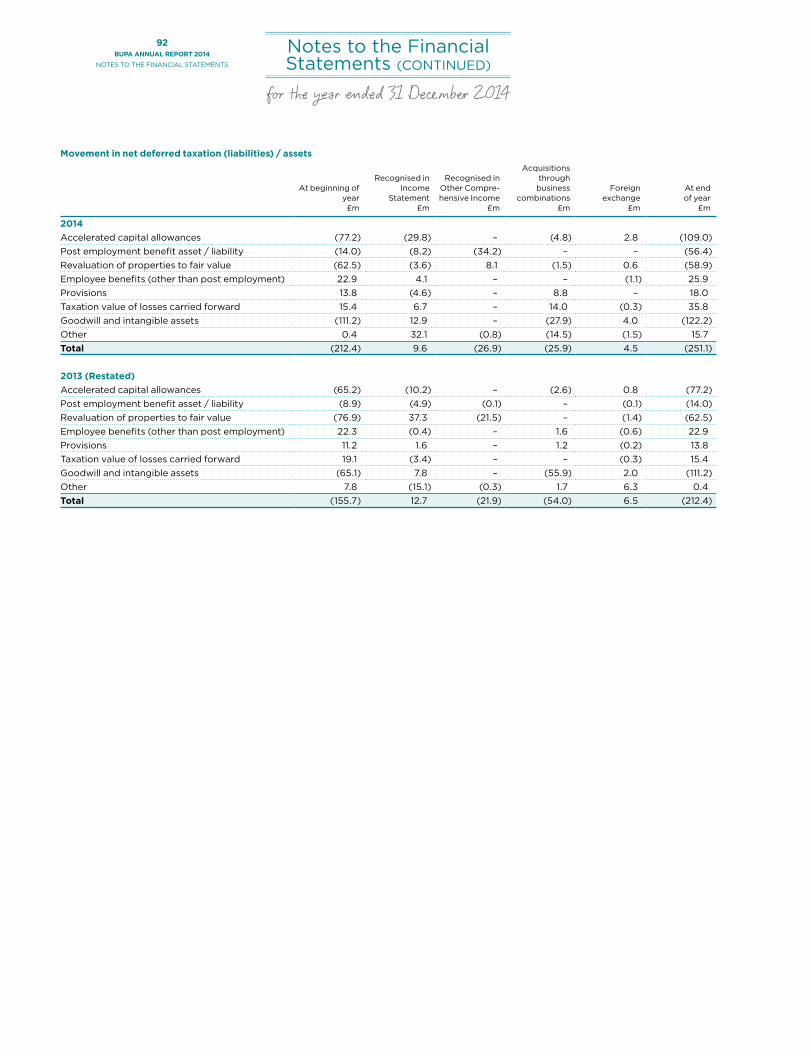
92BUPA ANNUAL REPORT 2014
NOTES TO THE FINANCIAL STATEMENTS
Notes to the Financial Statements (CONTINUED)
for the year ended 31 December 2014
Movement in net deferred taxation (liabilities) / assets
At beginning of year £m
Recognised in Income
Statement £m
Recognised in Other Compre- hensive Income
£m
Acquisitions through business
combinations £m
Foreign exchange
£m
At end of year
£m
2014Accelerated capital allowances (77.2) (29.8) – (4.8) 2.8 (109.0)Post employment benefit asset / liability (14.0) (8.2) (34.2) – – (56.4)Revaluation of properties to fair value (62.5) (3.6) 8.1 (1.5) 0.6 (58.9)Employee benefits (other than post employment) 22.9 4.1 – – (1.1) 25.9Provisions 13.8 (4.6) – 8.8 – 18.0Taxation value of losses carried forward 15.4 6.7 – 14.0 (0.3) 35.8Goodwill and intangible assets (111.2) 12.9 – (27.9) 4.0 (122.2)Other 0.4 32.1 (0.8) (14.5) (1.5) 15.7Total (212.4) 9.6 (26.9) (25.9) 4.5 (251.1)
2013 (Restated)Accelerated capital allowances (65.2) (10.2) – (2.6) 0.8 (77.2)Post employment benefit asset / liability (8.9) (4.9) (0.1) – (0.1) (14.0)Revaluation of properties to fair value (76.9) 37.3 (21.5) – (1.4) (62.5)Employee benefits (other than post employment) 22.3 (0.4) – 1.6 (0.6) 22.9Provisions 11.2 1.6 – 1.2 (0.2) 13.8Taxation value of losses carried forward 19.1 (3.4) – – (0.3) 15.4Goodwill and intangible assets (65.1) 7.8 – (55.9) 2.0 (111.2)Other 7.8 (15.1) (0.3) 1.7 6.3 0.4Total (155.7) 12.7 (21.9) (54.0) 6.5 (212.4)

93BUPA ANNUAL REPORT 2014
NOTES TO THE FINANCIAL STATEMENTS
FIN
AN
CIA
L STAT
EM
EN
TS
4.0Business combinations
and disposals
BUSINESS COMBINATIONS AND DISPOSALS IN BRIEFA business combination refers to the acquisition of a controlling interest in a business, which is further defined as an integrated set of activities and assets that is capable of being conducted and managed for the purpose of providing economic benefits to the owners. A disposal refers to the sale of a subsidiary.
(a) Acquisitions Business combinations are accounted for using the acquisition method. Identifiable assets and liabilities acquired and contingent liabilities assumed in a business combination are measured initially at their fair values at the acquisition date, irrespective of the extent of any non-controlling interest.
The identification and valuation of intangible assets arising on business combinations is subject to a degree of judgement. We engage independent third parties, including Deloitte, Ernst & Young and Knight Frank, to assist with the identification and valuation process. This is performed in accordance with the Group’s policies.
The excess of the cost of acquisition over the fair value of the Group’s share of the identifiable assets acquired is recorded as goodwill. Acquisition accounting must be completed within 12 months of the transaction date.
Costs related to the acquisition are expensed as incurred. A number of acquisitions were made during the year ended 31 December 2014, the details are as follows:
Date of acquisitionPercentage of holdings
Australia and New ZealandDental Centres – various VariousCargill – NZ Aged Care facility 10 June 2014 100%Spain and Latin America DomesticCruz Blanca Salud (Bupa Chile) 24 February 2014 56%Hospital Virgen del Mar 1 September 2014 100%Alcala and Daroca 15 December 2014 100%International Development MarketsScanlab Sp. z.o.o. 1 April 2014 100%Diagnostic Med Sp. z.o.o. 28 April 2014 100%Centrum Zdrowia Medycyna Sp. z.o.o. 2 June 2014 100%Centrum Medyczne Diagnostyka 1 July 2014 100%UKThe White Dental Company 31 January 2014 100%Barbican Dental Centre 3 February 2014 100%Cranbrook Dental Practice 28 November 2014 100%
* As part of the acquisition of Cruz Blanca Salud, the Group issued a put option to one of the existing shareholders which allows them to sell a further 17% to the Group, within the next five years.

94BUPA ANNUAL REPORT 2014
NOTES TO THE FINANCIAL STATEMENTS
Notes to the Financial Statements (CONTINUED)
for the year ended 31 December 2014
Cruz Blanca Salud Other
Carrying value at
acquisition £m
Fair value adjustments
£mFair value
£m
Carrying value at
acquisition £m
Fair value adjustments
£mFair value
£m
Intangible assets 110.4 97.3 207.7 0.1 – 0.1 Property, plant and equipment 127.3 5.8 133.1 6.7 – 6.7 Investment property 1.9 – 1.9 2.8 – 2.8 Inventories 2.5 – 2.5 0.2 – 0.2 Equity accounted investments 0.3 – 0.3 – – – Financial investments 43.0 – 43.0 – – – Trade and other receivables 43.0 – 43.0 3.0 – 3.0 Assets arising from insurance business 54.9 (45.2) 9.7 – – – Cash and cash equivalents 36.1 – 36.1 0.5 – 0.5 Other interest bearing liabilities (156.5) (1.8) (158.3) (1.1) – (1.1)Deferred tax liabilities (20.2) (5.7) (25.9) – – –Deferred income – – – (0.1) – (0.1)Trade and other payables (101.6) 7.1 (94.5) (3.8) – (3.8)Insurance liabilities (25.5) (19.2) (44.7) – – – Provisions for liabilities and charges – – – (0.1) – (0.1)
115.6 38.3 153.9 8.2 – 8.2
Net assets acquired 153.9 8.2Attributable to non-controlling interests 52.6 – Goodwill 158.2 30.4 Consideration 259.5 38.6
Consideration satisfied by:Cash 198.5 37.4 Fair value of put option consideration (17%) 59.9 – Deferred consideration 1.1 1.2 Total consideration paid 259.5 38.6
Purchase consideration settled in cash 198.5 37.4Cash acquired on acquisition 36.1 0.5 Net cash outflow on acquisition 162.4 36.9
On 24 February 2014 the Group acquired 56.0% of Cruz Blanca Salud. Cruz Blanca Salud is an integrated healthcare group in Chile, listed on the Bolsa de Santiago stock exchange, and represents Bupa's first domestic business in Latin America with 640,000 insurance customers, 27 outpatient clinics, three hospitals and Chile's largest clinical laboratory. It also has a small outpatient and diagnostic business in Peru.
The acquisition will enhance Bupa's strategic positioning in the health insurance and healthcare sectors in Chile and establish a base for operational expansion and positioning in other Latin American countries.
As part of the Cruz Blanca Salud transaction, Bupa has issued a put option which will allow the existing shareholders to sell an additional 17.3% shareholding to Bupa for a specified price, adjusted for inflation. The put option will be exercisable between 24 and 60 months from the date of the deal, unless certain other events (e.g. change of control) occur.
The existence of the call option, which is effective after the put option expires means that it is virtually certain that the option for the additional 17.3% shares will be exercised, transferring the risks and rewards to Bupa. Therefore the total consideration of £259.5m (CLP 243,768.1m) and the goodwill arising from the transaction of £158.2m have been calculated on an ownership basis of 73.3%.
The put option will be revalued at each balance sheet date, with changes in value recorded within financial income and expense in the Income Statement.
The goodwill represents a premium paid to acquire a leading integrated healthcare provider in Chile and reflects its strength and potential in the Latin American healthcare market.

95BUPA ANNUAL REPORT 2014
NOTES TO THE FINANCIAL STATEMENTS
FIN
AN
CIA
L STAT
EM
EN
TS
The table below details the intangible assets arising as a result of this transaction, and combined with the existing software intangible asset balance of £13.6m, comprise the total intangible asset value of £207.7m. The useful life of the assets from a valuation perspective incorporate the long established nature of the business and the local market conditions, whereas, the useful economic life, used for amortisation purposes encompasses a more pragmatic view, aligned with Group policy and precedent.
The below tables are translated at average rates for the period ended 31 December 2014. The following values have been translated using the spot rates at the date of acquisition; Net Assets £156.7m, Consideration £264.0m and Goodwill £160.8m.
Cruz Blanca Salud has contributed £531.3m revenue and £8.1m profit since the date of acquisition.
If the transaction had occurred on 1 January 2014, Cruz Blanca Salud would have contributed £629.2m revenue and £9.9m profit for the year ending 31 December 2014 excluding non-controlling interest.
Other acquisitions in the period include further investment into Poland, with the acquisition of seven diagnostic centres and four outpatient clinics; continued expansion of Bupa's dental presence in Australia and the UK and an aged care facility in New Zealand.
Transaction costs expensed in the year ended 31 December 2014, within Other Operating Expenses, are detailed below:
£m
Cruz Blanca Salud 3.3 Other 2.1 Total 5.4
£m
Useful life for valuation purposes
Useful life for amortisation
purposes
Brand and trademarks 156.4 Indefinite Indefinite Various established brandsCustomer relationships (Insurance) 31.5
11yrs
8yrs
Based on forecasted cash flows after expiration of existing contracts (multi-period excess-earnings method)
Customer relationships (Healthcare) 6.2
5yrs
4yrs
Based on forecasted cash flows after expiration of existing contracts (multi-period excess-earnings method)
Total 194.1
2013 acquisitions
A number of acquisitions were made during the year ended 31 December 2013; the material transactions are as follows:
Date of acquisitionPercentage of holdings
Australia and New ZealandInnovative Care – Care Services 8 February 2013 100%Dental Corporation 31 May 2013 100%
UKRichmond Care Villages 19 August 2013 100%
Spain and Latin America DomesticClínica Londres 19 June 2013 100%
International Development MarketsLUX MED 11 April 2013 100%Quality HealthCare 24 October 2013 100%
During the year ended 31 December 2014, the fair value accounting for LUX MED, Quality HealthCare, Dental Corporation and Richmond Care Villages were finalised and as a result, the reported Group Statement of Financial Position as at 31 December 2014 has been adjusted to reflect the final fair value adjustments on acquisition.
As part of the finalisation of the fair value acquisition balances, the value of the Dental Corporation group's 34.3% investment in Dental Corporation Canada has been revised. This has resulted in an uplift of £19.8m due to adjustments to customer relationships and Brands, and a corresponding reduction in goodwill.
Following the completion of the acquisition accounting for Quality HealthCare, £140.1m of additional intangible assets comprising of customer relationships (£101.2m) and brands (£38.9m) have been identified, net of the resulting deferred tax (£23.1m), reducing the goodwill arising from this transaction to £104.5m. See section (v) on page 98 for more details.
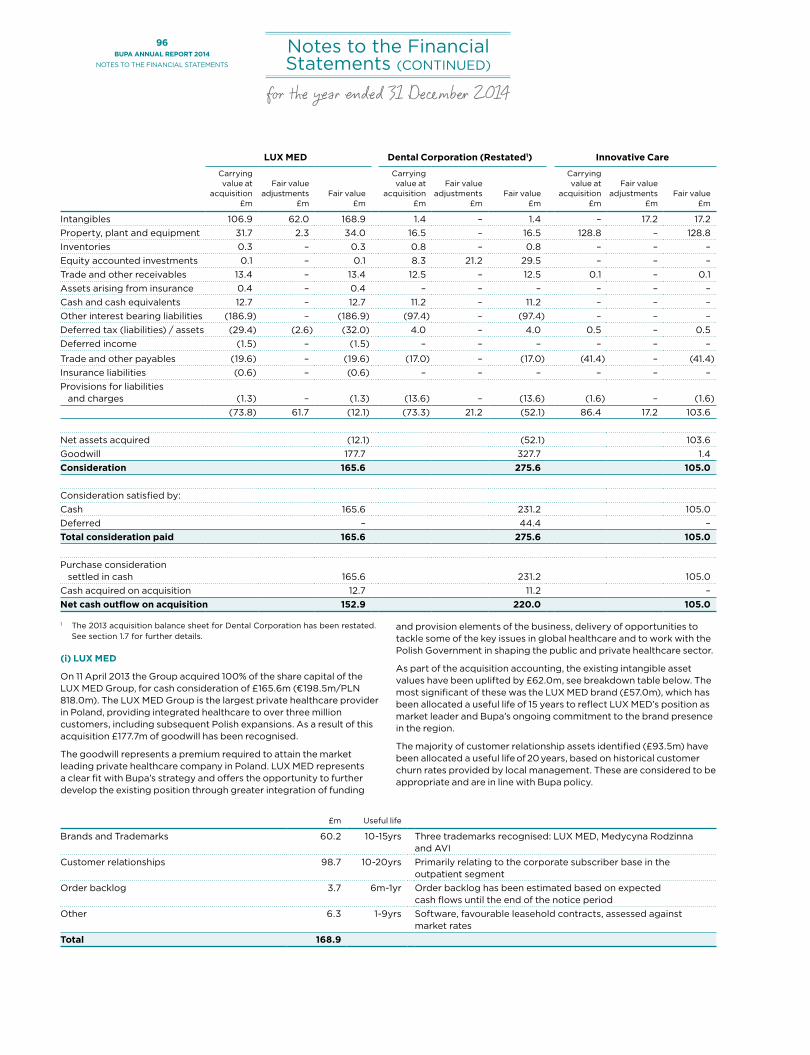
96BUPA ANNUAL REPORT 2014
NOTES TO THE FINANCIAL STATEMENTS
Notes to the Financial Statements (CONTINUED)
for the year ended 31 December 2014
LUX MED Dental Corporation (Restated1) Innovative Care
Carrying value at
acquisition £m
Fair value adjustments
£mFair value
£m
Carrying value at
acquisition £m
Fair value adjustments
£mFair value
£m
Carrying value at
acquisition £m
Fair value adjustments
£mFair value
£m
Intangibles 106.9 62.0 168.9 1.4 – 1.4 – 17.2 17.2Property, plant and equipment 31.7 2.3 34.0 16.5 – 16.5 128.8 – 128.8Inventories 0.3 – 0.3 0.8 – 0.8 – – –Equity accounted investments 0.1 – 0.1 8.3 21.2 29.5 – – –Trade and other receivables 13.4 – 13.4 12.5 – 12.5 0.1 – 0.1Assets arising from insurance 0.4 – 0.4 – – – – – –Cash and cash equivalents 12.7 – 12.7 11.2 – 11.2 – – –Other interest bearing liabilities (186.9) – (186.9) (97.4) – (97.4) – – –Deferred tax (liabilities) / assets (29.4) (2.6) (32.0) 4.0 – 4.0 0.5 – 0.5Deferred income (1.5) – (1.5) – – – – – –
Trade and other payables (19.6) – (19.6) (17.0) – (17.0) (41.4) – (41.4)Insurance liabilities (0.6) – (0.6) – – – – – –Provisions for liabilities
and charges (1.3) – (1.3) (13.6) – (13.6) (1.6) – (1.6)(73.8) 61.7 (12.1) (73.3) 21.2 (52.1) 86.4 17.2 103.6
Net assets acquired (12.1) (52.1) 103.6Goodwill 177.7 327.7 1.4Consideration 165.6 275.6 105.0
Consideration satisfied by:Cash 165.6 231.2 105.0Deferred – 44.4 –Total consideration paid 165.6 275.6 105.0
Purchase consideration settled in cash 165.6 231.2 105.0
Cash acquired on acquisition 12.7 11.2 –Net cash outflow on acquisition 152.9 220.0 105.0
1 The 2013 acquisition balance sheet for Dental Corporation has been restated. See section 1.7 for further details.
(i) LUX MED
On 11 April 2013 the Group acquired 100% of the share capital of the LUX MED Group, for cash consideration of £165.6m (€198.5m/PLN 818.0m). The LUX MED Group is the largest private healthcare provider in Poland, providing integrated healthcare to over three million customers, including subsequent Polish expansions. As a result of this acquisition £177.7m of goodwill has been recognised.
The goodwill represents a premium required to attain the market leading private healthcare company in Poland. LUX MED represents a clear fit with Bupa’s strategy and offers the opportunity to further develop the existing position through greater integration of funding
and provision elements of the business, delivery of opportunities to tackle some of the key issues in global healthcare and to work with the Polish Government in shaping the public and private healthcare sector.
As part of the acquisition accounting, the existing intangible asset values have been uplifted by £62.0m, see breakdown table below. The most significant of these was the LUX MED brand (£57.0m), which has been allocated a useful life of 15 years to reflect LUX MED’s position as market leader and Bupa’s ongoing commitment to the brand presence in the region.
The majority of customer relationship assets identified (£93.5m) have been allocated a useful life of 20 years, based on historical customer churn rates provided by local management. These are considered to be appropriate and are in line with Bupa policy.
£m Useful life
Brands and Trademarks 60.2 10-15yrs Three trademarks recognised: LUX MED, Medycyna Rodzinna and AVI
Customer relationships 98.7
10-20yrs
Primarily relating to the corporate subscriber base in the outpatient segment
Order backlog 3.7
6m-1yr Order backlog has been estimated based on expected cash flows until the end of the notice period
Other 6.3
1-9yrs Software, favourable leasehold contracts, assessed against market rates
Total 168.9
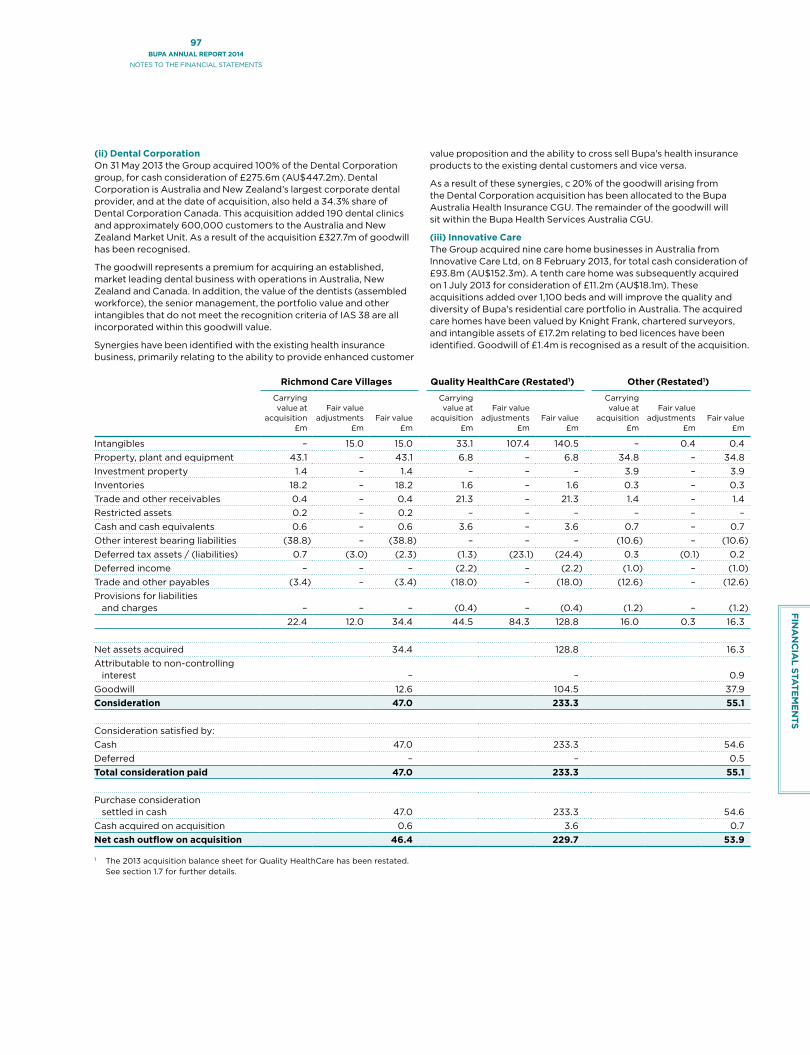
97BUPA ANNUAL REPORT 2014
NOTES TO THE FINANCIAL STATEMENTS
FIN
AN
CIA
L STAT
EM
EN
TS
(ii) Dental CorporationOn 31 May 2013 the Group acquired 100% of the Dental Corporation group, for cash consideration of £275.6m (AU$447.2m). Dental Corporation is Australia and New Zealand’s largest corporate dental provider, and at the date of acquisition, also held a 34.3% share of Dental Corporation Canada. This acquisition added 190 dental clinics and approximately 600,000 customers to the Australia and New Zealand Market Unit. As a result of the acquisition £327.7m of goodwill has been recognised.
The goodwill represents a premium for acquiring an established, market leading dental business with operations in Australia, New Zealand and Canada. In addition, the value of the dentists (assembled workforce), the senior management, the portfolio value and other intangibles that do not meet the recognition criteria of IAS 38 are all incorporated within this goodwill value.
Synergies have been identified with the existing health insurance business, primarily relating to the ability to provide enhanced customer
value proposition and the ability to cross sell Bupa's health insurance products to the existing dental customers and vice versa.
As a result of these synergies, c 20% of the goodwill arising from the Dental Corporation acquisition has been allocated to the Bupa Australia Health Insurance CGU. The remainder of the goodwill will sit within the Bupa Health Services Australia CGU.
(iii) Innovative CareThe Group acquired nine care home businesses in Australia from Innovative Care Ltd, on 8 February 2013, for total cash consideration of £93.8m (AU$152.3m). A tenth care home was subsequently acquired on 1 July 2013 for consideration of £11.2m (AU$18.1m). These acquisitions added over 1,100 beds and will improve the quality and diversity of Bupa's residential care portfolio in Australia. The acquired care homes have been valued by Knight Frank, chartered surveyors, and intangible assets of £17.2m relating to bed licences have been identified. Goodwill of £1.4m is recognised as a result of the acquisition.
Richmond Care Villages Quality HealthCare (Restated1) Other (Restated1)
Carrying value at
acquisition £m
Fair value adjustments
£mFair value
£m
Carrying value at
acquisition £m
Fair value adjustments
£mFair value
£m
Carrying value at
acquisition £m
Fair value adjustments
£mFair value
£m
Intangibles – 15.0 15.0 33.1 107.4 140.5 – 0.4 0.4Property, plant and equipment 43.1 – 43.1 6.8 – 6.8 34.8 – 34.8Investment property 1.4 – 1.4 – – – 3.9 – 3.9Inventories 18.2 – 18.2 1.6 – 1.6 0.3 – 0.3Trade and other receivables 0.4 – 0.4 21.3 – 21.3 1.4 – 1.4Restricted assets 0.2 – 0.2 – – – – – –Cash and cash equivalents 0.6 – 0.6 3.6 – 3.6 0.7 – 0.7Other interest bearing liabilities (38.8) – (38.8) – – – (10.6) – (10.6)Deferred tax assets / (liabilities) 0.7 (3.0) (2.3) (1.3) (23.1) (24.4) 0.3 (0.1) 0.2Deferred income – – – (2.2) – (2.2) (1.0) – (1.0)Trade and other payables (3.4) – (3.4) (18.0) – (18.0) (12.6) – (12.6)Provisions for liabilities
and charges – – – (0.4) – (0.4) (1.2) – (1.2)22.4 12.0 34.4 44.5 84.3 128.8 16.0 0.3 16.3
Net assets acquired 34.4 128.8 16.3Attributable to non-controlling
interest – – 0.9Goodwill 12.6 104.5 37.9Consideration 47.0 233.3 55.1
Consideration satisfied by:Cash 47.0 233.3 54.6Deferred – – 0.5Total consideration paid 47.0 233.3 55.1
Purchase consideration settled in cash 47.0 233.3 54.6
Cash acquired on acquisition 0.6 3.6 0.7Net cash outflow on acquisition 46.4 229.7 53.9
1 The 2013 acquisition balance sheet for Quality HealthCare has been restated. See section 1.7 for further details.

98BUPA ANNUAL REPORT 2014
NOTES TO THE FINANCIAL STATEMENTS
Notes to the Financial Statements (CONTINUED)
for the year ended 31 December 2014
(iv) Richmond Care VillagesOn 19 August 2013 the Group acquired 100% of Richmond Care Villages, for a total consideration of £47.0m. The transaction added five operating care villages and three development sites to the existing aged care portfolio in the UK, and will enable the UK Market Unit to offer a wider choice of care options.
The acquired properties and related assets have been independently valued by Knight Frank, chartered surveyors. As a result, intangible assets of £15.0m relating to existing customer contracts, including alignment fees, have been identified and goodwill of £12.6m has been recognised. This represents a portfolio premium for acquiring a retirement village, which includes a care home business and living apartments for a high proportion of self pay residents.
(v) Quality HealthCareOn 24 October 2013 the Group acquired 100% of Quality HealthCare, Hong Kong’s largest private clinic network; comprising 102 core centres and 530 affiliated centres in Hong Kong and Macau, for a total consideration of £233.3m (US$365.2/HK$2,831.2m). This acquisition will significantly enhance the Group’s healthcare offering in the region.
Goodwill of £104.5m has been recognised as part of this transaction, which represents the premium required to attain the leading private clinic network in Hong Kong. Significant synergies with the established private medical insurance business in Hong Kong will be realised in due course, and in addition, the principal business location and its existing ties with the mainland means that the Quality HealthCare business provides an ideal platform from which to then penetrate the Chinese healthcare market.
As part of the acquisition accounting the existing intangible asset values relating to brand, trademarks and customer relationships have been uplifted by £107.4m, details of which are provided below.
All intangible assets useful lives are in line with the Group's policy.
£m Useful life
Brand and trademarks 38.9 10yrs Quality HealthCare currently operate under a variety of trade names, the primary one being "Quality HealthCare Medical Services"
Customer relationships (Insurance) 62.3 15yrs Based on long-standing insurance customer relationships, excluding pre-existing relationships with Bupa Hong Kong
Customer relationships (Corporate) 38.9 14yrs Based on long-standing corporate customer relationshipsSoftware 0.4 VariousTotal 140.5
The above tables are translated at average rates for the period ended 31 December 2013. Set out below is the calculation of goodwill using the spot rates applicable at the respective date of acquisition.
No contingent liabilities have been identified in relation to any of the 2013 acquisitions.
LUX MED£m
Dental Corporation
£m
Innovative Care
£m
Richmond Care Villages
£m
Quality HealthCare
£m
Net assets acquired (12.4) (50.4) 108.9 34.4 131.3Goodwill 182.1 332.0 1.5 12.6 94.5Consideration 169.7 281.6 110.4 47.0 225.8
In the period from the respective dates of acquisition to the 31 December 2013, the total amount contributed to the Group’s revenue and profit by the acquired entities was:
Revenue £m
Profit £m
LUX MED 133.7 1.4Dental Corporation 104.2 8.6Innovative Care 47.1 4.7Richmond Care Villages 11.2 0.7Quality HealthCare 23.5 1.2Total 319.7 16.6
If all the acquisitions had occurred on 1 January 2013, the total amount contributed to the Group’s revenue and profit would have been:
Revenue £m
Profit £m
LUX MED 172.6 (6.1)Dental Corporation 173.6 9.1Innovative Care 55.0 5.5Richmond Care Villages 29.5 (14.3)Quality HealthCare 116.7 3.1Total 547.4 (2.7)
LUX MED incurred substantial financing costs on external debt, which was extinguished immediately prior to the acquisition by the Group.
The properties held by Richmond Care Villages were subject to a revaluation prior to the acquisition by the Group on 19 August 2013. As a result, a significant revaluation loss was recognised in the Income Statement, attributable to the prior owners.
Acquisition transaction costsTransaction costs expensed in the year ended 31 December 2013 within Other Operating Expenses are detailed below:
£m
LUX MED 2.3Dental Corporation 3.8Innovative Care 7.2
Richmond Care Villages 2.2
Quality HealthCare 3.5Other 9.6Total 28.6

99BUPA ANNUAL REPORT 2014
NOTES TO THE FINANCIAL STATEMENTS
FIN
AN
CIA
L STAT
EM
EN
TS
(b) DisposalsAt the date when the Group ceases to have control in an entity it is remeasured to its fair value, with the changes in carrying value recognised in the Income Statement. Any amounts relating to the entity that have previously been recognised in the statement of Comprehensive Income are reclassified to the Income Statement.
The net gain made on the sale of businesses is included within other income and charges in the consolidated Income Statement.
(i) Health Dialog Services CorporationOn 31 March 2014, the Group sold its 100% shareholding in Health Dialog Services Corporation, a health analytics business in the USA, which was part of the International Development Market Unit, for cash proceeds of £12.1m (US$20.0m).
Included in net assets divested are intangible assets of £2.7m, property plant and equipment of £1.7m, trade and other receivables of £3.0m, cash of £10.5m and trade and other payables of £12.5m.
The cash proceeds received, net of cash disposed of and disposal costs paid on 31 December 2014 resulted in a cash outflow of £0.6m.
Health Dialog Services
CorporationSurgichem
LimitedContinuing
Care
Sale proceeds 12.1 12.5 2.4Adjust for: Net assets divested (5.4) (2.6) – Transaction costs (2.2) (0.9) (0.5) Revaluation Reserve recycled upon disposal 5.8 – – Foreign Exchange Reserve recycled upon disposal 5.9 – –Net gain on disposal of business 16.2 9.0 1.9
(c) Subsequent EventsOn 29 January 2015, Bupa acquired a dental centre, Smiles Centre Limited, for a consideration of £1.1m. An exercise to determine the fair value of the net assets and contingent liabilities is under way.
(ii) Surgichem LimitedOn 22 August 2014, the Group sold its 100% shareholding in Surgichem Limited, a medical supply business in the United Kingdom, which was part of the UK Market Unit, for cash proceeds of £12.5m.
Included in net assets divested are inventories of £1.3m, property plant and equipment of £0.1m, trade and other receivables of £1.8m, cash of £0.1m and trade and other payables of £0.7m.
The cash proceeds received, net of cash disposed of and disposal costs paid on 31 December 2014 resulted in a cash inflow of £11.5m.
(iii) Continuing CareOn 19 September 2014, the Group sold its assets in Continuing Care, a complex care business in the United Kingdom, which was part of the UK Market Unit, for cash proceeds of £2.4m.
The cash proceeds received, net of cash disposed of and disposal costs paid on 31 December 2014 resulted in a cash inflow of £1.9m.
2013 disposalsThere were no disposals during 2013.

100BUPA ANNUAL REPORT 2014
NOTES TO THE FINANCIAL STATEMENTS
Notes to the Financial Statements (CONTINUED)
for the year ended 31 December 2014
4.1Equity accounted
investments
EQUITY ACCOUNTED INVESTMENTS IN BRIEFEquity accounted investments comprise associated companies and joint ventures.
Associated companies and joint ventures are accounted for using the equity method and are initially recognised at cost. The cost of the investment includes transaction costs.
Associated companies include those entities in which the Group has significant influence, but no ability for rights to direct the activities which determine the variable returns it receives from the entity. Joint ventures include those entities over the activities of which the Group has joint control, established by contractual agreement and requiring unanimous consent for strategic financial and operating decisions. The Group also has the rights to the net assets.
When the Group’s share of losses exceeds its interest in an equity accounted investment, the carrying amount of that interest (including any long-term interests that, in substance, form part of the Group’s net investment), is reduced to nil. In addition, the recognition of further losses is discontinued except to the extent that the Group has an obligation to make payments on behalf of the equity accounted investment.
AssociatesOn 30 June 2014, the Group disposed of its 38.5% shareholding in Dental Corporation Canada for a cash amount of £40.6m (AU$74.2m). The carrying value of the associate on the date of disposal was £38.6m, reflecting an adjustment to the fair value during the year of £19.8m. As a result of the sale, a £2.7m distribution was made to shareholders and an overall loss of £0.7m was recognised.
On 28 November 2014, the Group disposed of its 33.0% share in Joint Research Pty for a consideration of £0.1m. No profit was recognised on this sale as the company was disposed of at the carrying amount.
Distributions to shareholders are currently restricted by local regulatory requirements which are re-assessed on a regular basis.
Joint VenturesDuring 2014, a capital injection of £3.1m (2013: £4.6m) was made in Max Bupa Health Insurance Company Limited to maintain a shareholding of 26%. This investment has been classified as a joint venture as the Group is party to a shareholder agreement for the sharing of joint control. The Group has announced the intention to increase its shareholding in Max Bupa to 49% as soon as legislative approval is granted for an increase in the foreign direct investment limit for the insurance sector.
The consolidated financial statements include the Group’s share of income and expenses, and Other Comprehensive Income, after adjustments to align the accounting policies with those of the Group where materially different, from the date that significant influence or control commences until the date that significant influence or control ceases.
The carrying amount of equity accounted investments is £208.9m (2013: £232.6m). All equity accounted investments are included on a coterminous basis.
The Group’s principal equity accounted investments are:
Business activity
Share of issued share capital
Principally operates in
Country of incorporation
Bupa Arabia For Cooperative Insurance Company Associate Insurance 26.25% Saudi Arabia Saudi ArabiaHighway to Health, Inc Associate Insurance 49.00% USA USAMax Bupa Health Insurance Company Limited Joint Venture Insurance 26.00% India India

101BUPA ANNUAL REPORT 2014
NOTES TO THE FINANCIAL STATEMENTS
FIN
AN
CIA
L STAT
EM
EN
TS
(I) SUMMARISED FINANCIAL INFORMATION FOR ASSOCIATES AND JOINT VENTURESThe tables below provide summarised financial information for those associates and joint ventures that are material to the Group. The information disclosed reflects the amounts presented in the financial
statements of the relevant associates and joint ventures, and not the Group’s share of those amounts. They have been amended to reflect adjustments made by the Group when using the equity method, including fair value adjustments and modifications for differences in accounting policy.
Bupa Arabia Highway to Health Max Bupa
Summarised Statement of Financial Position2014
£m2013
£m2014
£m2013
£m2014
£m2013
£m
Cash and cash equivalents 319.9 53.7 24.4 20.8 2.7 3.2Other current assets 422.4 333.6 56.2 50.4 2.2 2.3Current assets 742.3 387.3 80.6 71.2 4.9 5.5Non-current assets 66.5 59.1 8.5 8.0 42.1 31.7Current liabilities (611.1) (318.4) (57.5) (50.6) (12.9) (10.1)Non-current liabilities (17.8) (10.2) (0.1) (0.1) (17.3) (13.6)Net assets 179.9 117.8 31.5 28.5 16.8 13.5
Reconciliation to carrying amountsOpening net assets 117.7 102.1 28.5 18.6 13.5 10.9Profit for the period 48.8 25.1 1.2 (3.2) (11.7) (11.9)Other Comprehensive Income 0.7 (1.4) – – – – Dividends paid (3.2) (6.8) – – – – Other reserve movements 15.9 (1.2) 1.8 13.1 15.0 14.5Closing net assets 179.9 117.8 31.5 28.5 16.8 13.5% ownership 26% 26% 49% 49% 26% 26%Reporting entity’s share 47.2 30.9 15.4 14.0 4.4 3.5Carrying amount 43.0 32.3 156.0 155.4 6.3 6.1
Max Bupa
Summarised Statement of Comprehensive Income2014
£m2013
£m
Revenue 30.1 22.8Interest income 3.2 2.6Depreciation and amortisation 1.3 1.1Loss for the period (11.7) (11.9)Total Comprehensive Income (11.7) (12.0)
(ii) Individually immaterial associatesIn addition to the interests in associates disclosed above, the Group also has interests in a number of individually immaterial associates that are accounted for using the equity method. The aggregate carrying amount of these associates is £3.6m (2013: £2.7m). The profit recognised during the year for these associates was £nil (2013: £nil).

102BUPA ANNUAL REPORT 2014
NOTES TO THE FINANCIAL STATEMENTS
Notes to the Financial Statements (CONTINUED)
for the year ended 31 December 2014
5.0Financial
Investments
FINANCIAL INVESTMENTS IN BRIEFThe Group generates cash from its underwriting, trading and financing activities and invests the surplus cash in financial investments. These include government bonds, corporate bonds, shares and variable yield securities.
All financial investments are initially recognised at fair value, which includes transaction costs for financial investments not classified at fair value through the profit or loss.
Financial Investments are derecognised when the rights to receive cash flows from the financial investments have expired or where the Group has transferred substantially all risks and rewards of ownership.
The Group has classified its financial investments into the following categories: at fair value through profit or loss, held to maturity, and loans and receivables. Management determines the classification at initial recognition.
The accounting policy for the impairment of financial investments is detailed in Section 3.0.1.
The analysis of derivatives is disclosed in section 5.2.
FINANCIAL INVESTMENTSFinancial investments are analysed as follows:
Carrying value 2014
£m
Fair Value 2014
£m
Carrying value 2013
£m
Fair Value 2013
£m
Non-currentDesignated at fair value through profit or loss
Debt securities – government bonds 125.2 125.2 18.4 18.4 Debt securities – corporate bonds 184.3 184.3 125.3 125.3 Shares and other variable yield securities 135.9 135.9 139.0 139.0
Held to maturityMedium-term notes 30.0 30.0 50.0 50.1 Debt securities – corporate bonds 5.3 5.3 5.7 5.7
Loans and receivablesDebt securities – corporate bonds 83.8 128.5 79.7 102.1 Deposits with credit institutions 169.5 174.0 337.4 341.1
Total non-current financial investments 734.0 783.2 755.5 781.7
CurrentDesignated at fair value through profit or loss
Debt securities – government bonds 23.1 23.1 13.5 13.5Debt securities – corporate bonds 0.6 0.6 0.8 0.8Shares and other variable yield securities 34.7 34.7 24.5 24.5Deposits with credit institutions 1.3 1.3 – –
Held to maturityMedium-term notes 50.1 50.1 150.2 150.2Debt securities – government bonds 1.9 1.9 – –Debt securities – corporate bonds 173.0 173.0 52.4 52.4
Loans and receivablesDeposits with credit institutions 968.0 968.8 1,063.2 1,061.7Other loans 1.3 1.3 1.2 1.2
Total current financial investments 1,254.0 1,254.8 1,305.8 1,304.3
Total financial investments 1,988.0 2,038.0 2,061.3 2,086.0
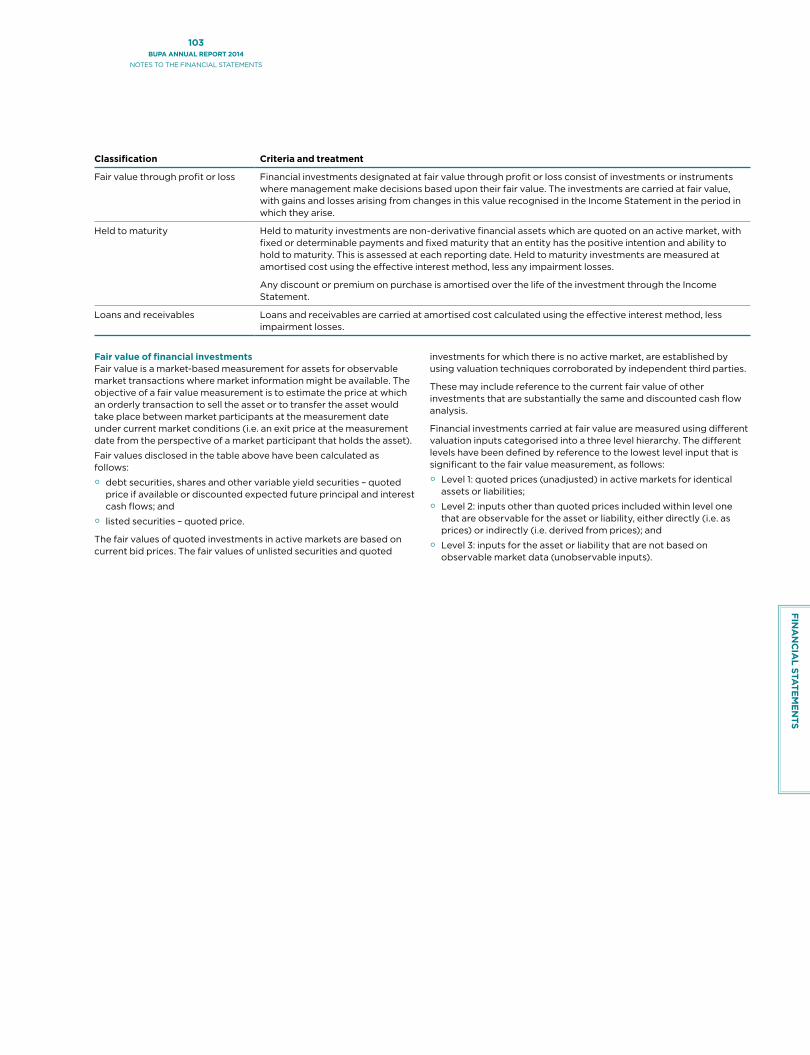
103BUPA ANNUAL REPORT 2014
NOTES TO THE FINANCIAL STATEMENTS
FIN
AN
CIA
L STAT
EM
EN
TS
Classification Criteria and treatment
Fair value through profit or loss Financial investments designated at fair value through profit or loss consist of investments or instruments where management make decisions based upon their fair value. The investments are carried at fair value, with gains and losses arising from changes in this value recognised in the Income Statement in the period in which they arise.
Held to maturity Held to maturity investments are non-derivative financial assets which are quoted on an active market, with fixed or determinable payments and fixed maturity that an entity has the positive intention and ability to hold to maturity. This is assessed at each reporting date. Held to maturity investments are measured at amortised cost using the effective interest method, less any impairment losses.
Any discount or premium on purchase is amortised over the life of the investment through the Income Statement.
Loans and receivables Loans and receivables are carried at amortised cost calculated using the effective interest method, less impairment losses.
Fair value of financial investmentsFair value is a market-based measurement for assets for observable market transactions where market information might be available. The objective of a fair value measurement is to estimate the price at which an orderly transaction to sell the asset or to transfer the asset would take place between market participants at the measurement date under current market conditions (i.e. an exit price at the measurement date from the perspective of a market participant that holds the asset).
Fair values disclosed in the table above have been calculated as follows:
°° debt securities, shares and other variable yield securities – quoted price if available or discounted expected future principal and interest cash flows; and
°° listed securities – quoted price.
The fair values of quoted investments in active markets are based on current bid prices. The fair values of unlisted securities and quoted
investments for which there is no active market, are established by using valuation techniques corroborated by independent third parties.
These may include reference to the current fair value of other investments that are substantially the same and discounted cash flow analysis.
Financial investments carried at fair value are measured using different valuation inputs categorised into a three level hierarchy. The different levels have been defined by reference to the lowest level input that is significant to the fair value measurement, as follows:
°° Level 1: quoted prices (unadjusted) in active markets for identical assets or liabilities;
°° Level 2: inputs other than quoted prices included within level one that are observable for the asset or liability, either directly (i.e. as prices) or indirectly (i.e. derived from prices); and
°° Level 3: inputs for the asset or liability that are not based on observable market data (unobservable inputs).

104BUPA ANNUAL REPORT 2014
NOTES TO THE FINANCIAL STATEMENTS
Notes to the Financial Statements (CONTINUED)
for the year ended 31 December 2014
An analysis of financial investments by valuation method is as follows:Non-current Current
Level 1 £m
Level 2 £m
Total Non- current
£mLevel 1
£mLevel 2
£m
Total Current
£m
2014Designated at fair value through profit and loss
Debt securities – government bonds 39.7 85.5 125.2 22.2 0.9 23.1 Debt securities – corporate bonds – 184.3 184.3 0.3 0.3 0.6 Shares and other variable yield securities 54.9 81.0 135.9 34.7 – 34.7 Deposits with credit institutions – – – – 1.3 1.3
Held to maturityMedium-term notes – 30.0 30.0 – 50.1 50.1 Debt securities – government bonds – – – 1.9 – 1.9 Debt securities – corporate bonds 5.3 – 5.3 40.9 132.1 173.0
Loans and receivables Debt securities – corporate bonds – 128.5 128.5 – – –
Deposits with credit institutions – 174.0 174.0 – 968.8 968.8
Other loans – – – – 1.3 1.3 Total 99.9 683.3 783.2 100.0 1,154.8 1,254.8
2013Designated at fair value through profit and loss
Debt securities – government bonds 17.6 0.8 18.4 13.5 – 13.5Debt securities – corporate bonds 20.0 105.3 125.3 0.8 – 0.8Shares and other variable yield securities 138.3 0.7 139.0 – 24.5 24.5
Held to maturityMedium-term notes – 50.1 50.1 – 150.2 150.2 Debt securities – corporate bonds 5.7 – 5.7 52.4 – 52.4
Loans and receivablesDebt securities – corporate bonds – 102.1 102.1 – – –Deposits with credit institution – 341.1 341.1 – 1,061.7 1,061.7 Other loans – – – – 1.2 1.2
Total 181.6 600.1 781.7 66.7 1,237.6 1,304.3
Currently the Group does not hold any level three financial instruments.
There have been no significant transfers between the valuation methods.
The Group uses a market interest curve as at the balance sheet date to discount financial instruments, borrowings and derivatives, where the fair value cannot otherwise be found from quoted market values. The range of interest rates used is as follows:
2014 %
2013 %
Sterling assets and liabilities 1.0-2.1 0.9–3.5Australian Dollar assets and liabilities 2.3-2.2 2.5–3.5Euro assets and liabilities 0.0-0.6 0.2–3.5US Dollar assets and liabilities 0.2-2.2 0.1–4.5

105BUPA ANNUAL REPORT 2014
NOTES TO THE FINANCIAL STATEMENTS
FIN
AN
CIA
L STAT
EM
EN
TS
5.1Borrowings
BORROWINGS IN BRIEFThe Group has various sources of funding including subordinated bonds, senior unsecured bonds, debenture stock and loans.
SUBORDINATED LIABILITIESSubordinated liabilities are stated at amortised cost using the effective interest method. The carrying value is adjusted for the gain or loss on hedged risk; changes in the fair value of derivatives that mitigate interest rate risk resulting from the fixed interest rate of the bonds are recognised in the Income Statement as an effective fair value hedge of this exposure.
The coupon payable on the bonds is recognised as a financial expense.
The Group holds callable subordinated perpetual guaranteed bonds with a corresponding fair value hedge. The amortised cost of these borrowings is adjusted for the fair value of the risk being hedged.
OTHER INTEREST BEARING LIABILITIESOther interest bearing liabilities consist of senior unsecured bonds, secured loans, debenture stock, bank and other loans and finance lease liabilities. These borrowings are recognised initially as proceeds receivable less attributable transaction costs, net of any discount on issue.
Subsequent to initial recognition, they are stated at amortised cost, net of accrued interest, with any difference between cost and redemption value being recognised in the Income Statement over the period of the borrowings on an effective interest basis.
2014 2013
Note
Non-current
£mCurrent
£mTotal
£m
Non-current
£mCurrent
£mTotal
£m
Subordinated liabilitiesCallable subordinated perpetual guaranteed bonds 330.0 5.9 335.9 330.0 5.9 335.9Fair value adjustment in respect of hedged interest rate risk 62.1 – 62.1 50.0 – 50.0Callable subordinated perpetual guaranteed bonds at
carrying value (a) 392.1 5.9 398.0 380.0 5.9 385.95.0% subordinated unguaranteed bonds due 2023 (b) 495.3 4.0 499.3 494.6 4.0 498.6Other subordinated debt due 2022 (c) 32.3 – 32.3 32.8 – 32.8Total subordinated liabilities 919.7 9.9 929.6 907.4 9.9 917.3Other interest bearing liabilitiesSenior unsecured bonds (d) 739.7 16.5 756.2 349.3 15.7 365.0
Secured loans (e) 222.5 15.7 238.2 234.0 4.1 238.1Bank loans (f) 109.9 27.6 137.5 176.9 225.3 402.2Debenture stock (g) – – – – 51.3 51.3Finance lease liabilities (h) 14.8 7.9 22.7 6.2 1.6 7.8Other loans – – – – 0.7 0.7Bank overdrafts (f) – – – – 0.1 0.1Total other interest bearing liabilities 1,086.9 67.7 1,154.6 766.4 298.8 1,065.2
Total borrowings 2,006.6 77.6 2,084.2 1,673.8 308.7 1,982.5
(a) Callable subordinated perpetual guaranteed bondsIn December 2004, Bupa Finance plc issued £330.0m of callable subordinated perpetual guaranteed bonds, which are guaranteed by Bupa Insurance Limited. Interest is payable on the bonds at 6.125% pa. The bonds have no fixed maturity date but a call option is exercisable by Bupa Finance plc to redeem the bonds on 16 September 2020. In the event of the winding up of Bupa Finance plc or Bupa Insurance Limited, the claims of the bondholders are subordinated to the claims of other creditors of these companies.
The total fair value of the callable subordinated perpetual guaranteed bonds, net of accrued interest, is £398.0m (2013: £385.9m). The valuation adjustment is the change in value arising from interest rate risk which is matched by the fair value of swap contracts in place to hedge this risk.
(b) 5.0% subordinated unguaranteed bonds due 2023On 25 April 2013, Bupa Finance plc issued £500.0m of unguaranteed subordinated bonds which mature on 25 April 2023. Interest is payable on the bonds at 5.0% per annum. In the event of winding up of Bupa Finance plc the claims of the bondholders are subordinated to the claims of other creditors of that company.
(c) Other subordinated debt due 2022Subordinated debt of £32.3m (€41.6m) issued by Torrejón Salud S.A. matures on 31 December 2022. Interest accrues on the debt at EURIBOR +6%. In the event of a winding up of Torrejón Salud S.A., the claims of the holder of the debt are subordinated to the claims of the senior creditors of that company.
(d) Senior unsecured bondsOn 2 July 2009, Bupa Finance plc issued £350.0m of 7.5% senior unsecured bonds. The bonds are repayable in July 2016. They are guaranteed by the Company and other Group subsidiary companies.
On 17 June 2014, Bupa Finance plc issued £350.0m of senior unsecured bonds, guaranteed by the Company, which mature on 17 June 2021. Interest payable on the bonds is 3.375% per annum.
On 30 June 2012, Cruz Blanca Salud S.A. issued UF1.6m (£40.3m) of inflation linked senior unsecured bonds which mature on 30 June 2033. Interest payable on the bonds is 4.23% per annum.

106BUPA ANNUAL REPORT 2014
NOTES TO THE FINANCIAL STATEMENTS
Notes to the Financial Statements (CONTINUED)
for the year ended 31 December 2014
(e) Secured loansThe secured loans balance of £238.2m (2013: £238.1m) relates to a loan issue by UK Care No 1 Limited. On 17 February 2000, UK Care No 1 Limited issued two classes of secured notes. A £175.0m Class A1 note is due to mature in 2029 and a £60.0m Class A2 note is due to mature in 2031. The A1 and A2 loan notes bear a fixed interest rate of 6.3% and 7.5% respectively. The loan notes are secured by fixed and floating charges over the assets and undertakings of UK Care No 1 Limited. The security includes UK Care No 1 Limited’s overriding lease interest, and the rental income receivable thereunder, held in a number of the Group’s care homes which eliminates on consolidation. The carrying value of the property, plant and equipment of these homes is £539.4m (2013: £541.2m).
(f) Bank loans and bank overdraftBank loans of £137.5m (2013: £402.2m) include a tri syndicated loan held in Especializada y Primaria L'Horta-Manises S.A. of £27.9m (2013: £31.6m) and a portfolio of loans held in Bupa Chile totalling £103.8m.
Bupa holds a £800.0m revolving credit facility, which was undrawn at 31 December 2014 with the exception of £6.4m of outstanding letters of credit for general business purposes.
FAIR VALUE OF BORROWINGS
(g) Debenture StockThe 11.8% debenture stock of £51.3m was repaid at par in 2014 as scheduled.
(h) Obligations under finance leases
Future minimum payments under finance leases are as follows:
Future minimum
lease payments
2014 £m
Present value of
minimum lease
payments 2014
£m
Future minimum
lease payments
2013 £m
Present value of
minimum lease
payments 2013
£m
Payable within one year 8.6 7.8 2.1 1.6Payable after one year
but within five years 14.6 13.0 5.6 4.7Payable after five years 2.4 1.9 2.1 1.5Total gross payments 25.6 9.8Less: finance charges
included above (2.9) (2.0)Total payments net of
finance charges 22.7 22.7 7.8 7.8
2014 2013
Level 1 £m
Level 2 £m
Total £m
Level 1 £m
Level 2 £m
Total £m
Subordinated liabilities 880.3 44.5 924.8 842.3 46.2 888.5
Senior unsecured bonds 748.1 47.3 795.4 397.3 – 397.3 Secured loan 324.7 – 324.7 287.0 – 287.0 Debenture stock – – – – 52.8 52.8Bank loans – 137.5 137.5 – 402.2 402.2 Finance lease liabilities – 22.7 22.7 – 7.8 7.8 Other loans – – – – 0.7 0.7 Bank overdrafts – – – – 0.1 0.1Total 1,953.1 252.0 2,205.1 1,526.6 509.8 2,036.4
Fair value is a market-based measurement for liabilities for observable market transactions where market information might be available. The objective of a fair value measurement is to estimate the price at which an orderly transaction to sell the asset or to transfer the liability would take place between market participants at the measurement date under current market conditions (i.e. an exit price at the measurement date from the perspective of a market participant that owes the liability). Fair values disclosed in the table below have been calculated as follows:
°° Subordinated liabilities – quoted price if available or discounted expected future principal and interest cash flows;
°° Senior unsecured bonds – quoted price;
°° Secured loans – quoted price;
°° Debenture stock – discounted expected future principal and interest cash flows.
The fair value of quoted liabilities in active markets are based on current bid prices. The fair values of financial liabilities for which there is no active market, are established using valuation techniques corroborated by independent third parties. These may include reference to the current fair value of other instruments that are substantially the same and discounted cash flow analysis.
Financial liabilities are categorised into a three level hierarchy, a description of the different levels is detailed in Section 5.0 along with the market interest rates used to discount financial liabilities, where the fair value cannot otherwise be found from quoted market values.
An analysis of the fair value of borrowings by valuation method is above.
Currently the Group does not hold any level three financial liabilities.

107BUPA ANNUAL REPORT 2014
NOTES TO THE FINANCIAL STATEMENTS
FIN
AN
CIA
L STAT
EM
EN
TS
5.2Derivatives
DERIVATIVES IN BRIEFThe Group uses derivative financial instruments to hedge its exposure to foreign exchange and interest rate risk.
Derivatives that have been purchased or issued as part of a hedge that subsequently does not qualify for hedge accounting are accounted for at fair value through profit and loss.
Derivative financial instruments are initially recognised and subsequently measured at fair value.
Fair values are obtained from market observable pricing information including interest rate yield curves. The value of foreign exchange forward contracts is established using listed market prices.
Fair values have been calculated for each type of derivative as follows:
°° Currency forward contracts and swaps – quoted prices in an inactive market at balance sheet date; and
°° Interest rate swaps bank or broker quotes.
All derivatives are disclosed as level two in the three level hierarchy.
2014
£m2013
£m
Derivative assetsNon-current* 62.1 50.0Current 6.9 12.9Total derivative assets 69.0 62.9
Derivative liabilities Non-current (73.1) (3.6)Current (3.8) (1.2)Total derivative liabilities (76.9) (4.8)
* See fair value hedges in Section 5.4.2.2.
5.3Capital
management
CAPITAL MANAGEMENT IN BRIEFBupa is a company limited by guarantee, has no shareholders and is funded through retained earnings and borrowings. The Group’s capital management objective is to maintain sufficient capital to protect its stakeholders while efficiently deploying capital to sustain ongoing business development.
The Group manages as capital the cumulative individual amount of the equity of all Group subsidiaries, exclusive of any non-controlling interests, and other inadmissible assets as discussed below. The Group has a £330.0m perpetual bond counted as Upper Tier 2 capital and a £500.0m dated bond which matures on 25 April 2023 which counts as Lower Tier 2 capital. Both of these bond issues are accounted for as debt in these financial statements. However, these are managed as though they were capital for regulatory purposes, as discussed below.
As a company limited by guarantee, Bupa has no shareholders or owners. All profits are therefore used to develop the Group’s businesses for the benefit of customers. Except for equity attributable to non-controlling interests, any equity in the Group is considered ‘equity attributable to Bupa’.
The Group’s capital management objective is to maintain sufficient capital to protect the interests of all of its customers, investors, regulators and trading partners while also efficiently deploying capital and managing risk to sustain ongoing business development.
The Group aims to operate within a targeted range for solvency, leverage and interest cover ratios designed to support an investment grade rating. The Bupa Group as a whole is not rated by any rating agency, although individual debt issues and various subsidiaries within the Group do have public ratings.
The UK’s Prudential Regulation Authority (PRA) classifies the whole of the Group as an insurance group. As such, the Group must maintain regulatory capital resources in excess of a collective capital requirement, imposed by the PRA through its Prudential Sourcebook (PSB), for Bupa to comply with the EU Insurance Groups Directive (IGD). When assessing the Group’s compliance with its capital requirement, the PSB requires that the Group values and credits towards its net asset position only those assets that meet certain criteria on admissibility. Group companies that are regulated are subject to similar regulatory restrictions within the jurisdictions in which they operate. The Group and its regulated subsidiaries complied with all externally imposed capital requirements during the current and prior year. Although they are not insurance businesses, the Group can, and does, recognise the book value of its care provision business net assets as capital resources.
It is the Board’s policy that the Group maintains capital resources significantly in excess of its capital requirements calculated both in accordance with the current regulatory regime and the expected requirements under Solvency II. Furthermore, all regulated entities within the Group’s corporate structure are required to meet any local minimum capital requirement imposed by local regulators at all times. The Group has a number of internal processes to ensure compliance with the Group’s capital requirements. These include requiring that significant future capital expenditure and growth initiatives be approved by the Board, either as standalone projects or as part of the budgeting and forecasting exercises. The Board reviews the regulatory capital position monthly and the Group’s Risk Committee reviews this annually and proposes the Group’s risk appetite for adoption by the Group’s Board. The Group’s Treasury and Investment Committee must approve any change to the financial investment strategy. Strategic developments and acquisitions over a de minimus amount affecting the Group’s capital require Board authorisation.
At 31 December 2014, Bupa’s IGD capital resources were £2.6bn (2013: £2.5bn), which was in excess of a capital requirement of £0.8bn (2013: £0.8bn). This represented a solvency coverage ratio of 319% (2013: 309%).
The Group Finance Department routinely reports to the Board the Group’s capital position, leverage and interest cover ratios as well as material constraints, risks or uncertainties about this position. The Group reports on any regulatory capital resources to local regulators and the PRA each year end.
In addition, the calculation of the return on capital employed and risk-adjusted profit are regularly reported to the Board.
The Group has in place internal debt and investment management arrangements that allow the assets supporting technical liabilities or any solvency capital to be efficiently managed in a centralised manner. The Group’s Treasury Department also maintains large external credit lines with several leading banks to ensure the liquidity of the Group as needed.
There have been no changes to the Group’s capital management objectives during the year.
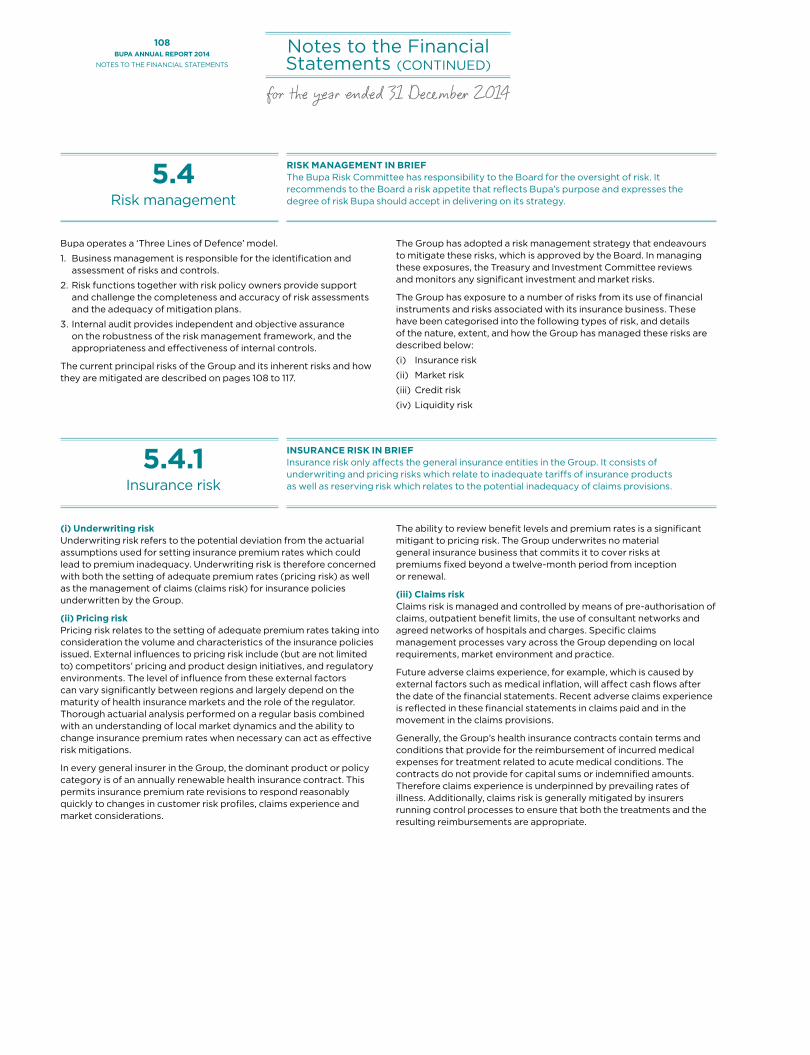
108BUPA ANNUAL REPORT 2014
NOTES TO THE FINANCIAL STATEMENTS
Notes to the Financial Statements (CONTINUED)
for the year ended 31 December 2014
5.4Risk management
RISK MANAGEMENT IN BRIEFThe Bupa Risk Committee has responsibility to the Board for the oversight of risk. It recommends to the Board a risk appetite that reflects Bupa’s purpose and expresses the degree of risk Bupa should accept in delivering on its strategy.
Bupa operates a ‘Three Lines of Defence’ model.
1. Business management is responsible for the identification and assessment of risks and controls.
2. Risk functions together with risk policy owners provide support and challenge the completeness and accuracy of risk assessments and the adequacy of mitigation plans.
3. Internal audit provides independent and objective assurance on the robustness of the risk management framework, and the appropriateness and effectiveness of internal controls.
The current principal risks of the Group and its inherent risks and how they are mitigated are described on pages 108 to 117.
The Group has adopted a risk management strategy that endeavours to mitigate these risks, which is approved by the Board. In managing these exposures, the Treasury and Investment Committee reviews and monitors any significant investment and market risks.
The Group has exposure to a number of risks from its use of financial instruments and risks associated with its insurance business. These have been categorised into the following types of risk, and details of the nature, extent, and how the Group has managed these risks are described below:
(i) Insurance risk
(ii) Market risk
(iii) Credit risk
(iv) Liquidity risk
5.4.1Insurance risk
INSURANCE RISK IN BRIEFInsurance risk only affects the general insurance entities in the Group. It consists of underwriting and pricing risks which relate to inadequate tariffs of insurance products as well as reserving risk which relates to the potential inadequacy of claims provisions.
(i) Underwriting riskUnderwriting risk refers to the potential deviation from the actuarial assumptions used for setting insurance premium rates which could lead to premium inadequacy. Underwriting risk is therefore concerned with both the setting of adequate premium rates (pricing risk) as well as the management of claims (claims risk) for insurance policies underwritten by the Group.
(ii) Pricing riskPricing risk relates to the setting of adequate premium rates taking into consideration the volume and characteristics of the insurance policies issued. External influences to pricing risk include (but are not limited to) competitors’ pricing and product design initiatives, and regulatory environments. The level of influence from these external factors can vary significantly between regions and largely depend on the maturity of health insurance markets and the role of the regulator. Thorough actuarial analysis performed on a regular basis combined with an understanding of local market dynamics and the ability to change insurance premium rates when necessary can act as effective risk mitigations.
In every general insurer in the Group, the dominant product or policy category is of an annually renewable health insurance contract. This permits insurance premium rate revisions to respond reasonably quickly to changes in customer risk profiles, claims experience and market considerations.
The ability to review benefit levels and premium rates is a significant mitigant to pricing risk. The Group underwrites no material general insurance business that commits it to cover risks at premiums fixed beyond a twelve-month period from inception or renewal.
(iii) Claims riskClaims risk is managed and controlled by means of pre-authorisation of claims, outpatient benefit limits, the use of consultant networks and agreed networks of hospitals and charges. Specific claims management processes vary across the Group depending on local requirements, market environment and practice.
Future adverse claims experience, for example, which is caused by external factors such as medical inflation, will affect cash flows after the date of the financial statements. Recent adverse claims experience is reflected in these financial statements in claims paid and in the movement in the claims provisions.
Generally, the Group’s health insurance contracts contain terms and conditions that provide for the reimbursement of incurred medical expenses for treatment related to acute medical conditions. The contracts do not provide for capital sums or indemnified amounts. Therefore claims experience is underpinned by prevailing rates of illness. Additionally, claims risk is generally mitigated by insurers running control processes to ensure that both the treatments and the resulting reimbursements are appropriate.

109BUPA ANNUAL REPORT 2014
NOTES TO THE FINANCIAL STATEMENTS
FIN
AN
CIA
L STAT
EM
EN
TS
(iv) Reserving riskReserving risk is the risk that provisions made for claims prove to be insufficient in light of later events and claims experience. There is a relatively low exposure to reserving risk compared to underwriting risk due to the very short-term nature of our claims development patterns. The short-term nature of the Group’s general insurance contracts means that movements in claims development assumptions are generally not significant. The development claims settlement patterns are kept under constant review to maintain the validity of the assumptions and hence, the validity of the estimation of recognised general insurance liabilities.
The amount of claims provision at any given time that relates to potential claims payments that have not been resolved within one year is relatively small in the context of the Group. Also, of the small provisions that do relate to longer than one year, it is possible to predict with reasonable confidence the outstanding amounts.
(v) Other risks related to underwriting health insurance businessClaims provisions are not discounted and their short-term nature means that changes in interest rates have no impact on reserving risk. In addition, the future premium income and claims outflows of health insurance premium liabilities are largely unaffected by changes in interest rates. However, changes to inflationary factors such as wage inflation and medical provider cost inflation affect the financial soundness of health insurance businesses.
None of the Group’s general insurance contracts contain embedded derivatives so the contracts do not give rise to interest rate risk.
The Group is exposed to foreign currency risk through some of the insurance liabilities which are settled in a local currency. Where possible these liabilities are matched to assets in the relevant currency to hedge this exposure.
All of the Group’s general insurance activities are single line health portfolios. Even though only one line of business is involved, the Group does not have significant concentration of insurance risk for the following reasons:
°° broad geographical diversity across several markets – UK, Spain, Australia, Latin America, the Middle East, Hong Kong and Thailand;
°° product diversity between domestic and expatriate, and individual and corporate health insurance; and
°° a variety of claims type exposures across diverse medical providers; consultants, nursing staff, clinics, individual hospitals and hospital groups.
The Group as a whole, and its principal general insurance entities, are well diversified. Only in selected circumstances does the Group use reinsurance. The reinsurance used does not give rise to a material counterparty default credit risk exposure to the Group.
5.4.2Market risk
MARKET RISK IN BRIEFMarket risk is the risk of adverse movements in market prices related to the Group’s investments and borrowings. Such adverse movements include increased interest rates on borrowings, a fall in the share price of an investment or adverse currency fluctuations.
Market risk is the risk of adverse financial impact due to changes in fair values or future cash flows of financial instruments from fluctuations in interest rates, foreign exchange rates, commodity prices, credit spreads and equity prices. The focus of the Group’s long-term financial strategy is to facilitate growth without undue balance sheet risk. The Treasury and Investment Committee is responsible for the management of the Group’s liquidity position and short-term borrowings, together with the risks arising on interest rates and foreign currencies and to protect the security of the Group’s financial assets.
In order to reduce the risk of assets being insufficient to meet future policyholder obligations, the Group actively manages assets using an approach that balances duration, quality, diversification, liquidity and investment return.
The Group manages price risk by ensuring that the majority of its cash and investments are held with highly rated credit institutions.
Where the Group has moved away from straight money market investments and invested in a limited portfolio of return seeking assets (principally bonds), the Group uses a value at risk analysis (VaR) to quantify risk, taking account of asset volatility and correlation between asset classes. This portfolio is held in the UK and Australian insurance companies and was £373.3m at 31 December 2014 (2013: £250.2m) and the 1 year VaR figure attributable to the portfolio is £27.3m at 31 December 2014 (2013: £23.5m).
5.4.2.1 FOREIGN EXCHANGE RISKThe Group is exposed to foreign exchange risks arising from commercial transactions and from recognising assets, liabilities and investments in overseas operations. The Group is exposed to both transaction and translation risk. The former is the risk that a company’s cash flows and realised profits may be impacted by movements in foreign exchange rates. The latter arises from translating the financial statements of a foreign operation into the Group’s functional currency.

110BUPA ANNUAL REPORT 2014
NOTES TO THE FINANCIAL STATEMENTS
Notes to the Financial Statements (CONTINUED)
for the year ended 31 December 2014
The results and financial position of the Group’s foreign entities that do not have a functional currency of Sterling are translated into Sterling as follows:
°° assets and liabilities at the exchange rate at the balance sheet date;
°° income and expenses at average rates for the period.
All foreign exchange differences arising on translation are recognised initially in the Statement of Comprehensive Income, and only in the Income Statement in the period in which the entity is eventually disposed.
The following significant exchange rates applied during the year:
Average rate Closing rate
2014 2013 2014 2013
Australian Dollar 1.8265 1.6228 1.9082 1.8557Chilean Peso 939.6963 – 944.4301 –Euro 1.2411 1.1775 1.2877 1.2014Hong Kong Dollar 12.7759 12.1362 12.0805 12.8456New Zealand Dollar 1.9852 1.9084 1.9989 2.0110
Polish Zloty 5.1929 4.9412 5.5166 4.9924US Dollar 1.6475 1.5647 1.5581 1.6566
In the consolidated financial statements, where a loan between Group entities results in an exchange gain or loss, then it is recognised in the Statement of Comprehensive Income to the extent that it relates to the Group’s net investment in overseas operations.
Bupa has exposure to foreign exchange risk arising from its overseas operations. Key exposures are to the Australian Dollar, Euro, Polish Zloty, New Zealand Dollar, Hong Kong Dollar, Chilean Peso, US Dollar, Danish Krone, Thai Baht, Mexican Peso, Saudi Arabian Riyal and Brazilian Real. Other currencies comprise Bahraini Dinar, Chinese Yuan, Bolivian Boliviano, Singapore Dollar, Swiss Franc and Egyptian Pound:
Net currency exposure
£m
Currency forward
contracts £m
Net currencyexposureincluding
hedges£m
2014
Australian Dollar 2,165.8 (84.7) 2,081.1Euro 657.5 (336.5) 321.0Polish Zloty 362.5 – 362.5New Zealand Dollar 350.2 – 350.2
Hong Kong Dollar 267.1 – 267.1
Chilean Peso 241.8 – 241.8US Dollar 151.4 (133.8) 17.6Danish Krone 21.1 (9.0) 12.1Thai Baht 14.6 – 14.6Mexican Peso 1.4 12.8 14.2Saudi Arabian Riyal – (0.9) (0.9)Brazilian Real – 9.2 9.2Other 10.4 – 10.4Total foreign currency
denominated net assets 4,243.8 (542.9) 3,700.9Percentage of Group net assets 77.6% 67.7%
Net currency exposure
£m
Currency forward
contracts £m
Net currencyexposureincluding
hedges£m
2013
Australian Dollar 2,183.1 (129.9) 2,053.2Euro 676.2 (367.6) 308.6Polish Zloty 389.2 – 389.2New Zealand Dollar 303.3 – 303.3
Hong Kong Dollar 245.0 – 245.0US Dollar 147.9 (195.8) (47.9)Danish Krone 11.8 – 11.8Thai Baht 12.7 – 12.7Mexican Peso 0.3 17.2 17.5Brazilian Real – 12.9 12.9Other 18.1 – 18.1Total foreign currency
denominated net assets 3,987.6 (663.2) 3,324.4Percentage of Group net assets 81.9% 68.3%
Certain forward currency contracts are entered into to hedge net monetary asset exposure and future cash flows of the Group, and do not form part of designated hedging arrangements.
Foreign currency transactions in the Group’s subsidiary companies are measured using the functional currency of the subsidiary company, which is based on the primary economic environment in which the subsidiary operates. The transactions are translated into the functional currency at the exchange rate ruling at the date of the transaction.
Monetary assets and liabilities denominated in foreign currencies are translated into the functional currency at the exchange rate ruling at the balance sheet date; the resulting foreign exchange gain or loss is recognised in operating expenses, except where the gain or loss arises on financial assets or liabilities, when it is presented in financial income or financial expense as appropriate.
Non-monetary assets and liabilities, denominated in a foreign currency at historical cost are translated using the exchange rate at the date of the transaction; therefore no exchange differences arise. Non-monetary assets and liabilities denominated in a foreign currency at fair value are translated using the exchange rate ruling at the date that the fair value was determined. Foreign exchange differences that arise on retranslation are recognised in operating expenses.
Transactional exposures arise primarily in Bupa Global's businesses as a result of differences between the currency of local revenues and costs. Programmes are in place to hedge a significant proportion of forecast cash flows in those businesses through forward foreign exchange contracts for the coming year. These contracts are not designated hedges. The remaining currency exposures are deemed to be acceptable but are kept under review by management.

111BUPA ANNUAL REPORT 2014
NOTES TO THE FINANCIAL STATEMENTS
FIN
AN
CIA
L STAT
EM
EN
TS
The impact of a hypothetical strengthening / (weakening) of Sterling against the currencies below, with all other variables constant, would have increased / (decreased) equity and profit by the amounts shown below:
Strengthening 10% Weakening 10%
Gains / (losses) included in Income
Statement £m
Gains / (losses) included in Equity
£m
Gains / (losses) included in Income
Statement £m
Gains / (losses) included in Equity
£m
2014Australian Dollar (28.9) (189.2) 35.4 231.2Euro (7.8) (29.2) 9.5 35.7US Dollar (7.0) (1.6) 8.5 2.0New Zealand Dollar (1.8) (31.8) 2.2 38.9Polish Zloty (0.8) (33.0) 1.0 40.3Chilean Peso (0.4) (22.0) 0.5 26.9Hong Kong Dollar (0.1) (24.3) 0.1 29.7Other (0.5) (5.5) 0.7 6.7Total sensitivity (47.3) (336.6) 57.9 411.4
2013Australian Dollar (27.5) (186.7) 33.6 228.1Euro (9.5) (28.1) 11.7 34.3US Dollar (6.4) 4.4 7.8 (5.3)New Zealand Dollar (2.0) (27.6) 2.4 33.7Polish Zloty 1.3 (35.4) (1.6) 43.2Hong Kong Dollar – (22.3) – 27.2Other (1.5) (6.5) 1.8 8.2Total sensitivity (45.6) (302.2) 55.7 369.4
FOREIGN EXCHANGE HEDGING ACTIVITIESThe Group manages its exposure to foreign exchange risk by entering into hedging transactions using derivative financial instruments. The Group applies fair value, cash flow and net investment hedge accounting. Fair value hedge accounting was discontinued from 1 January 2013.
The hedging relationship between a hedging instrument and a hedged item is formally documented. Documentation includes the risk management objectives and the strategy in undertaking the hedge transaction.
(a) Fair value hedgesWhere a derivative financial instrument hedges the change in fair value of a recognised asset or liability or an unrecognised firm commitment, any gain or loss on remeasurement of the hedging instrument at fair value is recognised in the Income Statement. The hedged item is fair valued for the hedged risk with any adjustment being recognised in the Income Statement.
The Group holds foreign currency forward contracts that hedge the Group’s currency exposure, which arises from holding US Dollar and Euro denominated financial investments classed as shares and other variable yield securities and corporate bonds.
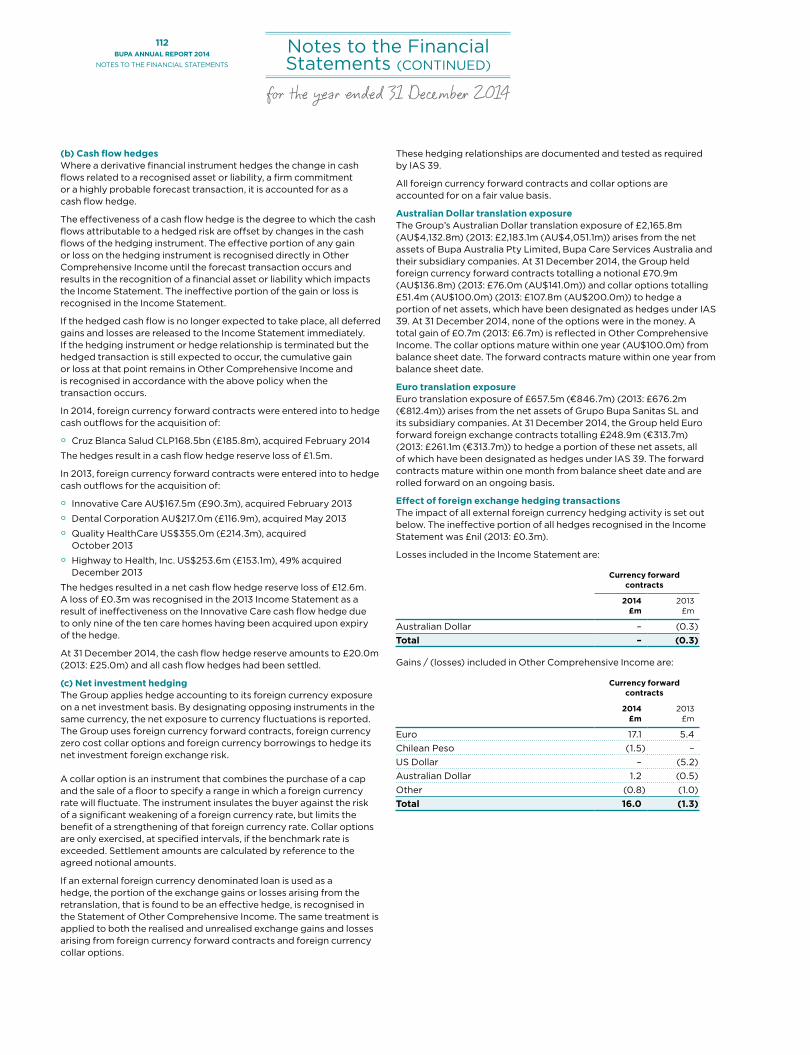
112BUPA ANNUAL REPORT 2014
NOTES TO THE FINANCIAL STATEMENTS
Notes to the Financial Statements (CONTINUED)
for the year ended 31 December 2014
(b) Cash flow hedgesWhere a derivative financial instrument hedges the change in cash flows related to a recognised asset or liability, a firm commitment or a highly probable forecast transaction, it is accounted for as a cash flow hedge.
The effectiveness of a cash flow hedge is the degree to which the cash flows attributable to a hedged risk are offset by changes in the cash flows of the hedging instrument. The effective portion of any gain or loss on the hedging instrument is recognised directly in Other Comprehensive Income until the forecast transaction occurs and results in the recognition of a financial asset or liability which impacts the Income Statement. The ineffective portion of the gain or loss is recognised in the Income Statement.
If the hedged cash flow is no longer expected to take place, all deferred gains and losses are released to the Income Statement immediately. If the hedging instrument or hedge relationship is terminated but the hedged transaction is still expected to occur, the cumulative gain or loss at that point remains in Other Comprehensive Income and is recognised in accordance with the above policy when the transaction occurs.
In 2014, foreign currency forward contracts were entered into to hedge cash outflows for the acquisition of:
°° Cruz Blanca Salud CLP168.5bn (£185.8m), acquired February 2014
The hedges result in a cash flow hedge reserve loss of £1.5m.
In 2013, foreign currency forward contracts were entered into to hedge cash outflows for the acquisition of:
°° Innovative Care AU$167.5m (£90.3m), acquired February 2013
°° Dental Corporation AU$217.0m (£116.9m), acquired May 2013
°° Quality HealthCare US$355.0m (£214.3m), acquired October 2013
°° Highway to Health, Inc. US$253.6m (£153.1m), 49% acquired December 2013
The hedges resulted in a net cash flow hedge reserve loss of £12.6m. A loss of £0.3m was recognised in the 2013 Income Statement as a result of ineffectiveness on the Innovative Care cash flow hedge due to only nine of the ten care homes having been acquired upon expiry of the hedge.
At 31 December 2014, the cash flow hedge reserve amounts to £20.0m (2013: £25.0m) and all cash flow hedges had been settled.
(c) Net investment hedgingThe Group applies hedge accounting to its foreign currency exposure on a net investment basis. By designating opposing instruments in the same currency, the net exposure to currency fluctuations is reported. The Group uses foreign currency forward contracts, foreign currency zero cost collar options and foreign currency borrowings to hedge its net investment foreign exchange risk.
A collar option is an instrument that combines the purchase of a cap and the sale of a floor to specify a range in which a foreign currency rate will fluctuate. The instrument insulates the buyer against the risk of a significant weakening of a foreign currency rate, but limits the benefit of a strengthening of that foreign currency rate. Collar options are only exercised, at specified intervals, if the benchmark rate is exceeded. Settlement amounts are calculated by reference to the agreed notional amounts.
If an external foreign currency denominated loan is used as a hedge, the portion of the exchange gains or losses arising from the retranslation, that is found to be an effective hedge, is recognised in the Statement of Other Comprehensive Income. The same treatment is applied to both the realised and unrealised exchange gains and losses arising from foreign currency forward contracts and foreign currency collar options.
These hedging relationships are documented and tested as required by IAS 39.
All foreign currency forward contracts and collar options are accounted for on a fair value basis.
Australian Dollar translation exposureThe Group’s Australian Dollar translation exposure of £2,165.8m (AU$4,132.8m) (2013: £2,183.1m (AU$4,051.1m)) arises from the net assets of Bupa Australia Pty Limited, Bupa Care Services Australia and their subsidiary companies. At 31 December 2014, the Group held foreign currency forward contracts totalling a notional £70.9m (AU$136.8m) (2013: £76.0m (AU$141.0m)) and collar options totalling £51.4m (AU$100.0m) (2013: £107.8m (AU$200.0m)) to hedge a portion of net assets, which have been designated as hedges under IAS 39. At 31 December 2014, none of the options were in the money. A total gain of £0.7m (2013: £6.7m) is reflected in Other Comprehensive Income. The collar options mature within one year (AU$100.0m) from balance sheet date. The forward contracts mature within one year from balance sheet date.
Euro translation exposureEuro translation exposure of £657.5m (€846.7m) (2013: £676.2m (€812.4m)) arises from the net assets of Grupo Bupa Sanitas SL and its subsidiary companies. At 31 December 2014, the Group held Euro forward foreign exchange contracts totalling £248.9m (€313.7m) (2013: £261.1m (€313.7m)) to hedge a portion of these net assets, all of which have been designated as hedges under IAS 39. The forward contracts mature within one month from balance sheet date and are rolled forward on an ongoing basis.
Effect of foreign exchange hedging transactionsThe impact of all external foreign currency hedging activity is set out below. The ineffective portion of all hedges recognised in the Income Statement was £nil (2013: £0.3m).
Losses included in the Income Statement are:
Currency forward contracts
2014£m
2013£m
Australian Dollar – (0.3)Total – (0.3)
Gains / (losses) included in Other Comprehensive Income are:
Currency forward contracts
2014£m
2013£m
Euro 17.1 5.4Chilean Peso (1.5) – US Dollar – (5.2)Australian Dollar 1.2 (0.5)Other (0.8) (1.0)Total 16.0 (1.3)

113BUPA ANNUAL REPORT 2014
NOTES TO THE FINANCIAL STATEMENTS
FIN
AN
CIA
L STAT
EM
EN
TS
5.4.2.2 INTEREST RATE RISKInterest rate risk is the risk that the fair value or future cash flows of a financial instrument will fluctuate because of changes in market interest rates.
The Group is exposed to interest rate risk arising from fluctuations in market rates. This affects both the return on floating rate assets, the cost of floating rate liabilities and the balance sheet value of its investment in fixed rate bonds. Floating rate assets represent a natural hedge for floating rate liabilities.
The net balance on which the Group is exposed as at 31 December 2014 was £1,232.9m (2013: £1,965.7m). The rate at which maturing deposits are reinvested represents a significant potential risk to the Group, in currencies such as Sterling and Australian Dollar where the Group has a significant net floating cash position.
The Group has also used interest rate swaps to manage interest rate exposure whereby the requirement to settle interest at fixed rates has been swapped for floating rates. This increases the ability to match floating rate assets with floating rate liabilities.
The anticipated repayment profile of interest bearing financial liabilities is as follows:
Variable£m
Fixed£m
Total£m
Undrawn facility
£m
20142015 (13.3) (64.2) (77.5) –2016 (8.1) (360.4) (368.5) –2017 (17.0) (7.8) (24.8) (793.6)2018 (18.2) (6.8) (25.0) –2019 (4.4) (2.4) (6.8) –2020–2024 (441.7) (873.1) (1,314.8) –After 2024 – (266.8) (266.8) –Total (502.7) (1,581.5) (2,084.2) (793.6)
20132014 (235.8) (72.9) (308.7) (75.0)2015 (0.9) (0.2) (1.1) –2016 (0.9) (350.5) (351.4) –2017 (151.6) (0.8) (152.4) (643.5)2018 (2.8) 0.2 (2.6) –2019–2023 (434.5) (499.5) (934.0) –After 2023 – (232.3) (232.3) –Total (826.5) (1,156.0) (1,982.5) (718.5)
Variable loans are repriced at intervals of between one and six months. Interest is settled on all loans in line with agreements and is settled at least annually.
The impact of a hypothetical rise of 100 bps in interest rates at the reporting date, on an annualised basis, would have (decreased) / increased equity and surplus by £(3.2)m (2013: £12.4m). The impact of a fall of 100 bps in interest rates, on an annualised basis, would have the inverse effect. This calculation is based on the assumption that all other variables, in particular foreign exchange rates, remain constant.
Interest rate hedging activitiesThe Group applies fair value hedges and cash flow hedges in order to hedge its exposure to interest rate risk.
(i) Fair value hedgesInterest rate swaps totalling £330.0m have been entered into to swap the fixed rate coupon on the £330.0m callable subordinated perpetual guaranteed bond to a floating rate. The swaps mature in September 2020. These interest rate swaps are designated as fair value hedges of the underlying interest rate risk on the debt. The fixed receipt occurs annually on the payment of the bond coupon in September. The variable payment is settled quarterly and the rate is reset on the floating element at this time. In the year ended 31 December 2014, the fair value movement in the bond attributable to the hedged risk amounted to £12.1m loss (2013: £34.0m gain). The fair value movement on the interest rate swaps amount to £12.1m gain (2013: £34.0m loss).
(ii) Cash flow hedgesDuring 2009, interest rate swaps were designated to hedge the variability of cash flows associated with £31.3m (€40.3m) (2013: £35.7m (€40.3m)) of floating rate debt in Especializada Y Primaria L’Horta Manises which matures on 30 December 2018. The swaps currently cover 70.4% of the floating rate loan principal balance outstanding at the balance sheet date. At 31 December 2014, the fair value of the interest rate swap liability was £3.2m (€4.1m) (2013: £3.6m (€4.3m)). During 2014, a gain of £0.1m (€0.1m) (2013: £1.2m gain (€1.4m)) were recognised through Other Comprehensive Income.
Within the Bupa Chile business, cross currency swaps have been designated to hedge the variability of cash flows associated with £41.7m (CLP39.3bn) of floating rate debt maturing June 2018. The interest payments have been swapped from floating rate CLP to fixed rate UF (Unidad de Fomento - an inflation linked currency commonly used in Chile). At 31 December 2014, the fair value of the interest rate swap liability was £8.8m (CLP8.3bn). During 2014, losses of £2.7m (CLP 2.5bn) were recognised through Other Comprehensive Income.

114BUPA ANNUAL REPORT 2014
NOTES TO THE FINANCIAL STATEMENTS
Notes to the Financial Statements (CONTINUED)
for the year ended 31 December 2014
5.4.3Credit risk
CREDIT RISK IN BRIEFCredit risk is the risk that those that are in debt to the Group default on their obligation. Examples of credit risk would be non-payment of a trade receivable or a corporate bond failing to repay the capital sum and related interest.
Credit risk is the risk of loss in the value of financial assets due to counterparties failing to meet all or part of their contractual obligations. The Group manages its credit risk exposures under the guidance of the Treasury and Investment Committee.
Investment exposure with external counterparties is managed by ensuring there is a sufficient spread of investments and that all counterparties are rated at least A by two of the three key rating agencies used by the Group (unless specifically approved by the Treasury and Investment Committee).
The Group has no direct exposure to peripheral Eurozone sovereign debt, however, there may be small holdings within the Group’s portfolio of return seeking assets.
The investment profile at 31 December is as follows:
2014 £m
2013(Restated)
£m
Investment grade counterparties 3,059.4 2,879.8 Non-investment grade counterparties 169.5 174.0 Total 3,228.9 3,053.8
Investment grade counterparties include restricted assets of £53.2m (2013: £52.7m). Non-investment grade counterparties are those rated below BBB-, and mainly comprise corporate bonds, shares and other variable rate securities of £127.4m (2013: £100.3m), cash and cash equivalents of £40.8m (2013: £72.5m) and other loans of £1.3m (2013: £1.2m).
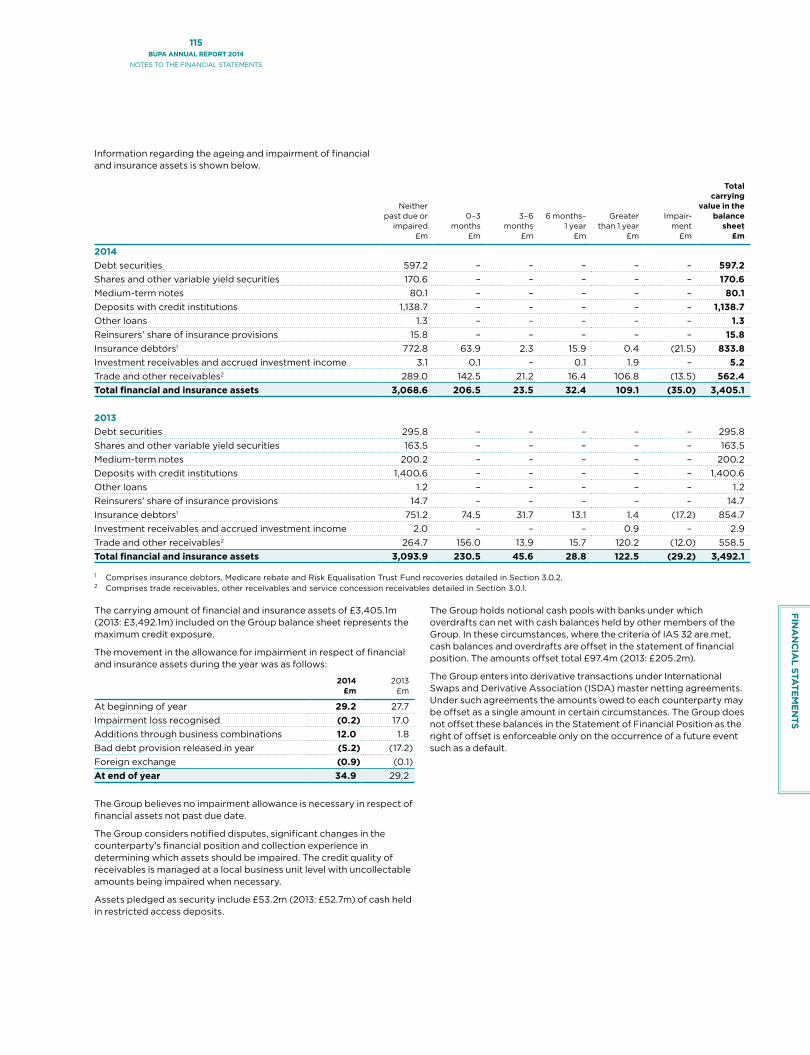
115BUPA ANNUAL REPORT 2014
NOTES TO THE FINANCIAL STATEMENTS
FIN
AN
CIA
L STAT
EM
EN
TS
Information regarding the ageing and impairment of financial and insurance assets is shown below.
Neither past due or
impaired £m
0–3 months
£m
3–6 months
£m
6 months– 1 year
£m
Greater than 1 year
£m
Impair- ment
£m
Total carrying
value in the balance
sheet£m
2014Debt securities 597.2 – – – – – 597.2 Shares and other variable yield securities 170.6 – – – – – 170.6 Medium-term notes 80.1 – – – – – 80.1 Deposits with credit institutions 1,138.7 – – – – – 1,138.7 Other loans 1.3 – – – – – 1.3 Reinsurers’ share of insurance provisions 15.8 – – – – – 15.8Insurance debtors1 772.8 63.9 2.3 15.9 0.4 (21.5) 833.8 Investment receivables and accrued investment income 3.1 0.1 – 0.1 1.9 – 5.2 Trade and other receivables2 289.0 142.5 21.2 16.4 106.8 (13.5) 562.4 Total financial and insurance assets 3,068.6 206.5 23.5 32.4 109.1 (35.0) 3,405.1
2013Debt securities 295.8 – – – – – 295.8Shares and other variable yield securities 163.5 – – – – – 163.5Medium-term notes 200.2 – – – – – 200.2Deposits with credit institutions 1,400.6 – – – – – 1,400.6Other loans 1.2 – – – – – 1.2Reinsurers’ share of insurance provisions 14.7 – – – – – 14.7Insurance debtors1 751.2 74.5 31.7 13.1 1.4 (17.2) 854.7Investment receivables and accrued investment income 2.0 – – – 0.9 – 2.9Trade and other receivables2 264.7 156.0 13.9 15.7 120.2 (12.0) 558.5Total financial and insurance assets 3,093.9 230.5 45.6 28.8 122.5 (29.2) 3,492.1
1 Comprises insurance debtors, Medicare rebate and Risk Equalisation Trust Fund recoveries detailed in Section 3.0.2.2 Comprises trade receivables, other receivables and service concession receivables detailed in Section 3.0.1.
The carrying amount of financial and insurance assets of £3,405.1m (2013: £3,492.1m) included on the Group balance sheet represents the maximum credit exposure.
The movement in the allowance for impairment in respect of financial and insurance assets during the year was as follows:
2014 £m
2013 £m
At beginning of year 29.2 27.7Impairment loss recognised (0.2) 17.0Additions through business combinations 12.0 1.8Bad debt provision released in year (5.2) (17.2)Foreign exchange (0.9) (0.1)At end of year 34.9 29.2
The Group believes no impairment allowance is necessary in respect of financial assets not past due date.
The Group considers notified disputes, significant changes in the counterparty’s financial position and collection experience in determining which assets should be impaired. The credit quality of receivables is managed at a local business unit level with uncollectable amounts being impaired when necessary.
Assets pledged as security include £53.2m (2013: £52.7m) of cash held in restricted access deposits.
The Group holds notional cash pools with banks under which overdrafts can net with cash balances held by other members of the Group. In these circumstances, where the criteria of IAS 32 are met, cash balances and overdrafts are offset in the statement of financial position. The amounts offset total £97.4m (2013: £205.2m).
The Group enters into derivative transactions under International Swaps and Derivative Association (ISDA) master netting agreements. Under such agreements the amounts owed to each counterparty may be offset as a single amount in certain circumstances. The Group does not offset these balances in the Statement of Financial Position as the right of offset is enforceable only on the occurrence of a future event such as a default.

116BUPA ANNUAL REPORT 2014
NOTES TO THE FINANCIAL STATEMENTS
Notes to the Financial Statements (CONTINUED)
for the year ended 31 December 2014
5.4.4Liquidity risk
LIQUIDITY RISK IN BRIEFLiquidity risk is the risk that the Group will not have available funds to meet its liabilities when they fall due.
The Group’s main source of short-term funding is via an £800.0m revolving credit facility which was undrawn at 31 December 2014, with the exception of £6.4m of outstanding letters of credit for general business purposes. The bank facility matures in October 2017.
The Group monitors funding risk as well as compliance with existing financial covenants within the banking arrangements. There were no concerns regarding bank covenant coverage in 2014 and that position is not expected to change in the foreseeable future.
The Group enjoys a strong liquidity position and adheres to strict liquidity management policies as set by the Treasury and Investment Committee as well as adhering to certain liquidity parameters, as defined by the PRA for the Group’s regulated entities in the UK and local equivalent authorities for the Group’s foreign operations.
Liquidity is managed by currency and by considering the segregation of accounts required for regulatory purposes; short-term operational working capital requirements are met by cash in hand and committed bank facilities.
The contractual maturities of financial liabilities and the expected maturities of insurance liabilities, including estimated interest payments of the Group as at 31 December, are as follows:
Sub- ordinated liabilities
£m
Other interest bearing liabilities
£m
Provisions under insurance
contracts issued £m
Other liabilities under insurance contracts issued
£m
Tradeand other payables1
£m
Derivative liabilities
£m Total
£m
20142015 (45.2) (112.5) (2,182.5) (57.6) (1,220.5) (3.8) (3,622.1)2016 (45.2) (400.0) (0.4) – (6.1) – (451.7)2017 (45.2) (42.7) (0.2) – (4.6) – (92.7)2018 (45.2) (40.9) (0.3) – (0.4) (11.0) (97.8)2019 (45.2) (22.7) (0.3) – (0.4) (62.1) (130.7)2020–2024 (983.2) (472.6) (8.1) – (1.8) – (1,465.7)After 2024 – (349.4) (17.1) – (1.7) – (368.2)Total (1,209.2) (1,440.8) (2,208.9) (57.6) (1,235.5) (76.9) (6,228.9)Carrying value in the Statement
of Financial Position (929.6) (1,154.6) (2,208.9) (57.6) (1,235.5) (76.9) (5,663.1)
20132014 (45.2) (348.6) (2,171.6) (17.2) (1,010.2) (1.2) (3,594.0)2015 (45.2) (45.5) (2.3) – (9.6) – (102.6)2016 (45.2) (382.7) (0.4) – (2.1) – (430.4)2017 (45.2) (170.1) (0.5) – (0.8) – (216.6)2018 (45.2) (18.4) (0.5) – (0.7) (3.6) (68.4)2019–2023 (1,032.4) (104.7) (6.7) – (2.1) – (1,145.9)After 2023 – (330.5) (14.0) – (1.3) – (345.8)Total (1,258.4) (1,400.5) (2,196.0) (17.2) (1,026.8) (4.8) (5,903.7)Carrying value in the Statement
of Financial Position (917.3) (1,065.2) (2,196.0) (17.2) (1,026.8) (4.8) (5,227.3)
1 Comprised of trade payables, other payables, accommodation bond liabilities and accruals detailed in Section 3.0.6.

117BUPA ANNUAL REPORT 2014
NOTES TO THE FINANCIAL STATEMENTS
FIN
AN
CIA
L STAT
EM
EN
TS
The total liability is split by remaining duration in proportion to the cash flows expected to arise during that period. Interest payments are included in the cash flows for subordinated liabilities and other interest bearing liabilities.
Maturity profile of financial assetsThe maturity profile of financial assets as at 31 December 2014 and 2013, which are available to fund the repayment of liabilities as they crystallise, is as follows:
Cash andcash
equivalents£m
Depositswith creditinstitutions
£m
Overseasgovernment
bonds£m
UKcorporate
bonds£m
Overseascorporate
bonds£m
Other loans
£m
Mediumterm
notes£m
Sharesand other
variableyield
securities£m
Total£m
20142015 1,187.5 969.2 25.0 132.1 41.5 1.3 50.1 34.7 2,441.42016 – 169.5 79.3 – 101.4 – – 195.8 546.02017 – – 7.1 – 9.3 – 30.0 – 46.42018 – – 1.2 – 14.2 – – – 15.42019 – – 0.5 – 10.7 – – – 11.22020–2024 – – 17.4 – 12.4 – – – 29.8
After 2024 – – – 83.8 1.4 – – – 85.2Total 1,187.5 1,138.7 130.5 215.9 190.9 1.3 80.1 230.5 3,175.4
20132014 939.8 1,063.2 13.5 – 53.2 1.2 150.2 24.5 2,245.62015 – 337.4 6.4 – 57.3 – 50.0 138.3 589.42016 – – – – 58.3 – – – 58.32017 – – – – 1.7 – – – 1.72018 – – – – 13.5 – – – 13.52019–2023 – – 11.8 – – – – – 11.8After 2023 – – 0.2 79.7 0.2 – – 0.7 80.8Total 939.8 1,400.6 31.9 79.7 184.2 1.2 200.2 163.5 3,001.1

118BUPA ANNUAL REPORT 2014
NOTES TO THE FINANCIAL STATEMENTS
Notes to the Financial Statements (CONTINUED)
for the year ended 31 December 2014
6.0Related party transactions
RELATED PARTY TRANSACTIONS IN BRIEFThese are transactions between the Group and related individuals or entities by nature of influence or control. The Group has such relationships with its subsidiaries, key management personnel, equity accounted investments and associated pension arrangements. The disclosure of transactions with these parties in this section enables readers to form a view about the impact of related party relationships on the Group.
All transactions with related parties are conducted on an arm’s length basis.
Where the Company enters into financial guarantee contracts to guarantee the indebtedness of other companies within the Group, the Company considers these to be insurance arrangements, and accounts for them as such. In this respect, provision for expected claims is made on an incurred basis.
There were no material transactions during the year with any related parties, as defined by IAS 24, other than those disclosed in this section.
(i) Transactions with key management personnelThe key management personnel are the Group’s Executive and Non-Executive Directors and includes the Managing Directors of the Group’s Market Units. No Director had any material interest in any contracts with Group companies at 31 December 2014 (2013: £nil) or at any time during the year. The remuneration of the Group’s Executive and Non-Executive Directors is disclosed on pages 45 to 54.
The total remuneration of the Market Unit Managing Directors is as follows:
2014 £m
2013 £m
Short-term employee benefits 4.7 4.8Long-term incentive plan 1.3 0.9Post employment benefits 0.6 0.3Total 6.6 6.0
The total remuneration of key management personnel is included in staff costs (see Section 2.3).
(ii) Transactions in relation to the non-registered pension arrangementsThe Company has made pension commitments to certain current and former Executive Directors and key management personnel through a non-registered pension arrangement which mirrors the terms of The Bupa Pension Scheme (see Section 3.6). These unfunded benefits are governed by The Law Debenture Pension Trust Corporation Plc who are the Trustee of the non-registered pension arrangement, and are secured by a charge over £40.9m (2013: £39.3m) of cash deposits (see Section 3.0.4). The increase in the charge of £1.6m during 2014 mainly reflects changes in market conditions and market related changes in the underlying actuarial assumptions.
6.1Commitments and
contingencies
COMMITMENTS AND CONTINGENCIES IN BRIEFA commitment is future expenditure that is committed to as at 31 December 2014. These commitments fall under non-cancellable operating lease payments and contracted capital expenditure. Contingent assets and liabilities are those that are considered possible at year end, whose existence will be determined by a future event.
(i) Operating leasesThe total value of future non-cancellable operating lease rentals is payable as follows:
2014£m
2013£m
Less than one year 121.3 110.3Between one and five years 390.7 330.9More than five years 610.2 563.3Total operating leases 1,122.2 1,004.5
The Group leases a number of properties under operating leases. The leases typically run for a period between 10 and 25 years, with an option to renew the lease after that date. Lease payments are reviewed regularly in accordance with the terms and conditions of the individual lease agreements. None of these leases include contingent rentals.
Some of the leased properties have been sub-let by the Group. Both the leased properties and the sub-leases expire between 2019 and 2024. Sub-lease receipts of £0.7m (2013: £0.7m) are expected to be received during the next financial year. The Group has an unoccupied property provision of £4.6m (2013: £5.8m) in respect of these leases (see Section 3.5). The Group leases out some of its investment properties as a lessor, see Section 3.3 for details.
(ii) Capital commitmentsCapital expenditure for the Group contracted at 31 December 2014 but for which no provision has been made in the financial statements, amounted to £187.6m (2013: £102.9m), of which £135.6m (2013: £48.4m) related to property, plant and equipment and £52.0m (2013: £54.5m) related to investment property.
(iii) Contingent assets and contingent liabilitiesThe Group currently has no contingent assets.
The Group has contingent liabilities arising in the ordinary course of business, including losses which might arise from litigation, from which it is anticipated that the likelihood of any material unprovided liabilities arising is remote.
(iv) Pensions contributionsThe Group has an obligation to make a series of special contributions to the Bupa Pension Scheme amounting to £40.0m pa for the years ending 31 December 2015 and 31 December 2016.

FIN
AN
CIA
L STAT
EM
EN
TS
119BUPA ANNUAL REPORT 2014
COMPANY PRIMARY STATEMENTS AND ASSOCIATED NOTES
7.0 Company Primary Statements
and Associated Notes
COMPANY PRIMARY STATEMENTS AND ASSOCIATED NOTES IN BRIEFThis section consists of the Company’s primary statements including Statement of Financial Position, Statement of Cash Flows and Statement of Changes in Equity. Sections 7.1 to 7.11 form the associated notes to the Company financial statements.
The Company accounting policies are aligned with those of the Group, described at Sections 2 to 6.
STATEMENT OF FINANCIAL POSITIONas at 31 December 2014
Section2014
£m2013
£m
Non-current assetsIntangible assets 7.1 24.6 23.9Property, plant and equipment 7.2 25.3 28.6Investment in subsidiary companies 7.3 200.1 200.1Other receivables 7.7 0.3 0.4Post employment benefit net assets 7.5 348.6 127.5
598.9 380.5
Current assetsTrade and other receivables 7.7 133.3 78.5Current taxation asset – 0.2Cash and cash equivalents 1.0 1.1
134.3 79.8Total assets 733.2 460.3
Non-current liabilitiesPost employment benefit net liabilities 7.5 (54.6) (50.4)Provisions for liabilities and charges 7.6 (11.2) (11.1)Deferred taxation liabilities 7.9 (48.9) (7.6)Trade and other payables 7.7 (9.0) (8.0)
(123.7) (77.1)
Current liabilitiesProvisions for liabilities and charges 7.6 (4.1) (4.1)Trade and other payables 7.7 (155.1) (133.9)Current taxation liabilities (0.2) –
(159.4) (138.0)Total liabilities (283.1) (215.1) Net assets 450.1 245.2
EquityIncome and expenditure reserve 449.7 244.8Foreign exchange translation reserve 0.4 0.4Total equity 450.1 245.2
Approved by the Board of Directors and signed on its behalf on 4 March 2015 by
Lord Leitch Evelyn BourkeChairman Chief Financial Officer
Sections 7.1 to 7.11 form part of these financial statements.

120BUPA ANNUAL REPORT 2014
COMPANY PRIMARY STATEMENTS AND ASSOCIATED NOTES
Notes to the Financial Statements (CONTINUED)
for the year ended 31 December 2014
INCOME STATEMENT for the year ended 31 December 2014
The profit for the financial year recorded within the accounts of the Company, The British United Provident Association Limited (Bupa), is £64.0m (2013: £25.1m loss). In accordance with the exemption granted under Section 408 of the Companies Act 2006,
a separate Income Statement and Statement of Comprehensive Income for the Company have not been presented. The average number of full-time equivalent employees, including Executive Directors, employed by the Company during the year was 1,366 (2013: 1,114).
STATEMENT OF CASH FLOWSas at 31 December 2014
2014 £m
2013 £m
Operating activitiesProfit / (loss) before taxation expense 49.9 (40.0)
Adjustments for:Net financial income (0.2) (0.3)
Depreciation, amortisation and impairment 17.4 16.6Other non-cash items 41.7 4.4
Changes in working capital and provisions:Changes in net pension asset / liability 7.5 (41.2) (40.2)Increase / (decrease) in provisions for liabilities and charges 0.1 (1.6)(Increase) / decrease in trade and other receivables, and other assets 7.7 (54.7) 39.7Increase in trade and other payables, and other liabilities 1.4 30.3Cash generated from operations 14.4 8.9
Cash flow from investing activitiesPurchase of intangible assets 7.1 (21.1) (20.9)Proceeds from sale of intangible assets 7.1 10.7 14.4Purchase of property, plant and equipment 7.2 (5.4) (7.1)Proceeds from sale of property, plant and equipment 7.2 1.0 1.0Interest received 0.4 0.4
Net cash used in investing activities (14.4) (12.2)
Cash flow from financing activitiesInterest paid (0.1) (0.1)Net cash used in financing activities (0.1) (0.1)
Net decrease in cash and cash equivalents (0.1) (3.4)Cash and cash equivalents at beginning of year 1.1 4.5Cash and cash equivalents at end of year 1.0 1.1
Sections 7.1 to 7.11 form part of these financial statements.

FIN
AN
CIA
L STAT
EM
EN
TS
121BUPA ANNUAL REPORT 2014
COMPANY PRIMARY STATEMENTS AND ASSOCIATED NOTES
STATEMENT OF CHANGES IN EQUITYfor the year ended 31 December 2014
Section
Property revaluation
reserve £m
Income and expenditure
reserve £m
Foreign exchange
translation reserve
£m
Total equity
£m
2014At beginning of year – 244.8 0.4 245.2 Profit for the financial year – 64.0 – 64.0
Other comprehensive income / (expense) Remeasurement gain on pension scheme 7.5 – 175.7 – 175.7 Taxation charge on income and expenses recognised directly
in other comprehensive income 7.9 – (34.8) – (34.8)Other comprehensive income for the year, net of taxation – 140.9 – 140.9
Total comprehensive income for the year – 204.9 – 204.9 At end of year – 449.7 0.4 450.1
2013At beginning of year – 283.5 0.4 283.9Loss for the financial year – (25.1) – (25.1)
Other comprehensive income / (expense) Remeasurement loss on pension schemes 7.5 – (15.3) – (15.3)Taxation credit recognised directly in other comprehensive income 7.9 – 1.7 – 1.7Other comprehensive (expense) for the year, net of taxation – (13.6) – (13.6)
Total comprehensive expense for the year – (38.7) – (38.7)At end of year – 244.8 0.4 245.2
Sections 7.1 to 7.11 form part of these financial statements.
7.1Intangible assets
INTANGIBLE ASSETS IN BRIEFIntangible assets are the non-physical assets held by the Company and consists of computer software only.
INTANGIBLE ASSETS – COMPUTER SOFTWARE
2014 £m
2013 £m
CostAt beginning of year 64.2 58.4Additions 21.1 20.9Disposals (10.7) (15.1)At end of year 74.6 64.2
Amortisation and impairment lossAt beginning of year 40.3 31.6Amortisation for year 9.7 9.4Disposals – (0.7)At end of year 50.0 40.3
Net book value at end of year 24.6 23.9Net book value at beginning of year 23.9 26.8
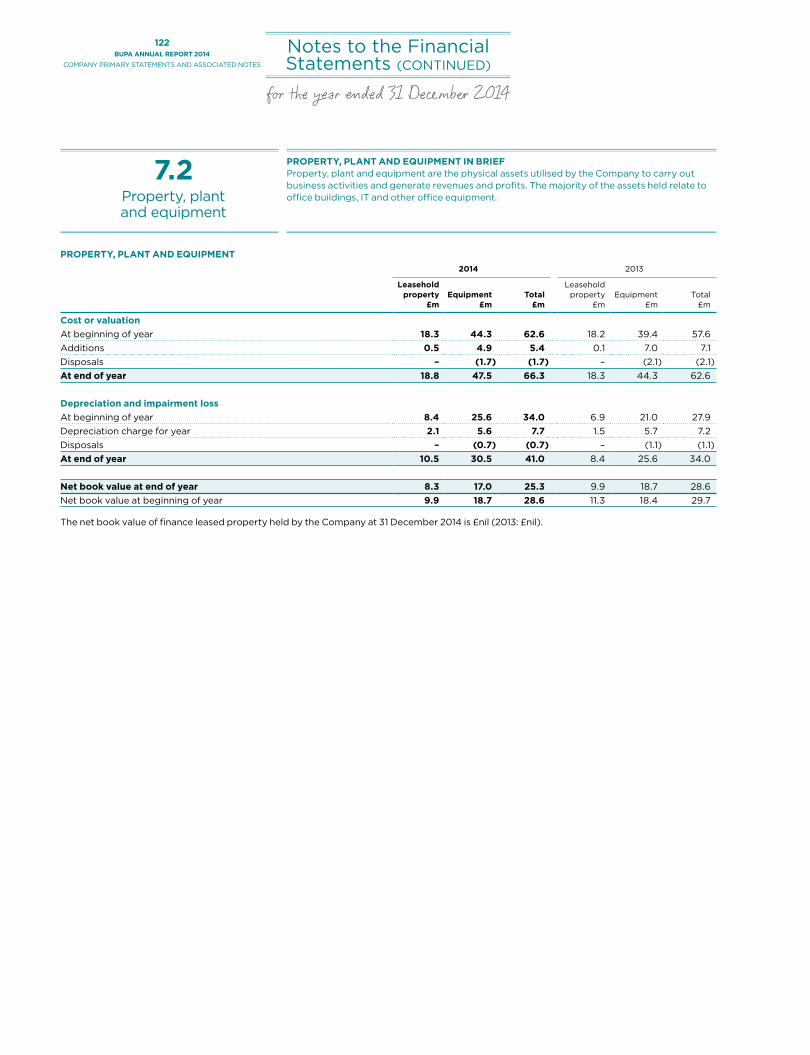
122BUPA ANNUAL REPORT 2014
COMPANY PRIMARY STATEMENTS AND ASSOCIATED NOTES
Notes to the Financial Statements (CONTINUED)
for the year ended 31 December 2014
7.2Property, plant and equipment
PROPERTY, PLANT AND EQUIPMENT IN BRIEFProperty, plant and equipment are the physical assets utilised by the Company to carry out business activities and generate revenues and profits. The majority of the assets held relate to office buildings, IT and other office equipment.
PROPERTY, PLANT AND EQUIPMENT
2014 2013
Leasehold property
£mEquipment
£mTotal
£m
Leasehold property
£mEquipment
£mTotal
£m
Cost or valuationAt beginning of year 18.3 44.3 62.6 18.2 39.4 57.6Additions 0.5 4.9 5.4 0.1 7.0 7.1Disposals – (1.7) (1.7) – (2.1) (2.1)At end of year 18.8 47.5 66.3 18.3 44.3 62.6
Depreciation and impairment lossAt beginning of year 8.4 25.6 34.0 6.9 21.0 27.9Depreciation charge for year 2.1 5.6 7.7 1.5 5.7 7.2Disposals – (0.7) (0.7) – (1.1) (1.1)At end of year 10.5 30.5 41.0 8.4 25.6 34.0
Net book value at end of year 8.3 17.0 25.3 9.9 18.7 28.6Net book value at beginning of year 9.9 18.7 28.6 11.3 18.4 29.7
The net book value of finance leased property held by the Company at 31 December 2014 is £nil (2013: £nil).

FIN
AN
CIA
L STAT
EM
EN
TS
123BUPA ANNUAL REPORT 2014
COMPANY PRIMARY STATEMENTS AND ASSOCIATED NOTES
7.3Investment in subsidiaries
INVESTMENT IN SUBSIDIARIES IN BRIEFBelow is a summary of the principal investments in subsidiaries held by the Company.
CARRYING VALUE OF INVESTMENT IN SUBSIDIARIESSubsidiaries are entities controlled by the Group. Investments in subsidiary companies are carried at cost less impairment in the Company’s accounts. Dividends received from subsidiaries are recognised in the Income Statement when the right to receive the dividend is established.
As at 31 December 2014, the Company held investments in subsidiaries of £200.1m (2013: £200.1m).
The principal subsidiary companies of the Company as at 31 December 2014 are listed below and, except where stated, are incorporated in England and Wales. Subsidiary companies are 100% owned unless otherwise stated. Full details of all Group undertakings will be annexed to the Company’s next annual return in compliance with the Companies Act 2006.
Health insurance – general business Care and health provisionBupa Insurance Limited Bupa Care Homes (CFG) plcSanitas, SA de Seguros (99% holding) Spain Bupa Care Homes Group LimitedBupa Australia Pty Limited Australia Bupa Care Homes (BNH) LimitedBupa Asia Pacific Pty Limited Australia Bupa Care Services LimitedBupa (Asia) Limited Hong Kong Bupa Care Homes (CFCHomes) LimitedBupa Insurance Company US Bupa Care Homes (CFH Care) Limited
Bupa Care Homes (GL) LimitedInvestment and financing activities Bupa Care Homes (Partnerships) LimitedBupa Finance plc* Richmond Care Villages Holdings LimitedBupa Investments Limited Bupa Home Healthcare LimitedBupa Investments Overseas Limited Bupa Occupational Health LimitedGrupo Bupa Sanitas SL Spain Bupa Aged Care Australasia Pty Limited AustraliaUK Care No 1 Limited Guernsey Bupa Care Services NZ Limited New Zealand
Sanitas Residencial SL Spain
* Directly owned by the CompanySanitas, Sociedad Anonima de Hospitales
Sociedad Unipersonal SpainTorrejón Salud S.A. (50% holding) SpainMedical Services International LimitedBupa Dental Corporation Limited AustraliaLUX MED Sp. z.o.o. PolandQuality Healthcare Medical Holdings Limited Hong KongCruz Blanca Salud S.A. (56% holding) Chile
Although the Company holds none of the voting power of UK Care No 1 Limited, it has the right to obtain benefits or is exposed to risks relating to the activities of this company. Consequently, the Group financial statements in Sections 2 to 6 include the results of the entity in it.

124BUPA ANNUAL REPORT 2014
COMPANY PRIMARY STATEMENTS AND ASSOCIATED NOTES
Notes to the Financial Statements (CONTINUED)
for the year ended 31 December 2014
7.4Additional subsidiary
disclosure
ADDITIONAL SUBSIDIARY DISCLOSURE IN BRIEFAdditional disclosure is provided for entities which are consolidated where the Company does not hold a 100% interest.
(i) Consolidation of entities in which the Group holds less than 50%Bupa Health Insurance (Thailand) plcThe directors have concluded that the Group controls Bupa Health Insurance (Thailand) plc and its holding companies; Bupa Holdings Thailand Ltd, Minor Health Enterprise Co Ltd and Health Care Management Co Ltd.
The Group holds 25% of the voting rights of Bupa Health Insurance (Thailand) Plc directly along with a 49% minority interest in the holding companies mentioned above, that in turn hold the other 75% of the voting rights. The articles of these holding companies require shareholder decisions to be unanimous, meaning that the holding companies are unable to exercise any actions without the Group’s agreement.
UK Care No 1 LimitedUK Care No 1 is a structured entity incorporated for the purposes of issuing the Group’s secured loans. The Group participates in the risks and rewards, but 100% minority interest is recognised due to the Group holding no share of the ownership.
Eurocredit Investment Fund 1 plcEurocredit Investment Fund is a structured entity set up for the
purpose of investing in primary and secondary secured loans. Bupa is the only company contributing investment capital but the nominal share capital is held by a charitable trust. The entity is consolidated but a 100% minority interest is recognised as a result of the Group’s share of ownership.
(ii) Subsidiary significant restrictionsThere are no significant restrictions on the subsidiaries ability to access or use the assets to settle the liabilities of the group. The Group’s insurance entities are subject to local regulatory requirements.
iii) Non-controlling interests (NCI)Set out below is summarised financial information for each subsidiary that has non-controlling interests material to the Group. The amounts disclosed for each subsidiary are before inter-company eliminations.
Bupa acquired 56% of the shares in Cruz Blanca Salud on 24 February 2014. As part of the transaction, the Group entered into a put and call option with the vendor for the sale of a further 17% of the shares in Cruz Blanca Salud. The effect of these options is to transfer the risks and rewards of the additional shareholding to Bupa and a 73.3% shareholding has been used for the purposes of acquisition accounting.
The Group owns 50% of the shareholding in Torrejón Salud S.A..
Torrejón50% NCI
Bupa Chile44% NCI
Summarised Statement of Financial Position2014
£m2013
£m2014
£m
Current assets 46.7 34.7 111.0Current liabilities (27.8) (30.5) (168.1)Current net assets / (liabilities) 18.9 4.2 (57.1)Non-current assets 80.1 89.7 426.0Non-current liabilities (78.7) (74.5) (160.1)Non-current net assets 1.4 15.2 265.9Net assets 20.3 19.4 208.8Accumulated NCI 10.2 9.7 54.3
Torrejón50% NCI
Bupa Chile44% NCI
Summarised Statement of Other Comprehensive Income2014
£m2013
£m2014
£m
Revenue 73.4 84.0 531.3Profit for the period 2.3 7.5 8.4Profit allocated to NCI 1.1 3.7 3.8Dividends paid to NCI – – (1.5)
Torrejón50% NCI
Bupa Chile44% NCI
Summarised cash flows2014
£m2013
£m2014
£m
Cash flow from operating activities (4.8) (2.9) 18.8Cash flow from investing activities – – (22.6)Cash flow from financing activities 7.4 (1.6) (5.6)Net increase / (decrease) in cash and cash equivalents 2.6 (4.5) (9.4)

FIN
AN
CIA
L STAT
EM
EN
TS
125BUPA ANNUAL REPORT 2014
COMPANY PRIMARY STATEMENTS AND ASSOCIATED NOTES
7.5Post employment
benefits
POST EMPLOYMENT BENEFITS IN BRIEFThe Company operates a defined benefit and a defined contribution pension scheme for the benefit of employees and Directors, in addition to an unfunded and post retirement medical benefit scheme.
The defined benefit scheme is The Bupa Pension Scheme which was closed to new entrants from 1 October 2002. The principal defined contribution pension scheme is The Bupa Retirement Savings Plan.
The Company is the sponsoring employer for The Bupa Pension Scheme, the unfunded pension scheme and post retirement medical benefit scheme described in Section 3.6. The actuarial assumptions underlying the valuation of obligations are detailed in Section 3.6.2.
(i) Assets and liabilities of schemesThe assets and liabilities in respect of the defined benefit funded pension scheme, unfunded pension and post retirement medical benefit scheme are as follows:
Pension schemesPost retirement medical
benefit scheme Total
Note2014
£m2013
£m2014
£m2013
£m2014
£m2013
£m
Present value of funded obligations (ii) (1,288.9) (1,159.1) – – (1,288.9) (1,159.1)Fair value of scheme assets (iii) 1,637.5 1,286.6 – – 1,637.5 1,286.6Net assets of funded scheme 348.6 127.5 – – 348.6 127.5Present value of unfunded obligations (ii) (43.2) (39.4) (11.4) (11.0) (54.6) (50.4)Net recognised assets / (liabilities) 305.4 88.1 (11.4) (11.0) 294.0 77.1
Represented on the Statement of Financial Position as:Net assets 348.6 127.5Net liabilities (54.6) (50.4)Net recognised assets 294.0 77.1

126BUPA ANNUAL REPORT 2014
COMPANY PRIMARY STATEMENTS AND ASSOCIATED NOTES
Notes to the Financial Statements (CONTINUED)
for the year ended 31 December 2014
(ii) Present value of the schemes’ obligationsThe movement in the present value of schemes’ obligations are:
Pension schemesPost retirement medical
benefit scheme Total
2014£m
2013£m
2014£m
2013£m
2014£m
2013£m
At beginning of year 1,198.5 1,113.6 11.0 14.9 1,209.5 1,128.5Current service cost 12.5 13.6 – – 12.5 13.6Interest on obligations 55.6 49.5 0.5 0.7 56.1 50.2Contributions by employees 0.1 0.1 – – 0.1 0.1Losses / (gains) arising from changes to financial assumptions 124.2 46.6 – (3.8) 124.2 42.8Gains arising from changes to experience assumptions (14.2) – – (0.2) (14.2) (0.2)(Gains) / losses arising from changes to demographic assumptions (16.4) – 0.3 – (16.1) –Benefits paid (28.2) (24.9) (0.4) (0.6) (28.6) (25.5)At end of year 1,332.1 1,198.5 11.4 11.0 1,343.5 1,209.5
(iii) Fair value of funded scheme’s assetsThe movement in the fair value of the funded schemes' assets are:
2014£m
2013£m
At beginning of year 1,286.6 1,180.7Interest income 60.1 52.8Return on assets excluding interest income 269.6 27.3Contributions by employer 49.5 50.8Contributions by employees 0.1 0.1Administrative expenses (1.5) (1.5)Benefits paid (26.9) (23.6)At end of year 1,637.5 1,286.6
The market value of the assets of the funded scheme is as follows:Equities 210.6 532.4Corporate bonds 314.8 696.2Gilts 764.6 –Cash / Other assets 347.5 58.0Total market value of the assets of the funded scheme 1,637.5 1,286.6
All assets have a quoted market price.
(iv) Amounts recognised in the Income StatementThe amounts charged / (credited) to other operating expenses for the year are:
2014£m
2013£m
Current service cost 12.5 13.6Net interest on defined benefit liability / asset (4.0) (2.6)Administrative expenses 1.5 1.5Total amount charged to Income Statement 10.0 12.5
(v) Amounts recognised directly in Other Comprehensive IncomeThe amounts (credited) / charged directly to equity are:
2014£m
2013£m
Actual return less expected return on assets (269.6) (27.3)Loss arising from changes to financial assumptions 124.2 42.8Gain arising from changes to experience assumptions (14.2) (0.2)Gain arising from changes to demographic assumptions (16.1) –Total remeasurement losses (gains credited) / charged directly to equity (175.7) 15.3
The cumulative amount of actuarial losses recognised directly in equity is £10.8m as at 31 December 2014 (2013: £186.5m).

FIN
AN
CIA
L STAT
EM
EN
TS
127BUPA ANNUAL REPORT 2014
COMPANY PRIMARY STATEMENTS AND ASSOCIATED NOTES
7.6Provisions for liabilities
and charges
PROVISIONS FOR LIABILITIES AND CHARGES IN BRIEFProvisions for liabilities and charges are those not related to insurance contracts issued that require settlement in the future as a result of a past event.
PROVISIONS FOR LIABILITIES AND CHARGES
Insurance £m
Unoccupied property
£mOther
£mTotal
£m
At 1 January 2014 14.0 1.1 0.1 15.2Charge for year 8.3 0.1 – 8.4Released in year – (0.1) – (0.1)Utilised in year – cash (2.5) – – (2.5)Utilised in year – non-cash (5.7) – – (5.7)At 31 December 2014 14.1 1.1 0.1 15.3
Non–current 10.2 0.9 0.1 11.2Current 3.9 0.2 – 4.1Total provisions for liabilities and charges 14.1 1.1 0.1 15.3
7.7Working capital
WORKING CAPITAL IN BRIEFWorking capital represents the assets and liabilities the Company generates through its trading activities. The Company therefore defines working capital as trade and other receivables, and trade and other payables.
7.7.1 TRADE AND OTHER RECEIVABLES
2014 £m
2013 £m
Non-currentPrepayments 0.3 0.4Total non-current other receivables 0.3 0.4
CurrentAmounts owed by subsidiary companies 116.9 62.6Other receivables 0.5 1.2Prepayments 15.9 14.7Total current trade and other receivables 133.3 78.5
Total trade and other receivables 133.6 78.9
7.7.2 TRADE AND OTHER PAYABLES
2014 £m
2013 £m
Non-currentAmounts owed to subsidiary companies 0.3 0.3Accruals 8.7 7.7Total non-current trade and other payables 9.0 8.0
CurrentAmounts owed to subsidiary companies 86.2 68.4Other payables 10.2 7.9Accruals 58.7 57.6Total current trade and other payables 155.1 133.9 Total trade and other payables 164.1 141.9

128BUPA ANNUAL REPORT 2014
COMPANY PRIMARY STATEMENTS AND ASSOCIATED NOTES
Notes to the Financial Statements (CONTINUED)
for the year ended 31 December 2014
7.8Risk management
RISK MANAGEMENT IN BRIEFThe Board is responsible for identifying, evaluating and managing risks faced by the Company and considers the acceptable level of risk, the likelihood of these risks materialising, how to reduce the risk and the cost of operating particular controls relative to the benefit from managing the related risks.
The Group’s risk management strategy is outlined in detail within Section 5.4.
The risks faced by the Company have been assessed as part of the Group’s ongoing risk management processes, a summary of these risks are outlined below:
Risk type Summary of risk assessment
Insurance risk The Company is not exposed to insurance risk
Market risk The Company is not materially exposed to foreign exchange or interest rate risk
Credit risk The maximum credit risk exposure of the Company is £1.5m (2013: £2.3m). The Company believes amounts owed to it by subsidiary companies carry no credit risk
Liquidity risk The contractual maturity of financial liabilities, held by the Company, fall due within one year
7.9Deferred taxation assets
and liabilities
DEFERRED TAXATION ASSETS AND LIABILITIES IN BRIEFDeferred tax is an adjustment to recognise the differences between the carrying amounts of assets and liabilities for financial reporting and the amounts used for taxation purposes.
Recognised deferred taxation assets and liabilitiesDeferred taxation assets and liabilities are attributable to the following:
Assets Liabilities Net
2014 £m
2013 £m
2014 £m
2013 £m
2014 £m
2013 £m
Accelerated capital allowances 2.5 1.7 – – 2.5 1.7Post employment benefit liability – – (58.6) (15.6) (58.6) (15.6)Revaluation of properties to fair value 0.1 – – – 0.1 –Employee benefits (other than post employment) 2.9 2.6 – – 2.9 2.6Provisions 4.1 3.6 – – 4.1 3.6Other 0.1 0.1 – – 0.1 0.1Net deferred taxation asset / (liability) 9.7 8.0 (58.6) (15.6) (48.9) (7.6)
Recognised deferred taxation assets Deferred taxation assets relating to the carry forward of employee benefits, other provisions, unused taxation losses and other deferred taxation assets are recognised to the extent that it is probable that future taxable profits will be available against which the deferred taxation assets can be utilised.

FIN
AN
CIA
L STAT
EM
EN
TS
129BUPA ANNUAL REPORT 2014
COMPANY PRIMARY STATEMENTS AND ASSOCIATED NOTES
Movement in net deferred taxation assets / (liabilities)
At beginning of year
£m
Recognised in Income
Statement £m
Recognised in Other
Compre- hensive Income
£m
At end of year
£m
2014Accelerated capital allowances 1.7 0.8 – 2.5Post employment benefit liability (15.6) (8.2) (34.8) (58.6)Revaluation of properties to fair value – 0.1 – 0.1Employee benefits (other than post employment) 2.6 0.3 – 2.9Provisions 3.6 0.5 – 4.1Other 0.1 – – 0.1Total (7.6) (6.5) (34.8) (48.9)
2013 Accelerated capital allowances 1.0 0.7 – 1.7Post employment benefit (liability) / asset (12.0) (5.3) 1.7 (15.6)Employee benefits (other than post employment) 3.2 (0.6) – 2.6Provisions 4.4 (0.8) – 3.6Other 0.2 (0.1) – 0.1Total (3.2) (6.1) 1.7 (7.6)

130BUPA ANNUAL REPORT 2014
COMPANY PRIMARY STATEMENTS AND ASSOCIATED NOTES
Notes to the Financial Statements (CONTINUED)
for the year ended 31 December 2014
7.10Related party transactions
RELATED PARTY TRANSACTIONS IN BRIEFThese are transactions between the Company and related individuals or entities by nature of influence or control. The Company has such relationships with its subsidiaries, key management personnel and associated pension arrangements. The disclosure of transactions with these parties enables readers to form a view about the impact of related party relationships on the Company.
The Company has a related party relationship with its key management personnel and with its subsidiary companies (see Section 7.3).
(i) Transactions with key management personnelThe key management personnel for the Company are the same as for the Group. These transactions are disclosed in Section 6.0.
The total remuneration of key management personnel is included in staff costs (see Section 2.3).
(ii) Transactions in relation to the non-registered pension arrangementsThese transactions are disclosed in Section 6.0.
(iii) Transactions and balances with subsidiary companies Transactions during the year
Balance at 31 December
2014 £m
2013 £m
2014 £m
2013 £m
Income StatementManagement charges received 202.6 154.5Interest income 0.4 0.4Interest expense (0.2) (0.1)Income received 2.1 2.3Expenses paid (including rental expense of £5.6m (2013: £4.9m)) (7.4) (6.6)Dividends received 135.8 50.0
Balance sheetAmounts owed by subsidiary companies 56.8 (45.2) 116.9 60.1Amounts owed to subsidiary companies (20.5) (5.4) (86.2) (65.7)Loans from subsidiary companies – – (0.5) (0.3)
The above outstanding balances arose during the ordinary course of business and are on substantially the same terms, including interest rates, as for comparable transactions with third parties.
7.11Commitments and
contingencies
COMMITMENTS AND CONTINGENCIES IN BRIEFA commitment is future expenditure that is committed to as at 31 December 2014. These commitments primarily consist of contracted capital expenditure.
Contingent liabilities include bank loan and bond issue guarantees.
(i) CommitmentsCapital expenditure for the Company contracted as at 31 December 2014 but for which no provision has been made in the financial statements amounted to £0.1m (2013: £nil).
(ii) Operating leasesThe Company has £57.4m of operating lease obligations (2013: £39.5m).
(iii) Pensions contributionsThe Company has an obligation to make a series of special contributions to The Bupa Pension Scheme for the years ending 31 December 2015 and 31 December 2016, details of which are set out in Section 3.6.
In addition, Bupa Finance plc has entered into a legally binding and irrevocable guarantee for the benefit of the Trustees of The Bupa Pension Scheme in respect of these payments.
(iv) Contingent assets and liabilitiesThe Company has given guarantees in respect of the £350.0m bond issued in 2014 by Bupa Finance plc.
The Company is party to an £800.0m revolving credit facility, together with various other companies within the Group. The revolving credit facility was drawn down by £nil at 31 December 2014 (2013: £150.0m).There are £6.4m of outstanding letters of credit required for general business purposes. The Company has joint and several liability for all obligations under the agreement.

FIN
AN
CIA
L STAT
EM
EN
TS
131BUPA ANNUAL REPORT 2014
COMPANY PRIMARY STATEMENTS AND ASSOCIATED NOTES
8.0Five year financial summary
FIVE YEAR FINANCIAL SUMMARY IN BRIEFThe five year financial summary provides a five year time summary in order to better understand trends.
2014£m
2013 £m
2012£m
2011£m
2010£m
Revenues – segmental analysisAustralia and New Zealand 3,759.6 3,791.8 3,554.0 3,252.8 2,804.0UK 2,711.2 2,573.5 2,528.8 2,506.2 2,593.7Spain and Latin America Domestic 1,842.5 1,363.5 1,190.8 1,212.6 1,151.4International Development Markets 506.7 377.3 227.3 244.2 262.0Bupa Global 958.7 953.0 872.0 795.9 765.3Net reclassifications to other expenses or financial income and expenses (0.9) (0.4) 0.9 4.4 (0.6)Unallocated central revenues – – 0.1 2.0 0.2Consolidated total revenues 9,777.8 9,058.7 8,373.9 8,018.1 7,576.0
Claims and expensesOperating expenses (including claims) (9,143.9) (8,497.8) (7,840.4) (7,496.2) (7,156.2)Impairment of goodwill – (20.7) – (165.8) (249.2)Impairment of other intangible assets arising on business combinations (0.7) (12.8) – (133.7) (17.7)Other income and charges 12.9 (7.1) (3.2) (22.9) (54.0)Total claims and expenses (9,131.7) (8,538.4) (7,843.6) (7,818.6) (7,477.1)
Profit before financial income and expense 646.1 520.3 530.3 199.5 98.9Financial expense and income (36.9) (5.9) 54.8 20.5 19.1Profit before taxation expense 609.2 514.4 585.1 220.0 118.0
Taxation expense (86.4) (103.0) (134.9) (84.1) (131.4)
Profit for the financial year 522.8 411.4 450.2 135.9 (13.4)
Attributable to:Bupa 515.7 405.6 439.7 131.1 (19.2)Non-controlling interests 7.1 5.8 10.5 4.8 5.8Profit for the financial year 522.8 411.4 450.2 135.9 (13.4)
EquityProperty revaluation reserve 707.9 700.2 631.9 642.7 660.5Income and expenditure reserve 4,590.7 3,940.6 3,544.9 3,075.9 3,019.1Cash flow hedge reserve 20.0 25.0 25.1 29.0 30.7Foreign exchange translation reserve 71.4 182.8 590.1 662.7 656.1Equity attributable to Bupa 5,390.0 4,848.6 4,792.0 4,410.3 4,366.4Equity attributable to non-controlling interests 78.4 22.2 25.9 33.6 29.7Total equity 5,468.4 4,870.8 4,817.9 4,443.9 4,396.1

132BUPA ANNUAL REPORT 2014
FIVE YEAR FINANCIAL SUMMARY
Notes to the Financial Statements (CONTINUED)
for the year ended 31 December 2014
INTERNATIONAL FINANCIAL REPORTING STANDARDS RELEVANT TO BUPA
International Financial Reporting Standards (IFRS)IFRS 3 Business combinations IFRS 4 Insurance contracts IFRS 5 Non-current assets held for sale and discontinued
operations IFRS 7 Financial instruments: DisclosuresIFRS 8 Consolidated Financial StatementsIFRS 10 Joint arrangements IFRS 11 Operating segmentsIFRS 12 Disclosure of Interests in other entities IFRS 13 Fair Value Measurement
International Accounting Standards (IAS)IAS 1 Presentation of financial statements IAS 2 Inventories IAS 7 Cash flow statements IAS 8 Accounting policies, changes in accounting estimates
and errors IAS 10 Events after the balance sheet date IAS 12 Income taxes IAS 16 Property, plant and equipment IAS 17 Leases IAS 18 Revenue IAS 19R Employee benefitsIAS 20 Accounting for Government Grants and Disclosure of
Government Assistance IAS 21 The effects of changes in foreign exchange rates IAS 23 Borrowing costsIAS 24 Related party disclosuresIAS 27 Consolidated and separate financial statements IAS 28 Investments in associates
IAS 32 Financial instruments: Presentation IAS 36 Impairment of assets IAS 37 Provisions, contingent liabilities and contingent assets IAS 38 Intangible assets IAS 39 Financial instruments: Recognition and measurement IAS 40 Investment property
InterpretationsIFRIC 4 Determining whether an arrangement contains a leaseIFRIC 9 Reassessment of embedded derivativesIFRIC 10 Interim financial reporting and impairmentIFRIC 12 Service concession arrangementsIFRIC 13 Customer loyalty programmesIFRIC 14 The limit on a defined benefit asset, minimum funding
requirements and their interactionIFRIC 16 Hedges of a net investment in a foreign operationIFRIC 17 Distributions of non-cash assets to ownersIFRIC 18 Transfer of assets from customersIFRIC 21 LeviesSIC 15 Operating leases – incentivesSIC 27 Evaluating the substance of transactions involving the legal
form of a leaseSIC 29 Service concession arrangements: DisclosuresSIC 32 Intangible assets – website costs
This document may contain certain forward-looking statements with respect to certain of The British United Provident Association Limited group’s (‘Bupa’s’) plans and its current goals and expectations relating to future financial condition, performance and results. By their nature forward-looking statements involve risk and uncertainty because they relate to future events and circumstances which are beyond Bupa’s control, including, among others, global economic and business conditions, market related risks such as fluctuations in interest rates and exchange rates, the policies and actions of governmental and regulatory authorities, the impact of competition, the timing, impact and other uncertainties of future mergers or combinations within relevant industries. As a result, Bupa’s actual future condition, performance and results may differ materially from the plans, goals and expectations set out in Bupa’s forward-looking statements. Bupa does not undertake to update forward-looking statements contained in this document or any other forward-looking statement it may make.

This report has been printed on Vision Superior – an FSC® certified paper containing 100% ECF pulp and manufactured at a mill accredited with the ISO 14001 and EMAS environmental standards.
Designed and produced by SALTERBAXTER MSLGROUP
Printed by CPI Colour. CPI Colour are ISO 14001 certified, CarbonNeutral, alcohol free and FSC and PEFC Chain of Custody certified.

BU
PA A
NN
UA
L RE
PO
RT 20
14
REGISTERED OFFICEBupa House15–19 Bloomsbury WayLondon WC1A 2BA
FOR FURTHER COPIES OF THIS DOCUMENT+44 (0)20 7656 2300
CORPORATE AFFAIRS+44 (0)20 7656 2273
The British United Provident Association Limited is a company limited by guarantee.
Registered in England No. 432511.
‘Bupa’ and the Heartbeat logo are registered service marks.
RA / 2014Annual Report 2014
bupa.com/annualreport
Longer, healthier, happier lives
BU
PA A
NN
UA
L RE
PO
RT 20
14
Our cover photo features Occupational Therapist Ereshini Bhoola at work in one of Bupa’s 15 hospitals around the world. Our occupational therapists help people with mental, physical or social disabilities to independently carry out everyday tasks. In this picture, Ereshini demonstrates using a cooking basket to boil vegetables safely, promoting independence in the kitchen.