Bumpy Journey to a New Normal - Coming Soonmacpamedia.org/media/downloads/2011CTC/Econ_upd… ·...
16
1 1 September 22, 2011 Presented by: John B. Jung, Jr., Senior Managing Director, BB&T Capital Markets Bumpy Journey to a New Normal MACPA Presentation 2 Important Disclaimers BB&T Capital Markets is a division of Scott & Stringfellow, LLC. Member NYSE/FINRA/SIPC. Scott & Stringfellow, LLC, is a wholly-owned, nonbank subsidiary of BB&T Corporation. Securities and insurance products or annuities sold, offered or recommended are not a deposit, not FDIC insured, not bank guaranteed, not insured by any federal government agency and may lose value. The information contained herein, while not guaranteed by BB&T Capital Markets, has been obtained from sources which we believe to be reliable and accurate. This material is not to be considered an offer or solicitation regarding the sale of any security. Discussions of past performance do not imply a guarantee of future results. Comments regarding tax implications are informational only. Scott & Stringfellow and its representatives do not provide tax or legal advice. You should consult your individual tax or legal professional before taking any action that may have tax or legal consequences.
-
Upload
nguyendung -
Category
Documents
-
view
218 -
download
2
Transcript of Bumpy Journey to a New Normal - Coming Soonmacpamedia.org/media/downloads/2011CTC/Econ_upd… ·...

1
1September 22, 2011
Presented by:
John B. Jung, Jr., Senior Managing Director, BB&T Capital Markets
Bumpy Journey to a New NormalMACPA Presentation
2
Important Disclaimers
BB&T Capital Markets is a division of Scott & Stringfellow, LLC. Member NYSE/FINRA/SIPC. Scott & Stringfellow, LLC, is a wholly-owned, nonbank subsidiary of BB&T Corporation. Securities and insurance
products or annuities sold, offered or recommended are not a deposit, not FDIC insured, not bank guaranteed, not insured by any federal government agency and may lose value.
The information contained herein, while not guaranteed by BB&T Capital Markets, has been obtained from sources which we believe to be reliable and accurate. This material is
not to be considered an offer or solicitation regarding the sale of any security.
Discussions of past performance do not imply a guarantee of future results.
Comments regarding tax implications are informational only. Scott & Stringfellow and its representatives do not provide tax or legal advice. You should consult your individual tax or legal professional before
taking any action that may have tax or legal consequences.
2
3
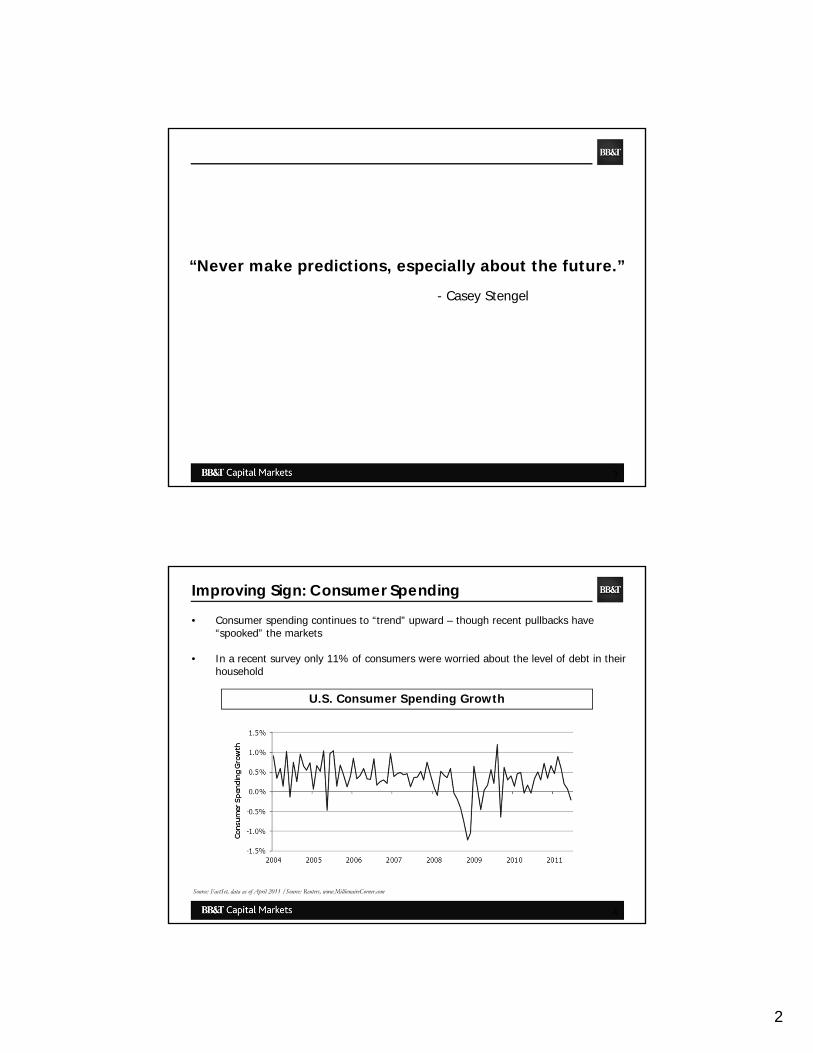
“Never make predictions, especially about the future.”
- Casey Stengel
4
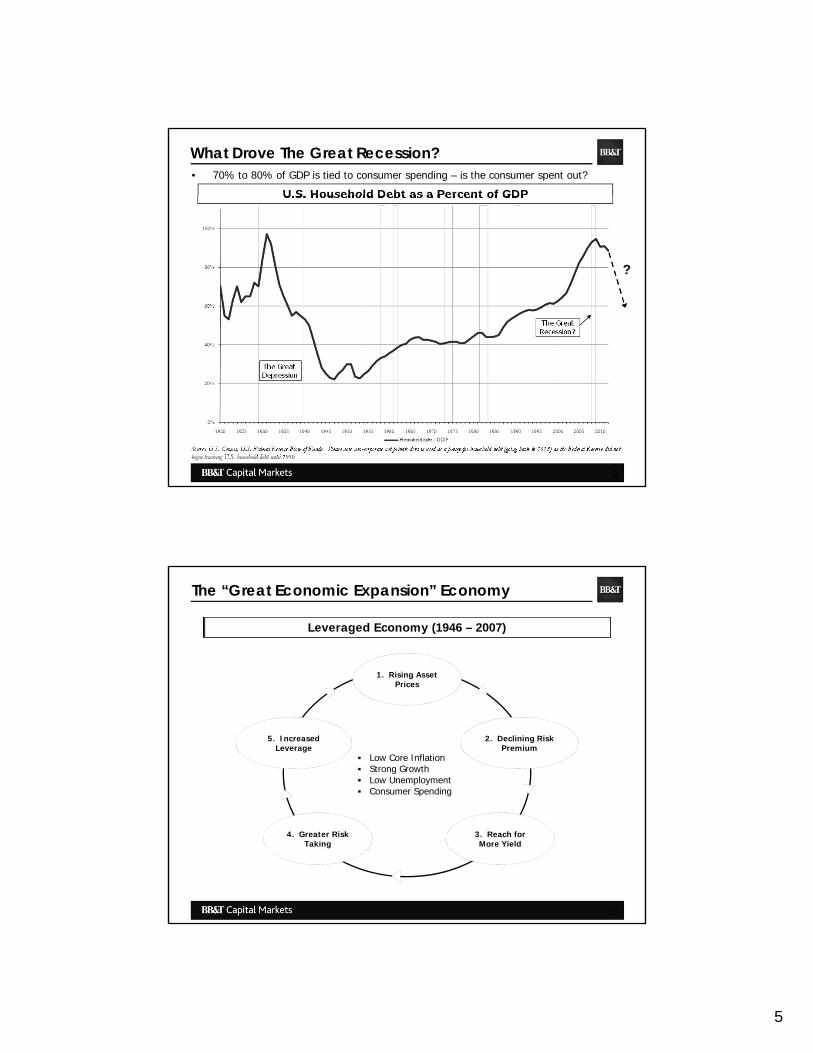
• Consumer spending continues to “trend” upward – though recent pullbacks have “spooked” the markets
• In a recent survey only 11% of consumers were worried about the level of debt in their household
Improving Sign: Consumer Spending
Source: FactSet, data as of April 2011 /Source: Reuters, www.MillionaireCorner.com
U.S. Consumer Spending Growth

3
5
• Manufacturing has shown a similar trend – the recovery has been even stronger than consumer spending – though again the latest numbers “spooked” the market
Improving Sign: Manufacturing
Source: ISM, BBTCM Research
ISM Manufacturing New Orders Index
6
Positive Sign: Long-Term Trend in GDP Growth
Source: VisualizingEconomics; MorningWorth
Long-Term Real Growth in U.S. GDP Per Capita (1871-2009)

4
7
Why doesn’t the recovery feel better?• The most recent recession is technically behind us - it was only slightly above average
in terms of duration
Length of U.S. Recessions (1900-Present)
Source: National Bureau of Economic Research
Average length of recession
8
And Why Do the Effects Continue To Be Felt?
(1) Covers eight recession cycles going back to 1950 (does not include the truncated 1980 recession)(2) As of July 2011Source: Haver Analytics, Gluskin Sheff, U.S. Census, U.S. Bureau of Economic Analysis, U.S. Federal Reserve, U.S. Treasury
• The recovery has been much slower and less pronounced than the recovery periods from all recessions since 1950
Percentage Change in Economic Indicators Following Recession
Average, 33 Months After The Start of Recession (1) Current Cycle (from the end of 2007) (2)
What is normal … … What we are dealing with
5
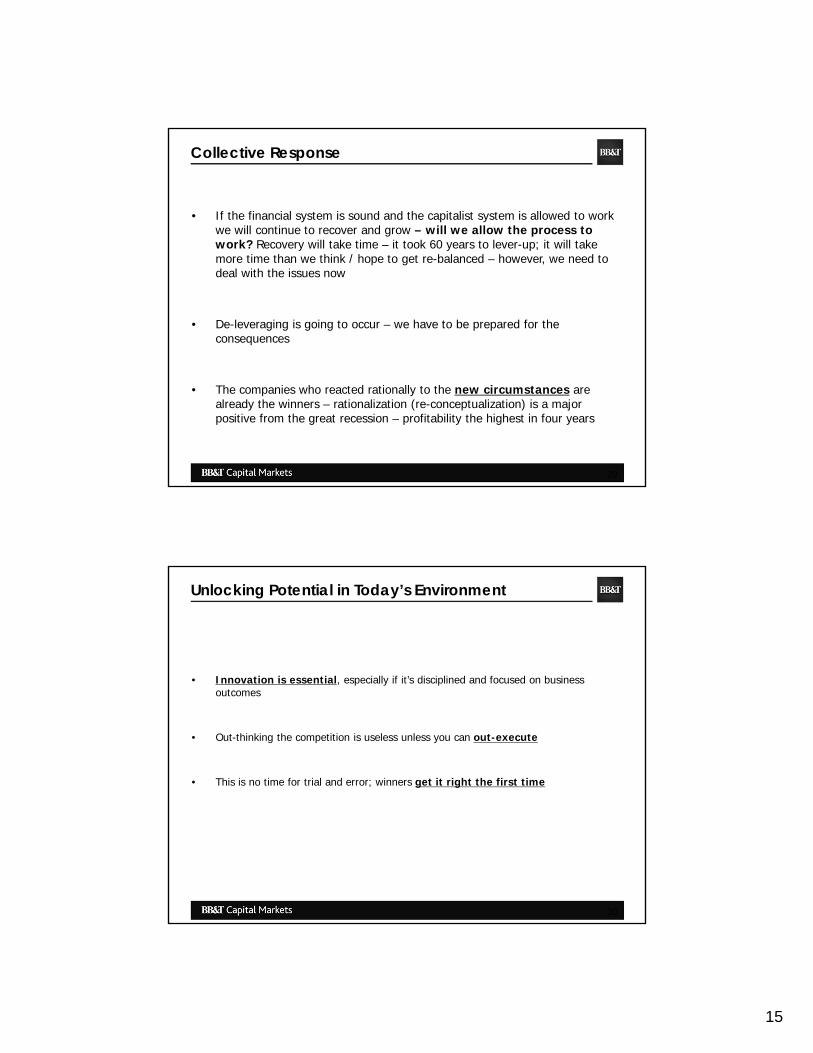
The Great Depression
?
The Great Recession?
9
Source: U.S. Census, U.S. Federal Reserve Flow of Funds. Please note non-corporate net private debt is used as a proxy for household debt (going back to 1918) as the Federal Reserve did notbegin tracking U.S. household debt until 1950
U.S. Household Debt as a Percent of GDP
What Drove The Great Recession?• 70% to 80% of GDP is tied to consumer spending – is the consumer spent out?
10
Leveraged Economy (1946 – 2007)
Low Core Inflation Strong Growth Low Unemployment Consumer Spending
2. Declining Risk Premium
3. Reach for More Yield
4. Greater Risk Taking
5. Increased Leverage
1. Rising Asset Prices
The “Great Economic Expansion” Economy

6
11
De-Leveraged Economy (2007 - ?)
Large Write Downs Limited Growth Higher Unemployment Lower Consumer Spending
2. Increasing Risk Premium
3. Need for Liquidity
4. Flight to Safety
5. Reduced Leverage
1. Declining Asset Prices
The “New Normal” Economy?
12
“New Normal” Characteristics
“This country had a huge, huge wound…It takes time for wounds to heal, regardless of how good the care is.”
-Warren Buffet
• Muted economic growth
• Persistently high unemployment and growing underemployment
• Continued asset re-pricing / Continued de-leveraging
• Globally Competitive Marketplace
• Large public deficits and debt
• Regulatory uncertainty / Greater government role in the economy / increasingly political tone

7
13
New Normal Characteristics - Employment• The total number of unemployed is approximately 13.9 million and 6.2 million have been
unemployed for six months or more (chronic unemployment)
• There are over 25 million people unemployed, disillusioned (1.1 million Americans have given up looking), or underemployed.
• The average length of time a person is unemployed is 40.4 weeks – the longest period ever.
• Policy measures aimed at encouraging companies to hire more people have had little or no effect .
Source: U.S. Department of Labor; Bureau of Labor Statistics; FactSet, Associated Press
U.S. Unemployment Rate and Number of Workers UnemployedNumber of Workers Employed
14
• 6.2 million Americans have been out of work for longer than six months.
Source: Bureau of Labor Statistics
Long-Term Unemployment
New Normal Characteristics – Long-Term Unemployed

8
15
• Although the U.S. has lost nearly 8 million factory jobs since manufacturing employment peaked in mid-1979, U.S. manufacturers have placed near the top of the world rankings in productivity gains over the past three decades
• The U.S. remains the No. 1 manufacturing country in the world, out-producing No. 2 China by a staggering 25%
• Is increased investment (and increased productivity) the other side of the employment coin? Will this lead to increasing “on-shoring” of manufacturing?
Source: U.S. Department of Labor; Bureau of Labor Statistics; FactSet, Associated Press
U.S. Labor Productivity
New Normal Characteristics - Productivity
16
Source: U.S. Census Bureau, National Association of Realtors, BBTCM Research, FactSet, Standard & Poor’s, Financial Times, NY Times
• 5.5 million U.S. Households are tied to mortgages 20% or more above value
– 1 of 8 mortgages were 30 days or longer past due or in the foreclosure process at the end of the second quarter, representing 6.3 million households
– Home price declines are accelerating according to a WSJ report.
• Real estate experts now believe it will take 20 years to recoup the $6 trillion worth of housing value destruction seen in the last five years…after adjusting for inflation, values will never catch up
• Will GSE restructuring and a change in the mortgage interest deduction affect home prices?
Home Price IndicesU.S. Real Wage Growth
New Normal Characteristics – Housing Prices

9
17
Source: U.S. Census Bureau, National Association of Realtors, BBTCM Research, FactSet, Wall Street Journal
• Housing affordability below pre-recession levels – the ratio of housing prices to annual household income has fallen from 2.3x during the peak of the bubble all the way back to 1.6x (well below the average of 1.9x).
U.S. New Home Sales
New Normal Characteristics – Housing Affordability
18
New Normal Characteristics – De-Leveraging
Source: FactSet, data as of August 29, 2011
• The S&P 500 has been flat for the last decade; at the same time earnings have risen 75%; resulting in the price to earnings level being down 43%
S&P 500 Price To EarningsHistorical Index Performance

10
19
New Normal Characteristics – Global Marketplace• Increased Economic Opportunity
• BRIC (Brazil, Russia, India & China) countries– The fastest growing and largest emerging market economies in the world
• European Union
– PIIGS (Portugal, Italy, Ireland, Greece & Spain) countries owe the “Big Three” of Europe (Germany, France, and Great Britain) more than $2 trillion in debt
– Influence on the world economy is waning?
• Middle East Unrest
– World’s oil supply– Export Terrorism
• Global Disasters
– Japan– Australia
Source: Forbes, Wall Street Journal, The Economist
20
New Normal Characteristics – Global Marketplace
Source: Bureau of Economic Analysis
• After-tax corporate profits were up 9.0% from July 2010 and are at a record high of 10.1%of GDP.
• How much of the performance is related to the global economy – growth in international markets?
Corporate Profits vs. Nominal GDP

11
21
U.S. Gross Federal Debt
Source: Congressional Budget Office; US Department of the Treasury.; These figures represent federal debt that is subject to limitations only
• Since the 1950’s we have borrowed on average 2% of GDP / in 2010 and 2011 we will average 10% of GDP
• What happens when interest rates start to rise – at this time can we even let interest rates rise? What are the implications of keeping them low?
New Normal Characteristics – Large Public Deficits and Debt
22
• The gap between federal receipts and spending as a percentage of GDP continues to widen.
New Normal Characteristics – Large Public Deficits and Debt
Source: The Wall Street Journal
Widening Federal Budget Gap

12
23
• Entitlement and net interest spending, on its current course, will eclipse government revenues in 2025.
• When do we hit the absolute debt ceiling – have we already spent the money?
New Normal Characteristics – Large Public Deficits and Debt
Source: KPCB, Congressional Budget Office, The Economist
U.S. Federal Budget as a Percentage of GDP
24
• President Obama’s FY 2012 Budget proposes another $3.7 trillion dollars in federal outlays and expenditures.
• The U.S. federal budget is approximately 25% of U.S. GDP
New Normal Characteristics – Large Public Deficits and Debt
Source: KPCB, Congressional Budget Office, The Economist
U.S. Federal Budget Detail

13
25
New Normal Characteristics – Large Public Deficits and Debt
• Budget Alternatives:
– Raise Taxes• From 1951 through 1963, the U.S. maintained extremely high marginal tax
rates. The lowest rate of federal income tax was 20%, and the highest equaled 91%. The tax structure back then generated revenue equal to 7.7% of GDP. Marginal rates were lowest from 1988 through 1990, when the lowest rate was 15% and the highest rate was 28%. With that structure, federal income taxes brought in revenue equal to 8.1% of GDP. (WSJ)
• High marginal tax rates are a proven disincentive to invest• Do wealthy people (Warren Buffett) pay taxes?
– Cut Expenditures• In 2011 we will borrow 10% of GDP – what are the effects of cutting 10%
of GDP(assuming a balance budget)?• What are the social consequences of cutting entitlements?• What are the international consequences of cutting defense?
• Do the government have the ability to control the inevitable de-leveraging?
Source: Forbes, Wall Street Journal, The Economist
26
• Is the current regulatory environment undermining the recovery – are regulatory costs an anchor around the neck of the economy?
• Should we support housing or let prices fall where they may – if we support housing what are the short and long term consequences?
• Does government have a responsibility to “create” jobs – are there effective policy measures or do we need to take a hands off approach?
• Even though there is no concrete evidence stimulus or quantitative easing worked in any form – do we have to implement one or both just to show effort?
• Which is a bigger problem – deflation (asset bubbles bursting – inability to pay collective debt) or inflation (lower standard of living - the ability to pay back our collective debt)?
Unusually Uncertain Outlook
“The future ain’t what it used to be.”-Yogi Berra

14
27
“We can’t solve problems by using the same kind of thinking we used when we created them”
- Albert Einstein
28
1. Regulatory Overhaul
• By any measure the regulatory burden and cost to our economy is excessive. Many measures were well intentioned but the bureaucratic system has taken on a life of its own and the costs far outweigh the benefits. A top to bottom regulatory review is necessary to insure our global competiveness.
2. Tax Code Reform
• No matter how you feel about the level of taxes a complete reform (overhaul) of the tax code is needed. A cogent and coherent code will lead to a conviction of certainty which will allow capital to make informed decisions. Uncertainty about the present and future code is anathema to a healthy and growing economy.
3. Fiscal Restraint
• The current spending message out of Washington is on point – invest in education and technology and infrastructure to spur growth – but have we already spent the money?
• In order to drive the engine of growth two things have to happen; Everyone will get less and Everyone will pay more – and that involves defense and entitlements
Government Response
15
29
• If the financial system is sound and the capitalist system is allowed to work we will continue to recover and grow – will we allow the process to work? Recovery will take time – it took 60 years to lever-up; it will take more time than we think / hope to get re-balanced – however, we need to deal with the issues now
• De-leveraging is going to occur – we have to be prepared for the consequences
• The companies who reacted rationally to the new circumstances are already the winners – rationalization (re-conceptualization) is a major positive from the great recession – profitability the highest in four years
Collective Response
30
• Innovation is essential, especially if it’s disciplined and focused on business outcomes
• Out-thinking the competition is useless unless you can out-execute
• This is no time for trial and error; winners get it right the first time
Unlocking Potential in Today’s Environment

16
Run Faster, Jump Higher
P. F. Flyer Approach
32
Working Together