BULGARIA Social Inclusion Project - ieg.worldbankgroup.org · World Bank office in Sofia for the...
133
Report No. 124861 JUNE 26, 2018 BULGARIA Social Inclusion Project
Transcript of BULGARIA Social Inclusion Project - ieg.worldbankgroup.org · World Bank office in Sofia for the...

Report No. 124861
JUNE 26, 2018
BULGARIA
Social Inclusion Project

© 2018 International Bank for Reconstruction
and Development / The World Bank
1818 H Street NW
Washington DC 20433
Telephone: 202-473-1000
Internet: www.worldbank.org
Attribution—Please cite the work as follows:
World Bank. 2018. Bulgaria—Social Inclusion
Project. Independent Evaluation Group, Project
Performance Assessment Report 124861
Washington, DC: World Bank.
This work is a product of the staff of The World
Bank with external contributions. The findings,
interpretations, and conclusions expressed in
this work do not necessarily reflect the views of
The World Bank, its Board of Executive
Directors, or the governments they represent.
The World Bank does not guarantee the
accuracy of the data included in this work. The
boundaries, colors, denominations, and other
information shown on any map in this work do
not imply any judgment on the part of The
World Bank concerning the legal status of any
territory or the endorsement or acceptance of
such boundaries.
RIGHTS AND PERMISSIONS
The material in this work is subject to copyright.
Because The World Bank encourages
dissemination of its knowledge, this work may be
reproduced, in whole or in part, for
noncommercial purposes as long as full
attribution to this work is given.
Any queries on rights and licenses, including
subsidiary rights, should be addressed to
World Bank Publications, The World Bank
Group, 1818 H Street NW, Washington, DC
20433, USA; fax: 202-522-2625; e-mail:

Report No.: 124861
PROJECT PERFORMANCE ASSESSMENT REPORT
BULGARIA
SOCIAL INCLUSION PROJECT
(IBRD NO. 76120)
June 26, 2018
Human Development and Economic Management
Independent Evaluation Group

ii
Currency Equivalents (annual averages)
Currency Unit = Bulgarian Lev (Lev)
2009 $1.00 Lev 1.40
2010 $1.00 Lev 1.47
2011 $1.00 Lev 1.40
2012 $1.00 Lev 1.52
2013 $1.00 Lev 1.47
2014 $1.00 Lev 1.47
2015 $1.00 Lev 1.76
2016 $1.00 Lev 1.76
Abbreviations and Acronyms
CBO community-based organization
ECD early childhood development
ESF European Social Fund
EU European Union
GDP gross domestic product
ICR Implementation Completion and Results Report
IEG Independent Evaluation Group
MLSP Ministry of Labour and Social Policy
M&E monitoring and evaluation
NGO nongovernmental organization
OP HRD Operational Program Human Resources Development [of the Government of Bulgaria]
PAD project appraisal document
PDO project development objective
PPAR Project Performance Assessment Report
SID Social Inclusion Directorate
SIF Social Investment Fund
SIP Social Inclusion Project
UNICEF United Nations Children’s Fund
All dollar amounts are U.S. dollars unless otherwise indicated.
Fiscal Year
Government: January 1–December 31
Director-General, Independent Evaluation Ms. Caroline Heider
Director, Human Development and Economic Management Mr. Auguste Tano Kouame
Manager, Corporate and Human Development Ms. Emanuela Di Gropello
Task Manager Ms. Susan A. Caceres

iii
Contents
Principal Ratings ................................................................................................................. v
Key Staff Responsible......................................................................................................... v
Preface............................................................................................................................... vii
Summary ............................................................................................................................ ix
1. Background and Context................................................................................................. 1
General Background ....................................................................................................... 1
Social Inclusion ............................................................................................................... 2
Early Childhood Development and School Readiness ................................................... 3
World Bank and Other Support ...................................................................................... 3
2. Objectives, Design, and Their Relevance ....................................................................... 4
Project Development Objective ...................................................................................... 4
Relevance of Objective ................................................................................................... 4
Project Design ................................................................................................................. 5
Relevance of Design ....................................................................................................... 6
3. Implementation ............................................................................................................... 8
Key Dates ........................................................................................................................ 8
Planned versus Actual Costs, Financing, and Disbursements ........................................ 8
Project Restructuring ...................................................................................................... 9
Factors Affecting Implementation .................................................................................. 9
Safeguards Compliance ............................................................................................ 11
Financial Management and Procurement.................................................................. 11
4. Achievement of Objective ............................................................................................ 11
5. Efficiency ...................................................................................................................... 21
6. Ratings .......................................................................................................................... 22
Outcome ........................................................................................................................ 22
Risk to Development Outcome ..................................................................................... 23
Bank Performance ......................................................................................................... 24
Borrower Performance .................................................................................................. 26
Quality of Monitoring and Evaluation .......................................................................... 27
7. Lessons .......................................................................................................................... 29
This report was prepared by Denise Anne Vaillancourt, who assessed the project in February 2018, with the
technical input of Rosen Asenov, Bulgarian consultant. The report was peer reviewed by Gisela M. Garcia
and panel reviewed by Soniya Carvalho. Aline Dukuze provided administrative support.

iv
Bibliography ..................................................................................................................... 31
Appendixes
Appendix A. Basic Data Sheet.......................................................................................... 39
Appendix B. National Policies on Social Inclusion and Early Childhood Development
and Relevant World Bank Portfolio .................................................................................. 41
Appendix C. Costs, Financing and Disbursements ........................................................... 53
Appendix D. Statistical Data and Results ......................................................................... 56
Appendix E. List of People Met ....................................................................................... 99
Appendix F. Borrower Comments .................................................................................. 107

v
Principal Ratings
ICR* ICR Review* PPAR
Outcome Moderately
satisfactory
Moderately
satisfactory
Moderately
satisfactory
Risk to Development
Outcome
Low or negligible Moderate Moderate
Bank Performance Moderately
satisfactory
Moderately
satisfactory
Moderately
satisfactory
Borrower Performance Moderately
satisfactory
Moderately
satisfactory
Moderately
satisfactory
* The Implementation Completion and Results (ICR) report is a self-evaluation by the responsible World Bank global practice. The ICR Review is an intermediate IEG product that seeks to independently validate the findings of the ICR.
Key Staff Responsible
Project Appraisal Completion
Task Manager/Leader Christian Bodewig Plamen Nikolov Danchev
Sector Manager or
Practice Manager
Arup Banerji and
Kathy Lindert
Mario Cristian Aedo Inostroza
Sector Director or
Senior Global Practice
Director
Tamar Manuelyan Atinc Claudia Maria Costin
Country Director Orsalia Kalantzopoulos Arup Banerji
Country Manager Florian Fichtl Antony Thompson

vi
IEG Mission: Improving World Bank Group development results through excellence in independent evaluation.
About this Report
The Independent Evaluation Group (IEG) assesses the programs and activities of the World Bank for two purposes: first, to ensure the integrity of the World Bank’s self-evaluation process and to verify that the World Bank’s work is producing the expected results, and second, to help develop improved directions, policies, and procedures through the dissemination of lessons drawn from experience. As part of this work, IEG annually assesses 20–25 percent of the World Bank’s lending operations through fieldwork. In selecting operations for assessment, preference is given to those that are innovative, large, or complex; those that are relevant to upcoming studies or country evaluations; those for which Executive Directors or World Bank management have requested assessments; and those that are likely to generate important lessons.
To prepare a Project Performance Assessment Report (PPAR), IEG staff examine project files and other documents, visit the borrowing country to discuss the operation with the government, and other in-country stakeholders, interview World Bank staff and other donor agency staff both at headquarters and in local offices as appropriate, and apply other evaluative methods as needed.
Each PPAR is subject to technical peer review, internal IEG panel review, and management approval. Once cleared internally, the PPAR is commented on by the responsible World Bank country management unit. The PPAR is also sent to the borrower for review. IEG incorporates both World Bank and borrower comments as appropriate, and the borrowers’ comments are attached to the document that is sent to the World Bank’s Board of Executive Directors. After an assessment report has been sent to the Board, it is disclosed to the public.
About the IEG Rating System for Public Sector Evaluations
IEG’s use of multiple evaluation methods offers both rigor and a necessary level of flexibility to adapt to lending instrument, project design, or sectoral approach. IEG evaluators all apply the same basic method to arrive at their project ratings. Following is the definition and rating scale used for each evaluation criterion (additional information is available on the IEG website: http://ieg.worldbankgroup.org).
Outcome: The extent to which the operation’s major relevant objectives were achieved, or are expected to be achieved, efficiently. The rating has three dimensions: relevance, efficacy, and efficiency. Relevance includes relevance of objectives and relevance of design. Relevance of objectives is the extent to which the project’s objectives are consistent with the country’s current development priorities and with current World Bank country and sectoral assistance strategies and corporate goals (expressed in Poverty Reduction Strategy Papers, Country Assistance Strategies, sector strategy papers, and operational policies). Relevance of design is the extent to which the project’s design is consistent with the stated objectives. Efficacy is the extent to which the project’s objectives were achieved, or are expected to be achieved, taking into account their relative importance. Efficiency is the extent to which the project achieved, or is expected to achieve, a return higher than the opportunity cost of capital and benefits at least cost compared with alternatives. The efficiency dimension is not applied to development policy operations, which provide general budget support. Possible ratings for outcome: highly satisfactory, satisfactory, moderately satisfactory, moderately unsatisfactory, unsatisfactory, highly unsatisfactory.
Risk to Development Outcome: The risk, at the time of evaluation, that development outcomes (or expected outcomes) will not be maintained (or realized). Possible ratings for risk to development outcome: high, significant, moderate, negligible to low, and not evaluable.
Bank Performance: The extent to which services provided by the World Bank ensured quality at entry of the operation and supported effective implementation through appropriate supervision (including ensuring adequate transition arrangements for regular operation of supported activities after loan or credit closing, toward the achievement of development outcomes). The rating has two dimensions: quality at entry and quality of supervision. Possible ratings for Bank performance: highly satisfactory, satisfactory, moderately satisfactory, moderately unsatisfactory, unsatisfactory, and highly unsatisfactory.
Borrower Performance: The extent to which the borrower (including the government and implementing agency or agencies) ensured quality of preparation and implementation, and complied with covenants and agreements, toward the achievement of development outcomes. The rating has two dimensions: government performance and implementing agency(ies) performance. Possible Ratings for borrower performance: highly satisfactory, satisfactory, moderately satisfactory, moderately unsatisfactory, unsatisfactory, and highly unsatisfactory.

vii
Preface
This is the Project Performance Assessment Report (PPAR) for the Social Inclusion
Project in Bulgaria.
A loan (IBRD 76120) of €40 million (equivalent to $59 million) for the Social Inclusion
Project was approved on November 4, 2008. The financing plan also included
contributions of €73.43 million from government (including European Social Fund
financing for a nationwide program rollout) and €23.30 million from communities for a
total cost of €136.73 million. The loan became effective on April 16, 2009 and closed on
December 31, 2015. The loan closed 26 months after the original closing date because of
implementation delays caused by changes in implementing arrangements and severe
government caps on project expenditure precipitated by the 2008 global economic crisis.
The total project cost at closing was €25.99 million equivalent. A total of €23.58 million
was disbursed: 59 percent of the original loan and 75 percent of the revised amount of
€31.39 million (after €8.61 million was canceled in July 2013). An amount of €7.81
million was not disbursed.
This report assesses project performance and outcomes\ based on fieldwork and a review
of project documents, the Implementation Completion and Results Report (ICR), aide-
mémoire, supervision reports, and other relevant data, research, and material. Rosen
Asenov, local consultant, and Denise Anne Vaillancourt, international consultant,
undertook a mission to Bulgaria in February 2018, during which they conducted
interviews with officials and technical staff, service delivery personnel, local and
municipal authorities, civil society organizations, beneficiaries, relevant development
partners, and other involved persons. They visited five municipalities: Byala Slatina,
Haskovo, Pazardzhik, Plovdiv, and Pravets. Interviews were also conducted with relevant
World Bank staff. The Independent Evaluation Group (IEG) gratefully acknowledges all
those who made time for interviews and generously provided documents and information,
especially those in the municipalities visited. IEG also expresses its gratitude to the
World Bank office in Sofia for the technical, logistical, and administrative support
provided to the mission. Appendix E is a list of persons consulted.
This report serves an accountability purpose by evaluating the extent to which the
operation achieved its intended outcomes. It also seeks to draw lessons to inform and
guide future investments in early childhood development and social inclusion. This
assessment complements the ICR prepared by the World Bank’s operations teams with
borrower contributions and IEG’s desk review (ICR Review) by providing an
independent, field-based assessment more than two years after the project’s closing.
Additionally, this project was chosen for a field evaluation because of its pilot nature and
potential for lessons, and because of its relevance to an IEG synthesis study on service
delivery and behavior change assessment frameworks.

viii
Following standard IEG procedures, a copy of the draft PPAR was sent to relevant
government officials and organizations for review. Comments were received and are
attached as appendix F.

ix
Summary
Bulgaria is a middle-income country that joined the European Union (EU) in 2007. After
setbacks in social well-being and economic growth precipitated by the 2008 global economic
crisis, Bulgaria has recently made progress in improving economic performance and reducing
poverty. However, it faces the formidable challenge of addressing persistent pockets of
poverty and social exclusion. Poverty in Bulgaria is linked with low levels of education, high
unemployment, rural residence, belonging to an ethnic minority, female gender, and old age.
Social exclusion is both a cause of poverty and a consequence. Fighting poverty and social
exclusion is a priority of Bulgaria, and education a key component of its national policies.
The objective of the Social Inclusion Project (SIP) is “to promote social inclusion through
increasing the school readiness of children below the age of seven, targeting low-income and
marginalized families, including children with a disability and other special needs” (World
Bank 2008a). The objective did not change during the life of the project.
The SIP was designed to support the pilot phase of a national school readiness program
composed of a range of early childhood development (ECD) interventions targeted to low-
income, marginalized children, including those with a disability. The pilot was to be
implemented in about 30 percent of Bulgaria’s 265 municipalities, and the rest of the
municipalities were the control group. Experience and learning under the pilot were expected
to document program effectiveness, contribute to fine-tuning its design, and leverage EU
funding for the nationwide rollout. Support was channeled through two components. The
integrated social and children services component was to provide grants to pilot
municipalities to deliver integrated ECD services to target children and their parents. The
capacity building component was to strengthen national capacity for program management,
implementation, and evidence-based learning and improvement, including support for
baseline, midterm, and impact evaluations. It also aimed to support municipal capacity
building for cross-sectoral cooperation, collaboration with nongovernmental organizations,
and accessing EU funds.
The relevance of the project development objective (PDO) is rated substantial. The PDO is
relevant to country conditions and to Bulgaria’s strategic priorities. A goal of the National
Development Programme: Bulgaria 2020 is to raise living standards through education,
creating conditions for employment and social inclusion, and ensuring health care quality and
access. The program prioritizes improvements to education quality and access, poverty
reduction, and social inclusion. The PDO is also relevant to the World Bank’s Country
Partnership Framework for Bulgaria (FY17–22), whose pillar “investing in people” aims to
enhance school outcomes for better employability and improve access to essential services,
including ECD for the poor and marginalized. However, there are issues with the PDO’s
framing. It was very ambitious to expect achievement of the PDO within a four-year time
frame, especially considering the SIP’s multisectoral nature, civil works program,

x
decentralized implementation, capacity constraints, innovative service delivery, and pilot
approach.
The relevance of the project’s design is rated modest. There were some strong design
elements—for example, a largely plausible results chain for component 1, services tailored to
local needs and contexts, and a pilot approach supporting evidence-based learning before
nationwide rollout. However, there were shortcomings. The results chains supporting
behavior change, learning, and capacity building were not well articulated. Risks identified at
design did not anticipate the difficulty of recruiting the substantial number of professional
service providers, given their limited supply in the country and the low pay levels in the
social services sector. The risk assessment also did not anticipate government-imposed limits
on project expenditure, even though its fit within the government of Bulgaria’s expenditure
ceiling was an issue that had delayed project negotiations.
Implementation. The credit became effective on April 16, 2009 and closed on December 31,
2015. After a slow start (and after the global economic crisis), the government of Bulgaria set
severe expenditure limits for the project, which delayed and compressed the service delivery
period. Civil works delays (linked to expenditure caps) and difficulties recruiting service
delivery staff also slowed implementation. Children were enrolled in kindergarten and
preschool only during the project’s last two years, and services were delivered during the last
six to eight months. Delays and expenditure caps led to elimination of the impact evaluation.
Five restructurings amended implementing arrangements, reallocated more loan proceeds for
municipality grants, revised the results framework, reduced activities, canceled part of the
loan (€8.6 million), and extended the closing date twice. The total cost (€25.99 million) was
65 percent of initial estimates.
Project efficacy is rated substantial. Many service delivery output targets were exceeded—a
laudable feat against the backdrop of substantially delayed and compressed service delivery
time frames. However, these outputs are not a proxy for the outcomes embedded in the PDO.
Eighty percent of children 6–7 years of age and identified as vulnerable, who were exposed
to SIP kindergartens and preschool groups for at least one year, passed school readiness tests,
compared with a 49 percent pass rate in a 2012 matched baseline group. However, evidence
is lacking to assess the efficacy of the targeting of low-income, marginalized children and
their parents (except for disabled children), as was envisaged under the project.
Service delivery outputs and intermediate outcomes. Critical inputs (infrastructure and
1,409 service delivery staff) enabled the creation of new places and increased enrollment in
kindergarten and preschool and the establishment and delivery of integrated social services
for target children in the 66 pilot municipalities. In total, 2,357 new places in kindergartens
and preschools were created—exceeding the 1,600 target—and 4,420 children ages 3–7 years
were newly enrolled in kindergarten and preschool, surpassing the 3,000 target. There is no
breakdown of enrollees to indicate how many came from the low-income, marginalized
groups targeted under the project. The project created 113 community centers for service
delivery, exceeding the target of 68. The number of children who benefited from early

xi
intervention of disabilities services was 4,311, which is twice the target of 2,000 set in 2012
and almost triple the 2013 revised target. An estimated 471 children with disabilities and
special education needs were enrolled in kindergarten or preschool, against a target of 150.
The number of children ages 0–7 who had health checkups was 39,993, which exceeds the
target of 10,000. More than half of these children were reached during the project’s last six
months. A total of 12,864 parents of children ages 0–3 received counseling, exceeding the
target of 10,000; two-thirds of these children were reached during the project’s last six
months. There is no breakdown of beneficiaries by age, income, ethnicity, or mode of
delivery (mobile versus facility-based). Changes in parenting practices and the target
children’s early development, health, nutrition, and well-being were not tracked.
Capacity building outputs and intermediate outcomes. The project financed consultants
and training to strengthen national- and municipal-level capacity, but it did not culminate in
the development of evaluation capacity, systematic learning, or program refinement.
Municipalities improved cross-sectoral cooperation, but collaboration with nongovernmental
organizations was not strengthened. The project was successful in developing municipalities’
capacity to access EU financing. Sixty-four of the 66 pilot municipalities accessed EU
funding to continue service delivery initiated under the SIP. However, delays between the
end of World Bank financing and the start of EU financing averaged six months and caused
breaks in service delivery.
PDO achievement. The only measure of school readiness provided is a comparison of two
sets of school readiness test results, the first conducted in 2012 (the baseline year) and the
second in mid-2015. According to this study, passing rates of school readiness tests taken by
vulnerable children ready to enter primary school increased from 49 percent in 2012 to
80 percent in 2015.
There were shortcomings in the targeting of low-income and marginalized families, including
children with a disability and other special needs. There was some ambiguity in the target
setting for kindergarten enrollments. The project appraisal document is clear in its focus on
target children and establishes enrollment rate indicators for two specific groups: low-income
and marginalized children, and children with a disability. The restructuring eliminated the
“low-income and marginalized” qualifier on the first of these indicators to include all
children, though the PDO was not revised. Municipality contracts included a target stating
that at least 30 percent of new enrollees should be target children. World Bank reports noted
difficulty during implementation in ensuring a sufficient representation of Roma children
within that quota, and advocated its close monitoring and improvement. The Independent
Evaluation Group was unable to obtain these data for independent verification. Although
service delivery output targets were exceeded, as previously noted, project data were not
disaggregated to document the extent to which low-income, marginalized groups were
reached. The reporting on disabled/special needs children was more straightforward. An
anonymous tally of beneficiaries’s responsiveness to the multiple criteria established under
the project for identifying and targeting low-income, marginalized groups would have shed
light on the project’s success in this light.

xii
The school readiness program (and the SIP, which supported its pilot phase) defines short-
term social inclusion outcomes in terms of more equal starting conditions of children
entering primary school. The project included activities to integrate target children in
kindergarten, but it did not systematically track the share of target children among all new
kindergarten enrollees, the equality of their starting conditions at the start of first grade, and
their performance compared with their better-off counterparts.
Project efficiency is rated modest. Investments in ECD can be highly cost-effective, but two
shortcomings are noted: (i) shortcomings in implementing efficiency (significant delays in
implementation, which curtailed the time frame for service delivery and reduced cost
efficiency); and (ii) shortcomings in targeting and reaching the low-income, marginalized
populations (including the failure to harness nongovernmental organizations, community-
based organizations, and other local actors, which could have provided better data, insights,
and reach to communities).
Based on the ratings of PDO and design relevance, efficacy, and efficiency, the project’s
outcome is rated moderately satisfactory.
Risk to development outcome is rated moderate. Sociopolitical risks and government
ownership are all rated moderate. Government has undertaken some key policy decisions and
initiatives which are supportive of ECD outcomes. But a comprehensive, cross-sectoral,
evidence-based ECD policy is still needed. Technical risk is rated substantial because the
pilot did not culminate in learning and improved development effectiveness. Financial risk is
moderate because state financing of SIP services by 2019 (when the EU funding finishes) is
confirmed in Council of Ministers decisions, the affordability of which can only be verified
with cost estimates of nationwide rollout of the program.
Overall, Bank performance is rated moderately satisfactory. Quality at entry is rated
moderately satisfactory. Some aspects of project design were strong, including its innovation,
its direct support to municipalities, and its emphasis on evidence and learning. However,
shortcomings included weak results chains for behavior change, learning, and capacity
building. Fiduciary and environmental aspects were well prepared. The failure to include a
monitoring and evaluation (M&E) expert in the Ministry of Labour and Social Policy
(MLSP) was an oversight, especially given the project’s pilot design. The four-year time
frame was very ambitious. The decision to let municipalities tailor services to local needs and
contexts was sound. However, the targeting would have been more precise and efficient with
a more systematic mapping of target populations and their needs, fuller involvement of those
with intimate knowledge of the communities and community development expertise, and
adequate M&E. Quality of supervision is rated moderately satisfactory. Revision of the
results framework and indicators in 2012 weakened measurement of the PDO and target
groups and the focus on them, and the World Bank began to rely on output indicators as a
proxy for PDO achievement. The World Bank’s rationale for dropping the impact evaluation
is sound; and use of the supervision budget for assessing school readiness test results is
noteworthy. Supervision reporting and dialogue with the government were candid and firm in

xiii
an effort to negotiate reasonable spending limits and an extended time frame for
implementation that would allow time to deliver services and achieve results.
Overall borrower performance is rated moderately satisfactory. Government performance is
rated moderately unsatisfactory. National development strategies place a high priority on the
PDO, but the project was not protected against severe spending limits, which undermined
PDO achievement. The elimination of the impact evaluation is justified, but M&E capacity
building and evidence-based learning could have been preserved and supported. The
multisectoral monitoring committee met infrequently. Implementing agency performance
was moderately satisfactory. Despite expenditure caps and significant delays, the project
established and launched the delivery of integrated services and increased preschool places
and new enrollment. Fiduciary and environmental exigencies were also carried out. M&E
was neglected and focused largely on outputs.
The quality of M&E is rated modest. The original design included an M&E framework that
included measures for school readiness (but not social inclusion), an impact evaluation, and a
multisectoral monitoring committee to oversee implementation, results, and learning.
Restructuring weakened the results framework, reduced most indicators to output measures,
and created ambiguity regarding the coverage of target groups. Baseline data were collected
three years after project approval, and the monitoring committee rarely met. There was
limited scope and effort for using data to learn about program effectiveness and strategic
decision making.
Lessons. Investment in ECD and the development of evidence-based policy for ECD
programs and nationwide rollout are critical to the achievement of Bulgaria’s goals of human
and economic development. The following lessons, offered to this end, are relevant to both
the World Bank and the government:
• Official databases are important, but may need to be complemented with mapping of
target communities and households and their needs, priorities, motivations, and
dynamics, undertaken by those with intimate knowledge of the community and with
community development expertise.
• Mobile services and mediators face challenges in reaching target populations,
especially when mediators are few relative to their target populations and have heavy
workloads, and they do not always share the language, culture, and living conditions
of those populations. Leveraging their efforts with nongovernmental organizations,
community-based organizations, and other leaders and actors trusted by the
community has the potential to enhance the coverage and effectiveness of services.
• Low appreciation of evidence for learning, program refinement, and policymaking
can undermine the effectiveness of programs and policies, especially where piloting is
intended. The development of M&E capacities could provide MLSP with a critical
management tool for ensuring continuous learning and accountability for ECD results
and increase its potential for resource mobilization and future replication.

xiv
• Experience under the SIP reveals the scope and opportunity to clarify roles and
responsibilities to optimize comparative advantages and synergies of the many actors
involved both horizontally (across partners at each level of the system) and vertically
(up and down the various levels of decentralized government). Such measures could
enhance cross-sectoral collaboration within the government and more productive
partnerships between the government and other development partners at each level of
the system; and strengthen and streamline the financing, accountabilities, and
interactions across the various levels of government for better service quality.
• Investments in ECD and social inclusion activities targeted to low-income and
marginalized children ages 0–7 years and their parents are necessary, but they are
insufficient to ensure the children’s success and inclusion in primary school and
beyond. Continued delivery of integrated social services and social inclusion
interventions during their primary school years (and beyond), support for teachers for
coping with the challenges of social inclusion in the classroom, and improved
education quality are also critical.
Auguste Tano Kouame
Director
Human Development and Economic Management
Independent Evaluation Group

1
1. Background and Context
1. This section summarizes the background and context covering the period during
which the project under review was designed and implemented (2006–15).1
General Background
2. Population. Bulgaria’s population of 7.1 million in 2016 (World Bank data 2018)
has rapidly declined since it peaked at 9 million in 1988, a result of substantial out-
migration of young workers, low birthrates, and high mortality rates. A significant
decline in the working-age population and a growing elderly population underlie high and
growing dependency ratios. Bulgaria is also marked by internal rural-to-urban migration.
The most disadvantaged rural areas endure the greatest outflow, caused by limited
employment opportunities and poor socioeconomic status. The 2011 census estimates the
following self-reported ethnic breakdown of the population: 84.8 percent (or 5.7 million)
ethnic Bulgarians; 8.8 percent (or 588,318) ethnic Turkish people; and 4.9 percent (or
325,343) ethnic Roma people. Many consider the Roma population to be seriously
underestimated.2 More than three-quarters of ethnic Bulgarians live in urban areas
compared with one-third of Turkish people and one-half of Roma. Turkish and Roma
people are more concentrated in several specific districts.3
3. Economic growth and poverty. Since the 1990s, Bulgaria has evolved from a
centralized, planned economy to an open, market-based, upper-middle-income economy.
The initial transition was difficult. Bulgaria saw significant economic gains and progress
toward poverty reduction from 2000 to 2008. Impressive growth was the result of
structural reforms, deep fiscal adjustments, a favorable external environment, and
prospects of European Union (EU) accession. Bulgaria became an EU member in 2007
after creating institutions to support democratic governance, human rights, and a market
economy. Robust real gross domestic product (GDP) growth (more than 6 percent
annually), low unemployment, and a boost in foreign direct investment inflows marked
the period 2000–08, culminating in important gains in poverty reduction and shared
prosperity. Poverty (population living on less than $5 a day) declined from 37 to
13 percent between 2001 and 2008 because of enhanced employment opportunities for
the poorest 40 percent.
4. The 2008 global financial crisis reversed positive trends. Between 2009 and 2014,
annual real GDP growth slowed to less than 1 percent, and 0.4 million (mostly unskilled)
Bulgarians lost their jobs. Unemployment more than doubled from 5.6 percent in 2008 to
13 percent in 2013, reaching almost 50 percent among workers with little education.
Poverty rates rose from 13 to 15.8 percent, and debt levels rose by almost 9 percentage
points to 27 percent of GDP (2014), which is still one of the lowest in the EU. Bulgaria
was resilient during the global economic crisis, though convergence of income levels to
EU averages has stalled. Indicators for 2015 point to improvements: the GDP growth rate
rose to 3 percent, driven by exports; unemployment fell to 9.2 percent because of gains in

2
industry and construction; increased employment of low-skilled labor contributed to
poverty reduction; and the fiscal position improved with a deficit of 2.5 percent of GDP
(on accrual basis) in 2015 compared with 5.8 percent in 2014.
5. Political stability and civil society. After the global financial crisis, slow
structural reforms revealed weaknesses in Bulgaria’s institutional framework for growth
and shared prosperity. This culminated in a period of rapid political change that included
five governments in a 20-month period ending in October 2014, when a new coalition
government led by the center-right political party was appointed and stabilized the
political context. Local elections in 2015 consolidated the position of the four
progovernment parties. The coalition has found common ground as pro-European and
reformist, focused on education and health sector effectiveness, among other priorities.
6. Civil society underwent changes as Bulgaria transitioned to a market economy,
and it continues to evolve and respond to citizens’ needs and demands (Kabakchieva and
Hristova 2012). There are many nongovernmental organizations (NGOs) in Bulgaria.
Some are financed largely by the state and work in partnership with it on policy analysis
and program implementation. Others, financed primarily by international NGOs and
development partners, also contribute to research, policy analysis, and program
implementation. Grassroots activist organizations are characterized by citizen
involvement, their activities centering largely on advocacy for policy changes and
holding government accountable. Civil society organizations and community-based
organizations (CBOs) focus on the rights of children and the disabled, security, social
policy, health, education, and the environment.
Social Inclusion
7. Issues and challenges. Poverty in Bulgaria is associated with lack of education,
old age, and rural location. A substantial share of the bottom 40 percent is unemployed or
inactive because they lack adequate education and skills for the labor market. The bottom
40 percent has the highest elderly dependency ratio. Nearly two-thirds of the poor live in
rural areas, with limited employment, services, and access to centers of economic
activity.
8. Ethnicity is another poverty-related factor. The poverty rate among the Roma is
33 percent compared with 5 percent for the non-Roma. Roma children are especially
vulnerable. Roma make up 4.9 percent of the population, but they are 85 percent of the
working-age poor with unemployment four to five times higher than that of the non-
Roma population. Poverty could also be high among the Turkish minority. The bottom
40 percent suffered the most during the global economic crisis because many low-skilled
jobs were lost.
9. Inequality is acute in Bulgaria, caused by low-paid employment and inadequate
coverage of the social protection system. Gender gaps in economic opportunities persist.
3
Inequities are pervasive in pay, educational performance, and participation in public life.
Social exclusion is a cause and a consequence of poverty and inequality.
Early Childhood Development and School Readiness
10. Issues and challenges.4 More than two-thirds of Bulgarians who are at risk of
poverty or social exclusion either did not complete primary school or, in some cases,
secondary education.5 This points to a cycle of low educational attainment (resulting in
high unemployment) and poverty and social exclusion. Several factors curtail access of
the most disadvantaged children to critical early childhood development (ECD)
interventions, which undermines their prospects for attending and succeeding in school,
reaching their potential, and escaping poverty. In particular, the number of available
places and the high direct and indirect costs (even with partial subsidies provided by
municipalities) constrains their access to preschool education.6 Their school readiness is
also undermined by inadequate access to health care7 and nutrition;8 unstable, unhealthy
home environments;9 and, for some parents, the lack of full trust in and appreciation of
ECD and early childhood education services.10
11. National priorities. Fighting poverty and social exclusion are priority and
national strategies stress the role of education to this end (appendix B). Bulgaria supports
measures to promote school readiness, including partial subsidization of public nurseries
and kindergarten fees, further fee reductions for the vulnerable, a policy on compulsory
preschool, free transportation to preschools for remote children, additional preschool and
kindergarten places where demand exceeds supply, and increased coverage of
community-based social, education, and health services. In 2016–17, preschool
enrollment in Bulgaria was about 80 percent.11 Efforts are needed to increase the
enrollment rate for the remaining 20 percent.
World Bank and Other Support
12. For two decades, the World Bank has supported Bulgaria’s efforts to reduce
poverty and social exclusion, improve the quality and coverage of health and education
services, boost employment, and enhance social protection and children’s well-being.
World Bank support includes lending, trust funds for capacity building, and analytic
work. Appendix B (table B.1) shows the chronology of this support, revealing a transition
from lending to analytic work and reimbursable advisory services. The World Bank’s
only other direct investment in ECD before the Social Inclusion Project (SIP) was the
Child Welfare Reform Project. Approved in 2001, it sought to improve child welfare and
protect children’s rights through community-based child welfare approaches as an
alternative to institutionalized care. The SIP design used lessons from this project. Two
recent analyses advocate for stronger ECD policies in Bulgaria and provide evidence to
this end (World Bank 2016c; 2017b).
13. Since its 2007 accession to the EU, Bulgaria’s main source of development
financing is the EU. It also receives technical and financial assistance from the United

4
Nations Children’s Fund (UNICEF), which supports ECD through maternal and child
health services, social services, and ECD targeted to the poor and vulnerable. The Swiss
Agency for Development and Cooperation supports ECD in partnership with Bulgaria’s
health and education sectors, with a focus on Roma and other marginalized minorities.
2. Objectives, Design, and Their Relevance
Project Development Objective
14. Project development objective (PDO) statement. According to the loan
agreement (World Bank 2008b), the PDO is “to promote social inclusion through
increasing the school readiness of children below the age of seven, targeting low-income
and marginalized families, including children with a disability and other special needs.”
The project appraisal document (PAD) states the same objective and adds another one:
“…to contribute to the sustainability of the school readiness program by supporting the
absorption of European Social Fund (ESF) financing.”12 In keeping with World Bank and
Independent Evaluation Group (IEG) guidelines, this evaluation is based on the PDO
stated in the loan agreement.
15. The PDO did not change during the life of the project. Original outcome
indicators were changed under the 2012 restructuring and revised slightly in 2013. These
changes, itemized in appendix D, table D.1, do not warrant a split rating methodology.
16. Geographic scope and targeting. The project aimed to support the pilot phase of
Bulgaria’s school readiness program in a subset of municipalities to be selected in line
with criteria and methodology defined in paragraph 27 of the project operations manual.
Four municipalities in each of Bulgaria’s 27 regions plus Sofia municipality were
envisioned. The 27 regional capitals were assigned automatically as SIP beneficiaries,13
and the remaining three municipalities per region were to be selected on a competitive
basis applying criteria that would reveal the greatest need.14 Awareness campaigns for the
chosen municipalities, their application process, and the preparation, evaluation, and
approval of their full proposals culminated in the implementation of subprojects in 66
pilot municipalities (one-quarter of all municipalities), where an estimated half of the
Bulgarian population resides. Needs assessments prepared as an integral part of
subproject proposals drew on local data and sources to identify and quantify target groups
(as defined in the PDO). Tables D.11a–e in appendix D compile the various types and
sizes of target groups identified in subproject proposals prepared by the five
municipalities visited, along with the data sources they used.
Relevance of Objective
17. The relevance of the project objective is rated substantial.
18. The PDO is relevant to country conditions. Poverty and inequality in Bulgaria are
intricately linked with low levels of education, high levels of unemployment, social

5
exclusion, discrimination, lack of access to information, health and social services, and
unacceptable living conditions (housing, food intake, security, and stability at home).
Poor, marginalized children suffer in particular. Research reveals that lack of positive,
nurturing environments and low access to ECD services (health, good nutrition, early
childhood stimulation, preschool education, among other things) can have deleterious and
irreversible effects on the health and cognitive development of children, all of which
prevent them from reaching their full potential and lock them into a cycle of
intergenerational poverty.
19. The PDO is relevant to Bulgaria’s strategic priorities. The first goal of the
National Development Programme: Bulgaria 2020 is to raise living standards through
education, creating conditions for employment and social inclusion, and ensuring health
care quality and access. This program and Bulgaria’s National Strategy for Reducing
Poverty and Promoting Social Inclusion prioritize improvements to education quality and
access, poverty reduction, and social inclusion. Bulgaria’s National Roma Integration
Strategy for 2012–20 is multisectoral, encompassing education, health, employment, and
nondiscrimination, with an emphasis on women and children’s rights.
20. The PDO is relevant to the World Bank’s current Country Partnership Framework
for Bulgaria (FY17–22), which supports two broad areas: strengthening institutions for
sustainable growth, and investing in people. The second area is fully aligned with the
PDO, supporting two objectives: enhanced school outcomes for better employability, and
improved access to essential services (housing, water, ECD, and long-term care) for the
bottom 40 percent and marginalized groups. Support for the first objective includes
advisory services for measuring education system quality and performance, expanded
access to preschool interventions, and strengthening of evidence to support ECD and
social inclusion. The second objective has a focus on Roma and other marginalized
children’s access to ECD.
21. However, there are issues with the PDO’s framing and level of ambition. The
social inclusion objective is not clearly defined, though the PAD’s statement of objective
gave more clarity (in the short-term “to equalize starting conditions of children entering
primary school”) than the official statement in the legal document (“to promote social
inclusion”). Moreover, it was ambitious to expect achievement of the PDO within a four-
year time frame, especially considering the SIP’s multisectoral nature, civil works
program, decentralized implementation, capacity constraints, innovative service delivery,
and pilot approach.
Project Design
22. The SIP was designed to support the pilot phase of a national school readiness
program, supporting a range of ECD services targeted to low-income, marginalized
children, including those with a disability. The pilot was to be implemented in about
30 percent of Bulgaria’s 265 municipalities, with the remaining municipalities serving as
the control group. It aimed to document program effectiveness, contribute to program

6
fine-tuning, and leverage EU funding for a nationwide rollout. To this end, the design
articulates three distinct phases: pilot testing in selected municipalities during 2009–11;
opt-in of the control groups to the program after the two-year pilot, from 2012 onward;
and the full transition to a national-level program by the project’s end in 2014 (World
Bank 2008a). Project support was channeled through two components (appendix D,
box D.1), essentially to support the program pilot, implementation, and evaluation. The
integrated social and children services component was to provide grants to pilot
municipalities to establish and deliver integrated ECD services to target children and their
parents. The capacity building component was to strengthen capacity for program
management, implementation, and evidence-based learning. To this end, it included
support for establishing national baseline data and for undertaking midterm and impact
evaluations. It also included support to develop municipal capacity for cross-sectoral
cooperation, collaboration with NGOs, and accessing EU funds.
Relevance of Design
23. The relevance of the project’s design is rated modest.
24. There were several good design elements. The pilot design aimed to foster a
learning process, including tracking program effectiveness and the use of evidence to
improve effectiveness before the nationwide rollout. The results chain for component 1
(integrated service delivery) is largely logical, with mostly plausible links between
inputs, outputs, intermediate outcomes, and outcomes. The design incorporates lessons
from the previous Child Welfare Reform Project, especially the importance of parent
involvement. It also reflects established evidence that school readiness is not only a
function of preschool education, but it also involves a holistic, multisectoral approach
with specific interventions for different age cohorts of children under age seven: health,
nutrition, safety, and well-being at home; early childhood stimulation; access to social
services; social protection; and transportation, among others. The design provided for
contracting with NGOs for a range of functions and services. It put a cap on civil works
expenditures, anticipating that some municipalities might emphasize infrastructure more
than service delivery. The requirement for municipalities to commit to maintaining local-
level investments aimed to promote local-level ownership and sustainability of
investments.15
25. However, there are shortcomings. The project aimed to change awareness,
knowledge, and behaviors of parents and other caregivers favoring child development
and included training and counseling to this end. The design of appropriate behavior
change interventions (information, incentives, and communications, among others) and
their underlying logic, however, were not fully developed. Neither did the design
anticipate or address the availability of professionals to fill new positions created at the
municipality level, and the risk assessment did not fully explore the risk of limited fiscal
space for the school readiness program, even though this was an issue that had delayed
project negotiation.

7
26. Component 2 articulates and supports capacity building, program development,
and learning objectives that are not captured in formal objectives, and its results chain is
not well articulated. The initial design included an impact evaluation, but it did not define
roles and responsibilities or a process or timetable for analysis, vetting of evidence with
stakeholders, or its use in decision making. Although a refined school readiness program
ready for nationwide implementation was at the heart of the pilot design, it was not
identified as an intermediate outcome. Because this component envisioned capacity
building of the Ministry of Labor and Social Policy (MLSP) and the Ministry of
Education and Science to conduct impact evaluations beyond the SIP, a results chain to
this end might have been more specific. Results chains for achieving capacity building of
municipalities in clearly defined areas might have been articulated better. There was also
scope for the design to have established a more holistic link and vision of central- and
municipal-level capacity, incentives, and systems in two areas: cross-sectoral
coordination; and program monitoring and evaluation (M&E) for learning and
accountability. Although laudible for its emphasis on learning, the project’s pilot design
was too ambitious for a four-year time frame, even given its conception during the
precrisis years and the anticipation of generous EU financing.16
27. Implementation arrangements did not envision a stand-alone implementation
unit. Responsibility for loan administration and implementation oversight was placed in
the Bulgaria Social Investment Fund (SIF) within MLSP, which had the mandate for
overseeing the social inclusion agenda. SIF was well positioned to assume responsibility,
given its relevant experience and capacity. The project also sought to align with the
processes and mechanisms for ESF financing. MLSP’s Directorate of European Funds,
International Programs and Projects—designated as the managing authority for ESF
Operational Program Human Resources Development (OP HRD)—was given
responsibility for approving municipal projects supported under the SIP and for
overseeing policy coordination and links with the absorption mechanism for the OP
HRD.
28. All municipalities in Bulgaria were invited to apply to participate in the program.
The managing authority was to select a sample of municipalities to participate in the first
phase of the school readiness program’s rollout. Selection was to be based on a
methodology (to be defined after effectiveness in the project operational manual).
Selected municipalities could apply for a set (or subset) of OP HRD-eligible social and
childcare services tailored to their specific needs, including social service infrastructure
investments (if justified, but not to exceed 50 percent of the grant). The SIF was
responsible for receiving subproject proposals and preparing applications for submission
to an evaluation committee. The managing authority would formally approve the
subprojects in line with evaluation committee recommendations. Financing agreements
between MLSP and municipalities would be signed to provide the financial and technical
support for municipalities, which would be used to contract out the strengthening and
delivery of services. Service provider contracts were to include performance targets, and
payment was to be based on per capita allocations.

8
29. Revised implementation arrangements. The SIF was closed in March 2010 as
part of the government of Bulgaria’s effort to cut overhead and administration because of
its tight fiscal constraints. A 2010 restructuring of the SIP transferred implementation
responsibilities to the Social Inclusion Directorate (SID) of the MLSP. World Bank
supervision reporting notes that in May 2010, key members of the SIF staff responsible
for project management were already being transferred to the SID. Another slight
adjustment to implementation arrangements in May 2011 allowed advance payments to
service providers for services only.
3. Implementation
Key Dates
30. The SIP was approved on November 4, 2008 and became effective on April 16,
2009. After long delays in start-up and implementation, the midterm review took place in
December 2012. The project was restructured five times (appendix D, table D.2.) and
closed on December 31, 2015, which is 26 months after the twice-extended original
closing date. Even with this extension, only the first (pilot) phase of the national program
rollout was implemented. The remaining two phases articulated in the design document
(World Bank 2008a) (control groups opting into the program in 2012; and the full
transition to a national-level program in 2014) have not yet happened.
Planned versus Actual Costs, Financing, and Disbursements
31. Costs. The project’s total cost was €25.99 million. This is 65 percent of the
original estimate of 40 million (World Bank 2008a), but that original estimate was made
on the basis of World Bank financing only and did not include the counterpart expected
of the government of Bulgaria and pilot municipalities.17 The total project cost is
19 percent of the original program cost estimate of €136.73 million (World Bank 2008a),
which was calculated on the basis of the three phases of program testing and rollout
(para. 21). In the end, only the first (pilot) phase was implemented under the SIP.18
Appendix C, tables C.1 and C.2 provide details. Of the total grant funding provided to
municipalities, 53 percent was spent on construction and rehabilitation, exceeding the
project’s 50 percent cap (para. 27), with great variance across the 66 municipalities.
About half of the municipalities (32) exceeded the cap, ranging from 51 percent to
83 percent of grants received (appendix D, table D.12).
32. Financing and disbursements. Actual financing was lower than planned
(appendix C, tables C.3, C.4, C.5). The loan disbursed €23.58 million: 59 percent of the
original loan (€40 million) and 75 percent of the reduced loan (€31.39 million) after
€8.61 million were canceled in 2013. An amount of €7.81 million was undisbursed at the
project’s end. Actual disbursements against the category “grants to municipalities”
amounted to €22.81 million, or 64 percent of the original allocation. Disbursements
against the category “consulting, training, and audit” amounted to €0.67 million, or

9
15 percent of the original allocation. These shortfalls are due to implementation delays
and the government-imposed expenditure caps, which delayed and compressed the
service delivery time frame and precipitated the elimination of the impact evaluation and
other consulting services. Municipalities provided €2.15 million, and the government
provided €0.25 million in counterpart financing. These low amounts (compared with
estimates) are attributable to the implementation of only one of the anticipated three
program phases and to project restructuring in 2013, which relieved municipalities and
the government of any further counterpart financing under the project.
Project Restructuring
33. Table D.2 in appendix D summarizes the timing and nature of the five project
restructurings. The July 2010 restructuring reassigned responsibility for project
management and oversight to the SID in MLSP, replacing the SIF, which was closed in
March 2010 (para. 28). The May 2011 restructuring decreased the time frame of
municipal commitments to retain services supported under the project,19 and introduced
small changes to subproject disbursements that allowed advance payments to service
providers. The December 2012 restructuring reallocated loan proceeds to respond to high
demand for grants to municipalities and revised the results framework.20 The
government’s request to extend the closing date was not granted immediately, but rather
conditioned on adequate provision for sufficient project expenditure under the 2013 State
Budget Act. The September 2013 restructuring reduced the scope of activities,21 canceled
part of the loan (€8.6 million), finalized the results framework agreed under the
December 2012 restructuring (with slight revisions), and extended the closing date by 23
months. It is worth noting that even as late as the September 2013 restructuring, the
revised allocation for municipality grants was 86 percent of the original allocation,
indicating a substantial coverage of initial subprojects, albeit for a shorter time. In
contrast, the revised allocation for evaluation and capacity building was slashed to
20 percent of the initial allocation. The September 2015 restructuring extended the
closing date by an additional three months (to December 31, 2015) to allow for 12
months of service delivery and for some small municipalities to launch their services and
fully use the project funds.
Factors Affecting Implementation
34. Factors outside of the government’s control. The global economic crisis and
sociopolitical unrest created a challenging backdrop for project implementation,
particularly during 2009–15, in the aftermath of the 2008 global economic crisis. During
this time, poverty increased, annual real GDP growth slowed to less than 1 percent,
400,000 (mostly unskilled) Bulgarians lost their jobs, the unemployment rate more than
doubled (mostly affecting those with little or no education), fiscal pressures increased,
and government debt rose. The period 2013–14 saw social unrest and rapid political
change with five governments in 20 months. Political stability returned in 2014–15 with

10
the formation of a new coalition government. Changes to Bulgaria’s demographic profile
(para. 1) are also significant.
35. Factors within the government’s control. Although a change in implementation
arrangements and the imposition of severe limits on project expenditure slowed start-up
and implementation, new government policies increased the need—and the demand for—
project services. The transfer of project management responsibility (and relevant staff)
from the SIF to the SID caused implementation delays. The government’s severe
expenditure limits on the project (and two other World Bank–financed projects),
precipitated by the global economic crisis, curtailed the range and time frame of
activities. Implementation only started in November 2011 (more than 2.5 years after
effectiveness). Despite efforts to expedite implementation to make up for delays, the
project stalled in 2012 because the annual expenditure limit (slashed to half of planned
spending for that year) was reached at midyear, and the Ministry of Finance rejected
requests for its increase. Expenditure limits set at zero for 2013 and 2015 further
undermined implementation. These limits were set without regard to implementation
schedules, procurement and disbursement plans, and contracts. In 2010, the government
introduced policy decisions (among others, see para. 80), which likely increased the need
and demand for SIP services: mandatory preschool, and the deinstitutionalization of
orphaned, marginalized, disabled, and special needs children.
36. Severe expenditure limits imposed by the government precipitated the decision in
2013 to drop the impact evaluation and other capacity building activities that were not
considered to be directly supportive of the PDO and to prioritize the establishment and
delivery of the SIP services. Failure to convene, on a sufficiently regular basis, the SIP
monitoring committee, whose mandate was to catalyze authorities of relevant sectors for
cross-sectoral oversight, coordination, and learning, undermined the learning agenda.
37. Factors within the implementing agency’s control. SID staff was diligent in
carrying out project management and supporting and guiding municipalities, which took
on their implementation responsibilities through a learning-by-doing approach. The SID
staff’s proactivity and considerable time spent in the field ensured good coordination,
supervision, and outputs regarding civil works and the procurement of equipment and
materials. Municipalities’ difficulties in recruiting the 1,407 service delivery staff hired
under the project (and in managing their turnover, especially among mediators and social
workers) were due to stringent eligibility criteria, the part-time nature of the positions,
and low pay, given the responsibilities, challenges, and stressful nature of the jobs,
especially for those who did not speak the languages or did not have the trust of target
groups. The underuse of NGO and CBO capacity for establishing richer, more accurate
baselines, identifying and quantifying target groups, and service delivery and outreach
activities could have been mitigated by SID and municipalities. Although the focus on
implementation was strong, the focus on results and learning fell short of needs for the
project’s learning agenda.

11
SAFEGUARDS COMPLIANCE
38. The project was categorized as financial intermediary with subprojects of
potential category C and B. Local environmental requirements were considered adequate.
Guidelines for subprojects’ environmental prescreening and analysis were included in the
project operations manual. Compliance was rated satisfactory throughout
implementation. During the midterm review, independent consultants checked the quality
of works and compliance with local construction and safety standards in a sample of
subprojects. Minor issues with environmental prescreening were identified, addressed
promptly, and resolved.
FINANCIAL MANAGEMENT AND PROCUREMENT
39. Financial management arrangements were satisfactory, and adequate controls and
procedures were in place throughout project implementation. All interim financial reports
and annual project audits were received on time with clean opinions and no internal
control issues. This was confirmed at the midterm review, in the Implementation
Completion and Results Report, and with the World Bank’s experts.
40. Adequate procurement processes were established and followed. Centralized
procurement for equipment proved to be efficient. Procurement-related delays were due
to the budget ceiling imposed at the government level.
4. Achievement of Objective
41. The PDO of the SIP was “to promote social inclusion through increasing the
school readiness of children below the age of seven, targeting low-income and
marginalized families, including children with a disability and other special needs”
(World Bank 2008b).
42. PDO achievement is rated substantial.
43. This chapter examines components and links of the SIP results chain, including
inputs and outputs contributing to intermediate outcomes (service delivery to target
children and their families, and enhanced capacity for program management,
implementation, continual learning, and improvement), and their contributions to the
achievement of the PDO (appendix D, figure D.1). Project attribution and the
counterfactual are also explored.
44. Service delivery inputs. The project financed critical inputs supporting the
establishment and launch of ECD services in pilot municipalities. It financed construction
and rehabilitation works to house the integrated social services for target populations and
to provide additional places in crèches and kindergartens. It also financed furniture,
equipment, training, and guidelines for the services offered. Support for child disabilities
services included 44 buses for transporting disabled children (also used for mobile

12
services); specialized sensory therapy, medical, and sports equipment; 36 trainings for
medical specialists working in maternity wards (for more sensitive dialogue with parents
about disabilities and options for home care); 46 trainings for disability specialist teams;
and the development of methodological guidelines. Support for services to develop
parenting skills and deliver family counseling and support included 66 trainings for
specialist teams and the development of methodological guidelines. Municipalities also
contracted 1,409 specialists.22
45. Outputs of kindergarten and preschool investments. A total of 4,420 children
ages 3–7 were newly enrolled in kindergarten and preschool education groups, surpassing
the target of 3,000. However, it is not clear how many of them came from the low-
income, marginalized, disabled groups targeted under the project. 23 Not all enrollees
completed two full years (or even one) in these facilities by the project’s end.24 The
project supported the creation of 2,357 new places in kindergartens and preschools,
exceeding the target of 1,600. An estimated,1,100 kindergarten and crèche staff were
trained, exceeding the target of 700.25
46. The project encouraged municipalities to reduce kindergarten fees to incentivize
poor, marginalized families to send their children to kindergarten. Municipalities set their
own policies in this regard. The five municipalities visited offer a range of reduced fees
to families meeting one or several criteria.26 Some staff met noted that neighboring
municipalities have eliminated kindergarten fees. Fee reductions were already in place
before the project. There is no evidence of further reductions precipitated by the project.
On the other hand, municipalities did support the enrollment of vulnerable children in
kindergarten under SIP through their application of fee reductions. Drawing on findings
of an evaluation of the Springboard for School Readiness project (World Bank 2017b),
complete elimination of fees would have provided greater access to low-income parents.
Project-supported social workers and mediators also promoted attendance in
kindergarten. Data and trends on their attendance and dropout rates were not
systematically collected, analyzed, and reported.
47. The project supported summer schools for children in need of remedial support,
including some who had also attended preschool or kindergarten, to help them prepare for
primary school. These one-month programs focused on Bulgarian language skills, basic
preschool math and phonics, self-discipline, and good classroom habits. Because primary
school is compulsory, all children who register must be admitted regardless of whether
they have the minimum skills. Students between grades 1 and 4 are promoted to the next
grade whether or not they demonstrate mastery of curricula and skills.
48. Outputs of integrated social services. The project created 113 new community
centers for delivering social services, exceeding the target of 68. The time frame for their
delivery was compressed into six to eight months because of implementation delays
(paras. 33–36). After a half-year gap between the closing of the SIP and the start of EU
financing, service delivery was extended by an additional two years (appendix D,

13
table D.9.). The actual coverage and targeting of these services has not been documented
fully.
49. By the project’s end, 4,311 children benefited from early intervention of disability
services, more than twice the original target of 2,000 and almost three times the reduced
target of 1,500, set in 2012 and 2013, respectively. This is a substantial achievement
given that services were only launched well into the project’s last year (appendix D,
table D.9). In the five municipalities visited, there appears to be strong demand for these
services (direct observation, exchanges with parents, and parent satisfaction surveys), and
parents expressed deep appreciation for them. Beyond being free of charge, parents note
that the services were of higher quality than services offered elsewhere that charge fees.27
Some parents expressed the desire for more frequent sessions and the extension of
coverage to children older than seven. Many learned of the services through physicians’
referrals, word-of-mouth, and their proximity to the center. Mobile services to identify
disabilities and encourage parents to access services report reluctance among ethnic
minorities for their uptake. Bulgaria’s deinstitutionalization reform and the reinsertion of
disabled and special needs children into communities also likely fueled demand.28
Managers of group homes for deinstitutionalized children in Pazardzhik Municipality
expressed their appreciation of the services, on which they rely heavily. Direct
observation of the services and exchanges with parents point to improvements in the
functionality of disabled children and in the quality of life of their caregivers and
families. Some parents met during field visits stated that their children learned to walk,
talk, socialize, and/or become more confident, self-sufficient, and engaged because of
these services.29 Individual case files are kept for each beneficiary. Complementing
medical support and therapies, individual pedagogical support is provided to help prepare
them to attend kindergartens and preschools and, eventually, primary schools.
50. By the end of 2015, 471 children with disabilities or special education needs were
newly enrolled in kindergartens and preschool education groups, more than triple the
target of 150. Although largely accomplished prior to the launch of disability services
under the project, this achievement is the result of outreach efforts to enroll these children
into mainstream kindergarten and preschool education groups created with SIP support.30
Bulgaria’s campaign to reduce children’s institutionalization likely precipitated these
enrollments.
51. By the project’s end, 39,993 children ages 0–7 years benefited from health
checkups, exceeding the target of 10,000, but it is not clear what portion of these were
from the target group. This service was designed to monitor and promote the health and
well-being of very young children who may not otherwise be exposed to health screening
and prevention. The age 0–3 group service includes screening for nutritional status,
psychomotor development, and dental health; referrals to specialists when warranted;31
disease prevention; and health education, promotion, and vaccinations. The age 4–7
group service consists of semiannual health and dental checkups in kindergartens and
preschools, covering all students. Because this service was launched very late in the
project (2014), the majority of beneficiaries (20,693) were reached only during the last

14
six months of the project (according to MLSP project data). There is no breakdown of
beneficiaries by age group or, within the age 0–3 group, by those who were reached
through mobile services versus facility-based services. There are no breakdowns of
beneficiaries by income or ethnic group or any calculation of the coverage of target
groups. Official UNICEF data show high child vaccination coverage in 2012 – prior to
government’s 2013 legal amendment introducing the condition for complete
immunizations for the payment of child allowances, and prior to establishmemt and
delivery of these SIP-supported health checkups. There are no trends or breakdowns
available to document any impact on immunization rates of vulnerable children.
52. A total of 12,964 parents of children ages 0–3 received parenting skills counseling
(exceeding the target of 10,000), of which two-thirds (8,482) were reached during the
project’s last six months. The SIP supported interventions to develop parenting skills of
parents-to-be and parents of children ages 0–3, targeting low-income and marginalized
groups. Parents were informed of their duties through outreach or at group sessions held
in various local venues. They received help accessing health and social services to
support the care and nurturing of their children, and were given opportunities to interact
recreationally with their children to strengthen bonds and nurturing. Family counseling
addressed social issues encountered by vulnerable families that compromise family well-
being. Group and individual counseling on reproductive health and family planning and
group work with neglectful parents were delivered at community venues and through
outreach. A team of social workers, psychologists, lawyers, and others supported a range
of social and legal issues. As with other services, there are no data on coverage of the
target groups or how many were reached through mobile services versus facility-based
services.
53. Service quality, equity, and sustainability. The project included provisions for
service quality, a critical dimension to ensure that new services translate into school
readiness outcomes. Contracting specialized service providers supported a competitive
process for fulfilling technical requirements and qualifications for these jobs. Recruits
received additional training tailored to the project’s pilot approach. They were provided
with methodological guidelines developed by technical experts and other materials and
technical support to guide good practices. The project provided quality facilities and
equipment for service delivery, which have been very well maintained. Field visits
revealed that most service providers had a strong dedication to service quality.
54. However, regular inspection of these services has not yet been fully implemented
or institutionalized. In principle, inspectorates of various line ministries are responsible
for ensuring quality. IEG visits to kindergartens and primary schools revealed that the
Regional Education Inspectorates’ visits to kindergartens, preschools, and primary
schools do not appear to be regular, though kindergartens in Haskovo and Plovdiv
reported visits and helpful feedback. The education sector is currently reforming its
inspection function and so this situation might improve. According to UNICEF, the EU
quality framework on early education will be developed later in 2018, and the Ministry of
Education and Science is exploring the development of an instrument and standards for

15
quality assessment of preschools. The Child Protection and Social Protection Agencies,
both within MLSP, are noted by MLSP to be the appropriate agencies to undertake
inspections of child and social support services delivered under SIP. They have not yet
assumed this responsibility because activities are still considered to be of a pilot nature.
There is scope for the Ministry of Health Inspectorate to oversee technical standards of
the health services provided under SIP. These considerations are important for program
fine-tuning before its nationwide rollout.
55. The extent to which the SIP-supported services were delivered equitably
(reaching the intended target groups) is not clear. Although targets set for the number of
beneficiaries of the various services were exceeded (paras. 44–51), there is no breakdown
of beneficiaries to indicate what portion of them was from the groups targeted under the
project. There are no indications of how many were low-income and/or marginalized
except for the reporting on the distinct group of disabled and special needs children under
age seven, who were enrolled in kindergarten and preschool groups and who accessed
disability services. Mediators in all five municipalities shared the difficulties of reaching
the low-income and marginalized target groups, a phenomenon of the lack of trust of
these populations,32 language barriers, cultural barriers,33 and their changing size and
composition caused by migration.
56. Field visits revealed a mixed picture of the equity and reach of services. In
addition to the creation of additional places in kindergarten and preschool, equitable
access was to be addressed through fee reductions, mobile services, and transportation.
These measures are likely to have enhanced equitable access. Fee reductions for
vulnerable children enrolled in kindergarten and preschool groups were applied. The
frequency and reach of mobile services is not known. This is an important dimension of
access because target groups are not easily reached, immediately open to initial (and
follow-up) visits or likely to seek services at the community center. Transportation of
beneficiaries to community centers is limited. In rare cases, children in poor areas are
bused to kindergartens in better-off, more mixed neighborhoods. Access to social
services under the SIP is further limited because most providers work only part-time,
reducing hours of operation by about half in most centers.34 Moreover, the period of
service delivery under the SIP was reduced to less than a year because of implementation
delays. An end-of-project survey on the vulnerable populations’ knowledge of these
services and their access to these services would have provided useful insights on real
access and how it could improve.35
57. The project secured the short-term sustainability of social inclusion services
through financing under OP HRD, albeit with gaps between the end of World Bank
financing and the start of OP HRD financing. OP HRD financing added two additional
years of service delivery to the six- to eight-month period delivered under the SIP
(appendix D, table D.9).
58. Capacity building inputs and outputs. The project financed consulting contracts
and training to build central- and municipal-level capacity to design and implement the

16
school readiness program in 66 pilot municipalities. Central-level capacity building
included consultants for independent evaluation of municipal subproject proposals,
procurement, ECD and disabilities, a SIP management information system, training,
supervision of construction and rehabilitation, baseline data collection, and external
auditing. Municipality-level capacity building supported training on subproject proposal
preparation, M&E and SIP reporting (for 144 municipal employees) and on selection of
consultants according to Bank procurement guidelines. These contracts and trainings
culminated in the approval and implementation of 66 municipality subprojects, the design
and fine-tuning of ECD and disabilities interventions, and the satisfactory oversight and
implementation of procurement, construction, and financial management. The project
invested in technical work to secure EU funding for SIP activities under the 2014–20
HRD OP.36
59. Capacity building intermediate outcomes. The project did not culminate in the
systematic learning anticipated in its pilot design, which was expected to contribute to a
review and refinement of program design and effectiveness before its anticipated
nationwide rollout by 2014. Only the first of three planned phases of program rollout was
implemented (para. 29). The impact evaluation was eliminated in 2013 for several
reasons, among which: the decision to prioritize the use of limited project resources for
the establishment and delivery of SIP services; and the severely curtailed time frame for
service delivery (less than one year), which would have been inadequate for an impact
evaluation as envisaged in the design document (World Bank 2008a). The World Bank’s
team highlighted other, methodological issues, which also factored into this decision. The
competitive process for selecting municipalities introduced self-selection bias and flawed
the originally planned randomized controlled design. The huge variation of services
chosen by municipalities precluded meaningful grouping of municipalities providing the
same types of interventions, especially when time frames were ultimately curtailed.
Project staffing did not include an M&E expert, who could have guided, overseen and
strengthened monitoring and learning, even in the absence of an impact evaluation. The
SIP monitoring committee did not meet regularly to carry out its function of overseeing
the pilot and fostering learning from its results.
60. The project was successful in providing municipalities with the capacity to access
and absorb EU funding under HRD OP 2014–20. Sixty-four of the original 66 pilot
municipalities benefited from such funding, making it possible to continue the delivery of
essential services for about two years after the SIP closed at the end of 2015.37
Municipalities gained capacity in cross-sectoral work. Field visits and other discussions
and reviews revealed that the integrated service delivery model at the municipality level
has supported and nurtured improved collaboration and consultation across sectors and
within the community centers, and among the service providers, municipality staff, and
others.38
61. However, evidence of municipalities’ collaboration with NGOs, community
organizations, and others with intimate knowledge of and the ability to reach target
populations is weak. Some municipalities (Plovdiv and Haskovo) reached out to the

17
Evangelical Church, which is well established and influential in some target
communities. Mediators (mostly female) noted difficulties in engaging with Muslim
populations because of language and cultural barriers, including gender. Most notable is
the failure to harness existing capacity and potential of NGOs to contribute in areas not
well covered by municipal staff or contractors. Unexploited capacity could have been
harnessed for more detailed information on target populations and their risks, needs, and
priorities; better access to those populations; stronger outreach; more trust; and improved
targets and strategies for achieving results. This finding is based on field visits, a review
of service contracts, and patterns of responses from a wide range of people, agencies and
CBOs interviewed.
62. PDO achievement. Most service delivery output targets were exceeded—a
laudable feat against a backdrop of significantly delayed and compressed service delivery
time frames. However, service outputs are not a proxy for the outcomes embedded in the
PDO. Moreover, intermediate outcomes crucial to attaining the PDO, such as improved
parenting practices, early development of cognitive skills, and the health, nutrition, and
well-being of target children have not been systematically tracked as planned initially.
63. School Readiness. School readiness is a function of preschool education and a
range of other ECD services provided under the project, including child health and
nutrition services and promotion; parenting skills development and counseling; and early
intervention of disabilities and special needs. The only available measure of school
readiness is a comparison of two sets of school readiness tests (measuring preschool
academic skills, such as reading, writing, language and communication, and early
math),39 the baseline conducted in 2012 and the endline in June 2015. The baseline was
established as a part of a broader, national baseline study, covering 98 municipalities, that
was to be used to evaluate the project impact. The endline test was administered to the
897 vulnerable children aged 6/7 years at the time of test administration, who were
enrolled for one to two years in mainstream SIP kindergarten or preschool groups, most
of whom also benefited from SIP remedial summer schools. After elimination of 140
tests for noncompliance with testing procedures, 757 endline tests were considered to be
viable. From these 757 tests a smaller subsample of 250 was selected to establish
matched samples to facilitate comparison of test results of 2012 and 2015 cohorts with
comparable parameters. According to this analysis, passing rates of school readiness tests
taken by vulnerable children in these small, matched samples increased from 49 percent
in 2012 to 80 percent in 2015 after one to two years of exposure to SIP kindergartens or
preschool groups and (in many cases) summer school, too (Market LINKS 2015). Within
this smaller sample, children from larger municipalities (greater than 35,000 population)
had higher passing rates (84 percent) than those from smaller ones (74 percent).
Statistically significant increases in scores were registered for: use of compound and
complex sentences; word meaning comprehension; ability to distinguish past present and
future tenses; word and sentence memorization; logical and associative thinking; and
Bulgarian language ability. The test did not measure health and physical well-being or
social and emotional development, two other aspects of child development.

18
64. Three years have passed since this end-of-project measure of school readiness.
Services developed under the SIP continue to be delivered with the support of the EU.
The establishment of three additional school readiness data points (that is, the testing of
additional beneficiaries in June 2016, June 2017 and June 2018) could have revealed
interesting trends and perspectives on school readiness program effectiveness, especially
for younger children with earlier and longer exposure to crèches and
kindergarten/preschool groups and for children exposed to the fuller range of ECD
services (parent counseling, health checks, and so on.), which were not available to the
children tested in 2015. This is a missed opportunity for learning and fine-tuning, which
was at the heart of the pilot design, and still relevant today.
65. Targeting Effectiveness. Evidence on the actual targeting of activities and
services is fragmented, incomplete and inadequate for assessing targeting effectiveness.
As detailed in appendix D, tables D.11a-e, multiple criteria for defining and reaching the
project’s target groups (low-income, marginalized families, including disabled/special
needs children) were itemized (and also captured in the project operations manual),
notably: parents of children who were from marginalized ethnic groups, unemployed,
receiving social assistance, uninsured, abroad, neglectful, having three or more children,
single, very young, uneducated, living in poor housing conditions; and low-income,
marginalized children of above-cited parents, and/or who were disabled, or suffering
from delayed development, not benefiting from child care or preschool, in poor health,
without access to quality health care. The more criteria these families met, the greater
their needs and higher their priority. However, overreliance on official databases leaves
out many low-income, marginalized groups, including those living in illegal housing with
no official address, those with no identification cards,40 and others not captured in official
registries for multiple reasons.
66. On the one hand, the reporting of disabled and special needs beneficiaries is
straightforward, because of the clear definition of this target subgroup and the specialized
nature of the services provided to them: 4,311 children benefited from early intervention
of disability services; and 471 children with disabilities and/or special education needs
were newly enrolled in kindergartens and preschool education groups. On the other hand,
there is ambiguity in the limited available data on the extent to which members of the
other target subgroup – low-income and marginalized parents and their children – were
actually reached.
67. This is especially so for kindergarten and preschool group enrolments. The
original design (World Bank 2008a) included a specific indicator to track enrollment
rates of low-income and marginalized children (and a separate indicator to track
enrollment rates of children with a disability). The restructuring eliminated the “low-
income and marginalized” qualifiers on the first of these indicators to include all children.
The rationale for this was to enable low-income, marginalized children to attend
ethnically mixed schools to enable enhanced learning opportunities and social
integration. Municipality contracts included a target that at least 30 percent of new
enrollees should be target children. This was to ensure that SIP kindergarten and

19
preschools would maintain a mixed/mainstream nature, which was expected to provide an
optimal learning environment for all students.41 (Construction of kindergartens took place
in urban areas, where there was a shortage of kindergarten places.) When initial
enrollments (2013/2014) were found to have very low coverage of marginalized
(especially Roma) children within that 30 percent, World Bank supervision reporting
noted this issue and advocated for its close follow-up and monitoring. The World Bank’s
team and MLSP state that all municipalities met the 30 percent target, but IEG was
unable to obtain an aggregation of the relevant data for independent verification.
68. Of the 4,420 children ages 3–7 newly enrolled in SIP kindergarten and preschool
education groups, there is no indication of how many of them came from the low-income,
marginalized groups targeted under the project. All of the 897 children who took the
school readiness test in 2015 are identified as vulnerable. Their anonymous test results,
provided by MLSP to the researchers, did not include any identifiers (aligned with above-
cited targeting criteria) confirming that they belong to the project’s target group or
allowing any analysis of which subgroup or subgroups they represent within the target
population. This could have been accomplished, while still respecting the anonymity of
beneficiaries. It is not clear who identified these children as vulnerable and what process
and criteria were used.42 This is especially important to confirm, given that the majority
of new enrollees in kindergarten and preschool under the project were mainstream ethnic
Bulgarians (not belonging to the target group). Moreover, these 897 children (identified
as all the vulnerable children age 6/7 years in June 2015 who benefited from one or more
years of kindergarten, preschool groups under SIP and/or summer school) came from 39
specific municipalities. Even after exchanges with the World Bank’s team, it is not clear
why six additional municipalities which opened 262 new kindergarten places (net of new
crèche places) under the SIP, would have produced no vulnerable children of 6/7 years
for testing in 2015.43
69. There is no breakdown of beneficiaries of other ECD services to indicate what
portion of them were from low-income and marginalized target groups. This applies
especially to the 39,993 children ages 0–7 who benefited from health checkups, of which
some (the age 4–7 years group) were delivered in kindergartens and preschools, covering
all students. It is assumed that most of the 12,964 parents of children ages 0–3 years, who
received parenting skills counseling, are largely drawn from target groups. But a tally of
which and how many targeting criteria these beneficiaries met would have provided
insight and assurance of the reach and coverage of the program.
70. Social Inclusion. There were no measures of social inclusion outcomes in the
project’s results framework and no systematic tracking of social inclusion outcomes
during implementation, or postproject. The school readiness program (and the SIP, which
supported its pilot) defines short-term social inclusion outcomes in terms of more equal
starting conditions of children entering primary school, and more equal performance in
the early years of primary school (World Bank 2008a). Field visits provided a glimpse of
how a few selected beneficiaries are now faring in primary school, but with two
important caveats: These children were not randomly selected and might not be

20
representative of the beneficiaries, and no firm findings or conclusions can be drawn
without more systematic tracking of these children’s performance and conditions
compared with their better-off counterparts. Brief exchanges with beneficiary children
and their teachers (and their parents, in some cases) encountered during primary school
visits provide insights, nevertheless. In Byala Slatina, for example, an exchange with a
beneficiary Roma girl in first grade, her father, and her teacher revealed her mastery of
Bulgarian language, her love of school, and her early reading and writing skills.
However, she had advantages (which most Roma do not) of living in a mixed
neighborhood, with the consequent fluency in Bulgarian, and having two parents with
secondary education (also fluent in Bulgarian) who are employed, literate, and highly
supportive of her education. This raises questions about targeting and equity.44
71. In Pazardzhik, the third-grade teacher of two beneficiaries of SIP preschool (a
Roma boy and girl) pointed to some advantages of their training, but there were caveats
about the sustainability of these benefits.45 In Plovdiv, the evaluation team met twin girls
in the second grade whose teacher also noted how their preschool training made a
difference.46 In Haskovo, a primary school teacher and special education expert shared
their success in mainstreaming disabled and special needs children in the classroom,
building on the work and progress initiated under the early intervention of disabilities
service. Teachers attributed these individual children’s good performance to their
exposure to kindergarten or preschool training under the project, but the teachers,
principals, and school administrators also pointed to continuing challenges that poor,
marginalized children face that affect their performance in school. These include poverty,
poor health, inadequate Bulgarian language ability, absentee parents (who migrate for
work), lack of a safe and secure environment at home, lack of academic stimulation and
encouragement at home, violence, and dropouts and absenteeism, among others. Some of
these conditions were slated to be addressed under the integrated social services delivered
under the project (health checkups, parental skills development, and counseling), and
others are beyond the scope of these services.
72. Attribution. The positive results of the school readiness tests are directly
attributable to SIP’s support of the creation of new kindergarten and preschool group
places and outreach activities to promote the enrollment of vulnerable children. They are
not attributable to the other ECD services supported under the SIP, which were only
launched at the time of the endline school readiness testing. This project was synergistic
with government policy decisions and actions (itemized under “Risk to Development
Outcomes”) which encouraged and supported compulsory kindergarten enrollment, a
reduction in kindergarten fees, child allowance conditionality linked to school attendance
and immunization and the deinstitutionalization of children. These policies and decisions
are likely to have boosted demand for newly created kindergarten and preschool places,
disability and other social services and their uptake. In addition to the delivery of
integrated social services supported under the SIP, the work of Bulgaria’s health sector
(especially reproductive health and material and child health and nutrition), education
sector (especially education quality and learning outcomes from preschool to the

21
university level), and social assistance and child protection agencies is also critical for
enhancing school readiness outcomes. IEG exchanges with local-level NGOs supporting
ECD activities in municipalities supported under the SIP established that they were
working with the same target populations. Municipality authorities and service delivery
staff also acknowledged complementary ECD activities and family support going on in
the same communities they serve thanks to church groups, NGO projects, other charitable
organizations and efforts. Beneficiaries that may have been reached by SIP outreach
activity (for example, for school enrollment promotion) are likely to have also received
similar messages from other sources. EU financing of SIP services under its OP HRD,
from mid-2016 to 2018 must also be acknowledged, as does the work of UNICEF and the
Swiss Agency for Development and Cooperation, both working on ECD in some of the
same municipalities as the SIP.47 Although it is beyond the mandate of this study to
undertake an extensive mapping of these activities in the 66 SIP municipalities, such an
exercise could be supportive of efforts to improve program effectiveness, efficiency and
scale-up.
73. Counterfactual. Feedback on the counterfactual highlights the project’s
contributions to an innovative model of social service delivery and to substantive policy
dialogue on ECD. Systematic questioning of actors and stakeholders reveals that without
the SIP, the integrated social services model might not have been launched, and the EU
OP HRD funding of these services would not have been as easily accessed and absorbed.
Respondents also noted this project’s contributions to the ECD dialogue and policy
deliberations that are ongoing in the country. However, they also note (and IEG’s
findings corroborate) that the World Bank’s rigorous and high-quality analytic and
technical advisory work (para 10) also stimulated dialogue and deliberations and made
them even more prominent, culminating in the provision of relevant evidence,
publications, and conferences.
5. Efficiency
74. Efficiency is rated modest.
75. A strong, growing body of evidence shows that investing in ECD is highly cost-
effective. To reach full potential, children need to be in good health, well nourished,
stimulated in their earliest years, safe and secure, and exposed to frequent and positive
social interaction with adults and play. Low birthweight, reduced breastfeeding, stunting
(low height for age), and iron and iodine deficiency undermine the development of
cognitive and motor skills. High-quality ECD programs can improve school readiness,
improve success in primary school, and enhance health. They also support medium- and
long-term outcomes, including enhanced performance in secondary school and higher-
level education; enhanced employment prospects, income, and labor productivity in
adulthood; lower dependency on social protection systems in adulthood; and a break in
the cycle of intergenerational poverty.

22
76. Investments in ECD can be highly cost-effective, but significant shortcomings to
efficiency are noted. Long delays in start-up and implementation, precipitated by a
change in implementing agency and severe spending limits, curtailed the time frame for
service delivery and the amount of the loan ultimately used (59 percent of the original
amount). This, in turn, undermines cost efficiency. Overreliance on official registries to
quantify the target groups and on mobile units and mediators to reach them was
inefficient. Better knowledge and reach of target populations might have culminated in
greater impact. Failure of the monitoring committee to convene, as envisioned in the
project design, was inefficient, undermining its potential to oversee implementation,
foster cross-sectoral coordination and collaboration in line with comparative advantages
of various sectors and agencies (public, nongovernmental, and private sectors), and
ensure the full exploitation of the learning agenda embedded in the pilot design.
Consequently, the development effectiveness of the school readiness program has not
been documented or refined, as intended originally.
77. The economic analyses undertaken in the PAD and the Implementation
Completion and Results Report might have been too ambitious. They assume that those
benefiting from ECD will reap benefits in primary school, secondary school, and
thereafter (improved access to and success in higher education, and higher levels of
employment, productivity, and income). However, this evaluation’s findings show that so
much of this medium- and long-term success depends on what happens after age seven,
regardless of whether they benefit from the SIP. Low-income, marginalized project
beneficiaries might have acquired better skills and behaviors to start primary school (this
needs to be documented better), but their success in primary school and thereafter
depends heavily on factors beyond the project’s control. Many of the beneficiaries end up
attending segregated primary schools where the quality of education is low; many still
experience instability associated with their parents’ migration patterns to find
employment (temporary and permanent)—sometimes traveling with their parents and
disrupting their school attendance, sometimes staying with their grandparents or other
caregivers and suffering from depression. Additionally, many lose their rudimentary
Bulgarian language skills during summer vacations and other absences, especially when
their parents do not speak Bulgarian. Discrimination at school and in the job market is
still an issue.48
6. Ratings
Outcome
78. The project’s outcome rating is moderately satisfactory. The project’s objective
is substantially relevant overall. It is highly relevant to current country conditions and to
Bulgaria’s strategic priorities as captured in national strategic documents, and to EU
strategies to which Bulgaria, as an EU member, is accountable. It is also highly relevant
to the World Bank’s twin goals of ending poverty and building shared prosperity,
selected sector strategies (particularly ECD, health, and social protection), and its current

23
country partnership strategy for Bulgaria. However, the framing of the objectives was
very ambitious for an experimental four-year project. The design is modest. Aside from
some good design elements (innovative service delivery, services tailored to local needs
and context, and a pilot design to support learning), there were shortcomings. The results
chains supporting behavior change, learning, and capacity building were not well
articulated. Project efficacy is substantial overall. Many service delivery output targets
were exceeded, but those outputs are not a proxy for the outcomes embedded in the PDO.
Eighty percent of a matched group of children 6–7 years of age, identified as vulnerable,
who were exposed to SIP kindergartens and preschool groups for at least one year, passed
school readiness tests, compared with a 49 percent pass rate in a 2012 matched baseline
group. However, evidence is lacking to assess the efficacy of the targeting of low-
income, marginalized children and their parents (except for disabled children), as was
envisaged under the project. School readiness and social inclusion outcomes have not
been tracked, post-SIP, under EU financing. Project efficiency is modest. Investments in
ECD can be highly cost-effective, but important shortcomings to efficiency are noted.
These include implementing efficiency (significant delays in project implementation that
curtailed the time frame for service delivery), the failure to support the learning agenda
for improved program effectiveness, and the failure to harness the potential of NGOs and
CBOs and other local actors, which could have provided better data, insight, and reach to
communities.
Risk to Development Outcome
79. The risk to development outcome is moderate.
80. Technical risk is substantial. The quality of services needs to be assured through
independent inspections undertaken by inspectorates of the various relevant sectors,
including preschool and kindergarten, and health, social and child protection services.
Difficulties in attracting and retaining service providers also pose a threat to technical
sustainability, including issues of low pay for these professionals, their part-time status,
the difficult and stressful nature of the work, the low supply of qualified professionals
compared with demand (especially in more remote areas), and considering plans for
nationwide rollout. Moreover, a truncated service delivery time frame, flawed M&E and
inadequate attention to learning, results and targeting culminate in a paucity of evidence
on the school readiness program’s effectiveness and on social inclusion. The school
rediness test was administered once to 897 beneficiaries in June 2015, but there is no
evidence that it has been administered to beneficiaries in the ensuing years of service
delivery (younger ones with project support and those with EU support). Financial risk is
moderate. With SIP support, municipalities succeeded in attracting and absorbing EU
financing for up to three years after the closing of the SIP (albeit with some financing
gaps). Government assurance of continued financing of these services is provided in two
Council of Ministers decisions which commit to financial support of SIP services through
the state budget.49 The exact amount and affordability of this commitment remain to be
determined on the basis of actual costs of existing services and cost estimates of

24
extending coverage nationwide (both within the 66 pilot municipalities and beyond them
to the remaining 199 municipalities). Municipalities visited expressed their willingness to
contribute, but noted their limited financial capacity.
81. Social risk is moderate. Residents in the municipalities support and appreciate
the early intervention of disability services, which fill an important void and respond to a
growing demand. Beneficiaries’ parents are highly invested in these services, which they
say have changed the quality of their lives and their children’s. They also provide
critically needed support to deinstitutionalized children who are reinserted into
communities (many in group homes), but still need support. Other services targeted to the
nondisabled, low-income, marginalized populations—especially parental skills
development, counseling, and support—are also appreciated, as some beneficiaries
reported to IEG. However, they appear to be less known and less used than disability
services. Political risk is moderate. The coalition government has achieved a delicate
stability. The risk of waning government ownership and commitment is also moderate.
Social inclusion and school readiness are prominent in national policies and strategies.
Government has also initiated a number of decisions and actions which encourage and
support ECD efforts (compulsory kindergarten for children aged 4–6 years, child
allowance conditionality encouraging school attendance and full immunization, reduced
kindergarten fees and efforts to enroll and retain out-of-school children). These initiatives
notwithstanding, the World Bank, in its analytic work, and others50 point to the critical
need for a long-term, cross-sectoral, coherent, comprehensive, inclusive and evidence-
based ECD policy. The risk of low civil society ownership is substantial because civil
society organizations expressed that they have not been fully used as partners in program
design, implementation, evaluation and community development—areas in which they
have the comparative advantage.
82. Institutional risk is substantial. The sustainability of school readiness and social
inclusion depends heavily on the institutional/organizational framework and capacities.
The program’s innovative nature supports two challenging, ongoing reforms: cross-
sectoral coordination and collaboration, and decentralization. There is scope for further
defining agencies’ roles and responsibilities in the institutional framework in line with
comparative advantages and for better alignment of responsibilities and resources. There
also is scope for enhanced, better-defined partnerships among the public and private
sectors and civil society. The governance risk will continue to be substantial unless and
until systems and capacities for M&E are established for learning and accountability at
every level of the system.
Bank Performance
83. Overall Bank performance is moderately satisfactory.
84. Quality at entry is moderately satisfactory. Some aspects of project design were
strong, including its support of Bulgaria’s school readiness program, targeting of the most
vulnerable elements of Bulgaria’s population, innovation, its direct support to

25
municipalities, and its emphasis on evidence and learning through a pilot approach.
However, there were shortcomings, including underdeveloped results chains for behavior
change, learning, and capacity building. Fiduciary and environmental aspects were well
prepared, including proper assessments of policies, systems, and capacities and measures
for strengthening them to meet World Bank standards. Initial M&E arrangements
included the choice of indicators that reflected the multisectoral approach to school
readiness and envisioned an impact evaluation to underpin the learning agenda and
evidence base for measuring and improving program effectiveness. The failure to include
at least one M&E expert in the government’s project management team was an important
shortcoming, especially given the pilot design. Implementation arrangements gave
municipalities the responsibility for subproject design and implementation. However, the
four-year project time frame was too short to accommodate a learning-by-doing process
that included needs assessment, subproject proposal preparation, appraisal, approval,
implementation, the production of results, their evaluation and a process for learning and
national rollout. The risk assessment included good mitigation measures for risks
identified, but missed risks that occurred, including the government’s limits on project
expenditures. Bank inputs and processes were adequate, especially with task team
(including the task team leader) located in Sofia.
85. Quality of supervision is rated moderately satisfactory. Largely because of
delays caused by a change in implementing agency and spending limits (para. 34),
supervision missions during the project’s first three years focused on start-up activities,
construction, and large procurement packages, and much less so on development
objectives. The revision of the results framework and indicators in 2012 (the year
baseline data was collected) weakened the focus on the development objectives (para. 92)
and dropped indicators tracking enrolments of target groups. The World Bank’s
supervisions began to assess performance against output indicators (enrollments,
beneficiaries receiving social services) as a proxy for PDO achievement,51 which affected
the candor and quality of reporting. Conversely, supervision reporting, aide-mémoire, and
dialogue with government were candid and firm in the World Bank’s efforts to negotiate
reasonable spending limits and an extended time frame for implementation that would
allow time to deliver services. In light of implementation delays, combined with severe
expenditure limits, the World Bank’s agreement with government (reflected in the 2013
restructuring) to prioritize services over the impact evaluation made sense. In an effort to
address concerns for potential bias in the endline school readiness testing, the World
Bank used its supervision budget to recruit the same firm that conducted the baseline tests
to conduct independent observation of the process (10 percent of the sample in 7 of 39
municipalities) and carry out an analysis of results. Although the independent observation
covered a small fraction of the tests, it was all the supervision budget could afford and
did eliminate some challenges to the quality and reliability of results.52 The World Bank
was persistent and successful in building the capacity needed to attract and absorb EU
funding after the project’s closing. Supervision of fiduciary and environmental aspects
was satisfactory, as were the adequacy of supervision inputs and processes. The location

26
of the task team leader and other team members in Sofia was especially appreciated and
productive.
Borrower Performance
86. Overall borrower performance is rated moderately satisfactory.
87. Government performance is rated moderately unsatisfactory. Its ownership and
commitment to achieving the PDO was evident in its national development strategies,
which place high priority on poverty alleviation, social inclusion, human development,
productive employment, and child well-being. Moreover, during the life of the project,
and in the ensuing years, the government initiated decisions and actions which encourage
and support ECD efforts, and create increased demand for programs and services
supported under the SIP. Such decisions and actions include: compulsory kindergarten
enrollment for children ages four, five and six; the deinstitutionalization of orphaned,
marginalized, disabled and special needs children; conditionality for child allowances
linked to kindergarten attendance and full immunization; kindergarten fee reduction; and
the launch of a cross-sectoral mechanism to boost enrollment and retention in compulsory
education. While the elimination of selected activities under component 2—especially the
impact evaluation—had its rationale, alternative ways to serve the learning objectives and
improve program effectiveness were not fully exploited. Although the government
provided an enabling environment for implementation, especially in its strategic
framework documents and above-cited deisions and actions, the severe spending limits it
imposed on the project compressed the time frame for service delivery, results, and
learning. The 2008 financial crisis was beyond government control and necessitated
expenditure cuts, but the slashing of 2012 planned expenditures to half and the imposition
of zero expenditure under the project for two additional years (2013 and 2015) severely
compromised project implementation and outcomes linked to the highest-order national
priorities. The World Bank in its reporting and communications with government
characterized this as a major breach to the legal agreement and a threat to PDO
achievement. Nevertheless funding for the operating costs of new SIP kindergartens and
crèches was factored into the state budget. Central- and municipality-level government
reported that they undertook consultations with beneficiaries and other stakeholders
during subproject design, but these were limited and mostly did not extend into the
implementation period, when comparative advantages could have been exploited better.
88. Government was reasonably ready for implementation. Transfer of staff to SID
when SIF was dismantled was smooth, though it took time to accomplish. Financial
management and procurement were carried out well. M&E arrangements included the
establishment of a multisectoral project monitoring committee to oversee project
implementation and intersectoral coordination, and to guide and facilitate a learning
process. However, this committee met only four times during the six years of
implementation, at the World Bank’s prompting.53 These meetings focused largely on
implementation and financing. Even before the baselines were collected (or baseline
study even designed), the convening of meetings to lay out a meaningful learning agenda

27
and process would have served well the pilot design. Subsequently, even after the
dropping of the impact evaluation and the imposition of expenditure limits, there still was
scope for better serving the learning agenda. Information on the extent to which intended
targeting was actually achieved was not sufficiently tracked and analyzed at the program
level. Transition arrangements for the continuation of SIP activities after project closing
involved training and the establishment of procedures to acquire EU funding. These
arrangements succeeded in acquiring two years of funding, but a six-month delay
between the end of the SIP and the availability of EU funding caused a rupture in service
delivery. Council of Ministers Decisions have committed to state financing of social
inclusion services developed under the SIP starting in 2019.
89. Implementing agency performance was moderately satisfactory. Procurement
and financial management were carried out well. There were frequent visits to the pilot
municipalities, which registered appreciation for the guidance and support provided.
M&E was neglected in favor of an almost exclusive focus on indicators (mostly outputs).
The link between these outputs and the achievement of the PDO was not fully explored.
The SID supervised construction and procurement well, and the municipalities executed
them well.
Quality of Monitoring and Evaluation
90. The quality of M&E is rated modest.
91. Design. In support of the project’s pilot design, rigorous M&E was envisioned as
a means of providing policy makers with a reliable measure of the school readiness
program’s effectiveness in an initial subset of municipalities, on which basis the program
design and approach would be tracked and modified as needed to foster learning and
improve effectiveness before the nationwide rollout. M&E was also envisioned as a way
to secure political support for the program, through which effectiveness could be
demonstrated and further improved. To this end, an impact evaluation was planned as a
strategic management tool, encompassing a baseline study to be undertaken after project
effectiveness, a midterm evaluation, and an end-of-project evaluation. The lack of an
M&E expert in the government’s project implementation team was an important
shortcoming of the M&E design.
92. The original results framework included appropriate indicators for measuring the
multisectoral dimensions of the school readiness outcomes of vulnerable populations
targeted under the project. These included cognitive development (with different
measures for different age groups) and nutritional status (disaggregated by age group).
However, there was no provision for disaggregation of results by specific target groups54
or any indicator to track progress of the social inclusion objective. Intermediate outcome
indicators included enrollment rates disaggregated to show trends for children from low-
income and marginalized households and for disabled children. Intermediate outcome
indicators also captured parents’ skills and practices that would favor a healthier home
environment that is more supportive. The lack of any indicators to capture the project’s

28
intention to build central- and municipal-level capacity for program management,
implementation, and M&E was an important shortcoming of the original results
framework. The results framework failed to capture synergies with other projects and
activities to document contribution and attribution.
93. Implementation. M&E activities were not implemented as planned. The 2012
restructuring represented a setback in the quality of the M&E design. The baseline was
finally established, but only in May 2012. Only one school readiness measure was
retained (share of vulnerable children passing a school readiness test). Indicators that
were previously (and more appropriately) labeled as intermediate outcome indicators
were reclassified as outcome indicators (enrollments and beneficiaries of services) and
amended to be reported as numbers (versus rates). Measurement of parenting skills and
the home environment were dropped. Indicators were added to measure the project’s
capacity building efforts, but focused on outputs (people trained), not on outcomes of
such training. The 2013 restructuring eliminated the impact evaluation to prioritize the
use of very limited project resources for establishing and delivering services. The
compressed time frame for service delivery and methodological issues provided
additional rationale for dropping the impact evaluation. 55 The 2013 restructuring largely
maintained the December 2012 targets and indicators, providing two additional years to
achieve the same targets as those set in 2012 or slightly lowered targets, in a few cases.
Except for the school readiness test, data on all other revised indicators were to be
compiled based on quarterly reports submitted by the 66 participating municipalities.
Measurements under the revised indicators did not accommodate tracking the coverage or
nature of target groups (no denominators qualifying the significance of numbers of
beneficiaries of various services and no record of the extent to which beneficiaries
identified as vulnerable responded to multiple criteria for targeting low-income,
marginalized groups). Municipalities reported regularly on the revised project indicators.
M&E training was provided to municipalities, but there was no institutional memory of
this training in the five municipalities visited. The project’s intention to build central and
municipal capacity in program management and M&E did not happen. The failure to use
municipal, MLSP, and Ministry of Education and Science program management staff to
exploit existing data and information systems to monitor and analyze data and trends (for
example, attendance and dropout rates of vulnerable children) and document and share
learning and fine-tuning was a missed opportunity. Under OP HRD financing, indicators
were reduced even further to essentially two: the number of beneficiaries and the number
of service providers. There is no record of the project monitoring committee meeting to
review or discuss project performance data for the purposes of learning. The option of
postponing the impact evaluation a few years, until after EU financing was completed,
was not considered. Neither was the option of conducting school readiness tests of
vulnerable beneficiaries in the years after SIP closing to assess trends for children who
would have (i) started benefiting from preschool education at an earlier age; and (ii)
benefited from exposure of the range of integrated services, which the first set of children
tested did not receive at the time of their testing in June 2015.

29
94. Use of data for decision making. The use of project indicators for refining
program effectiveness and strategic decision making was limited because most were
focused on outputs. However, there was some indication at the municipal level of some
use of service data. The municipality of Pravets noted that its monthly reports and data
(prepared by an NGO) are reviewed and tracked at the municipal level. Byala Slatina
Municipality mentioned holding monthly meetings to discuss difficulties and to solicit
donor support to address issues and fill gaps in their work. Haskovo, Plovdiv, and
Pazardzhik all noted their efforts to reach out to various data sources inside and outside
of Bulgaria to piece together information on location and coverage of out-migrants by
selected services. All mentioned using the data of individual cases and clients for
coordination across a range of social inclusion services.
7. Lessons
95. Official databases are important, but may need to be complemented with mapping
of target communities and households and their needs, constraints, priorities, motivations,
and dynamics undertaken by those with intimate knowledge of the community and with
community development expertise. Exclusive reliance on official databases (whether at
the national or municipality level) risks undermining the full and accurate identification
and quantification of target groups necessary for designing and setting priorities for
interventions, assessing real coverage, and effectively reaching those in need. Baseline
and endline beneficiary assessments may have helped to identify target groups and their
needs more accurately and track their outcomes.
96. Mobile services and mediators face challenges in reaching target populations,
especially when mediators are few relative to their target populations and do not share the
language, culture, and living conditions of those populations. Leveraging their efforts
with NGOs, CBOs, and other leaders and actors trusted by the community has the
potential to enhance the coverage and effectiveness of services. NGOs, CBOs, local
institutions, and community leaders and representatives have a crucial role to play in
brokering supply and demand for services and giving voice to target communities. Their
potential roles and comparative advantages include troubleshooting, problem-solving,
prioritization, targeting of services, listening to leaders and other community members.
This nurtures mutual trust, constructive dialogue, and a learning-by-doing process.
97. Low appreciation of evidence for learning, program refinement, and
policymaking can undermine the effectiveness of programs and policies, especially where
piloting is intended. The development of M&E capacities could provide MLSP with a
critical management tool for ensuring continuous learning and accountability for ECD
results and increase its potential for resource mobilization and future replication. As the
government of Bulgaria moves toward the development of a policy on ECD, it needs to
articulate an M&E plan and framework; articulate roles and responsibilities for data
collection and analysis and reporting; develop M&E capacity and systems; and establish
a process for vetting and acting on data.

30
98. Experience under the SIP reveals the scope and opportunity to clarify roles and
responsibilities to optimize comparative advantages and synergies of the many actors
involved, both horizontally (across partners at each level of the system) and vertically (up
and down the various levels of national, regional, and municipal government). The fuller
analysis and refinement of the institutional and organizational framework is critical for
growing the SIP experience into a nationwide school readiness program (or ECD policy).
Insights gleaned from field visits and discussions indicate opportunity for enhanced
effectiveness of ECD efforts through: (i) fine-tuning decentralization arrangements,
including a better alignment of responsibilities and financing across levels; municipality
capacity building in program management and M&E; clearer articulation of quality
assurance responsibilities and accountabilities; more facilitation of cross-municipality
learning and exchange; and research and studies to document collective and individual
effectiveness of the various levels; and (ii) fuller exploitation of partnerships at each level
of government—cross-sectorally (within the public sector) and between government and
its various development partners: international, for-profit, nonprofit, civil society, and
communities. This could ensure coordination of actors at each level and culminate in
greater efficiency and effectiveness through joint and holistic oversight of financing and
performance.
99. Investments in ECD and social inclusion activities targeted to low-income and
marginalized children ages 0–7 years and their parents are necessary, but they are
insufficient to ensure the children’s success and inclusion in primary school and beyond.
Continued delivery of integrated social services and social inclusion interventions during
their primary school years (and beyond), support for teachers for coping with the
challenges of social inclusion in the classroom, and improved education quality are also
critical. Opportunity exists for strengthening networks and partnerships between the
integrated social services and social inclusion activities delivered at the municipality
level and primary school teachers and administration to ensure cohesive and continued
support to children and their families. The inclusion of low-income, marginalized,
disabled, and/or special needs children in mainstream classrooms generates considerable,
additional challenges and workload for teachers and administrators. Such challenges
include discipline, poverty and social issues at home, language barriers, learning
accommodations, and physical accommodations, among many others. Teachers need
additional support to take on these challenges and workload, which could otherwise
undermine their ability to teach all children. Whether children attend primary schools
with mixed ethnicities or single-ethnicity schools in Roma neighborhoods, all students of
all schools deserve a quality education. Investments in education quality are critical to
ensure returns on the SIP investment.

31
Bibliography
Bartlett, William, Claire Gordon, and Bregtje Kamphuis. 2015. Evaluation of the EU Framework for
National Roma Integration Strategies: Study for the LIBE Committee. Brussels: European Union.
Bulgaria, Government of). n.d. National Development Programme: Bulgaria 2020. Sofia: Government of
Bulgaria.
———. 2005. National Action Plan Roma Inclusion Decade 2005–2015. Sofia: Government of Bulgaria.
———. 2011. 2011 Population Census, Main Results. Sofia: Government of Bulgaria.
———. 2012. National Roma Integration Strategy of the Republic of Bulgaria (2012–2020): Draft. Sofia:
Government of Bulgaria.
DecadeWatch. 2007. Roma Activists Assess the Progress of the Decade of Roma Inclusion, 2005–2006.
s.l.: Decade Watch. 2007.
Dimitrov, Dimitar, Vania Grigorova, and Joana Decheva. 2013. Civil Society Monitoring Report on the
Implementation of the National Roma Integration Strategy and Decade Action Plan in 2012 in
Bulgaria. Budapest: Decade of Roma Inclusion Secretariat Foundation.
European Commission. 2016. “Progress Made by EU Member States in Roma Integration.” Fact Sheet
(June), Justice and Consumers Directorate-General June, European Commission, Brussels.
European Union European Social Fund. n.d. Human Resources Development Operational Programme
2014–2020. Brussels: European Union.
Gatti, Roberta, Sandor Karacsony, Kosuke Anan, Celine Ferré, and Carmen de Paz Nieves. 2016. Being
Fair, Faring Better: Promoting Equality of Opportunity for Marginalized Roma. Washington, DC:
World Bank.
Kabakchieva, Petya, and Desislava Hristova. 2012. Civil Society in Bulgaria: NGOs versus Spontaneous
Civic Activism? Sofia: Open Society Institute.
Kolev, Deyan, ed. 2013. Monitoring and Evaluation of the National Roma Integration Strategies (focus on
Bulgaria and Romania). Plovdiv, Bulgaria: Center for Interethnic Dialogue and Tolerance
“Amalipe.”
Market LINKS Research and Consulting. 2015. Social Inclusion Project in Bulgaria, School Readiness
Test Comparison 2012–15. Sofia: Market LINKS Research and Consulting.
Opening Doors for Europe’s Children. 2016. Strengthening Families, Ending Institutional Care:
Recommendations to the European Union on Post-2020 Multiannual Financial Framework.
Brussels: Opening Doors for Europe’s Children.
Ringold, Dena, Mitchell A. Orenstein, and Erika Wilkens. 2005. Roma in an Expanding Europe: Breaking
the Poverty Cycle. Washington, DC: World Bank.
Roma Education Fund. 2007. Advancing Education of Roma in Bulgaria: Country Assessment and the
Roma Education Fund Strategic Directions. Budapest: Roma Education Fund.
———. 2015. Advancing the Education of Roma in Bulgaria: REF Country Assessment—2015. Budapest:
Roma Education Fund.
Rorke, Bernard, Margareta Matache, and Eben Friedman. 2015. A Lost Decade? Reflections on Roma
Inclusion 2005–2015. Budapest: Decade of Roma Inclusion Secretariat Foundation.
UN (United Nations). 2010. Analysing and Measuring Social Inclusion in a Global Context. New York:
UN.

32
UNICEF (United Nations Children’s Fund). 2017. Country Programme Document: Bulgaria. New York:
UNICEF.
United States Commission on Security and Cooperation in Europe. 2008. The Human Rights Situation of
Roma: Europe’s Largest Ethnic Minority. Briefing of the Commission on Security and
Cooperation in Europe. 109th Congress, 2d Session. Washington, DC: U.S. Congress.
World Bank. 2006. Bulgaria—Country Partnership Strategy, FY07–09. Washington, DC: World Bank.
———. 2008a. “Bulgaria—Social Inclusion Project.” Program Appraisal Document Report 38604, World
Bank, Washington, DC.
______. 2008b. Bulgaria—Loan Number 7612-BG (Social Inclusion Project) Loan Agreement.
Washington, DC: World Bank.
———. 2009a. “Bulgaria: Poverty Implications of the Global Financial Crisis.” Poverty Study 47792,
World Bank, Washington, DC.
———. 2009b. “Bulgaria Social Assistance Programs: Cost, Coverage, Targeting, and Poverty Impact.”
Social Protection Study 47793, World Bank, Washington, DC.
———. 2010a. “Bulgaria: Assessing the Quality of Education in Bulgaria Using PISA 2009.” Education
Study 70247, World Bank, Washington, DC.
———. 2010b. “A Review of the Bulgaria School Autonomy Reforms.” Education Study 54890-BG,
World Bank, Washington, DC.
———. 2011a. “Bulgaria Country Partnership Strategy Completion Report (CPSCR) Review for the
Period FY07–11.” Independent Evaluation Group, Country Partnership Strategy Completion
Report Review 89048, World Bank, Washington, DC.
———. 2011b. Bulgaria—Country Partnership Strategy for 2011–13. Washington, DC: World Bank.
———. 2012. “Strengthening Higher Education in Bulgaria: Options for Improving the Models of
Governance, Quality Assurance, and Financing of Higher Education.” Working Paper 70280,
World Bank, Washington, DC.
———. 2013. “SABER Teacher Country Report: Bulgaria 2013.” Working Paper 82164, World Bank,
Washington, DC.
———. 2014. “Gender Dimensions of Roma Inclusion: Perspectives from Four Roma Communities in
Bulgaria.” Working Paper 84693, World Bank, Washington, DC.
———. 2015a. “Bulgaria’s Potential for Sustainable Growth and Shared Prosperity.” Systematic Country
Diagnostic 99721, World Bank, Washington, DC.
———. 2015b. FY15 Bulgaria Country Opinion Survey Report. Washington, DC: World Bank.
———. 2015c. Improving the Quality of Bulgaria’s Education System: A Review of Bulgaria’s
Performance on the 2015 Programme for International Student Assessment (PISA 2015).
Washington, DC: World Bank.
———. 2016a. Bulgaria—Country Partnership Framework for the Period FY17–22. Washington, DC:
World Bank.
———. 2016b. “Bulgaria—Social Inclusion Project.” Implementation Completion and Results Report
ICR3724, World Bank, Washington, DC.
———. 2016c. Republic of Bulgaria. Expanding and Improving Early Childhood Development, A Review
of Current Trends, Lessons Learned, and Policy Directions for Bulgaria, Report No: ACS18653,
GED03, Europe and Central Asia, June. Washington, DC: World Bank.

33
———. 2017a. “Bulgaria—Social Inclusion Project.” Independent Evaluation Group, Implementation
Completion and Results Report Review ICRR0020315, World Bank, Washington, DC.
———. 2017b. Supporting Disadvantaged Children to Enter Kindergarten: Experimental Evidence from
Bulgaria. Washington, DC: World Bank.
Yosifov, Yordan, Dr. Vesela Banova, Dr. Lyubomir Zhupunov, Annet Marinova, Prof Tatyana Kotzeva,
Stanislava Moraliyska, Assoc. Prof. Elitsa Dimitrova, Kalina Ilieva, Elitsa Gerginova and Vania
Kaneva, Editor. 2018. “A study of the systems supporting early childhood development, the
interaction and cooperation between them and with parents.” Sofia, Bulgaria.
1 Unless otherwise cited, the source for these data is the World Bank’s Country Partnership Framework for
Bulgaria (FY17–22), April 21, 2016.
2 Self-reporting as ethnic Roma is undermined by fear of discrimination and the sentiment that they are
Bulgarian because they live in Bulgaria.
3 Sixty-four percent of self-identified Turkish people live in Kardzhali, Razgrad, Targovisthe, Shumen,
Silistra, Dobrich, Ruse, and Burgas. The highest concentration of Roma live in Montana, Sliven, Dobrich,
and Yambol.
4 This section’s information is drawn from the World Bank’s “Expanding and Improving Early Childhood
Development: A Review of Current Trends, Lessons Learned, and Policy Directions for Bulgaria,” June
2016, which provides an overview of the main issues in early childhood development (ECD) in Bulgaria
based on extensive analytic work, support, and dialogue.
5 Eurostat http://appsso.eurostat.ec.europa.eu/nui/submitViewTableAction.do
6 Fees for public nurseries and preschools are partly subsidized by local authorities, and further reduced for
disadvantaged children. But part of the public school fee has to be borne by parents. Private schools charge
the full fee and sometimes constitute the only option due to lack of space in public schools. Indirect costs
(clothing, shoes, learning materials) are also a factor. In 2011 the monthly cost of preschool for a Roma
child was estimated to be prohibitive at €15,4 (United Nations Development Programme–World Bank–
European Commission Regional Roma Survey, 2011.
7 Access to health care is inadequate because of distance, inadequate quality and capacity, lack of health
insurance, prohibitive costs, and a lack of awareness of patient rights and the value of services for their
children’s physical and emotional health.
8 Poor children often go hungry and live in substandard housing, which affects their health and learning
ability.
9 Parents’ low educational attainment significantly reduces their ability to promote their children’s
emotional and intellectual well-being to make them school-ready.
10 Some parents of disadvantaged children do not trust that their children will be fairly and respectfully
treated by the staff and other children in the nursery or kindergarten and thus choose to keep them at home.
11 NSI; http://www.nsi.bg
12 The project appraisal document’s project development objective (PDO) statement is as follows: “The
government of Bulgaria aims to promote intergenerational social inclusion by developing and rolling out
nationally a school readiness program to equalize starting conditions of children entering primary school. In
support of this policy agenda, the proposed PDO for the Social Inclusion Project [SIP] is to promote school
inclusion through increasing the school readiness of children below the age of 7, targeting low-income and
marginalized families (including children with a disability and other special needs). The SIP will contribute
to the sustainability of the school readiness program by supporting the absorption of European Social Fund
[ESF] financing.”
13 The 27 regional capitals were automatically assigned as SIP beneficiaries based on the following
common factors: concentration of a greater number and multidimensional social problems; greater ethnic

34
diversity of their population; shortage of kindergarten places; greater possibilities for benefiting from
project services; and a greater number of prospective end beneficiaries (project operations manual, May
2014).
14 The criteria to reveal the greatest need included the following: children on social assistance benefits and
monthly family benefits; family size; young parents; single-parent households; children with disabilities
receiving allowance for permanent disabilities; kindergarten and primary school enrollment rates;
preschool-age children; unemployment rate; and unemployed up to age 35 years registered.
15 Originally, the SIP required that municipalities commit to maintaining newly created integrated social
services for 10 years after project completion for investments involving construction, repair works, and
equipment, and for five years after project completion for investments in services only. Under the 2012
restructuring, these commitments were reduced to five years and three years, respectively.
16 Designed in the boom (precrisis) years, the original SIP design envisioned the achievement of national
coverage of the SIP services within four years of implementation. The first two years were dedicated to a
pilot in treatment municipalities (including procurement, construction and delivery of services), bringing in
the control municipalities in the third, and end with one year of national expansion in the fourth year of
implementation.
17 It was not possible to factor these counterparts into the original estimates because there was no
breakdown of Bulgarian government and ESF financing, the latter financier expected to finance the
program rollout.
18 This amount does not include ongoing postproject ESF financing of the 66 municipalities (2016–18). The
total actual project cost of 25.99 million euros.
19 For projects with investments in construction, repair works, and equipment, the time frame was reduced
from 10 years to five years after project completion. For projects with investments in services only, without
any construction or repair works, the time frame was reduced from five years to three years after project
completion.
20 Revisions to the results framework included substantial changes to outcome and intermediate outcome
indicators, the introduction of baseline values for all indicators, and inclusion of indicators for the capacity
building component (appendix D, table D.1).
21 Reductions in project activities reflected a shortening of the implementation period of SIP services under
the project from an original estimate of 24 months to about 12 months, the elimination of the impact
evaluation, and the need to align project spending with expenditure limits in the 2013 State Budget Act.
22 The specialists the municipalities contracted (1,409 total) included 289 pediatricians, nurses, mediators,
and dentists to deliver health counseling for children; 240 pedagogues and mediators to provide remedial
education in summer schools; 237 pediatricians, psychiatrists, rehabilitation specialists, psychologists,
speech therapists, social workers, and mediators to deliver early intervention of disabilities services; 47
social workers and mediators to provide pedagogical support to disabled children; 525 pediatricians,
gynecologists, midwives, nurses, psychologists, legal experts, mediators, and social workers to develop
parenting skills and provide family counseling and support; 29 social workers, pedagogues, and mediators
to support integration in kindergartens; and 42 social workers and coordinators.
23 There are no identifiers to confirm low-income status, how or to what extent they are marginalized, and
how many are disabled or have special needs (and with what disabilities or special needs).
24 According to MLSP project data, 2,482 were enrolled by December 31, 2014 (one year before the
project’s end), an additional 683 were enrolled by June 30, 2015 (six months before the project’s end), and
1,255 were enrolled during the project’s last six months.
25 The training of kindergarten and crèche staff was originally slated for project support, but this was
ultimately financed by the EU’s Science for Smart Growth Program.

35
26 Criteria include multiple siblings attending, guaranteed minimum income recipients, single-parent
households, very young parents, and disabled students, among others.
27 Clients’ perspectives are important, but independent technical experts need to oversee and ensure the
quality of services.
28 In Bulgaria, there has been a significant decrease (more than 80 percent) in the number of children placed
in institutional care from 7,587 in 2009 to 1,495 at the beginning of 2016. In 2015 alone, 1,226 children left
institutional care, and 33 institutions were closed. In 2015, there were 6,463 children in kinship care and
2,323 children in foster care. All specialized institutions for children with disabilities have been closed. In
October 2016, Bulgaria’s “Vision for Deinstitutionalization of Children in Bulgaria 2016–20” was
officially adopted.
29 It was beyond the Independent Evaluation Group’s (IEG) mandate and budget for this study to undertake
an independent verification of children’s outcomes and their attribution to the services.
30 Of these 471 disabled children, 157 were reported as enrolled in kindergarten as of December 31, 2014
(before the launch of disability services under the project), and an additional 205 were enrolled in
kindergarten or preschool as of June 30, 2015, when disability services had been operating for only a few
months.
31 In Bulgaria, health services are free for children under age 18, which would make it feasible for even the
poorest parents to follow up on referrals they might have received.
32 A pattern of comments revealed that there is fear among the population that the services are linked to the
Child Protection Agency, which is perceived as the agency that would take their children away from them.
Most mediators encountered during IEG field visits do not belong to the ethnic minority groups they were
targeting.
33 Cultural barriers that mediators encountered include the following: Muslim women forbidden to use
contraception for religious reasons; some Muslims and Roma women forbidden to consult a male
gynecologist; some Roma girls forbidden to study beyond grade 4 because of early marriages and a
perceived risk of loss of innocence. Moreover, some Roma parents are unaware of the benefits of early
intervention of disabilities services and fear a stigma if a disabled Roma child uses such services. Some
Roma families refuse to accept that their child might have a disability.
34 There is evidence of providers working overtime in emergencies and client crises.
35 The Baseline Impact Evaluation Study, undertaken in 2012, collected information (through a field survey
of vulnerable parents) on parenting skills deficits among parents in vulnerable households (Industry Watch
and Market LINKS 2012).
36 Technical work included the development of criteria for a continuation of financing under the 2014-20
HRD OP and the preparation of guidelines for application for funding under HRD OP.
37 The two municipalities that dropped out of the pilot are Yakoruda and Maritsa.
38 Some municipalities work with private companies to undertake charitable campaigns to generate
products and gifts for vulnerable parents and their children. Community centers work together with some
kindergartens and a few primary schools to follow up and support school readiness and disability and
integration efforts focused on parents and children. Community centers refer clients to municipal services
(health and social assistance, among others). Municipal health authorities sought the help of mediators to
reach children who were not vaccinated, and municipal education authorities sought the help of mediators
to reach out-of-school children and their families.
39 School readiness tests assessed children’s visual interpretation, communication skills, counting and math
skills, sound comprehension, motor skills, general knowledge, and reading and writing skills.
40 An estimated 30 percent of Roma did not hold a national identification card in 2013 (Dimitrov et. al
2013).

36
41 Keeping target groups to a level of about 30 percent of all students was considered a way to discourage
the withdrawal of ethnic Bulgarian students and thus maintain an ethnically mixed, optimal environment
for learning..
42 By contrast, the 2012 tests administered as part of an extensive baseline study were administered to
children who came from households that independent researchers identified as low income and/or
marginalized, based on a rigorous methodology of household visits, observations, and interviews with
parents and children (Industry Watch and Market LINKS 2012).
43 In response to IEG’s request for clarification, the World Bank’s team stated that the lack of tested
children in these six municipalities meant that at the time of school readiness testing, these municipalities
confirmed that there were no vulnerable children that complied with the testing requirement in June 2015
(aged 6/7 years and beneficiary of one to two years of SIP kindergarten exposure. But this does not
necessarily mean that these specific kindergarten groups did not serve vulnerable children. The World
Bank’s team explained that new places were allocated more or less equally across four age tranches –
25 percent each for children aged 3–4 years, 4–5 years, 5–6 years and 6–7 years. This should mean that
about 58 children 6–7 years of age would have benefited from the 232 places in these six additional
municipalities and would have been eligible for testing.
44 The Roma girl’s father and mother both have a secondary education, are employed, and support and
encourage her learning at home. They live in a mixed neighborhood, which enabled the girl and her father
to speak perfect Bulgarian. According to the father, their family does not experience discrimination in their
neighborhood. Her teacher shared the girl’s school workbook (which was neat and complete) and compared
it with the sloppier work of another student who did not benefit from the project. The teacher noted that the
girl started primary school with all the prerequisite skills and good classroom discipline and attributed these
differences to the project. However, it is likely that her parents’ education, employment status, residence in
a mixed, Bulgarian-speaking neighborhood, and attendance at an ethnically mixed primary school were key
factors in the girl’s success in school.
45 The girl spoke Bulgarian with some difficulty, and the boy spoke Bulgarian with great difficulty. The
school they attended was segregated (purely Roma). IEG could not assess the quality of the primary school,
but the principal shared that his school and another neighboring all-Roma school “compete for last place”
in school rankings every year. Exchanges with teachers and administrators made clear the extreme
difficulties and challenges they face working with vulnerable children. Those lacking a secure environment,
stability at home, books and other educational resources, and parents’ aspirations for their children’s
education and future all have a negative impact on children’s academic success, attendance, and dropout
rates.
46 The teacher noted that these girls are more inquisitive and better prepared. However, home environments
can pull them back. Specifically, the parents’ inability to speak Bulgarian causes the children to lose their
Bulgarian language skills during the summer, and the parents’ extended absences to work abroad cause the
children to feel neglected and depressed. Additionally, the parents do not encourage their girls to go to
school beyond the fourth grade.
47 UNICEF provides technical assistance and financing to Bulgaria to strengthen the delivery of health,
nutrition, and education services for young children. The Swiss Agency for Development and Cooperation
also supports the strengthening of health and education service delivery for young children and a program
to address the needs of Roma. International and local NGOs and CBOs support a range of programs and
activities aimed at improving the health, education and well-being of vulnerable groups, including services,
outreach and building evidence for policymaking and enhanced program effectiveness. Among these, the
Roma Education Fund supports Roma access to kindergarten and preschool.
48 Teachers and school administrators encountered in Roma schools and other municipality staff raised
these issues consistently.
49 The two decisions are (i) Decision #859/13.10.2016 of the Council of Ministers (updated Action Plan for
the Implementation of the National Strategy “Vision for Deinstitutionalization of Children in Bulgaria),
which states that from 2019 forward, the ECD services established under the SIP project shall be financed

37
from the state budget through the municipal budgets; and (ii) Decision #277/24.04.2018 of the Council of
Ministers adopting the state funding standards for 2019.
50 World Bank 2016c and Yosifov, Yordan, et al. (2018)
51 This actually created a fractured results chain. School readiness tests measured school readiness of target
children who were enrolled in SIP kindergartens, especially their cognitive skills. But the complementary
services, expected to contribute to school readiness outcomes, were launched only at the time of the
administration of the school readiness tests.
52 This enabled the World Bank and the researcher to assess bias, eliminate invalid tests and analyze and
compare baseline and endline results based on a matched sample of tests completed by children with
comparable characteristics at baseline and endline testing.
53 The first meeting was held at the time of the SIP municipal subporjects selection and approval process
(December 2011). The second was convened at the point when the construction works were completed
(February 2013). The third (May 2014) took place at the point when various bottlenecks began surfacing
(insufficient funding, recruitment of service providers and launch of health and social services). The fourth
(2015) focused on the continuation and sustainability of the SIP interventions under OP HRD financing. A
new monitoring committee was established in 2016 to oversee the OP HRD financing of SIP activities, and
the monitoring committee for the World Bank–financed SIP was dismantled.
54 For example, disaggregation to show trends for disabled versus low-income, marginalized groups would
have allowed a better understanding of the reach of the project’s target groups.
55 Methodological issues that challenged the impact evaluation, according to the World Bank’s task team,
included the huge variation of services chosen by municipalities, precluding the meaningful grouping of
municipalities providing the same types of interventions; and government’s adoption of a competitive
process for selection of pilot municipalities, which introduced self-selection bias and flawed the originally
planned randomized controlled design


39
Appendix A. Basic Data Sheet
SOCIAL INCLUSION PROJECT (LOAN 7612-BG)
Table A.1. Key Project Data ($, millions)
Appraisal
Estimate
Actual or
Current Estimate
Actual as Percentage of
Appraisal Estimate
Total project costs 59.00 30.68 52.00
Loan amount 59.00 30.51 52.00
Cancelation 0.00 24.23 n.a.
Source: Implementation Completion and Results Report Review and SAP project supervision disbursement data.
Table A.2. Cumulative Estimated and Actual Disbursements
Category FY09 FY10 FY11 FY12 FY13 FY14 FY15 FY16 FY17
Appraisal estimate
($, millions) 3.69 19.21 39.13 52.45 58.37 59.09 59.09 59.09 59.09
Actual ($,
millions) 0.00 0.00 0.79 10.15 16.60 24.64 31.36 30.53 30.51
Actual as percent
of appraisal 0.00 0.00 2.00 19.00 28.00 42.00 53.00 52.00 52.00
Date of final disbursement: 04/30/2016
Source: SAP project supervision disbursement data.
Table A.3. Key Project Dates
Original Actual
Concept review 10/19/2006 10/19/2006
Negotiations 09/26/2008 09/26/2008
Board approval 11/04/2008 11/04/2008
Signing 11/18/2008 11/18/2008
Effectiveness 04/16/2009 04/16/2009
Closing date 10/31/2013 12/31/2015
Table A.4. Task Team Members
Name Title Unit
LENDING AND SUPERVISION
Christian Bodewig Program Leader ECCU5

40
Blaga Djourdjin Procurement Specialist GGO03
Lire Ersado Senior Economist GSP05
Roberta V. Gatti Lead Economist GSPDR
Rebekka E. Grun Asst. to the President EXC
Kari L. Hurt Senior Operations Officer GHN02
Mirela Mart Financial Management Specialist ECADE
Peter Ivanov Pojarski Consultant GSP03
Svetlana Georgieva Raykova Associate Operations Officer CASPM
Albena Alexandrova Samsonova Program Assistant ECCBG
Bogdan Constantin Constantinescu Sr Financial Management Specialist GGO21
Anneliese Viorela Voinea Financial Management Specialist GGO21
Valeria Nikolaeva Procurement Specialist GGO03
Plamen Nikolov Danchev Senior Education Specialist GED02
Adela Delcheva Program Assistant ECCBG
Table A.5. Staff Time Budget and Cost for World Bank
Stage of Project Cycle
Staff Weeks
(no.)
Finance, including Travel and
Consultant Costs
($, thousands)
LENDING
FY06 2.30 10.85
FY07 50.95 252.81
FY08 11.77 60.35
Total 65.02 324.01
SUPERVISION AND IMPLEMENTATION COMPLETION AND RESULTS REPORT
FY09 9.57 71.72
FY10 18.81 54.88
FY11 20.18 58.75
FY12 12.55 38.30
FY13 16.58 31.61
FY14 13.53 35.05
FY15 15.48 20.27
FY16 12.77 29.32
Total 119.47 339.90

41
Appendix B. National Policies on Social Inclusion and Early
Childhood Development and Relevant World Bank Portfolio
Box B.1. National Development Program: Bulgaria 2020
Goals
▪ Raising the standard of living through competitive education and training, creating conditions
for quality employment and social inclusion and ensuring accessible and quality health care
▪ Building of infrastructure networks, providing optimal conditions for the development of the
economy and quality and healthy environment for the population
▪ Enhancing the competitiveness of the economy by ensuring a favorable business
environment, promotion of investments, application of innovative solutions, and improving
resource efficiency
Priorities
▪ Improving the access to and enhancing the quality of education and training and the quality
characteristics of the workforce
▪ Reducing poverty and promoting social inclusion
▪ Achieving of sustainable integrated regional development and use of local potential
▪ Development of the agricultural sector to ensure food security and production of products
with high value-added through sustainable management of natural resources
▪ Support of innovation and investment activities to increase the competitiveness of the
economy
▪ Strengthening the institutional environment for higher efficiency of the public services for
citizens and businesses
▪ Energy security and increasing resource efficiency
▪ Improving transport connectivity and access to markets
Source: Bulgaria, n.d.

42
Box B.2. Declaration of the Decade of Roma Inclusion, 2005–15
Signed: in Sofia, Bulgaria on February 2, 2005 with eight countries signing
Components of decade action plans that each country would adopt and tailor to its own specific
circumstances
Education
▪ Ensuring access to compulsory education
▪ Improving the quality of education
▪ Implementing integration and desegregation
▪ Expanding access to preschool education
▪ Increasing access to secondary, postsecondary, and adult education
Employment
▪ Increasing opportunities through education and skills
▪ Expanding labor market participation through active measures
▪ Improving labor market information
▪ Reforming employment services
Health
▪ Ensuring access to health care
▪ Increasing the information base on Roma health
▪ Raising the inclusiveness of health systems
▪ Improving health in vulnerable communities
Housing
▪ Tackling discrimination in housing
▪ Improving living conditions in settlements
▪ Expanding access to housing
Source: Declaration of the Decade of Roma Inclusion, 2005–15, February 2, 2005.

43
Box B.3. Bulgaria’s Action Plan for the Decade of Roma Inclusion 2005–15
Priority Areas and Goals
Education
▪ Guarantee the right to equal access to quality education to children and pupils from the Roma
ethnic minority
▪ Preservation and development of the cultural identity of the children and pupils from the Roma
ethnic minority
▪ Creation of prerequisites for successful socialization of Roma children, pupils, and youth
▪ Transformation of the cultural diversity into a source of and a factor for knowledge of each
other and spiritual development of the young people. Establishment of an atmosphere of
mutual respect, tolerance, and understanding
▪ Formation of appropriate social psychological climate, favorable for the educational integration
of children and pupils from the Roma minority
Health Care: Reduction of mortality and morbidity and suspension of negative trend in the
health status of the Roma population
▪ Reduction of infant mortality
▪ Improvement of health care of newborns and children under school age
▪ Improvement of preventive activities amid Roma population
▪ Increase of health awareness and level of information of Roma population
▪ Improvement of access to health services
▪ Assessment and monitoring of the health status of the Roma population
Housing: Sustainable improvement of living conditions for Roma population in Bulgaria
▪ Providing opportunities for access to houses in compliance with the state standards in areas
with predominant Roma population
Employment
▪ Improvement of the competitiveness of the Roma population in the labor market, including in
modern spheres of labor activity
▪ Encouragement of entrepreneurship, start-up, and management of own business activities
▪ Capacity building for Roma employment promotion
Protection against Discrimination and Guaranteeing of Equal Opportunities
▪ Improvement of the police officers’ work effectiveness in a multicultural environment,
adhering to standards and regulations on human rights protections
▪ Encouragement of tolerant interethnic relations through sports initiatives
▪ Increase of Roma people presence at all levels of the public administration
▪ Higher effectiveness of the social assistance system achieved through improvement of the
social workers qualification to work in a multiethnic environment
Culture: Providing conditions for the preservation of the Roma cultural identity and its
development as an intrinsic element of the national cultural identity
▪ Ensuring sustainability and steadiness of the cultural integration
▪ Development of ethnic minorities’ culture as specific ones and as part of the national culture
▪ Improvement of the Roma public image in the society, especially in the media
Source: Bulgaria 2005.

44
Box B.4. National Roma Integration Strategy of Bulgaria, 2012–20
Summary
Strategic Goal
Creating conditions for equitable integration of the Roma and Bulgarian citizens in a vulnerable
situation, belonging to other ethnic groups, and in the social and economic life by ensuring equal
opportunities and equal access to rights, goods, and services by involving them in all public
spheres, and improving their quality of life while observing the principles of equality and
nondiscrimination
Guiding Principles
1. Constructive, pragmatic, and
nondiscriminatory policies
2. Explicit, but not exclusive targeting
3. Intercultural approach
4. Aiming for the mainstream
5. Awareness of the gender dimension
6. Transfer of evidence-based policies
7. Use of European Union instruments
8. Involvement of regional and local
authorities
9. Involvement of civil society
10. Active participation of the Roma
Priorities, Operational Objectives, and Lead Responsible Institutions
1. Education: Enrolling or retaining in the educational system all Roma children and students,
ensuring high-quality education in a multicultural environment (Ministry of Education, Youth,
and Science)
2. Health care: Ensuring equal access to quality health care services and preventive programs
(Ministry of Health)
3. Housing conditions: Improving the housing conditions and the technical infrastructure
(Ministry of Regional Development and Public Works)
4. Employment: Improving the access of Roma to the labor market and raising Roma
employment rate (Ministry of Labour and Social Policy)
5. Rule of law and nondiscrimination: Guaranteeing citizens’ rights, with an emphasis on the
rights of women and children, protecting public order, prevention, and combatting any
manifestations of intolerance and hate speech (all state institutions, agencies, the Commission
for Protection against Discrimination, advisory structures, and so on, in accordance with
competencies)
Culture and Media
1. Creating conditions for equal Roma access to the cultural life, and preserving and developing
the traditional Roma culture and creativity (Ministry of Culture)
2. Creating conditions for equitable presentation of the Roma community, for changing its
negative image, and combatting hate speech in the printed and electronic media (National
Council for Cooperation on Ethnic and Integration Issues with other agencies responsible for
media)

45
Box B.5. National Strategy for Reducing Poverty and Promoting Social Inclusion
2020
Vision: By 2020, Bulgaria will have become a country where the quality of life of vulnerable
groups is improved and conditions for their full social inclusion are created.
Principles
▪ Preventive effect of measures: undertaking action to eliminate the cause of negative
phenomena in society, such as poverty and social exclusion
▪ Sustainability and long-term effect of the results achieved: durability and long-term impact of
the effects from the policies implemented
▪ Effectiveness and efficacy: implementing programs and measures after an analysis of needs,
coordination, and appropriateness of measures
▪ Not allowing discrimination: providing equal opportunities, full and active participation in all
spheres of social life
▪ Solidarity and partnership: creating conditions for interaction, consultations, open dialogue,
and responsibility sharing between all stakeholders
Goal: To improve the quality of life of the vulnerable groups of Bulgarian society and to create
the conditions for their fulfillment by reducing poverty and promoting social inclusion
Target: To reduce the number of persons living in poverty by 260,000 by 2020 (with specific
targets for children ages 0–18 years, people ages 65 and over, the unemployed, and workers
living in poverty)
Main Target Groups
▪ Persons at nonworking age: children and older persons
▪ Families with children
▪ Disadvantaged groups in and out of the labor market
▪ Vulnerable representatives of the Roma community
▪ Persons with disabilities
▪ Homeless persons and persons living in poor housing conditions
▪ Working poor
Priorities
1. Providing opportunities for employment and increased labor income through active labor
market inclusion
2. Ensuring equal access to quality preschool and school education
3. Ensuring equal and efficient access to quality health care
4. Eliminating the institutional care model and developing cross-sectoral social inclusion
services
5. Ensuring sustainable and adequate social transfers
6. Improving the capacity and interaction in education, health care, employment, and social
services while implementing common social inclusion targets
7. Ensuring accessible environment—physical, institutional, and informational alike, and
accessible transportation
8. Improving the housing conditions for vulnerable groups and supporting the homeless
people
9. Working in partnership to overcome poverty and social exclusion and the related
consequences

46
B.6. National Policies on Social Inclusion and Early Childhood Development and Relevant World Bank Portfolio
World Bank Portfolio of Projects Relevant to Social Inclusion and School Readiness
Code Task Objective
Actual
Financing:
Source and
Amount
($, millions) Approval
Closing Rating
P070991 Integration of
Ethnic Minorities
To enhance the policy making and implementation capacity of
the National Council on Ethnic and Demographic Issues at the
central and local levels
IDF grant, 0.46 05/22/2000 06/22/2003 S
(ICM)
P051151 Social Protection
Adjustment Loan
To establish a viable policy framework for systemic reform in
the social protection area (pensions, labor and unemployment,
and social assistance—for example, sickness and maternity
benefits, social assistance and child allowances, and health care
financing)
IBRD, 40.0 FY99 06/30/2000 S
(ICRR)
P055156 Regional
Initiatives
Fund
To test the social fund mechanism to improve the standard of
living among the poor and unemployed during economic
transition, test the cost and benefits of using microprojects to
transfer income to vulnerable groups, and use temporary
employment creation to build infrastructure for development.
The project experience would justify the creation of an
autonomous Social Investment Fund with a particular social
protection mandate
IBRD, 4.38 FY99 04/30/2001 MU
(ICRR)
P055157 Health Sector
Reform
Project
To support the borrower in implementing fundamental reform
of its health sector designed to improve access to (quality)
health care and to ensure financial (especially for disadvantaged
and remote populations) and operational sustainability of the
sector
IBRD, 63.30 06/22/2000 10/31/2008 MS
(ICRR)
P055158 Education
Modernization
Project (APL)
To enhance the quality of teaching and learning, and to make
more efficient the use of physical, financial, and human
resources for primary and secondary schools, and higher
education institutions
IBRD, 5.76 09/05/2000 03/31/2004 U
(ICRR)
P064536 Child Welfare
Reform Project
To improve child welfare and protect children’s rights through,
among others, promoting community-based child welfare
IBRD, 10.50 03/06/2001 06/30/2006 MS
(ICRR)

47
Code Task Objective
Actual
Financing:
Source and
Amount
($, millions) Approval
Closing Rating
approaches as cost-effective alternatives to institutionalized
childcare
P069532 Social Investment
and Employment
Promotion
To strengthen Bulgaria’s existing social protection services and
improve living standards of poor, unemployed people and
selected disadvantaged communities (ethnic minorities, Roma,
and Turkish)
IBRD, 86.7 12/17/2002 12/31/2009 MU
(ICRR)
P076487 Poverty
Monitoring,
Evaluation and
Policy Design
(for MLSP)
To develop and institutionalize reliable and sustainable poverty
monitoring, evaluation, and policy design mechanisms based on
the Living Standards Measurement Study to assist policy
makers in the design, implementation, and evaluation of
economic and social programs and spending; to develop
analytic capacity for analysis of poverty issues, M&E of poverty
impacts, and proactive poverty reduction policy design; and to
support the government’s capacity building regarding targeting
and evaluating social programs and monitoring poverty on a
regular basis (focus on MLSP)
Trust Fund
0.32
06/15/2001 12/13/2005 S
(ICM)
P075020 Poverty
Assessment
To provide the government and the World Bank with an
updated picture of poverty in the country and identify policy
strategies for poverty reduction. The analysis was also intended
to provide an input into the country assistance strategy and to
continue capacity building for ongoing poverty monitoring
(including under P070996)
Various Trust
Funds (not
quantified)
06/28/2002
P082574 Regional Roma
Conference,
in-country
preparations
No stated objectives; no documents or data 02/27/2003 06/30/2003
P099328 Capacity
Building for
Education
To enhance the capacity of the Ministry of Education and
Science to effectively use the resources from the EU Structural
Fund and Cohesion Fund and other international financial
institutions, especially to develop, implement, manage, and
Trust Fund
0.29
11/01/2005 12/31/2009 S
(ICM)

48
Code Task Objective
Actual
Financing:
Source and
Amount
($, millions) Approval
Closing Rating
System Quality
Improvement
and
Modernization
monitor programs and projects for education system
modernization
P100659 Poverty
Monitoring
(Living Standards
Measurement
Study)
To report on living conditions in Bulgaria as a part of the
Bulgaria Poverty Monitoring Task, culminating in joint MLSP-
World Bank production of “Bulgaria: Living Conditions before
and after EU Accession”
World Bank
budget, 0.09
04/20/2006 06/21/2007
P094967 First Social
Sectors
Institutional
Reform
(SIR) DPL I
To support the adoption and implementation of policies as
follows: (i) to increase employment and lay the foundations for
long-term productivity growth by providing incentives for job
creation and improving education quality; and (ii) to promote
fiscal sustainability through efficiency gains in social sectors
and improve access to social services
IBRD, 153.23 03/21/2007 01/31/2008 MU
(for
entire
series)
(ICRR)
Region
disagrees
P107715 Poverty
Monitoring
Policy
“Bulgaria: Living Conditions before and after EU Accession”
September 2009
Capacity building for poverty monitoring, social development
policy, and social risk management
05/01/2008 06/30/2008
P112824 Poverty
Monitoring
Policy Note
Associated with P107715: monitoring and assessment of living
conditions carried out jointly with the Bulgarian government
and other counterparts. “Poverty Implications of the Global
Financial Crisis” (World Bank 2009a) and “Bulgaria Social
Assistance Programs: Cost, Coverage, Targeting, and Poverty
Impact.” (World Bank 2009b)
World Bank
budget, 0.05
04/20/2009 09/30/2009
P102160 SIR DPL II (same as for DPL I) IBRD, 137.56 11/04/2008 12/31/2011
P100657 Social Inclusion
Project
To promote social inclusion through increasing the school
readiness of children below the age of seven, targeting low-
IBRD, 30.7 11/04/2008 12/31/2015 MS
(ICRR)

49
Code Task Objective
Actual
Financing:
Source and
Amount
($, millions) Approval
Closing Rating
income and marginalized families, including children with a
disability and other special needs
P115400 SIR DPL III (same as for DPL I and II) IBRD, 208.40 05/14/2009 03/31/2010 MU
(ICRR)
modest
efficacy
on
education
P118162 School
Autonomy
To study the impact of school autonomy policies on education
sector effectiveness in four areas of interest: efficiency, quality,
equity, and accountability
“A Review of the Bulgaria School Autonomy Reforms” (World
Bank 2010b) and “Assessing the Quality of Education in
Bulgaria Using PISA [Programme for International Student
Assessment] 2009” (World Bank 2010a)
World Bank
budget, 0.18
09/28/2009 09/30/2010
P122454 Programmatic
Technical
Assistance for
the Education
Sector
To support Bulgarian efforts to deepen implementation and
impact of ongoing reforms, focusing on improvement of
education quality through strengthening education
accountability. “Strengthening Higher Education in Bulgaria:
Options for Improving the Models of Governance, Quality
Assurance, and Financing of Higher Education” (World Bank
2012) and “SABER Teacher Country Report: Bulgaria 2013”
(World Bank 2013)
World Bank
budget, 0.13
10/28/2010 11/10/2013
P130455 Gender
Dimensions of
Roma Inclusion
To inform the development of effective Roma inclusion policies
and programs in Bulgaria by investigating, through a gender
lens, the factors and mechanisms that promote or inhibit social
inclusion of the Roma, focusing on early childhood education,
early marriage, the labor market, and high rates of Roma
women affected by crimes, violence, trafficking, and
prostitution
World Bank
budget, 0.12
01/23/2012 06/03/2014

50
Code Task Objective
Actual
Financing:
Source and
Amount
($, millions) Approval
Closing Rating
P146246 Programmatic
Education Sector
Technical
Assistance:
Implementation
and Impact
Educational
Reforms for
Quality
To support Bulgarian efforts to deepen the implementation and
impact of education reforms by focusing on improvement of the
quality of education. To improve quality of pre-university
education through strengthening education quality assurance
and assessment mechanisms and enforcing the accountability
framework envisioned in new draft pre-university legislation.
(World Bank 2015c)
World Bank
budget, 0.13
06/11/2013 06/08/2015
P157367 Early Childhood
Development
Technical
Assistance
To inform Bulgarian policies on early childhood development
(ECD) by taking stock of past and ongoing programs and
identifying key priorities for further improving the coverage,
quality, and equity of ECD services in Bulgaria.
“Expanding and Improving Early Childhood Development: A
Review of Current Trends, Lessons Learned, and Policy
Directions for Bulgaria”(World Bank 2016c)
World Bank
budget, 0.06
09/10/2015 06/27/2016
P161593 Bulgaria
Education Policy
Dialogue
Priorities and
Technical
Assistance
To deepen education sector policy dialogue and identify
priorities as follows: (i) in conjunction with the reimbursable
advisory service work on school value-added measures, (ii) by
synthesizing past sector work, and (iii) by updating PISA trends
and priorities based on PISA 2015.
“Improving the Quality of Bulgaria’s Education System: A
Review of Bulgaria’s Performance on the 2015 Programme for
International Student Assessment (PISA)” (World Bank 2015c)
06/28/2017
P143076 Evaluating and
Closing the Gap
between Roma
and non-Roma in
Bulgaria through
Preschool
Participation
06/28/2017

51
Code Task Objective
Actual
Financing:
Source and
Amount
($, millions) Approval
Closing Rating
(World Bank
2017b)
P161817 Engaging
Effectively on
Roma Inclusion
in Bulgaria (to
increase
effectiveness of
World Bank
policy dialogue)
transformative
social inclusion
policies
P160610 Bulgaria
Integrated Social
Services (to
enhance quality
of essential
services: health,
education, social,
and employment)
P158309 Addressing the
Behavior and
Social
Dimensions of
Gender Gap in
Skills in the
Roma
Community in
Bulgaria
06/29/2018

52
Code Task Objective
Actual
Financing:
Source and
Amount
($, millions) Approval
Closing Rating
P157368 Bulgaria
Reimbursable
Advisory
Services on
Education
07/30/2018
Note: DPL = development policy loan; ECD = early childhood development; EU = European Union; IBRD = International Bank for Reconstruction and Development; ICM =
Implementation Completion Memorandum; ICRR = Implementation Completion and Results Report Review; MLSP = Ministry of Labour and Social Policy; MS = moderately
satisfactory; MU = moderately unsatisfactory; PISA = Programme for International Student Assessment; S = satisfactory; SABER = Systems Approach for Better Education
Results; SIR = Social Sectors Institutional Reform; U = unsatisfactory.

53
Appendix C. Costs, Financing and Disbursements
Table C.1. Planned versus Actual Project Cost, by Component (IBRD loan only)
Component
Planned
(€, millions)
Actual
(€, millions)
Actual/Planned
(percent)
Integrated social and childcare services 37.39 22.81 61
Capacity building 2.51 0.67 27
Total project costs 39.90 23.48 59
Front-end fee IBRD 0.10 0.10 100
Total, including front-end fee 40.00 23.58 59
Source: World Bank (2008) for planned costs; World Bank Project Information System for actual costs.
Note: World Bank (2008) showed only distribution of the IBRD loan across components to show cost estimates. There is no
project cost estimate by component that includes government and municipality counterpart financing. Therefore, actual costs
show the real use and distribution of the IBRD loan to facilitate analysis. Actual costs of the project, including these
counterparts, are shown in table C.2. IBRD = International Bank for Reconstruction and Development.
Table C.2. Planned versus Actual Program Costs, by Component
Component
Planned
(€, millions)
Actual
(€, millions)
Actual/Planned
(percent)
Integrated social and childcare services 130.85 25.22 19
Capacity building 3.28 0.67 20
Project management 2.50 a.
Total project costs 136.63 25.89 19
Front-end fee IBRD 0.10 0.10
Total financing required 136.73 25.99 19
Source: World Bank (2008) for planned; Ministry of Labour and Social Policy, Report on the Implementation of the Social
Inclusion Project (March 2010–December 31, 2015), Sofia, May 2016; cross-checked with World Bank data for actual.
Note: Program rollout did not happen as anticipated because of delays in the SIP implementation. European Union funding
of SIP activities in the 66 municipalities for an additional two years, postproject, is not included here. IBRD = International
Bank for Reconstruction and Development; MLSP = Ministry of Labour and Social Policy; SIP = Social Inclusion Project.
a. Actual costs of project management are included under capacity building.
Table C.3. Planned versus Actual Financing (€, millions)
Financing Source
Planned Actual
Amount
(€, millions)
Planned
Breakdown
(percent)
Amount
(€, millions)
Actual/
Planned
(percent)
Government and ESF 73.43 53.00 0.25 0
IBRD 40.0 30.00 23.59 59
Communities and
municipalities
23.30 17.00 2.15 9

54
Total 136.73 100.00 25.99 19
Source: World Bank (2008) for planned; : Ministry of Labour and Social Policy, Report on the Implementation of the Social
Inclusion Project (March 2010–December 31, 2015), Sofia, May 2016; cross-checked with World Bank data for actual.
Note: Estimate of the government of Bulgaria’s initial estimate includes ESF funding, and actual is net of ESF funding. ESF
= European Social Fund.

55
Table C.4: Planned versus Actual Disbursements, by Disbursement Category (€, millions)
Disbursement
Category
Original
Allocation
Restructuring
12/2012
Restructuring
10/2013 Actual
Actual/
Original
(percent)
1. Grants under Part I of
the project
35.39 36.40 30.38
22.81 41
2. Consultants’ services,
training, and audit
4.51 3.50 0.91 0.67 15
3. Front-end fee 0.10 0.10 0.10 0.10
Total 40.00 40.00 31.39 23.58 59
Canceled 8.61 8.61
Undisbursed 7.81
Total 40.00 40.00
Source: World Bank (2008b) for original; internal restructuring papers for revised.
Table C.5. Expenditures by Source, April 16, 2009–December 31, 2015
Lev €
Total IBRD Government Municipalities Total
1 Received amounts
1.1 IBRD 47 569 299.10 47 569
299.10 – –
24 321
796.42
1.2 Government 506 659.65 – 506 659.65 – 259 050.97
1.3 Cofinancing from municipalities 4 327 329.33 – – 4 327 329.33 2 212 528.35
I. Total received (1.1+1.2+1.3) 52 403 288.08 7 569
299.10 506 659.65 4 327 329.33
26 793
375.74
2 Payments
2.1 Projects of municipalities 50 084 170.80 45 287
509.88 469 331.59 4 327 329.33
25 607
629.91
2.2 Consultancy services, trainings, and
audit 1 320 901.90
1 283
573.84 37 328.06 675 366.42
2.3 Initial fee 195 583.00 195 583.00 100 000.00
II. Total paid (2.1+2.2+2.3) 51 600 655.70 46 766
666.72 506 659.65 4 327 329.33
26 382
996.32
4 Currency exchange rate differences –
Funds made available –
III. Difference between amounts paid
and amounts received (I.-II.) 802 632.38 802 632.38 – 0.00 410 379.42
3 Cash –
3.1 In project account – – – – –
3.2 Special IBRD account – – – –
5 Funds available 802 632.38 802 632.38 – 0.00 410 379.42
5.1. Project account – – – – –
5.2 Special account with the BNB 802 632.38 802 632.38 – – 410 379.42
5.3 Government account – – –
5.4 Municipal cofinancing account – – – –
IV. Total (5.1+5.2+5.3+5.4) 802 632.38 802 632.38 – – 410 379.42
Currency exchange rate: €1 = Lev
1.95583 –
Source: Ministry of Labour and Social Policy, Report on the Implementation of the Social Inclusion Project (March 2010–
December 31, 2015), Sofia, May 2016.

56
Appendix D. Statistical Data and Results
Table D.1. Results Framework and Key Outcome Indicators: Evolution through the
Various Restructurings
Original Design (drawn from
annex 3 of the PAD, and the loan
agreement)
December 2012 Restructuring (drawn from
December 2012 restructuring paper)
Supplemental Letter 2
(09/24/2013)
Project Development Objective
Promote social inclusion through increasing the school readiness of children under age seven, targeting low-income and
marginalized families (including children with a disability and other special needs)
Project Outcome Indicators (age-specific preprimary and early primary school outcome indicators)
Cognitive development and
school readiness scores, including
Revised by replacing original subindicators with
single measure of school readiness:
Share of vulnerable children age six (participating
in the project) who pass the school readiness
diagnostic test. Baselines and targets were given
for three of four original subindicators.
Baseline: 36 percent (baseline impact evaluation
survey); target for 2013: 40 percent
Data source and methodology: Standardized
school readiness diagnostic test administered to
children age six participating in the project
Outcome indicator 1
Maintained as revised in
December 2012 with change:
Extension of target year: from
2013 to 2015
• Memory, verbal, and visual
motor skills development;
copying scores (ages 3–5)
Dropped as a subindicator
Baseline 2012: 25 percent; target 2013:
27 percent
• Fluency in Bulgarian (ages
5–6)
Dropped as a subindicator
Baseline 2012: 42 percent; target 2013:
45 percent
• Achievement test results,
including reading tests (age
6–8)
Dropped as a subindicator
Baseline 2012: 36 percent; target 2013:
40 percent
Child nutrition in target
population (proxied by
anthropometric measures)
Dropped because of methodological constraints,
low reliability, and limited project and country
relevance
Added as upgraded IOI: Number of children ages
3–6 newly enrolled in kindergartens and
preschool groups through the project
Baseline 2012: 0; target 2013: 3,000
Data source or methodology: annual Social
Inclusion Project (SIP) reporting forms from
municipalities
This enrollment indicator is a slight revision of an
IOI (specifying “absolute number enrolled”
instead of the original “rate of enrollment”) and
was reclassified as an outcome indicator. The
specificity of low-income and marginalized
households” in the original IOI articulation is
dropped.
Outcome indicator 2
Maintained with changes
Extension of target year: from
2013 to 2015
Expansion of age range: from
3–6 to 3–7
Added as upgraded IOI: Number of children with
disabilities and other special needs enrolled in
mainstream kindergartens and preschool groups
through the project
Baseline 2012: 0; target 2013: 150
Outcome indicator 3
Maintained with change
Extension of target year: from
2013 to 2015

57
Data source or methodology: annual SIP
reporting forms from municipalities
This enrollment indicator is a slight revision of an
IOI (specifying “absolute number enrolled”
instead of the original “rate of enrollment”) and
reclassified as an outcome indicator. Wording is
modified, replacing the original “childcare
centers” with “preschool groups” and eliminating
the term “in participating municipalities,” though
specifying “through the project.”
Added: Number of beneficiaries of “early
intervention of disabilities” service
Baseline 2012: 0; target 2013: 2,000 (quarterly)
Data source or methodology: quarterly SIP
reporting forms from municipalities
Outcome indicator 4
Maintained with changes
Extension of target year: from
2013 to 2015
Reduction of target value:
from 2,000 to 1,500
Intermediate Outcomes (IO) and Intermediate Outcome (or Results) Indicators (IOI/IRI)
Component 1: Integrated social and childcare services
IO 1: Improvements in child welfare among children from low-income and marginalized families (including
children with a disability and other special needs) below age seven in participating municipalities (as articulated in
PAD)
Rate of enrollment in mainstream
preschool and kindergarten
among children under age seven
from low-income and
marginalized households
Dropped as an IOI and revised or reclassified as
an outcome indicator
Rate of enrollment of children
with a disability in mainstream
preschool, kindergarten, and
childcare centers in 66
municipalities
Dropped as an IOI and revised or reclassified as
an outcome indicator
Parenting skills (as proxied by
frequency and quality of parent-
child interaction, such as reading,
stories, drawing, and so on) and
characteristics of home
environment (availability of
children books and toys)
Dropped
Baseline 2012: −1.31; target 2013: −1.19
Numerator and denominator are not specified.
Number of children who received
full set of immunizations
Dropped
Baseline 2011: 86.40 percent; actual 2012:
87.40 percent; target 2013: 88.60 percent
IO 2: Expansion of coverage of childcare services to children from low-income and marginalized families
(including children with a disability and other special needs) below age seven in participating municipalities (as
articulated in PAD)
Number of parents who
completed parenting skills
sessions
Revised: Number of parents of children ages 0–3
who received parenting skills counseling
Baseline 2012: 0; target 2013: 15,000
Data source or methodology: quarterly SIP
reporting forms from municipalities
IRI 3
Maintained with changes
Extension of target year: from
2013 to 2015
Reduction of target value:
from 15,000 to 10,000
Number of children newly placed
into kindergarten or childcare
facilities through the project
(including those with disabilities)
Rate of inflow of children from
poor and marginalized families
into institutional care
Dropped
Number of new childcare places
created through the project
Revised: Number of newly created places in
kindergarten and preschool groups through the
project
IRI 1
Maintained

Baseline 2012: 0; target 2013: 1,600 (cumulative)
Data source or methodology: quarterly SIP
reporting forms from municipalities
No change in target year or
value
Added: Number of newly created facilities for
delivery of integrated social inclusion services
through the project
Baseline 2012: 0; target 2013: 68 (cumulative)
Data source or methodology: quarterly SIP
reporting from municipalities
IRI 2
Maintained
No change in target year or
value
Added: Number of children ages 0–6 who
benefited from the health consultation services
Baseline 2012: 0; target 2013: 15,000
Data source or methodology: quarterly SIP
reporting forms from municipalities
IRI 4
Maintained with changes
Extension of target year: from
2013 to 2015
Reduction of target value:
from 15,000 to 10,000
Expansion of age range from
0–6 to 0–7
Component 2: Capacity building
Added: Number of municipal staff trained in
public procurement rules and procedures under
the project
Baseline 2012: 0; target 2013: 120
Data source or methodology: quarterly reporting
or lists of participants in training sessions
IRI 1
Maintained
No change in target year or
value
Added: SIP project management information
system (PMIS) developed and operationalized
Baseline: PMIS not developed; target 2011–13:
PMIS in use
Data source or methodology: quarterly
monitoring reports produced through the PMIS
IRI 2
Maintained with change
Extension of target year: from
2011 to 2012
Added: Number of municipal staff trained in
project reporting and M&E
Baseline: 0; target 2012–13: 120
Data source or methodology: quarterly reporting
or lists of participants in training sessions
IRI 3
Maintained with change
Extension of target year: from
2012 to 2014
Number of kindergarten and
childcare facilities staff having
received training.
Revised: Number of kindergarten and crèche staff
trained under the project
Baseline 2012: 0; target 2013: 1,400
Data source or methodology: quarterly reporting
or lists of participants in training sessions
IRI 4
Maintained with changes
Extension of target year: from
2013 to 2014
Reduction of target: from
1,400 to 700
Added: Baseline and final product impact
evaluation (IE) surveys conducted
Baseline: not conducted; target 2012: baseline IE
survey conducted and analytical report with
results produced; target 2013: final IE survey
conducted and analytical report with results
produced
Data source or methodology: IE methodology
endorsed by MLSP and the World Bank
Dropped
Note: IE = impact evaluation; IO = intermediate outcomes; IOI/IRI = intermediate outcome indicators or intermediate results
indicators; M&E = monitoring and evaluation; PAD = project appraisal document; PMIS = project management information
system; SIP = Social Inclusion Project.

59
Box D.1. Social Inclusion Project Components
Component I: Integrated Social and Childcare Services Grants to municipalities for community subprojects supporting a menu of integrated social and childcare services for
marginalized and/or disabled children and their parents, as follows:
▪ Programs for children ages 0–3 and their parents
o Orientation for marginalized parents of target children, covering prenatal and postnatal parenting
skills and information about available health and social services
o One-to-one parenting counseling for parents with complex needs and those who completed
orientation, extended to parents of children over age three, as requested
o Mobile outreach for less accessible communities (Roma neighborhoods or remote villages),
covering parents of children over age three, if needed
▪ Programs for children ages 3–6 years and their parents: menu of supports to increase demand for and supply
of places in formal kindergarten, preschools, and alternative childcare
o Kindergarten fee reduction for guaranteed minimum income recipient parents who enroll in
employment agency programs
o Family (childcare) centers, that enable the following:
▪ Interested individuals to be child minders in their own homes or other available
buildings adhering to existing standards for social services for children; or
▪ Interested community-based organizations (CBOs) to offer childcare services adhering
to existing standards
o Transportation service for parents (private minibus accompanied by staff) for pickup and drop-off
of children
o Health services: examination of kindergarten children by pediatricians and dentists several times a
year
▪ Infrastructure and material investments (not to exceed 50 percent of the overall loan volume):
o Infrastructure rehabilitation in existing kindergarten and childcare buildings;
o Construction of new childcare centers in underserved areas;
▪ Training for service providers (preservice, refresher and in-service support):
o Parenting program service providers/childcare providers delivering programs
o Kindergarten staff training: how to integrate marginalized and early disability detection
o Child minder training: to qualify marginalized individuals and CBO staff.
Component II: Capacity Building Support to the design and pilot launch of a national school readiness program and start-up capacity building support,
complementing European Social Fund financing for the rollout. Support includes the following:
▪ Local project management capacity building, especially:
o Interagency and cross-sectoral cooperation (education, health, social services, and assistance)
o Subcontracting of services to and cooperation with nongovernmental organizations
o Accessing European Union Structural Fund and Cohesion Fund: project proposal development
▪ Impact evaluation: to inform program design and report on program effectiveness.
o Establishment of a national baseline of relevant child welfare and educational data
o Project-specific impact evaluation to reveal project’s impact before a full rollout
o Capacity building for the Ministry of Labour and Social Policy and the Ministry of Education and
Science to conduct impact evaluation beyond the Social Inclusion Project
▪ Audit and construction works inspection for municipal subprojects
Source: World Bank 2008a.

Table D.2. Social Inclusion Restructuring: Dates and Nature of Amendments
Restructuring
Date
Implementing
Arrangements Components
Reallocation
or
Cancellation
of Funds
Indicators
Results
Framework
Disbursement
Schedule
Closing
Date
06/09/2010 X X
05/31/2011 X
12/14/2012 X X X
09/30/2013 X X X X X
09/15/2015 X
Source: World Bank Project Information System and internal supervision reporting.

61
Figure D.1. Social Inclusion Project Results Chain
Source: World Bank 2008a.
Note: EU = European Union; MES = Ministry of Education and Science; MLSP = Ministry of Labour and Social Policy; NGO = nongovernmental organization; SIP = Social
Inclusion Project.
Social inclusion of target children and their families
School readiness of target children
Delivery of integrated social and child services to target populations in pilot municipalities
Quality Equitable access Sustainability
Enhanced capacity for program management, implementation and continual learning, and
improvements
Learning from pilot reflected in program
design and effectiveness before
national rollout
Capacity of MLSP and
MES to conduct impact
evaluation post-SIP
Enhanced municipal capacity
Cross-sectoral work
Cooperation with NGOs
Accessing EU funds

62
Table D.3. Achievement of Results
Expected Outcomes and Intermediate
Outcomesa Baseline Targetb
Actual as
of
December
2015c
Progress
2016 to
Presentd
Rating and
Comments
Project development objective: Promote social inclusion through increasing the school readiness of children below age seven, targeting low-income and marginalized families
(including children with a disability and other special needs)
Social inclusion of target children and their families (short-term trends that project would have impacted)
More equal starting conditions and opportunity
for target children as measured by their
performance and success in primary school
compared with nonvulnerable children
n.a. n.a. n.a. Not evaluable. Anecdotal evidence revealed during visits to five
municipalities, but no systematic data or trends are available.
Reductions in early dropout rates from primary
schools
No rating: project effect too early to determine. Field visits and
fact checks reveal that ethnically vulnerable girls tend to stay in
school until about grade 4, and boys until about grade 8. Earliest
beneficiaries of the Social Inclusion Project (SIP) services,
including kindergarten, are currently in grade 3.
Reduced inflow into special schools for children
with learning difficulties and disabilities
Outcome Indicator 3: Number of children with
disabilities and with special education needs
newly enrolled in kindergartens and preschool
education groups as a result of the project
(wording changed from the original, which
focused on rate of enrollment, but was later
revised to focus on the absolute number of
enrollees)
0 150 471 Target exceeded; partial attribution. Early intervention of
disabilities services were launched in 2015. Some of these gains
might be attributable to the project, but some might be primarily
or equally attributable to Bulgaria’s successful campaign to
reduce the institutionalization of children substantially
(primarily those deprived of parental care and/or those who are
disabled or have special needs).
Reduced discrimination of target children in the
preschool and primary school settings and in the
community at large
No data or trends are available. Sensitization training planned
under the project is not reported as having been implemented.
Moreover, mission findings from a range of sources (documents,
fieldwork, interviews, and other sources) indicate that
discrimination is still an issue. Surveys or other instruments or
measures might have been useful for tracking trends in this
regard.
Parents (and grandparents and other caregivers)
better informed and better supported with
information and resources for proper care and

63
Expected Outcomes and Intermediate
Outcomesa Baseline Targetb
Actual as
of
December
2015c
Progress
2016 to
Presentd
Rating and
Comments
nurturing of their children and for better
management of obstacles to their social inclusion
School readiness of target children
Outcome indicator 1: Share of vulnerable
children age 6 (participating in the project) who
pass the standardized school readiness diagnostic
test (SRT), administered to children age 6
participating in the project
36 percent
(2012
impact
evaluation
survey)
47 percent
(2012
baseline
value
reported in
ICR)
40 percent
80 percent
(Market
LINKS
Research
and
Consulting
2015)
The baseline SRT was conducted in 98 municipalities, some of
which were SIP pilot municipalities, but others were not. The
SRT passing rate among vulnerable children in project
municipalities was used as the baseline. Original sample for
2015: 897 tests, minus 140 tests eliminated for methodological
reasons = 757 tests. Of these, 250 match samples were retained
to compare with 2012 results.
Issues with methodology; attribution; target groups; comparison
of 2012 and 2015
Memory, verbal, and visual motor skills
development; copying scores (ages 3–5)
Fluency in Bulgarian (ages 5–6) Not measured
Nutrition measures
Full immunization Vaccination rates: 97 percent for Bacillus Calmette–
Guérin (BCG) vaccine; 95 percent for diphtheria, pertussis and
tetanus (DPT3) and polio 3; 94 percent for meningococcal
vaccine (MCV. Vaccination rates have been relatively stable
during the project period and are not disaggregated by ethnic
group. According to the National Network of Health Mediators
(NNHM), Roma communities have lower immunization rates
than the general population. Ninety percent of measles cases
recorded during the 2010 outbreak were concentrated within the
Roma community. Together with health authorities, NNHM
undertook an emergency campaign to stop the epidemic,
vaccinating 180,000 children within a two-month period.
Reasons for lower immunization rates among the Roma include
a lack of information, lack of trust in health providers, and
limited access to services for reasons of unaffordability and
discrimination by hospitals and service providers who refuse

64
Expected Outcomes and Intermediate
Outcomesa Baseline Targetb
Actual as
of
December
2015c
Progress
2016 to
Presentd
Rating and
Comments
their treatment. Health mediators continue collaborating with
general practitioners to provide culturally adapted information
about the benefits of vaccinations and guidance on tracking and
honoring vaccination schedules. Source: Reaching Roma:
Vaccinating Underserved Minorities, August 2016
(vaccinestoday.eu)
Adoption of good parenting practices fostering
child health well-being from conception, safety,
early stimulation of the child, and a high value
placed on education
No systematic measurement of any changes in awareness or
behaviors. Anecdotal evidence obtained through fieldwork
reveals mixed trends, at best.
Disabilities of children detected early and
mitigated or managed through early disability
services
Intermediate outcome: Delivery of integrated social and child services to target populations in pilot municipalities, with good outcomes
Maybe subdivided by three types of services:
Early childhood education services
Health services
Social services
Quality of services
Equitable coverage of services
Broken down by vulnerable groups, specifying
numerator and denominator
Who is in the 70 percent? Who is in the
30 percent (target groups disaggregated)
Time frame of service delivery/phasing (SIP,
EU, any gaps)
Responsiveness to school readiness/early
childhood development needs and demands

65
Expected Outcomes and Intermediate
Outcomesa Baseline Targetb
Actual as
of
December
2015c
Progress
2016 to
Presentd
Rating and
Comments
Outcome Indicator 2: Number of children ages
3–7 newly enrolled in kindergartens and
preschool education groups as a result of the
project
(wording changed from the original, which
focused on the rate of enrollment, but was later
revised to focus on the absolute number of
enrollees)
0 3,000
4,420 Target exceeded but with important caveats. This indicator
statement changed in two significant ways from its original
articulation, which would lead to a larger number being
reported: (i) the specificity of children coming from low-income
and marginalized households was dropped; and (ii) the age
range was expanded from 3–6 years to 3–7 years. The
Independent Evaluation Group’s discussion of this indicator
with MLSP and municipality staff revealed their understanding
of the target to encompass all children, both because of an
overall shortage of spaces and because of the desire for mixed
school populations versus segregated schools, especially among
the Roma. No breakdown of enrollees by income level or ethnic
group is provided.
Attendance at school Attendance at preschool and kindergarten is somewhat of an
issue.

66
Expected Outcomes and Intermediate
Outcomesa Baseline Targetb
Actual as
of
December
2015c
Progress
2016 to
Presentd
Rating and
Comments
Dropouts
Intermediate outcome indicator 1: Number of
newly created places in kindergarten and
preschool groups through the project
0 1,600 2,357 Target exceeded. This is an output.
Intermediate outcome indicator 8: Number of
kindergarten and crèche staff trained under the
project
0 700 1,100 Target exceeded. This activity was financed under the EU-
funded operational program Education and Science for Smart
Growth. This is an output.
Outcome Indicator 4: Number of beneficiaries of
the early intervention of disabilities service
(launched in 2015, the last year of
implementation)
0 2,000
(set in
2012 after
the
midterm
review)
1,500
(reset in
2013)
4,311 Target exceeded, despite the fact that the service was launched
only in 2015, the last year of SIP implementation. This
illustrates a strong focus on the promotion and delivery of this
service and a strong demand for this service. In addition to the
good reputation of the services and outreach work, demand
might also have been precipitated by the deinstitutionalization
reform and the reinsertion of disabled and special needs children
into the communities (families, foster care, group homes, and
the like).
Intermediate outcome indicator 2: Number of
newly created facilities for delivery of integrated
social inclusion services through the project
0 68 113 Target exceeded
Intermediate outcome indicator 3: Number of
parents of children ages 0–3 who received
parenting skills counseling
0 10,000 12,964 Target exceeded
Intermediate outcome indicator 4: Number of
children ages 0–7 who benefited from the health
consultation services
0 10,000 39,993 Target exceeded
Equitable access No data
Affordability, reduced fees
Mobile versus facility-based
Transportation to services
Access to information about services
Extent of efforts to stimulate latent demand for
services
Absence of discrimination by parents, teachers,
and students

67
Expected Outcomes and Intermediate
Outcomesa Baseline Targetb
Actual as
of
December
2015c
Progress
2016 to
Presentd
Rating and
Comments
Sustainability No data
Financial
Technical
Social
Political
Intermediate outcome: Enhanced capacity for program management, implementation, continual learning, and improvements
modest achievement
Learning from pilot reflected in program design
and effectiveness before national rollout
Partially achieved. Some learning occurred through the
demonstration of a new way to integrate and deliver social
services, and through the experience of implementation, ongoing
learning, and fine-tuning of service delivery. Learning occurred
within and across municipalities. However, the elimination of
the impact evaluation undercut a rigorous assessment of the
effectiveness of the pilot phase of the program, including
changes in parents’ behaviors, and a systematic process of
documenting achievements and lessons and the fine-tuning of
the national school readiness program before its nationwide
rollout.
Capacity of MLSP and the Ministry of Education
and Science to conduct impact evaluation post-
SIP
Not achieved
Enhanced municipal capacity
Cross-sectoral work Partially achieved. Good dynamics and cooperation within
municipalities, but budgets still mostly allocated to sector silos,
and budgets still not sufficiently decentralized to municipalities
commensurate with their responsibilities
Strengthened cooperation with NGOs and
subcontracting of services to and cooperation
with NGOs
Not achieved
Accessing EU funds Achieved

68
Expected Outcomes and Intermediate
Outcomesa Baseline Targetb
Actual as
of
December
2015c
Progress
2016 to
Presentd
Rating and
Comments
Intermediate outcome indicator 7: Number of
municipal staff trained in project reporting and
monitoring and evaluation
0 120 144 Target exceeded. However, field visits to five municipalities
revealed complete turnover of those who received this training
(no one who received training was still there) and no
replacements for assuming these roles, resulting in limited
capacity for M&E. Numbers of beneficiaries and numbers of
service providers are currently tracked under OP HRD
financing, but intermediate outcomes and outcomes are not
tracked or evaluated. NAMB noted need for project and
program management capacity.
Project management capacity established
Intermediate outcome indicator 5: Number of
municipal staff trained in public procurement
rules and procedures under the project
0 120 120 Target achieved. Municipality-level procurement was well
carried out and respectful of World Bank guidelines.
Intermediate outcome indicator 6: SIP PMIS
developed and operationalized
PMIS in use
by 2012
Target achieved, but only toward the end of the project (2014–
15).
Note: DPT = diphtheria, pertussis, and tetanus; EU = European Union; ICR = Implementation Completion Results Report; M&E = monitoring and evaluation; MLSP = Ministry of
Labour and Social Policy; NAMB = National Association of Municipalities in Bulgaria; NGO = nongovernmental organization; NNHM = National Network of Health Mediators;
OP HRD = Operational Program Human Resources Development; PMIS = project management information system; SIP = Social Inclusion Project; SRT = school readiness test.
a. Original labels and numbers of outcome and intermediate outcome indicators are retained for the purposes of transparency and easy reference to the project’s results framework.
However, they do not necessarily match this evaluation’s definitions of outcome and intermediate outcome indicators.
b. The target was initially set for 2013, but was later extended to 2015.
c. December 2015 marked the end of World Bank financing.
d. This column presents progress under OP HRD financing.

69
Table D.4. Sixty-Six Municipalities Funded under the Social Inclusion Project, as of December 31, 2014
Number Municipality
Value of Construction (Lev)
Value of Services and Furniture and
Materials (Lev) Amount of the Project (Lev)
World Bank
From
World
Bank Loan
(%) Municipality World Bank
From
World
Bank Loan
(%) Municipality World Bank Municipality Total
1 Ardino 263 629.31 43 0.00 354 830.33 57 0.00 618 459.64 0.00 618 459.64
2 Assenovgrad 551 879.81 55 100 000.00 452 243.04 45 0.00 1 004 122.85 100 000.00 1 104 122.85
3 Avren 198 698.97 50 0.00 199 561.43 50 0.00 398 260.40 0.00 398 260.40
4 Aytos 250 112.00 60 98 700.64 169 535.74 40 0.00 419 647.74 98 700.64 518 348.38
5 Blagoevgrad 1 338 680.00 82 400 000.00 285 413.55 18 122 880.00 1 624 093.55 522 880.00 2 146 973.55
6 Bourgas 1 297 740.00 59 1 513 112.61 886 008.72 41 198 000.00 2 183 748.72 1 711 112.61 3 894 861.33
7 Byala 87 548.38 23 0.00 298 069.18 77 0.00 385 617.56 0.00 385 617.56
8 Byala Slatina 306 381.48 46 0.00 363 545.83 54 0.00 669 927.31 0.00 669 927.31
9 Chirpan 499 646.38 72 0.00 199 133.02 28 10 920.00 698 779.40 10 920.00 709 699.40
10 Devin 196 006.58 31 0.00 445 079.22 69 0.00 641 085.80 0.00 641 085.80
11 Dimitrovgrad 466 334.07 52 0.00 424 810.20 48 51 840.00 891 144.27 51 840.00 942 984.27
12 Dobrich, City 497 104.27 49 0.00 507 895.58 51 0.00 1 004 999.85 0.00 1 004 999.85
13 Dobrich, District
Municipality
204 064.66 31 0.00 464 275.33 69 0.00 668 339.99 0.00 668 339.99
14 Dolni Chiflik 548 086.53 80 11 935.41 135 250.48 20 17 280.00 683 337.01 29 215.41 712 552.42
15 Dolni Dabnik 208 691.96 34 0.00 408 236.49 66 0.00 616 928.45 0.00 616 928.45
16 Dupnitza 465 376.30 47 0.00 518 697.34 53 10 671.00 984 073.64 10 671.00 994 744.64
17 Elena 99 183.37 15 0.00 550 120.37 85 649 303.74 0.00 649 303.74
18 Gabrovo 991 382.00 80 101 618.00 240 843.66 20 26 000.00 1,232, 225.66 127 618.00 1 359 843.66
19 General Toshevo 353 803.39 53 0.00 316 304.67 47 31 495.50 670 108.06 31 495.50 701 603.56
20 Haskovo 767 970.70 71 0.00 308 165.72 29 0.00 1 076 136.42 0.00 1 076 136.42
21 Kameno 318 091.69 48 0.00 340 246.93 52 0.00 658 338.62 0.00 658 338.62
22 Karlovo 127 166.01 13 0.00 839 408.16 87 48 000.00 966 574.17 48 000.00 1 014 574.17

70
23 Kirkovo 128 999.52 27 0.00 346 000.84 73 0.00 475 000.36 0.00 475 000.36
24 Knezha 187 803.31 29 0.00 453 545.55 71 5 000.00 641 348.86 5 000.00 646 348.86
25 Krumovgrad 272 334.43 41 0.00 386 132.35 59 54 900.00 658 466.78 54 900.00 713 366.78
26 Krushari 60 654.70 19 0.00 255 540.90 81 0.00 316 195.60 0.00 316 195.60
27 Kubrat 86 565.76 20 0.00 342 220.58 80 0.00 428 786.34 0.00 428 786.34
28 Kyustendil 326 135.88 40 0.00 494 628.60 60 145 584.00 820 764.48 145 584.00 966 348.48
29 Lom 53 981.32 10 0.00 478 138.23 90 41 496.00 532 119.55 41 496.00 573 615.55
30 Maritza 382 000.00 59 90 641.66 260 659.76 41 33 125.00 642 659.76 123 766.66 766 426.42
31 Montana 647 679.81 64 0.00 357 482.54 36 18 020.00 1 005 162.35 18 020.00 1 023 182.35
32 Nikolaevo 89 981.99 22 1 131.78 323 819.90 78 0.00 413 801.89 1 131.78 414 933.67
33 Pazardjik 968 328.11 70 0.00 420 054.58 30 395 928.00 1 388 382.69 395 928.00 1 784 310.69
34 Pernik 577 647.72 69 400 000.00 264 565.36 31 108 000.00 842 213.08 508 000.00 1 350 213.08
35 Petrich 418 735.47 56 0.00 335 196.45 44 0.00 753 931.92 0.00 753 931.92
36 Pleven 726 184.42 54 0.00 614 032.05 46 0.00 1 340 216.47 0.00 1 340 216.47
37 Plovdiv 1 494 848.18 66 0.00 758 746.76 34 25 000.00 2 253 594.94 25 000.00 2 278 594.94
38 Pravetz 202 350.36 51 0.00 195 896.64 49 0.00 398 247.00 0.00 398 247.00
39 Provadia 196 548.00 39 0.00 312 073.36 61 47 860.00 508 621.36 47 860.00 556 481.36
40 Razgrad 311 818.59 31 0.00 693 343.76 69 0.00 1 005 162.35 0.00 1 005 162.35
41 Rila 23 573.44 0.06 0.00 383 335.55 94 21 600.00 406 908.99 21 600.00 428 508.99
42 Rousse 1 096 920.44 80 0.00 267 896.38 20 0.00 1 364 816.82 0.00 1 364 816.82
43 Samokov 443 402.00 48 540 803.04 488 004.89 52 0.00 931 406.89 540 803.04 1 472 209.93
44 Samuil 275 469.37 59 0.00 190 673.78 41 12 600.00 466 143.15 12 600.00 478 743.15
45 Sevlievo 511 607.28 73 0.00 189 180.96 27 0.00 700 788.24 0.00 700 788.24
46 Shoumen 762 400.83 55 0.00 626 082.67 45 0.00 1 388 483.50 0.00 1 388 483.50
47 Sliven 1 100 011.00 79 238 595.32 298 176.03 21 123 120.00 1 398 187.03 361 715.32 1 759 902.35
48 Slivo Pole 285 751.15 43 0.00 374 647.47 57 0.00 660 398.62 0.00 660 398.62
49 Smolyan 541 820.41 55 0.00 444 702.04 45 1 800.00 986 522.45 1 800.00 988 322.45
50 Sofia Greater
Municipality
2 245 360.00 54 912 083.47 1 915 677.09 46 32 400.00 4 161 037.09 944 483.47 5 105 520.56
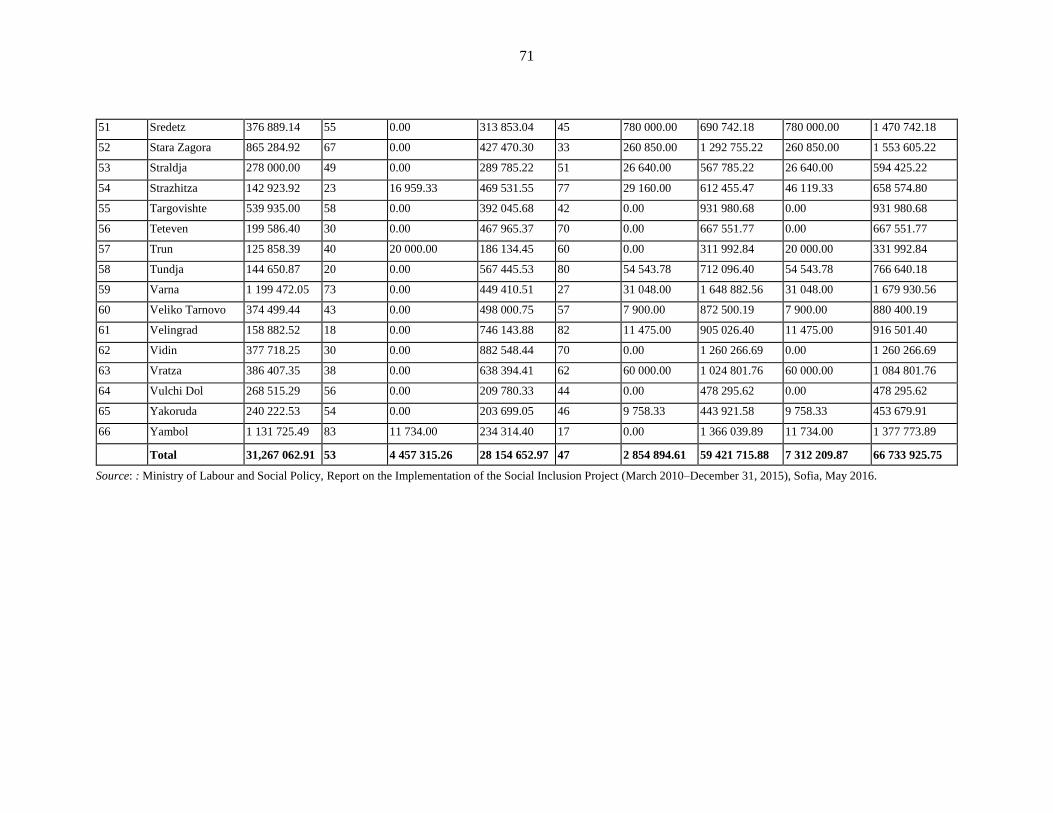
71
51 Sredetz 376 889.14 55 0.00 313 853.04 45 780 000.00 690 742.18 780 000.00 1 470 742.18
52 Stara Zagora 865 284.92 67 0.00 427 470.30 33 260 850.00 1 292 755.22 260 850.00 1 553 605.22
53 Straldja 278 000.00 49 0.00 289 785.22 51 26 640.00 567 785.22 26 640.00 594 425.22
54 Strazhitza 142 923.92 23 16 959.33 469 531.55 77 29 160.00 612 455.47 46 119.33 658 574.80
55 Targovishte 539 935.00 58 0.00 392 045.68 42 0.00 931 980.68 0.00 931 980.68
56 Teteven 199 586.40 30 0.00 467 965.37 70 0.00 667 551.77 0.00 667 551.77
57 Trun 125 858.39 40 20 000.00 186 134.45 60 0.00 311 992.84 20 000.00 331 992.84
58 Tundja 144 650.87 20 0.00 567 445.53 80 54 543.78 712 096.40 54 543.78 766 640.18
59 Varna 1 199 472.05 73 0.00 449 410.51 27 31 048.00 1 648 882.56 31 048.00 1 679 930.56
60 Veliko Tarnovo 374 499.44 43 0.00 498 000.75 57 7 900.00 872 500.19 7 900.00 880 400.19
61 Velingrad 158 882.52 18 0.00 746 143.88 82 11 475.00 905 026.40 11 475.00 916 501.40
62 Vidin 377 718.25 30 0.00 882 548.44 70 0.00 1 260 266.69 0.00 1 260 266.69
63 Vratza 386 407.35 38 0.00 638 394.41 62 60 000.00 1 024 801.76 60 000.00 1 084 801.76
64 Vulchi Dol 268 515.29 56 0.00 209 780.33 44 0.00 478 295.62 0.00 478 295.62
65 Yakoruda 240 222.53 54 0.00 203 699.05 46 9 758.33 443 921.58 9 758.33 453 679.91
66 Yambol 1 131 725.49 83 11 734.00 234 314.40 17 0.00 1 366 039.89 11 734.00 1 377 773.89
Total 31,267 062.91 53 4 457 315.26 28 154 652.97 47 2 854 894.61 59 421 715.88 7 312 209.87 66 733 925.75
Source: : Ministry of Labour and Social Policy, Report on the Implementation of the Social Inclusion Project (March 2010–December 31, 2015), Sofia, May 2016.

72 APPENDIX D
Table D.5. SIP Municipalities that Opened New Nursery and Kindergarten Places
No. Municipality
Nursery
Groups
Places
in
Nursery
Group
Total
Places in
Nurseries
Kindergarten
Groups
Places in
Kindergarten
Groups
Total Places
in
Kindergarten
Groups
Total
Nurseries +
Kindergarten
Groups
Sofia Municipality:
Ovcha Kupel
District
0 1 25 25 25
Sofia Municipality:
Druzhba District
20 1 25 25 45
1 Sofia Municipality:
Slatina District
0 3 25 75 75
2 Bourgas:Block A
0 4 25 100 100
Bourgas:Block B 1 20 20 3 25 75 95
3 Varna
0 4 25 100 100
4 Shoumen 1 18 18 3 18 54 72
5 Yambol 1 20 20 2 25 50 70
6 Assenovgrad
0 2 24 48 48
7 Smolyan
0 1 18 18 18
8 Pernik
0 3 24 72 72
9 Sredetz
0 2 25 50 50
10 Yakoruda
0 2 24 48 48
11 Aytos 1 16 16 2 24 48 64
12 Devin 1 18 18 1 22 22 40
13 Kameno
0 1 22 22 22
14 Slivo Pole
0 1 22 22 22
15 Chirpan
0 1 22 22 22
16 Samuil 1 18 18
18
17 Dolni Chiflik
0 2 24 48 48
18 Maritza
0 2 16 32 32
19 Petrich
0 2 22 44 44
20 Plovdiv 2 18 36 4 24 96 132
21 Vulchi Dol
22 Montana
1 24 24 24
23 Pazardjik
2 25 50 50
24 Haskovo 1 18 18
18
25 Stara Zagora
4 24 96 96
26 Blagoevgrad
4 25 100 100
27 Sliven
4 24 96 96
28 Rousse
4 25 100 100
29 Pleven
2 25 50 50
30 Strazhitza
1 21 21 21
31 Gabrovo
3 24 72 72
Total
184
1,705 1,889

73
Source: Ministry of Labour and Social Policy, Report on the Implementation of the Social Inclusion Project (March 2010–
December 31, 2015), Sofia, May 2016.
Table D.6. Targets and Indicators Established for EU Financing under OP HRD, Post-
SIP
No.
Performance Indicator Result Indicator
Indicator Measuring Unit
Target
Value Indicator
Measuring
Unit
Target
Value
1. Number of
service providers
for social
inclusion
Number 66 Number of
children who
received service
support
Number 15,000
2. Number of
service providers
for social
inclusion that
expanded the
scope of their
activities
Number At least 8
Source: Ministry of Labour Social Policy, OP HRD Program Data.
Note: EU = European Union; OP HRD = Operational Program Human Resources Development; SIP = Social Inclusion
Project.
Table D.7. Achievements as of February 2018 under OP HRD Financing, Post-SIP
No.
Performance Indicator Result Indicator
Indicator Measuring Unit Actual Indicator Measuring Unit Actual
1. Number of
service
providers for
social inclusion
Number 64 Number of
children who
received service
support
Number 19,096
2. Number of
service
providers for
social inclusion
that expanded
the scope of
their activities
Number At least 3
Source: Ministry of Labour and Social Policy, Summary: Procedure BG05M9OP001-2.004, “Services for Early Childhood
Development,” Priority Axis No. 2: “Reducing Poverty and Promoting Social Inclusion.”
Note: EU = European Union; OP HRD = Operational Program Human Resources Development; SIP = Social Inclusion
Project.

74
Table D.8. OP HRD–Funded ECD Activities in SIP Pilot Municipalities, Post-SIP
No. Municipality
Early
Intervention
of
Disabilities
Individual
Pedagogical
Support for
Children
with
Disabilities
Psychological
Support and
Counseling to
Parents,
Children and
Families to
Promote Well-
being and
School
Attendance
Support for
Providing
Child Health
Consultation
and Disease
Prevention
Activities
Additional
Pedagogical
Training to
Increase the
School
Readiness of
Children for
an Equal
Start in
School
Family
Center
for
Children
Ages
0–3
1 Avren
✓ ✓ ✓ ✓
2 Aytos
✓ ✓ ✓
3 Ardino ✓ ✓ ✓ ✓ ✓ ✓
4 Assenovgrad ✓ ✓ ✓ ✓ ✓
5 Blagoevgrad ✓ ✓ ✓ ✓ ✓
6 Bourgas ✓ ✓ ✓ ✓ ✓ ✓
7 Byala (Rousse
Province)
✓ ✓ ✓ ✓ ✓
8 Byala Slatina ✓
✓ ✓ ✓
9 Varna ✓ ✓ ✓ ✓ ✓ ✓
10 Veliko
Tarnovo
✓ ✓ ✓ ✓ ✓ ✓
11 Velingrad ✓ ✓ ✓ ✓ ✓
12 Vidin
✓ ✓ ✓ ✓
13 Vratsa ✓ ✓ ✓ ✓ ✓ ✓
14 Valchi Dol ✓ ✓ ✓ ✓ ✓
15 Gabrovo ✓ ✓ ✓ ✓ ✓
16 General
Toshevo
✓ ✓ ✓
17 Devin ✓ ✓ ✓ ✓ ✓
18 Dimitrovgrad ✓ ✓ ✓ ✓ ✓
19 Dobrich, City ✓ ✓ ✓ ✓ ✓ ✓
20 Dobrich,
District
✓ ✓ ✓ ✓
21 Dolni Dabnik ✓
✓ ✓ ✓
22 Dolni Chiflik
✓ ✓ ✓ ✓
23 Dupnitsa ✓ ✓ ✓ ✓ ✓ ✓
24 Elena ✓ ✓ ✓ ✓ ✓
25 Kameno
✓ ✓ ✓ ✓
26 Karlovo ✓ ✓ ✓ ✓ ✓
27 Kirkovo ✓ ✓ ✓ ✓ ✓
28 Knezha
✓ ✓ ✓

75
No. Municipality
Early
Intervention
of
Disabilities
Individual
Pedagogical
Support for
Children
with
Disabilities
Psychological
Support and
Counseling to
Parents,
Children and
Families to
Promote Well-
being and
School
Attendance
Support for
Providing
Child Health
Consultation
and Disease
Prevention
Activities
Additional
Pedagogical
Training to
Increase the
School
Readiness of
Children for
an Equal
Start in
School
Family
Center
for
Children
Ages
0–3
29 Krumovgrad ✓ ✓ ✓ ✓ ✓
30 Krushari
✓ ✓ ✓ ✓
31 Kubrat
✓ ✓ ✓
32 Kyustendil ✓ ✓ ✓ ✓ ✓
33 Lom ✓ ✓ ✓ ✓ ✓
34 Maritsa contract terminated
35 Montana ✓ ✓ ✓ ✓ ✓
36 Nikolaeco
✓ ✓ ✓
37 Pazardzhik ✓ ✓ ✓ ✓
38 Pernik ✓ ✓ ✓ ✓ ✓
39 Petrich ✓ ✓ ✓ ✓ ✓
40 Pleven ✓ ✓ ✓ ✓ ✓
41 Plovdiv ✓ ✓ ✓ ✓ ✓
42 Pravets
✓ ✓ ✓
43 Provadia
✓ ✓ ✓ ✓ ✓
44 Razgrad ✓ ✓ ✓ ✓ ✓
45 Rila
✓ ✓ ✓ ✓
46 Rousse ✓ ✓ ✓ ✓ ✓
47 Samokov ✓ ✓ ✓ ✓ ✓
48 Samuil ✓
✓ ✓ ✓
49 Sevlievo ✓ ✓ ✓ ✓ ✓
50 Sliven ✓ ✓ ✓ ✓ ✓
51 Slivo Pole ✓ ✓ ✓ ✓ ✓
52 Smolyan ✓ ✓ ✓ ✓ ✓
53 Sredets ✓ ✓ ✓ ✓ ✓
54 Stara Zagora ✓ ✓ ✓ ✓ ✓
55 Sofia Greater
Municipality
✓ ✓ ✓ ✓ ✓
56 Strajitsa ✓ ✓ ✓ ✓ ✓
57 Straldzha
✓ ✓ ✓
58 Teteven ✓
✓
✓ ✓
59 Trun ✓ ✓ ✓ ✓ ✓
60 Tundzha ✓ ✓ ✓ ✓ ✓
61 Targovishte ✓ ✓ ✓ ✓ ✓

76
No. Municipality
Early
Intervention
of
Disabilities
Individual
Pedagogical
Support for
Children
with
Disabilities
Psychological
Support and
Counseling to
Parents,
Children and
Families to
Promote Well-
being and
School
Attendance
Support for
Providing
Child Health
Consultation
and Disease
Prevention
Activities
Additional
Pedagogical
Training to
Increase the
School
Readiness of
Children for
an Equal
Start in
School
Family
Center
for
Children
Ages
0–3
62 Haskovo ✓ ✓ ✓ ✓ ✓
63 Chirpan ✓ ✓ ✓ ✓ ✓
64 Shumen ✓ ✓
65 Yakoruda contract not signed
66 Yambol ✓ ✓ ✓ ✓ ✓
Source: Ministry of Labour and Social Policy.
Note: ECD = early childhood development; EU = European Union; OP HRD = Operational Program Human Resources
Development; SIP = Social Inclusion Project.
Reported Results of the Social Inclusion Project under the World Bank–
Financed and OP HRD–Funded Phases
The review of the Social Inclusion Project documentation provided by the Ministry of
Labour and Social Policy shows that project outputs and lower-level outcomes were
monitored and reported during the World Bank–financed phase of the project. As the results
tables for five municipalities show (tables D.8a–e), targets were set for municipal-level
outputs and lower-level outcomes, but information is missing regarding their actual values
reached at the end of 2015. However, there is information about the obtained cumulative
project results for all 66 municipalities that implemented projects with SIP grants.1 During
the ongoing Operational Program Human Resources Development (OP HRD)–funded phase
of the project, cumulative and municipal-level targets are established only for outputs,
namely, the number of service providers for social inclusion and number of children receiving
service support2, hereas municipalities also report outputs disaggregated by type of service or
intervention.
Table D.9. Byala Slatina Municipality: Social Inclusion Project Results
No. SIP Results Indicators
World Bank–Financed Phase
Service delivery time frame:
07/01/2014–12/31/2016
OP HRD–Funded Phase
Service delivery time frame:
08/03/2016–10/03/2018
INDICATOR VALUE INDICATOR VALUE
Baseline Target Actual Baseline Target
Intermediate
(date not
specified)
1 Kindergarten enrollment rate
of children up to age seven
years from low-income
n.a. 80 percent n.a. n.a. n.a. n.a.

77
No. SIP Results Indicators
World Bank–Financed Phase
Service delivery time frame:
07/01/2014–12/31/2016
OP HRD–Funded Phase
Service delivery time frame:
08/03/2016–10/03/2018
INDICATOR VALUE INDICATOR VALUE
Baseline Target Actual Baseline Target
Intermediate
(date not
specified)
families and different ethnic
groups, specifically Roma
2 Preschool enrollment rate of
children up to age seven years
from low-income families and
different ethnic groups,
specifically Roma
n.a. 80 percent n.a. n.a. n.a. n.a.
3 Kindergarten enrollment rate
of children with disabilities
n.a. 80 percent n.a. n.a. n.a. n.a.
4 Preschool enrollment rate of
children with disabilities
n.a. 80 percent n.a. n.a. n.a. n.a.
5 Number of new nursery and
kindergarten places opened
n.a. 9 n.a. n.a. n.a. n.a.
6 Number of newly created
kindergarten and preschool
places as a result of the project
n.a. 18 18 n.a. n.a. n.a.
7 Number of project beneficiary
children enrolled in first grade
n.a. 70 n.a. n.a. n.a. n.a.
8 Number of newly created
places (spaces) for providing
integrated services for social
inclusion as a result of the
project
n.a. 3 3 n.a. n.a. n.a.
9 Number of target children who
have had all compulsory
immunizations and health
checkups
n.a. 100 n.a. n.a. n.a. n.a.
10 Number of prevented child
abandonments
n.a. 4 n.a. n.a. n.a. n.a.
11 Institutional care placement
rate among children from poor
and vulnerable families
n.a. −15 percent n.a. n.a. n.a. n.a.
12 Number of nursery and
kindergarten staff members
trained under the project (not
required anymore)
n.a. 52 — — — —
13 Number of parents who
participated in the family
counseling and support groups
n.a. 390 n.a. n.a. n.a. 130
14 Number of parents of children
ages 0–3 who participated in
the family counseling and
support groups
n.a. 250 778 n.a. n.a. n.a.
15 Number of prospective parents
who participated in the family
counseling and support groups
n.a. n.a. n.a. n.a. n.a. 12

78
No. SIP Results Indicators
World Bank–Financed Phase
Service delivery time frame:
07/01/2014–12/31/2016
OP HRD–Funded Phase
Service delivery time frame:
08/03/2016–10/03/2018
INDICATOR VALUE INDICATOR VALUE
Baseline Target Actual Baseline Target
Intermediate
(date not
specified)
16 Number of children
beneficiaries of child
counseling (health checkups)
n.a. 3,200 2,788 n.a. n.a. 182
17 Number of parents who do not
take sufficient care of their
children
n.a. −4 n.a. n.a. n.a. n.a.
18 Number of children
beneficiaries of early disability
intervention services for children
with disabilities
n.a. 120 12 n.a. n.a. 22
19 Number of parent beneficiaries
of early intervention services
for children with disabilities
who have children diagnosed
with various diseases
n.a. n.a. n.a. n.a. n.a. 30
20 Number of children
beneficiaries of summer school
activities
n.a. n.a. n.a. n.a. n.a. 30
21 Number of beneficiaries of
counseling services
n.a. 300 n.a. n.a. n.a. n.a.
22 Number of children enrolled in
kindergarten, nursery, and/or
other childcare services as a
result of the project
n.a. 82 n.a. n.a. n.a. n.a.
23 Number of children ages 3–7
enrolled in kindergarten and
preschool as a result of the
project
n.a. 25 21 n.a. n.a. n.a.
24 Number of disabled children
enrolled in kindergarten and
preschool as a result of the
project
n.a. 10 3 n.a. n.a. n.a.
25 Total number of service providers
for social inclusion
n.a. n.a. n.a. n.a. 1 n.a.
26 Total number of children receiving
service support
n.a. n.a. n.a. n.a. 300 341
Source: Byala Slatina Municipality, SIP Proposal (2010); : Ministry of Labour and Social Policy, Report on the
Implementation of the Social Inclusion Project (March 2010–December 31, 2015), Sofia, May 2016; project documentation
provided by the Ministry of Labour and Social Policy related to Social Inclusion Project activities, and intermediate results
since OP HRD took over the project’s funding.
Note: — = not applicable; n.a. = not available; OP HRD = Operational Program Human Resources Development; SIP =
Social Inclusion Project.

79
Table D.10. Haskovo Municipality SIP Results
SIP Results Indicators
World Bank–Financed Phase
Service delivery time frame:
07/01/2014–12/31/2015
OP HRD–Funded Phase
Service delivery time frame:
06/30/2016–08/30/2018
INDICATOR VALUE INDICATOR VALUE
Baseline Target Actual Baseline Target
Intermediate
(02/08/2018)
Kindergarten enrollment rate of children
up to age seven years from low-income
families and different ethnic groups,
specifically Roma
n.a. 70 percent n.a. n.a. n.a. n.a.
Preschool enrollment rate of children up
to age seven years from low-income
families and different ethnic groups,
specifically Roma
n.a. 70 percent n.a. n.a. n.a. n.a.
Kindergarten enrollment rate of children
with disabilities
n.a. 90 percent n.a. n.a. n.a. n.a.
Number of children ages 3–7 enrolled in
kindergarten and preschool as a result of
the project
n.a. – 12 n.a. n.a. n.a.
Preschool enrollment rate of children
with disabilities
n.a. 90 percent n.a. n.a. n.a. n.a.
Number of disabled children enrolled in
kindergarten and preschool as a result of
the project
n.a. – 2 n.a. n.a. n.a.
Number of project beneficiary children
enrolled in first grade
n.a. 98 percent n.a. n.a. n.a. n.a.
Number of newly created places (spaces)
for providing integrated services for
social inclusion as a result of the project
n.a. 1 1 n.a. n.a. n.a.
Number of children who have had all
compulsory immunizations and health
checkups
n.a. 90 percent n.a. n.a. n.a. n.a.
Number of children beneficiaries of
health counseling and disease prevention
activities for children
n.a. 605 837 n.a. n.a. 175
Number of prevented child abandonments n.a. 5 n.a. n.a. n.a. n.a.
Institutional care placement rate among
children from poor and vulnerable
families
n.a. −3 n.a. n.a. n.a. n.a.
Number of nursery and kindergarten staff
members trained under the project (not
required anymore)
n.a. 15 — — — —
Number of parents who participated in
the family counseling and support groups
n.a. 50 n.a. n.a. n.a. n.a.
Number of parents of children ages 0–3
who participated in the family counseling
and support groups
n.a. 80 303 n.a. n.a. n.a.
Number of parents who do not take
sufficient care of their children
n.a. −5 n.a. n.a. n.a. n.a.
Number of beneficiaries of counseling
services
n.a. 40 n.a. n.a. n.a. n.a.

80
SIP Results Indicators
World Bank–Financed Phase
Service delivery time frame:
07/01/2014–12/31/2015
OP HRD–Funded Phase
Service delivery time frame:
06/30/2016–08/30/2018
INDICATOR VALUE INDICATOR VALUE
Baseline Target Actual Baseline Target
Intermediate
(02/08/2018)
Number of children beneficiaries of
family counseling services
n.a. n.a. n.a. n.a. n.a. 637
Number of children beneficiaries of early
intervention of disabilities services
n.a. 110 94 n.a. n.a. 160
Number of children enrolled in
kindergarten, nursery, and/or other
childcare services as a result of the
project
n.a. 5 n.a. n.a. n.a. n.a.
Total number of service providers for
social inclusion
n.a. n.a. n.a. n.a. 1 n.a.
Total number of children receiving
service support
n.a. n.a. n.a. n.a. 920 702
Source: Haskovo Municipality, SIP Proposal (2010); Ministry of Labour and Social Policy Report on the Implementation of
the Social Inclusion Project for the period March 2010–December 31, 2015; project documentation provided by the Ministry
of Labour and Social Policy related to SIP activities, and intermediate results since OP HRD took over the project’s funding.
Note: — = not applicable; n.a. = not available; OP HRD = Operational Program Human Resources Development; SIP =
Social Inclusion Project.
Table D.11. Pazardzik Municipality SIP Results
Project Results Indicators
World Bank–Financed Phase
Service delivery time frame:
11/01/2014–12/31/2015
OP HRD–Funded Phase
Service delivery time frame:
05/11/2016–12/11/2018
INDICATOR VALUE INDICATOR VALUE
Baseline Target Actual Baseline Target
Intermediate
(01/31/2018)
Kindergarten enrollment rate of children
up to age seven years from low-income
families and different ethnic groups,
specifically Roma
n.a. 10 percent n.a. n.a. n.a. n.a.
Preschool enrollment rate of children up
to age seven years from low-income
families and different ethnic groups,
specifically Roma
n.a. 20 percent n.a. n.a. n.a. n.a.
Kindergarten enrollment rate of children
with disabilities
n.a. 15 percent n.a. n.a. n.a. n.a.
Number of children ages 3–7 enrolled in
kindergarten and preschool as a result of
the project
n.a. 48 49 n.a. n.a. n.a.
Number of disabled children enrolled in
kindergarten and preschool as a result of
the project
n.a. 20 0 n.a. n.a. n.a.
Preschool enrollment rate of children
with disabilities
n.a. 10 percent n.a. n.a. n.a. n.a.
Number of children beneficiaries of
health consultations
n.a. 150 524 n.a. n.a. n.a.

81
Project Results Indicators
World Bank–Financed Phase
Service delivery time frame:
11/01/2014–12/31/2015
OP HRD–Funded Phase
Service delivery time frame:
05/11/2016–12/11/2018
INDICATOR VALUE INDICATOR VALUE
Baseline Target Actual Baseline Target
Intermediate
(01/31/2018)
Number of new nursery and kindergarten
places opened under SIP
n.a. 75 50 n.a. n.a. n.a.
Number of new kindergarten and
preschool places opened under the project
n.a. 2 50 n.a. n.a. n.a.
Number of project beneficiary children
enrolled in first grade
n.a. 240 n.a. n.a. n.a. n.a.
Number of children who have had all
compulsory immunizations and health
checkups
n.a. 70 n.a. n.a. n.a. n.a.
Number of prevented child abandonments n.a. 5 n.a. n.a. n.a. n.a.
Institutional care placement rate among
children from poor and vulnerable
families
n.a. −10 n.a. n.a. n.a. n.a.
Number of newly created places (spaces)
for integrated services for social inclusion
n.a. 1 1 n.a. n.a. n.a.
Number of nursery and kindergarten staff
members trained under the project (not
required anymore or dropped)
n.a. 70 – – – –
Number of parents who participated in
the family counseling and support groups
n.a. 69 n.a. n.a. n.a. 59
Number of parents of children ages 0–3
who participated in the family counseling
and support groups
n.a. 50 207 n.a. n.a. n.a.
Number of foster parents who
participated in the family counseling and
support groups
n.a. n.a. n.a. n.a. n.a. 37
Number of parents who do not take
sufficient care of their children
n.a. −10 n.a. n.a. n.a. n.a.
Number of beneficiaries of counseling
services
n.a. 95 n.a. n.a. n.a. n.a.
Number of children enrolled in
kindergarten, nursery, and/or other
childcare services as a result of the
project
n.a. 25 n.a. n.a. n.a. n.a.
Total number of service providers for social
inclusion
n.a. n.a. n.a. n.a. 1 1
Total number of children receiving service
support
n.a. n.a. n.a. n.a. 590 249
Source: Pazardzhik Municipality, SIP Proposal (2010); Ministry of Labour and Social Policy Report on the Implementation
of the Social Inclusion Project for the period March 2010–December 31, 2015; project documentation provided by the
Ministry of Labor and Social Policy related to SIP activities, and intermediate results since OP HRD took over the project’s
funding.
Note: — = not applicable; n.a. = not available; OP HRD = Operational Program Human Resources Development; SIP =
Social Inclusion Project.

82
Table D.12. Plovdiv Municipality SIP Results
Project Results Indicators
World Bank–Financed Phase
Service delivery time frame:
10/29/2014–12/31/2015
OP HRD–Funded Phase
Service delivery time frame:
07/26/2016–09/26/2018
INDICATOR VALUE INDICATOR VALUE
Baseline Target Actual Baseline Target
Intermediate
(date not
specified)
Kindergarten enrollment rate of
children up to age seven years from
low-income families and different
ethnic groups, specifically Roma
n.a. 40 n.a. n.a. n.a. n.a.
Preschool enrollment rate of children
up to age seven years from low-
income families and different ethnic
groups, specifically Roma
n.a. 45 n.a. n.a. n.a. n.a.
Number of children ages 3–7 enrolled
in kindergarten and preschool under
the project
n.a. 160 81 n.a. n.a. n.a.
Number of disabled children enrolled
in kindergarten and preschool under
the project
n.a. 20 2 n.a. n.a. n.a.
Kindergarten enrollment rate of
children with disabilities
n.a. 20 n.a. n.a. n.a. n.a.
Number of children benefiting from
early intervention of disabilities
n.a. 100 208 n.a. n.a. n.a.
Preschool enrollment rate of children
with disabilities
n.a. 20 n.a. n.a. n.a. n.a.
Number of new nursery and
kindergarten places opened under SIP
n.a. 28 132 n.a. n.a. n.a.
Number of project beneficiary
children enrolled in first grade
n.a. 70 n.a. n.a. n.a. n.a.
Number of newly opened
kindergarten and preschool places
under the project
n.a. 60 40 n.a. n.a. n.a.
Number of newly opened places
(spaces) for integrated services for
social inclusion under the project
n.a. 1 1 n.a. n.a. n.a.
Number of children who have had all
compulsory immunizations and health
checkups
n.a. 150 n.a. n.a. n.a. n.a.
Number of prevented child
abandonments
n.a. 60 n.a. n.a. n.a. n.a.
Institutional care placement rate
among children from poor and
vulnerable families
n.a. −60 n.a. n.a. n.a. n.a.
Number of nursery and kindergarten
staff members trained under the
project (not required anymore)
n.a. 10 – – – –
Number of parents who participated
in the family counseling and support
groups
n.a. 250 n.a. n.a. n.a. n.a.

83
Source: Plovdiv Municipality, SIP Proposal (2010); Ministry of Labour and Social Policy Report on the Implementation of
the Social Inclusion Project for the period March 2010–December 31, 2015; project documentation provided by the Ministry
of Labour and Social Policy related to SIP activities, and intermediate results since OP HRD took over the project’s funding.
Note: — = not applicable; n.a. = not available; OP HRD = Operational Program Human Resources Development; SIP =
Social Inclusion Project.
Number of parents of children ages 0–
3 who participated in the family
counseling and support groups
n.a. 200 80 n.a. n.a. n.a.
Number of children ages 0–7 who
benefited from health consultation
n.a. 120 1,000 n.a. n.a. n.a.
Number of parents who do not take
sufficient care of their children
n.a. −120 n.a. n.a. n.a. n.a.
Number of beneficiaries of counseling
services
n.a. 865 n.a. n.a. n.a. n.a.
Number of children enrolled in
kindergarten, nursery, and/or other
childcare services as a result of the
project
n.a. 68 n.a. n.a. n.a. n.a.
Number of health workers who
received trainings under the project
n.a. 30 n.a. n.a. n.a. n.a.
Share of project beneficiaries with
positive feedback about the project
n.a. 50 percent n.a. n.a. n.a. n.a.
Share of beneficiary children with
progress in their development and the
care for them during the project
n.a. 60 percent n.a. n.a. n.a. n.a.
Number of children from isolated
communities and children with
special needs who are integrated in
family centers, preschools, and
summer schools
n.a. 120 n.a. n.a. n.a. n.a.
Number of children ages 0–3 for
whom substituting baby care is
provided in their homes from a
babysitter
n.a. 8 n.a. n.a. n.a. n.a.
Number of children in kindergartens
who have had psychomotor and
physical development checks under
the project
n.a. 400 n.a. n.a. n.a. n.a.
Total number of service providers for
social inclusion
n.a. n.a. n.a. n.a. 1 1
Total number of children receiving
service support
n.a. n.a. n.a. n.a. 875 223

84
Table D.13. Pravets Municipality SIP Results
Project Results Indicators
World Bank–Financed
Phase
Service delivery time frame:
03/01/2013–12/31/2015
01-Mar-2015 – 31-Dec-2015
OP HRD–Funded Phase
Service delivery time frame:
08/03/2016–10/03/2018
INDICATOR VALUE INDICATOR VALUE
Baseline Target Actual Baseline Target
Intermediate
(date not
specified)
Kindergarten enrollment rate of children
up to age seven years from low-income
families and different ethnic groups,
specifically Roma
n.a. 4 percent n.a. n.a. n.a. n.a.
Preschool enrollment rate of children up to
age seven years from low-income families
and different ethnic groups, specifically
Roma
n.a. 4 percent n.a. n.a. n.a. n.a.
Kindergarten enrollment rate of children
with disabilities
n.a. 2
children
n.a. n.a. n.a. n.a.
Number of children ages 3–7 enrolled in
kindergarten and preschool under the
project
n.a. 22 30 n.a. n.a. n.a.
Number of disabled children enrolled in
kindergarten and preschool under the
project
n.a. 2 2 n.a. n.a. n.a.
Preschool enrollment rate of children with
disabilities
n.a. 2
children
n.a. n.a. n.a. n.a.
Number of new nursery and kindergarten
places opened under SIP
n.a. 32 n.a. n.a. n.a. n.a.
Number of new kindergarten and
preschool places opened under the project
n.a. 32 32 n.a. n.a. n.a.
Number of project beneficiary children
enrolled in first grade
n.a. 12 n.a. n.a. n.a. n.a.
Number of newly created places (spaces)
for integrated services for social inclusion
n.a. 2 2 n.a. n.a. n.a.
Number of children who have had all
compulsory immunizations and health
checkups
n.a. 70 n.a. n.a. n.a. n.a.
Number of parent beneficiaries of health
consultations and disease prevention
services for children
n.a. n.a. n.a. n.a. n.a. 241
Number of children ages 0–7 beneficiaries
of health consultations and disease
prevention services for children
n.a. 160 109 n.a. n.a. n.a.
Number of children beneficiaries of
additional pedagogical preparation for
raising their school readiness for an equal
start in school
n.a. n.a. n.a. n.a. n.a. 45
Number of beneficiaries of free
transportation for the purpose of attending
the integrated services, kindergarten, and
mobile work
n.a. n.a. n.a. n.a. n.a. 172
Number of prevented child abandonments n.a. 10 n.a. n.a. n.a. n.a.

85
Institutional care placement rate among
children from poor and vulnerable families
n.a. n.a. n.a. n.a. n.a. n.a.
Number of nursery and kindergarten staff
members trained under the project (not
required anymore or dropped)
n.a. 20 – – – –
Number of parents who participated in the
family counseling and support groups
n.a. 450 n.a. n.a. n.a. 534
Number of parents of children ages 0–3
who participated in the family counseling
and support groups
n.a. 450 446 n.a. n.a. n.a.
Number of children who benefited from
the family counseling and support service
n.a. n.a. n.a. n.a. n.a. 247
Number of parents who do not take
sufficient care of their children
n.a. 30 n.a. n.a. n.a. n.a.
Number of beneficiaries of counseling
services
n.a. 574 n.a. n.a. n.a. n.a.
Number of children enrolled in
kindergarten, nursery, and/or other
childcare services as a result of the project
n.a. 32 n.a. n.a. n.a. n.a.
Total number of service providers for social
inclusion
n.a. n.a. n.a. n.a. 1 n.a.
Total number of children receiving service
support
n.a. n.a. n.a. n.a. 240 543
Source: Pravets Municipality, SIP Proposal (2010); Ministry of Labour and Social Policy Report on the Implementation of
the Social Inclusion Project for the period March 2010–December 31, 2015; project documentation provided by the Ministry
of Labour and Social Policy related to SIP activities, and intermediate results since OP HRD took over the project’s funding.
Note: — = not applicable; n.a. = not available; OP HRD = Operational Program Human Resources Development; SIP =
Social Inclusion Project.

86
Table D.14. SIP Service Delivery Time Frames across World Bank and (Postproject)
OP HRD Phases
BYALA SLATINA MUNICIPALITY
SIP Early Childhood
Development Services
Time Frame Service
Delivery
Gap
OP HRD ECD Services Time Frame
Child health consultation 09/03/2014–
12/31/2015
(16 months)
7 months Support for providing child health
consultation and disease prevention
activitiesa
08/03/2016–
10/032018
(26 months)
Early intervention for child
disability, and individual
pedagogical support for children
with disabilities
08/01/2015–
12/31/2015
(5 months)
Early intervention of disabilitiesb
Formation and development of
parental skills, and family
counseling and support
03/01/2015–
12/31/2015
(10 months)
Support to families for the early
development of their children
Additional pedagogical training
to increase the school readiness
of vulnerable and marginalized
children for an equal start in
school (summer schools)
Summer
2014–
12/31/2015
(20 days: two
summer
schools
delivered, 10
days each)
Motivation and preparation for an
equal start in school
HASKOVO MUNICIPALITY
Service Time frame Service
Delivery
Gap
OP HRD ECD Services Time
Frame
Child consultation 11/01/2014–
12/31/2015
(14 months)
6 months Support for providing child health
consultation and disease prevention
activities
06/30/2016–
08/30/2018
(26 months)
Early intervention for child
disability, and individual
pedagogical support for children
with disabilities
11/26/2015–
12/31/2015
(1 month)
Early intervention of disabilities,
and individual pedagogical support
for children with disabilities
Formation and development of
parental skills, and family
counseling and support
12/09/2014–
12/31/2015
(13 months)
Providing psychological support
and consultation to prospective and
current parents to build and develop
parenting skills; family consultation
and support
Additional pedagogical training
to increase the school readiness
of vulnerable and marginalized
children for an equal start in
school (summer schools)
Summer, 2014
(Four months:
2 months in
2014 + 2
months in
2015)
Additional pedagogical training to
increase the school readiness of
children for an equal start in school
Integrating vulnerable and
marginalized children in
kindergartens and preschools.
Activities include:
Enrolling vulnerable and
marginalized children in
kindergarten and preschool, and
11/01/2014–
12/31/2015
(14 months)
Individual and group work with
children and parents, including with
children and parents not from
vulnerable groups with a view of
attending a kindergarten

87
helping them to adapt to the new
environment there.
Work with the vulnerable and
marginalized children’s parents
aimed to overcome their mistrust
of integrated kindergarten and
make them supportive of their
children’s better education
Work with the other parents
(nonvulnerable) through
meetings aimed to overcome
prejudices toward newly
enrolled vulnerable kids
Joint activities with all parents
Providing free transportation to
beneficiary children to and from
kindergarten, summer school,
and the community centerc
PAZARDZIK MUNICIPALITY
Service Time frame Service
Delivery
Gap
OP HRD ECD Services Time frame
Child health consultation 06/01/2015–
12/31/2015
(7 months)
(4.5
months)
Support for providing child health
consultation and disease prevention
activities
05/11/2016–
12/11/2018
(31 months)
Mother and child health
Individual pedagogical support
for children with disabilities
06/15/2015–
12/31/2015
(6.5 months)
Individual pedagogical support for
children with disabilities
Early intervention of disabilities
service is prevention of the
abandonment and/or the
institutionalization of children with
disabilities and their families,
including rehabilitation and
consultation activities, training, and
mobile work with the child in his or
her home
Formation and development of
parental skills, and family
counseling and support
06/15/2015–
12/31/2015
(6.5 months)
Providing psychological support
and consultation to prospective and
current parents to build and develop
parenting skills, and family
consultation and support
Additional pedagogical training
to increase the school readiness
of vulnerable and marginalized
children for an equal start in
school (summer schools)
07/01/2015–
12/31/2015
(Two months:
one summer
school
delivered, two
months long)
11/01/2014–
12/31/2015
(23 months)
Individual and group work with
children and parents not from
vulnerable groups with a view of
attending a kindergarten
PLOVDIV MUNICIPALITY

88
Service Time frame Service
Delivery
Gap
OP HRD ECD Services Time frame
Child health consultation 10/29/2014–
12/31/2015
(14 months)
7 months Support for providing child health
consultation and disease prevention
activities
07/26/2016–
09/26/2018
(26 months) Early intervention for child
disability, and individual
pedagogical support for children
with disabilities
03/01/2015–
12/31/2015
(10 months)
Early intervention of disabilities,
and individual pedagogical support
for children with disabilities
Formation and development of
parental skills, and family
counseling and support
03/01/2015–
12/31/2015
(10 months)
Formation and development of
parental skills, and family
counseling and support
Additional pedagogical training
vulnerable and marginalized
children to increase their school
readiness for an equal start in
school (summer schools)
07/15/2015–
12/31/2015
(3.5 months:
one summer
school, 3.5
months long)
Additional pedagogical training to
increase the school readiness of
children for an equal start in school
PRAVETS MUNICIPALITY
Service Time frame Service
Delivery
Gap
OP HRD ECD Services Time frame
Child health consultation 07/31/2015–
12/31/2015
(5 months)
7 months Support for providing child health
consultation and disease prevention
activities
08/03/2016–
10/03/2018
(26 months) Formation and development of
parental skills, and family
counseling and support
03/01/2015–
12/31/2015
(10 months)
Providing psychological support
and consultation to prospective and
current parents to build and develop
parenting skills, and family
consultation and support
Additional pedagogical training
to increase the school readiness
of vulnerable and marginalized
children for an equal start in
school (summer schools)
07/15/2015–
12/31/2015
(up to three
months: one
summer
school, length
not specified)
Additional pedagogical training to
increase the school readiness of
children for an equal start in school
Individual and group work with
children and parents including with
children and parents not from
vulnerable groups with a view of
attending a kindergarten
Source: For SIP ECD services and time frame: Ministry of Labour and Social Policy Report on the Implementation of the
Social Inclusion Project for the period March 2010–April 30, 2016, Annex 2; for OP HRD ECD services and time frame:
Ministry of Labour and Social Policy, Department European Funds, International Programs and Projects, Operational
Program Human Resources Development (2014–20).
Note: ECD = early childhood development; OP HRD = Operational Program Human Resources Development; SIP = Social
Inclusion Project.
a. Support for providing child health consultation and disease prevention activities is a service for monitoring the health,
physical, and psychomotor development of children ages 0–7 to prevent child morbidity and mortality, insufficient care in
the family, and other early childhood–related risks by providing regular monitoring of the health, physical, and psychomotor
development of babies and children.

89
b. Early intervention of disabilities is a service for preventing the abandonment and/or institutionalization of children with
disabilities and building special skills for raising children with disabilities.
c. The source for this information is the Municipality of Haskovo Social Inclusion Project Proposal, 2010.

90
Table D.15. Services Delivered across World Bank– and OP HRD–Financed Phases for
Five Municipalities
BYALA SLATINA MUNICIPALITY SIP Early Childhood
Development (ECD)
Services
OP HRD ECD Services Services Dropped Services Added
Child health consultation Support for providing child
health consultation and
disease prevention activitiesa
Individual pedagogical
support for children
with disabilities
Early intervention for child
disability, and individual
pedagogical support for
children with disabilities
Early intervention of
disabilitiesb
Formation and development
of parental skills, and family
counseling and support
Support to families for the
early development of their
children
Additional pedagogical
training to increase the school
readiness of children for an
equal start in school (summer
schools)
Motivation and preparation
for an equal start in school
HASKOVO MUNICIPALITY
Service OP HRD ECD Services Services Dropped Services Added
Child health consultation Support for providing child
health consultation and
disease prevention activities
Early intervention for child
disability, and individual
pedagogical support for
children with disabilities
Early intervention of
disabilities, and individual
pedagogical support for
children with disabilities
Formation and development
of parental skills, and family
counseling and support
Providing psychological
support and consultation to
prospective and current
parents to build and develop
parenting skills; family
consultation and support
Additional pedagogical
training to increase the school
readiness of children for an
equal start in school (summer
schools)
Additional pedagogical
training to increase the school
readiness of children for an
equal start in school
Integrating children in
kindergartens and preschools
Enrolling and/or helping to
adapt vulnerable children in
integrated kindergartens and
preschools
Work with the vulnerable
children’s parents
Work with the rest of the
parents (nonvulnerable)
through meetings aimed to
overcome prejudices toward
the newly enrolled vulnerable
children
Individual and group work
with children and parents,
including with children and
parents not from vulnerable
groups aimed to improve
kindergarten attendance

91
Joint activities with all
parents
Providing free transportation
to and from kindergarten or
preschoolc
PAZARDZIK MUNICIPALITY
Service OP HRD ECD Services Services Dropped Services Added
Child health consultation Support for providing child
health consultation and
disease prevention activities
Additional pedagogical
training to increase the
school readiness of
children for an equal
start in school (summer
schools)
Early intervention of
disabilities
Mother and child health
Mother and child health
Individual pedagogical
support for children with
disabilities
Individual pedagogical
support for children with
disabilities
Early intervention of
disabilities
Formation and development
of parental skills, and family
counseling and support
Psychological support and
consultation to prospective
and current parents to build
and develop parenting skills,
and family consultation and
support
Additional pedagogical
training to increase the school
readiness of children for an
equal start in school (summer
schools)
Individual and group work
with children and parents not
from vulnerable groups
aimed to improve
kindergarten attendance
PLOVDIV MUNICIPALITY
Service OP HRD ECD Services Services Dropped Services Added
Childcare health consultation Support for providing child
health consultation and
disease prevention activities
Early intervention for child
disability, and individual
pedagogical support for
children with disabilities
Early intervention of
disabilities, and individual
pedagogical support for
children with disabilities
Formation and development
of parental skills, and family
counseling and support
Formation and development
of parental skills, and family
counseling and support
Additional pedagogical
training to increase the school
readiness of children for an
equal start in school (summer
schools)
Additional pedagogical
training to increase the school
readiness of children for an
equal start in school
PRAVETS MUNICIPALITY
Service OP HRD ECD Services Services Dropped Services Added
Childcare health consultation Support for providing child
health consultation and
disease prevention activities
Individual and group work
with children and parents,
including with children and

92
Formation and development
of parental skills, and family
counseling and support
Providing psychological
support and consultation to
prospective and current
parents to build and develop
parenting skills, and family
consultation and support
parents not from vulnerable
groups aimed to improve
kindergarten attendance
Additional pedagogical
training to increase the school
readiness of children for an
equal start in school (summer
schools)
Additional pedagogical
training to increase the school
readiness of children for an
equal start in school
Individual and group work
with children and parents,
including with children and
parents not from vulnerable
groups aimed to improve
kindergarten attendance
Source: For SIP ECD services and time frame: Ministry of Labour and Social Policy Report on the Implementation of the Social Inclusion Project for
the period March 2010–April 30, 2016, Annex 2; for OP HRD ECD services and time frame: Ministry of Labour and Social Policy,
Department European Funds, International Programs and Projects, Operational Program Human Resources Development (2014–20).
Note: ECD = early childhood development; OP HRD = Operational Program Human Resources Development; SIP = Social Inclusion
Project.
a. Support for providing child health consultation and disease prevention activities is a service for monitoring the health, physical, and
psychomotor development of children ages 0–7 to prevent child morbidity and mortality, insufficient care in the family, and other early
childhood–related risks by providing regular monitoring of the health, physical, and psychomotor development of babies and children.
b. Early intervention of disabilities is a service for preventing the abandonment and/or institutionalization of children with disabilities and
building special skills for raising children with disabilities.
c. The source for this information is the Municipality of Haskovo Social Inclusion Project Proposal, 2010.
Municipality-Level Targeting: A Sample from Five Municipalities
Table D.16. Byala Slatina Municipality: SIP Target Groups and Expected Number of
Beneficiaries
SIP Target Groups: Key Indicators
Estimated
Target Group
Sizea Data Sources
Children at risk ages 0–7 from vulnerable
ethnic groups, mainly from Roma ethnicity
354 Unofficial sources: nongovernmental organizations,
informal Roma leaders
Official source: Department of Education within the
municipal administration
Children at risk ages 0–7 with unemployed
parents
209 Local employment office and local social assistance
department
Children at risk ages 0–7 whose parents
receive social assistance
163 Local social assistance department
Children ages 0–7 whose parents are
uninsured
650 Multiprofile Hospital for Active Treatment, Byala
Slatina
Children at risk ages 0–7 who are not cared
for well or whose parents are abroad
130 Local police department and local social assistance
department
Children with disabilities ages 0–7 45 Local social assistance department
Parents of children ages 0–7 from vulnerable
ethnic groups, mainly Roma
192 Unofficial data sources (not specified)
Future parents from vulnerable groups 109 Unofficial data sources (not specified)
Parents of multiple children (three or more)
ages 0–7
60 Local social assistance department
Single parents of children ages 0–7 62 Local social assistance department (the proposal notes
that there are more, but yet unidentified)

93
Teen mothers (ages 13–18) 19 Department of Obstetrics and Gynecology at
Multiprofile Hospital for Active Treatment, Byala
Slatina
Parents with no or low education who have
children ages 0–7
110 Local social assistance department
Parents of children ages 0–7 living in poor
housing conditions
110 Not specified
Parents of children ages 0–7 who do not care
well for them (registered)
103 Local police department and local social assistance
department
Parents of children with disabilities or health
issues
65 Local social assistance department
Parents of children ages 0–7 with
developmental delays
10 Local child protection department
Parents of children ages 0–7 who are
uninsured
235 Number of target parents who visited the municipal
hospital in 2010
Children ages 0–3 not attending nursery 897 Not specified
Children age five not attending preschool 55 Department of Education at the municipal
administration
Children age six not attending preschool 70 Department of Education at the municipal
administration
Children not attending elementary school
(grade 1–4)
0 Department of Education at the municipal
administration
Number of villages or quarters with compact
Roma population
9
Coverage (share of expected project
beneficiaries from the target group, all
potential beneficiaries)
Target children: 100 percent
Target parents: 53.4 percent
Source: Municipal Situation Analysis annexed to the Social Inclusion Project Proposal, Byala Slatina Municipality, 2010.
Note: SIP = Social Inclusion Project.
a. The estimated size of the target groups includes overlaps across categories.
Table D.17. Haskovo Municipality: SIP Target Groups and Expected Number of
Beneficiaries
SIP Target Groups: Key Indicators
Estimated Target Group
Sizea Data Sources
Children ages 0–7 from vulnerable ethnic groups, specifically
Roma
85 Municipal situation
analysis, the municipal
early childhood
development concept;
the municipal concept
for a social services
package accessible to
children and families
at risk; and the
municipal analysis of
issues that children
and their families are
faced with at the
municipal and national
level, which is part of
the National Strategy
for the Child (2008–
18)
Children ages 0–7 whose parents are unemployed 134
Children ages 0–7 whose parents are social assistance recipients 105
Children ages 0–7 without a general practitioner or whose
general practitioner is not a pediatrician
110
Children ages 0–7 whose parents are uninsured 105
Children ages 0–7 who do not attend kindergarten or other
childcare services
137
Children ages 0–7 who are not cared for well by their parents 12
Children ages 0–7 with disabilities 145
Children ages 0–7 with health issues 145
Parents from vulnerable ethnic groups, specifically Roma 170
Parents of children ages 0–7 on social assistance 31
Unemployed parents of children ages 0–7 31

94
Parents of multiple children ages 0–7 104
Single parents of children ages 0–7 28
Future parents from vulnerable groups 15
Parents of children ages 0–7 (mainly mothers) at risky age (teen
parents)
115
Parents of children ages 0–7 without education or with low
education
205
Parents of children ages 0–7 living in poor housing conditions 103
Parents who do not care well for their children ages 0–7
(registered in the local police department and social assistance
department)
82
Parents of children ages 0–7 with disabilities or health issues 200
Parents of children ages 0–7 with disease 200
Uninsured parents of children ages 0–7 31
Parents of children ages 0–7 at high risk (with developmental
delays and the like)
20
Children not attending kindergarten 75
Children not attending preschool 62
Coverage (share of expected project beneficiaries from the target
group; all potential beneficiaries)
1,620 expected total beneficiaries from all potential
beneficiaries (their number is not indicated) because
some of these 1,620 will benefit from more than one
service under the project
Number of segregated Roma settlements in the Haskovo
Municipality
1 (the Republika District in the city of Haskovo)
Source: Municipal Situation Analysis annexed to the Social Inclusion Project Proposal, Haskovo Municipality, 2010.
Note: SIP = Social Inclusion Project.
a. The estimated size of the target groups includes overlaps across categories.
Table D.18. Pazardzhik Municipality: SIP Target Groups and Expected Number of
Beneficiaries
SIP Target Groups: Key Indicators
Estimated Target Group
Sizea Data Sources
Children ages 0–7 from vulnerable ethnic
groups, specifically Roma
1,200 Municipal early childhood
development and parental support
concept, municipal situation analysis,
and municipal needs assessment
Children ages 0–7 whose parents are
unemployed
920
Children ages 0–7 whose parents are social
assistance recipients
262
Children ages 0–7 without a general
practitioner or whose general practitioner is
not a pediatrician
900
Children ages 0–7 whose parents are
uninsured
926
Children ages 0–7 who do not attend
kindergarten or other childcare services
2,395
Children ages 0–7 who are not cared for well
by their parents
150

95
Children ages 0–18 with disabilities, of which:
Children ages 0–18 with physical
disabilities: 128
Children ages 0–18 with multiple
disabilities: 251
Children ages 0–18 with cognitive delays:
36
Children ages 0–18 with mental illness: 42
457
Children ages 0–7 with health issues 520
Parents from vulnerable ethnic groups,
specifically Roma
915
Parents of children ages 0–7 on social
assistance
95
Unemployed parents of children ages 0–7 190
Parents of multiple children ages 0–7 600
Single parents of children ages 0–7 33
Future parents from vulnerable groups 215
Parents of children ages 0–7 (mainly mothers)
at risky age (teen parents)
85
Parents of children ages 0–7 without
education or with low education
3,540
Parents of children ages 0–7 living in poor
housing conditions
3,500
Parents who do not care well for their children
ages 0–7 (registered in the local police
department and social assistance department)
90
Parents of children ages 0–7 with disabilities
or health issues
680
Parents of children ages 0–7 with disease 307
Uninsured parents of children ages 0–7 1,700
Parents of children ages 0–7 at high risk (with
developmental delays and the like)
45
Children not attending nursery 204
Children not attending kindergarten 2,191
Children not attending preschool 368
Children not in elementary school (grade 1–4) 120
Number of segregated Roma settlements 27 (in the Municipality of Pazardzhik)
Coverage (share of expected project
beneficiaries from the target group, all
potential beneficiaries)
Target children (ages 0–7) Target group
size
Expected number
of project
beneficiaries
All target children 5,822 960
Target children from vulnerable
ethnic groups, particularly Roma
1,492 770
Source: Municipal Situation Analysis annexed to the Social Inclusion Project Proposal, Pazardzhik Municipality, 2010.
Note: SIP = Social Inclusion Project.
a. The estimated size of the target groups includes overlaps across categories.

96
Table D.19. Plovdiv Municipality: SIP Target Groups and Expected Number of
Beneficiaries
SIP Target Groups: Key Indicators
Estimated
Target Group
Sizea Data Sources
Children ages 0–7 from vulnerable ethnic groups, specifically
Roma
60 Not specified
Children ages 0–7 whose parents are unemployed 40 Not specified
Children ages 0–7 whose parents are social assistance recipients 60 Not specified
Children ages 0–7 without a general practitioner or whose general
practitioner is not a pediatrician
20 Not specified
Children ages 0–7 whose parents are uninsured 10 Not specified
Children ages 0–7 who do not attend kindergarten or other
childcare services
45 Not specified
Children ages 0–7 who are not cared for well by their parents 100 Not specified
Children ages 0–7 with disabilities 50 Not specified
Children ages 0–7 with health issues 60 Not specified
Parents from vulnerable ethnic groups, specifically Roma 100 Not specified
Parents of children ages 0–3 from vulnerable groups Not specified
Parents of children ages 0–7 on social assistance 35 Not specified
Unemployed parents of children ages 0–7 45 Not specified
Parents of multiple children ages 0–7 15 Not specified
Single parents of children ages 0–7 20 Not specified
Future parents from vulnerable groups 10 Not specified
Parents of children ages 0–7 (mainly mothers) at risky age (teen
parents)
10 Not specified
Parents of children ages 0–7 without education or with low
education
60 Not specified
Parents of children ages 0–7 living in poor housing conditions 40 Not specified
Parents who do not care well for their children ages 0–7 (registered
in the local police department and social assistance department)
100 Not specified
Parents of children ages 0–7 with disabilities 15 Not specified
Parents of children ages 0–7 with disease 20 Not specified
Uninsured parents of children ages 0–7 20 Not specified
Parents of children ages 0–7 at high risk (with developmental
delays, and so on)
15 Not specified
Coverage (share of expected project beneficiaries from the target
group, all potential beneficiaries)
10 percent
Source: Plovdiv Municipality, Inclusion Project Proposal, 2010.
Note: SIP = Social Inclusion Project.
a. The estimated size of the target groups includes overlaps across categories.
Table D.20. Pravets Municipality: SIP Target Groups and Expected Number of
Beneficiaries
SIP Target Groups: Key Indicators
Estimated Target
Group Sizea Data Sources
Target children 569
Children ages 0–7 from vulnerable ethnic groups, specifically Roma Not specified Not specified

97
Children ages 0–7 whose parents are unemployed Not specified Not specified
Children ages 0–7 who are not cared for well by their parents Not specified Not specified
Children ages 0–7 with disabilities Not specified Not specified
Children not attending nursery Not specified Not specified
Children attending mainstream or integrated kindergarten Not specified Not specified
Children attending mainstream or integrated preschool Not specified Not specified
Target parents (from the entire municipality) 854
Parents of children ages 0–7 from vulnerable ethnic groups, specifically
Roma
Not specified Not specified
Parents of children ages 0–7 on social assistance Not specified Not specified
Unemployed parents of children ages 0–7 Not specified Not specified
Parents of multiple children ages 0–7 Not specified Not specified
Single parents of children ages 0–7 Not specified Not specified
Future parents from vulnerable groups Not specified Not specified
Parents of children ages 0–7 without education or with low education Not specified Not specified
Nonvulnerable parents whose children attend kindergarten and
preschool along with vulnerable target children
Not specified Not specified
Coverage (share of expected project beneficiaries from the target group,
all potential beneficiaries)
Target children: 100 percent
Target parents: 100 percent
Source: Social Inclusion Project Proposal, Pravets Municipality, 2010.
Note: SIP = Social Inclusion Project.
a. The estimated size of the target groups includes overlaps across categories

98
Table D.21. Municipalities that Spent More Than Half of the World Bank Loan on
Construction
No. Municipality
Share of Total World
Bank Loan (percent) 1 Yambol 83
2 Blagoevgrad 82
3 Gabrovo 80
4 Rousse 80
5 Dolni Chiflik 80
6 Sliven 79
7 Sevlievo 73
8 Varna 73
9 Chirpan 72
10 Haskovo 71
11 Pazardjik 70
12 Pernik 69
13 Stara Zagora 67
14 Plovdiv 66
15 Montana 64
16 Aytos 60
17 Maritza 59
18 Bourgas 59
19 Samuil 59
20 Targovishte 58
21 Vulchi Dol 56
22 Petrich 56
23 Assenovgrad 55
24 Smolyan 55
25 Shoumen 55
26 Sredetz 55
27 Pleven 54
28 Yakoruda 54
29 Sofia Greater Municipality 54
30 General Toshevo 53
31 Dimitrovgrad 52
32 Pravetz 51
Source: Ministry of Labour and Social Policy Report on the Implementation of the Social Inclusion Project for the period March 2010–
December 31, 2015.
1 This information is contained in the : Ministry of Labour and Social Policy, Report on the Implementation of
the Social Inclusion Project (March 2010–December 31, 2015), Sofia, May 2016.
2 Under the OP HRD funding, the project beneficiaries target output data are not disaggregated by subtarget
category because only information about the cumulative number of children served is required.

99
Appendix E. List of People Met
Government of Bulgaria
Ministry of Labour and Social Protection
• Ms. Zornitsa Roussinova, Deputy Minister
• Ms. Elena Kremenlieva, Director, Social Inclusion Department (SID)
• Mr. Iliyan Saraliev, Manager, Social Inclusion Programs Department, SID
• Ms. Anna Nikolova, Deputy Director, Operational Program Human Resources
Development (OP HRD) Managing Authority
• Ms. Maria Zhelezarova, Manager, Verification Department, OP HRD Managing
Authority
• Mr. Georgi Yankov, Manager, Verification Department, North
Five Municipalities in Bulgaria Visited by Evaluation Team
Byala Slatina Municipality
Meetings at Buala Slatina Town Hall
• Ivo Tsvetanov, Mayor
• Petar Petrov, Deputy Mayor, Head of Projects and Finances Department
• Darina Krysteva, Social Inclusion Project (SIP) Coordinator (until 2015), SIP Project
Manager (since 2015)
• Denitsa Vasileva, Technical Assistant, Byala Slatina Municipal Administration
• Albena Gabrova, Ministry of Labour and Social Policy (MLSP)
• Budinka Todorova, Head/Headmaster, Chervena Shapchitsa Kindergarten, Gabare
Village
• Maria Dimitrova, Head/Headmaster, Nezabravka Kindergarten, town of Byala Slatina
Meetings at a (mainstream) secondary school, Vasil Levski, in the town of Byala Slatina
where SIP beneficiary children study
• A Roma father and his daughter, who is in first grade and is an excellent student
• Elementary school teacher
• Jordan Tsokanov, school principal
• Deputy school principal
Meetings at Center for Social Inclusion “My Family and I,” town of Byala Slatina
• Head of the Center for Social Inclusion “My Family and I”
• Specialists providing services at the Center for Social Inclusion “My Family and I”
(psychologist, kinesitherapy specialist, pediatrician, gynecologist, and other
specialists)

100
• Parents and their children benefiting from services (predominantly Roma)
• Three community mediators, all Roma (two women and one man)
Meetings at a (segregated) elementary school, Hristo Smirnenski, in a Roma
neighborhood in the town of Byala Slatina
• Evgeni Angelov, school principal
Meetings at predominately Roma kindergarten (nonbeneficiary of SIP) in a Roma
neighborhood in the town of Byala Slatina
• Head/Headmaster of the kindergarten
• Two kindergarten teachers
Haskovo Municipality
Meetings at Community Center, town of Haskovo
• Miroslava Macheva, Head of Community Center
• Dessislava Stoyanova, SIP Manager and Senior Officer at Municipality of Haskovo
• Hristna Mihailova, Technical Assistant
• Antonia Delcheva, Senior Officer, MLSP, European Funds, International Programs
and Projects Department, Verification—South Unit
• Two mediators (Radka and Irina, non-Roma women who do not live among Roma)
• Two social workers (non-Roma women)
• Pediatrician
• Physical therapist
• Other service providers
Meetings with three parents of children with disabilities, benefiting from SIP services
• Two ethnic Bulgarians
• One ethnic Turk
Meetings at (mainstream) Secondary School, Vasil Levski, town of Haskovo
• Resource teacher (specialized in teaching children with special educational needs)
• Preschool teacher of two children with disabilities who are SIP beneficiaries
Meetings at Kindergarten Shturche in Republika quarter (mainly Roma and Turkish
residents)
• Head/Headmaster, kindergarten
• Kindergarten teachers (teach one of the disabled SIP beneficiaries)
Meetings at Haskovo Municipality Offices

101
• Dobri Belivanov, Mayor
• Zlatka Karadzhova, Director, Humanitarian and Public Services Department,
Haskovo Municipal Administration
• Dessislava Stoyanova, SIP Manager (previously SIP Coordinator) and Senior Social
Services Expert, Haskovo Municipal Administration
• Maria Spilkova, Junior Officer, Social Services, Haskovo Municipal Administration
• Kremena Kondova, Senior Health Care Officer, Haskovo Municipal Administration
• Hristina Mihailova, Junior Officer, Social Services, Haskovo Municipal
Administration
• Antonia Delcheva, Senior Officer, MLSP, European Funds, International Programs
and Projects Department, Verification—South Unit
Meetings at Community Center, town of Haskovo
• Head of community center
• Two mediators
• Two social workers
• Gynecologist
• Lawyer
Meetings with Roma parents and their children, SIP beneficiaries, residents of a
municipal residential building in the Roma neighborhood of Republika
Visit with an unemployed, 53-year-old Roma grandmother whose daughter and
grandchildren are SIP beneficiaries, living in Republika
• Plovdiv Municipality
Community Center, Plovdiv
• Ofelia Velkova, Head of Community Center
• Donka Shtilianova, Head of Education Department, Plovdiv Municipal
Administration
• Veselina Boteva, Director, Social Policy Directorate, Plovdiv Municipal
Administration
• Emil Nachev, School Principal, (segregated, Roma) Secondary School Nayden Gerov
• Stefka Simeonova, Education Officer, Municipality of Plovdiv
• Five parents of children who are SIP beneficiaries
• Specialists employed at the community center (speech therapist and physical
therapist, among others)
• Two Roma mediators (one woman and one man)

102
Meetings at Primary School Pencho Slaveykov, Stolipinovo (segregated Roma)
neighborhood
• Ekaterlina Delinova, School Principal
• Teachers
• Parents
• Students
Meetings at Kindergarten Shtastlivo Detstvo (Happy Childhood), Town of Plovdiv
(about 80 percent Roma)
• Evgenia Popivanova, Headmaster
• Kindergarten teachers
• Speech therapist
• Children
Pazardzhik Municipality
Meetings at Community Center (Center for Social Inclusion and Support), Town of
Pazardzhik
• Tanya Gyunova, Project Coordinator
• Svetlana Stamenova, Manager of Municipal Foster Care Team
• Tsonka Karadzhova, community center accountant
• Irina Stamatova, SIP Project Manager
• Diana Pashova, Manager of family care center of children with disabilities
• Nikolai Lazarov, family care center for children and youth (without disabilities)
• Iliana Atanasova, community center social worker
• Penka Uzunova, community center social worker
• Petya Mitova, community center social worker
• Vanya Dimitrova, speech therapist
• Community center midwife
• Maria Totkova, Roma mother of a disabled child who is a SIP beneficiary
• Stoyanka Pencheva, mother of SIP beneficiary
• Antonya Gecheva, mother of SIP beneficiary
Meetings at (Segregated, Roma) Secondary School, Dimitar Gachev, town of
Pazardzhik
• Mariana Dimova, elementary school teacher
• Two Roma children (a girl and a boy) in third grade, beneficiaries of SIP summer
school
• Valeri Stoyanov, School Principal

103
• Pravets Municipality
Meeting at the Pravets Town Hall:
• Rumen Guninski, Mayor, Pravets Municipality
• Veselka Asenova, Head/Headmaster, Indira Gandhi Kindergarten
• Silvia Staneva, Head/Headmaster, Zdravets Kindergarten
• Snezhana Georgieva, Pravets Municipal Administration
• Galabila Tsvetanova, Pravets Municipal Administration, Senior Officer, Education,
Health Care, Social Services, Sports, and Tourism
• Albena Petrova, Municipal Secretary
• Tsonka Ivanova, Sociologist, Head of Foundation “Social Norms”
• Maya Pencheva, Manager, Center for Family Counseling and Support
• Deyan Dimitrov, School Principal, Primary School Vasil Levski, Village of Vidrare
(70 percent Roma students)
Meetings in Dzhurovo Village
• Three young Roma mothers and one Roma mother-to-be, beneficiaries of SIP
services slong with their young children
• A class with Roma-only students
• A mediator (female ethnic Bulgarian living among the Roma community)
• Ivanka Ivanova, School Principal, Primary School Hristo Botev (100 percent Roma
students)
• A primary school teacher, Primary School Hristo Botev
Meetings in the Village of Vidrare
• Preschool group of Roma-only children in a rehabilitated preschool facility
• Deyan Dimitrov, School Principal, Primary School Vasil Levski
Meetings in Center for Family Counseling and Support, Pravets
• Psychologist, delivering services under SIP
• Nutrition counseling session with eight Roma parents (seven women and one man)
and interview with the nurse, who is also a nutrition specialist
Nongovernmental Organizations
• Doriana Basamakova, Chief of Staff, Trust for Social Achievement (TSA)
• Sarah Perrine, Chief Executive Officer, TSA
• Vania Kaneva, Head of Proejcts and Advocacy, For Our Children Foundation
• Ilona Tomova, IPHS

104
• Deyan Kolev, Amalipe Center for Inter-Ethnic Dialogue and Tolerance, Veliko
Tarnovo, Bulgaria
• Mila Tashkova, National Network for Children
• Sasho Kovachev, Largo Association, Kyustendil
• Daniela Ushatova, Team Leader, Department of Municipal Services and Finances,
National Association of the Municipalities in Bulgaria
• Zina Yankova, Foundation for Tolerance and Solidarity, Haskovo
Research and Consulting
• Tsvetelina Stoyanova, Owner and Lead Researcher, Market LINKS Research and
Consulting, Sofia

105
World Bank
• Anthony Thompson, Country Manager, World Bank Country Office, Bulgaria
• Dessislava Kuznetsova, Education Specialist, World Bank Country Office, Bulgaria
• Valya Nikolaeva, former Procurement Specialist, World Bank Country Office,
Bulgaria
• Stella Ilieva, Senior Economist, Macroeconomics and Fiscal Management Global
Practice
• Eolina Milova, Senior Environmental Specialist/Acting Country Manager during
wrap-up, World Bank Country Office, Bulgaria
• Sylvia Stoynova, Operations Officer, World Bank Country Office, Bulgaria
• Peter Pojarski, SIP Task Team Leader (2009–12)
• Plamen Danchev, SIP Task Team Leader (2012 through project closing) (by e-mail
exchange)
Other Development Partners
UNICEF, Bulgaria
• Dessislava Encheva, Child Protection and Social Services Officer
• Maria Yankova-Mladenova, Education Officer (by e-mail exchange)
Swiss Agency for Development and Cooperation, Bulgaria
• Irina Faion, Team Leader, Program Management Unit, Health and Education for All


107
Appendix F. Borrower Comments
Bulgaria
Ministry of Labour and Social Policy
ISO 9001:2008 Certified Quality Management System
1051 Sofia, 2 Triaditza Str., Phone: 8119 443; Fax: 988 44 05,
www.mlsp.govrnment.bg
Outgoing ref.: 17-81
18.05.2018 To
Mr. Tony Thompson
Country Manager
The World Bank
Interpred ITC
36 Dragan Tzankov Blvd.
1040 Sofia
Copy: Mr. Vladislav Goranov
Minister of Finance
Subject: Draft report on the evaluation of implementation of the Social Inclusion Project
(funded with loan 7612-BG from the International Bank for Reconstruction and
Development [The World Bank] by the Independent Evaluation Group of the World Bank.
Honorable Mr. Thompson,
First of all let me express our gratitude for the excellent cooperation and support provided
by the World Bank during the implementation of the Social Inclusion Project (SIP). We
thank you for the draft report on the evaluation of the SIP implementation prepared by
the Independent Evaluation Group of the World Bank. On considering the conclusions
and recommendations therein, we would like to note the following:
As an overall impression from the report, we are extremely surprised by the substantially
reduced ratings of the work done on the implementation of the SIP (Performance ratings)
of the borrower (including the project implementation unit at the Ministry of Labour and
Social Policy (MLSP) – Social Inclusion Directorate [SID]) and of the World Bank, as
well as with the reduced rating of the outcomes of the SIP and with the upgraded risk for
achievement of the planned objectives of the SIP implementation. In the report on the
completion of implementation and on the SIP outcomes (dated July 22, 2016) the rating
of the borrower was ‘moderately satisfactory,’ whereas that of SID—‘satisfactory.’ In the
present report, prepared more than two years after the activities under the SIP ended, the
ratings of the borrower and SID have gone down by one grade without substantial
motives, respectively to “moderately unsatisfactory” and “moderately satisfactory.” In
case the justification for such an action is contained in paragraph 36 of the report, namely
the following text: “Both SID and the municipalities could have undertaken measures to
address the insufficient use of the capacity of NGOs and local community organizations
for establishing richer, more accurate baselines, identifying and quantifying target

108
groups and for activities for supply of services and raising awareness,” then we deem
this unacceptable. Our argumentation is as follows:
1. SID, respectively the MLSP, has no legal grounds whatsoever to intervene in any
way in the decision of beneficiary municipalities with respect to hiring of
contractors for supply of services under the SIP. In this connection, the authority
for selection of supplier of a particular service under the SIP is entirely with the
beneficiary municipality that carries out the relevant tender procedure under the
World Bank Rules. Any intervention in or influence on the free choice of
beneficiary municipalities on the part of SID does not correspond to the Rules for
the SIP implementation and the Bulgarian legislation.
2. On the data, MLSP is required to use and work with data that are officially
provided by the authorities responsible for the collection thereof. Exactly such
data were used in appointing beneficiary municipalities. MLSP has no mechanism
or authority to check the veracity of the data provided by private organizations –
nongovernmental organizations (NGOs) being such. Conversely, municipalities
are the ones that are required to assess the needs on their territories and they did
just that at the time of applications, and also during the practical implementation
of activities.
3. Setting of baseline values of indicators for measuring the outcomes of the SIP was
done following a public procurement procedure as per the World Bank Rules
based on terms of reference for the implementation of activities prepared by a
consultant of the World Bank and coordinated with the latter; in these very terms
of reference, in the section on the work methodology the possible sources of
information are given. “NGOs and local community-based organizations” are not
among the listed eligible sources of information for the purposes of the study. The
procurement itself was done by a consortium of companies specialized in
marketing surveys, analyses and forecasts and possessing the relevant experience
and qualification, and both the selection of contractor and the results of the
procurement were coordinated by the World Bank. As a result of the
implementation of the activities, the values of the SIP outcome indicators were
determined, and Supplementary Letter 2 to Loan No. 7612 BG was prepared, by
force of which the indicators for monitoring the SIP implementation were set.
We would like specifically to note the increased risk for the achievement of the set
objectives for the SIP implementation. In the current report, the risk is increased by two
grades, respectively from “Low to Insignificant” (set as of July 22, 2016 in the report on
the closing of the implementation and the outcomes of the SIP) to “Significant.” We
categorically cannot accept such a rating, all the more considering the following:
1. The SIP is a pilot project, and during its implementation the following basic
services were pilot-tested: “Early intervention in disabilities,” “Individual
pedagogical support for children with disabilities,” “Nurturing and promoting of
parenting skills,” “Family counseling and support,” “Additional pedagogical

109
support for equal start in school (summer schools),” as well as the “Health
counseling for children” service.
2. In view of the funding provided, a focus was placed on the services “Early
intervention in disabilities,” “Individual pedagogical support for children with
disabilities,” “Nurturing and promoting of parenting skills,” “Family counseling
and support” (as totally novel and unfamiliar activities then). For those services,
under the SIP, methodological guidelines for the provision of services were
prepared and provided to the beneficiaries, and trainings of suppliers of these
services and of medical staff employed at maternity wards and working directly
with babies and young children with disabilities took place, for the
implementation of new approaches in telling parents about the disability of the
child and for encouraging raising of children in a family environment.
3. The successful implementation of the SIP promoted the development and
affirmation of the concept of the importance of early childhood development
services as an integral part of the overall policies for children and families. In this
connection and for the purpose of sustaining the operation of the services
established under the SIP, the operation BG05M9OP001-2.004 Early Childhood
Development Services was launched under the 2014-2020 Human Resources
Development Operational Program (HRD OP). The operation allowed all
beneficiary municipalities under the SIP to obtain funding to continue the
operation of introduced services until 31.12.2019, the budget of the operation
being BGN 30,000,000.
4. Recognizing that early childhood is an especially significant period for the child
with crucial impact for his/her further development and success, the development
of innovative and integrated early childhood development services is among the
main priorities for Bulgaria, including in the context of the Presidency of the
Council of the EU. Therefore the updated Action Plan for the Implementation of
the National Strategy ‘Vision for Deinstitutionalization of Children in Bulgaria’
adopted with Resolution of the Council of Ministers (CoM) 859/13.10.2016, as
part of the measures for providing social and integrated services for family-based
early intervention and prevention, expansion of early childhood development
(ECD) services is envisioned on a national scale, building on the activities of the
Centers for Community Support (CCS) through an ECD program including the
mandatory activities in accordance with the already existing SIP services
‘Nurturing and promoting of parenting skills,’ (NPPS), ‘Family counseling and
support’ (FCS) and ‘Health Counseling’ (HC). The program will be one of the
programs applied at the CCS as part of the reform of this social service, including
a targeted program for prevention of abandonment and separation of children and
families. The plan provides for upscaling of services for early intervention in
disabilities and individual pedagogical support for children with disabilities
nationally by building on the day centers for children with disabilities (DCCD)
and the centers for social rehabilitation of children with disabilities (CSRCD) via
a program including the mandatory activities in accordance with the already

110
existing SIP services “Early intervention in disabilities” (EI) and “Individual
pedagogical support for children with disabilities” (IPS).
5. As of date, the Social Assistance Agency has undertaken steps to update the
methodological guidelines for the CCS social service, in accordance with the
measures for reforming the service, under the updated Action Plan for the
Implementation of the National Strategy “Vision for Deinstitutionalization of
Children in Bulgaria,” and more specifically the inclusion of an ECD Program
that includes the mandatory activities in accordance with the already existing
services under the SIP: NPPS, FCS, and HC. Work will be starting on updating of
the methodological guidelines for supply of social services DCCD and CSRCD,
respectively with the inclusion of a Program for early intervention in disabilities
with the mandatory activities corresponding to the ones already introduced under
the SIP – EI and IPS. In the updating of those methodological guidelines, the
methodological guidelines developed under the SIP for EI and IPS, NPPS and
FCS will be taken into consideration.
6. By force of Resolution 277 from April 24, 2018 of the CoM of the Bulgaria
standards for state-delegated activities in 2019 in terms of quantities and values
were adopted. Envisioned are standards for the services DCCD (with a program
for EI in disabilities), Center for Social Rehabilitation and Integration of Children
with Disabilities (with a program for EI in disabilities), and Center for
Community Support/Community Center for Children and Families. In this way,
on a national scale, all municipalities providing the said services, in 2019 will be
able to get funding under state-delegated activities arrangements, including
municipalities that finish the implementation of projects under the
BG05M9OP001-2.004 operation “Early Childhood Development Services” (that
is, former SIP beneficiary municipalities).
In view of the foregoing, we believe that we fulfilled to a complete extent the
commitments undertaken with the SIP implementation, and as of the moment there is no
practical risk of failure to accomplish the set objectives for the implementation of the
SIP. On the one hand, the services introduced and pilot-tested under the SIP were
assessed as necessary, and there is both agreement and desire on the part of
municipalities for a national rollout. On the other hand, state funding is provided for the
services which guarantees that they become part of national policies and priorities. In
addition, securing sustainability of services and policies is done by the government under
our national rules for funding and organizing of the system. Funding from the state is not
provided under a temporary program; on the contrary – this is done through a much more
robust instrument in terms of recognizing the national significance of these services and
ascertaining them as a lasting and permanent commitment matched with clearly allocated
and approved funding by the CoM. Therefore for us it is not clear on the basis of what the
risk for the implementation of the objectives of the SIP was raised to “Significant” where
no such risk exists.
In light of the above, we believe that the information in the Summary of the report on
“Significant” financial risk due to “nonconfirmed state financing of a program covering

111
the entire country, until the end of 2018 (when the EU funding stops)” is not true, for as
early as at the time of adoption of the updated Action Plan for the Implementation of the
National Strategy “Vision for Deinstitutionalization of Children in Bulgaria” in October
2016 the state undertook to roll out nationally the services created under the SIP and to
have those financed from the state budget after the end of the EU funding, that is, from
2019. This information was provided to the evaluation team too.
We would like to note some other more significant inconsistencies in the report:
7. In paragraph 39 there is incorrect information that the centralized public
procurement procedures for construction works proved to be efficient. Under the
SIP not a single centralized public procurement procedure for construction works
was carried out. All public procurement for works under the SIP was conducted
by beneficiary municipalities. SID engaged solely in ex-ante control.
8. The statement in paragraph 54 of the report that ‘the extent to which the services
created under the SIP were provided in an equitable way (reaching out to the
planned target groups, most of them in need) is not clear’ is not based on any
evidence. [The paragraph] reads that ‘despite the set values of the indicators for
the number of beneficiaries for the various services have been exceeded, there is
no breakdown of beneficiaries, to indicate what share of these are from the target
groups of the SIP. There is no indication how many of them are low-income
and/or marginalized.’ We would like to stress that beneficiaries under the SIP
services have been solely from the target groups of the SIP, those, however, not
being confined only to ‘persons with low income and/or marginalized.’ Neither
was there a special focus on a specific part of target groups, therefore no
breakdown of beneficiaries was necessary. We believe that such a statement may
imply that beneficiary municipalities (as sources of the data for the indicators)
have engaged in ineligible expenses under their projects, the evaluation team
failing to give any reasoning or proof for this.
Under the SIP, the target groups eligible for funding are defined in a clear and detailed
way:
1. Target groups of children at risk (0–7) – children from vulnerable ethnic groups,
Roma community in particular; children with unemployed parents; children with
parents on social welfare; children without a family doctor (GP), or whose doctor
is not a pediatrician; children whose parents have no health insurance; children
not attending kindergarten or alternative childcare; children whose parents do not
provide adequate care; children with disabilities; children with health issues.
• Target groups of parents (of children from 0 to 7) – parents from vulnerable
ethnic groups, Roma community in particular; parents on social welfare;
unemployed parents; parents of three or more children; single parents; expecting
parents from vulnerable groups; parents (primarily mothers) in high-risk age
groups; parents of children with disabilities; parents of children with health
issues; parents of children in high risk (developmental delays and so on.); parents

112
with no health insurance; parents who do not provide adequate care of their
children; parents with no education or with low education; parents in poor
housing conditions.
In this connection, all persons who fall in the above target groups are eligible
beneficiaries for the services under the SIP, and not just those with low income and/or
from marginalized groups. Moreover, the very nature of services predetermines target
groups.
2. Paragraph 89 contains information that “under HRD OP the financing indicators
were further reduced basically to two: number of beneficiaries; and number of
service providers.” It should be noted that the set indicators are as per the ones
prescribed in the HRD OP and the definitions approved by the European
Commission, with the exception of one specific indicator that is directly related
with the objectives of the scheme and measures particular outcomes. The target
group under the scheme for grant financing under HRD OP is: ‘Families with
children between 0 and 7, including with disabilities; Children 0–7 at risk and
their families; Children 0–7, including with disabilities, placed in specialized
institutions and their families; Children and adults at risk.’ The target group thus
defined does not rule out the Roma community by virtue of ethnicity. The
‘disability’ factor makes it much broader, and the ‘at risk’ factor renders the
concept even wider. The application guidelines for the operation BG05M9OP001-
2.004 Early Childhood Development Services lists in detail target groups, in the
same way as they are specified under the SIP.
On the comment in paragraph 45 of the report in connection with introducing
kindergarten and crèche fee reliefs that “there are reductions in the fees preceding the
project, and there is no evidence of further reliefs under the project,” we would like to
note that no funds from the SIP were used for payment of kindergarten and crèche fees,
since as early as prior to the application process it was established that municipalities
have already introduced reliefs locally. Those reliefs are adopted by the relevant
municipal councils.
We would like to point out that, in view of the pilot nature of the SIP, coupled with the
limited amount of funding for it, the project support for introducing a nationwide school
readiness program was confined to the pilot testing of a set of integrated measures for
ECD for children up to age seven and their parents focusing on prevention of dropping
out of school and on leveling out school readiness, including services for EI in
disabilities. The following must to be taken into consideration however: the SIP was
approved back in 2008; now it is 2018. Over those 10 years the policy of ECD and school
readiness underwent major reforms. One such reform, further to the amendments of the
repealed Public Education Act effective from October 5, 2010 was the introduction of
mandatory two-year preschool education before first grade, but not earlier than the year
in which the child turns five. For children with poor Bulgarian language skills, the
preschool education includes also teaching of Bulgarian language as per specialized

113
methodology. Under the Preschool and School Education Act (in force from 01.08.2016),
preschool education is mandatory from the school year beginning in the calendar year in
which the child turns five. Parents may choose from the alternative forms of preschooling
under Art. 67 – whole-day schooling, half-day schooling, hourly or individual
arrangements, according to the preference of parents as per the terms and conditions in
the State Education Standard for Preschool Education. The state and municipalities are
required to guarantee coverage of children in kindergartens and preschool groups in
schools. Art. 16 of the said act mandates the provision of additional conditions for
children with non-Bulgarian mother tongue, for acquiring command of the language and
for better integration in the education system, as per the terms and conditions in the State
Education Standard for Bulgarian Language.
Some of the key political priorities of the government for 2017–21 are enlargement of the
coverage of 5- and 6-year-olds in the mandatory preschool education from the age of 4;
mandatory Bulgarian language training for children with non-Bulgarian mother tongue;
measures to promote inclusive education and individual development for each child,
including early assessment of possible risk of learning/educational difficulties; extra
modules in kindergartens for children not speaking Bulgarian; improvement of the
efficiency of interaction with parents from vulnerable communities – project under the
national program ‘Together for Every Child’ which includes activities for interaction
with parents, nurturing positive attitude in parents toward the education of their children,
and improving the child-raising skills of families.
Bulgaria in a purposeful and targeted way uses also the support of EU Structural Funds
for improving the care for children with a special focus on improving early childhood
development services and providing equal access to preschool education for
disadvantaged children. Under HRD OP, primarily measures for integrated services are
funded, as well as all services for deinstitutionalization, whereas Science and Education
for Smart Growth OP finances measures for improving the access to and quality of
preschool education, including through additional work with children with non-Bulgarian
mother tongue, involvement of parents, promoting motivation of children and parents,
overcoming negative attitudes, and so on.
The foregoing clearly shows that our policy agenda is far beyond and above the
objectives of the SIP. The reforms effected to date have been exactly to promote school
readiness, as codified by law.
We use again this opportunity to express once more our gratitude for the extremely
productive cooperation and support the IBRD team involved with the SIP has provided
throughout the course of the project implementation which is of substantial importance
for the results achieved.
18.05.2018
/signed, illegible/
Bisser Petkov

114
Minister of Labour and Social Policy
Round stamp: Ministry of Labour and Social
Policy, Bulgaria
Square stamp: True Copy of Electronically
Signed Original /signed, illegible/

115
MR. RASMUS HELTBERG
ACTING MANAGER
HUMAN DEVELOPMENT AND CORPORATE EVALUATIONS
INDEPENDENT EVALUATION GROUP
THE WORLD BANK
DEAR MR. HELTBERG,
Re: Bulgaria: Social Inclusion Project (IBRD Loan 76120) Draft Project Performance
Assessment Report/
Thank you for sharing with us the Independent Evaluation Group’s (IEG) draft Project
Performance Assessment Report (PPAR) of the Social Inclusion Project and/or the efforts
of the IEG to prepare an assessment of the project, financed via an IBRD loan in the
period 2009–15. Trying to evaluate the such operations is an important but challenging
task.
Since the project was implemented and the loan administered by the Ministry of Labour
and Social Policy, which is in charge also of the main policies the project was oriented
toward, its comments on the draft report are instrumental.
On behalf of the Ministry of Finance I would like to share some general observations and
comments:
In assessing the outcomes of the above operation it is important to take into account that;
1. The project was designed as a pilot for the first EU Operational Programmes
(OPS) in Bulgaria (the World Bank identification mission took place in the
autumn of 2006), but was launched simultaneously with the OPS, although its
actual start was immediately and directly affected by the economic downturn,
Bulgaria experienced hardest in 2009 (the loan agreement was signed in
November 2008 and became effective in April 2009). The availability of ELI
grant financing the use of which is naturally prioritized to other sources,
combined with the need fiscal restrictions, affecting the loan-financed operations,
makes it difficult to assess the project as a stand-alone operation, The initial

116
project design had to be adapted to the changed circumstances from the very
beginning (to avoid duplication and ensure consistency with the EU financing)
and further on during the project implementation, The operation should be given
credit for the fact that despite the challenges it ensured consistency and follow-up.
2. In regard to the Project monitoring and evaluation framework it should be noted
that due to the fact that the original project design envisaged impact evaluation,
(here was no formal agreement on the project monitoring indicators at the
moment of the signing of the loan agreement; no signed Supplemental Letter 2).
The respective letter was Signed by the Bulgarian Side on September 23, 2013,
became effective November 18, 2013, and has not amended hereafter.
3. The draft report mentions, inter alia, “Government of Bulgaria’s reluctance to use
IBRD loans for studies, research, consulting, technical assistance and training,” as
well as that the “Joint (World Bank-Government of Bulgaria) portfolio reviews
(JPR) conducted regularly in Sofia for all projects under implementation were
characterized by the Government of Bulgaria’s efforts to review planned activities
and eliminate those related to research, studies, training, consulting and technical
assistance.” It should be noted that the JPRs were a format for quarterly project
implementation stocktaking, involving meetings between the World Bank and the
respective counterparts on the Bulgarian side. The meetings results were recorded
in a matrix reflecting the implementation progress and the actions for the next
periods, outlined by the project implementing agencies and the respective World
Bank. These reviews neither had intention nor were meant to invoke or authorize
elimination of project activities. As for the reluctance to use IBRD loans for
consulting services—the Ministry of Finance has always appealed for durable
capacity building in the implementing agencies and project designs that contribute
to retaining and using the knowledge, the expertise, and the staff involved in the
project implementation with the executing agencies. In this sense and given the
need (or effective use of the available resources), as well as for their proper
prioritization, giving preference to grant and internal resources and looking for
value-added from loan-financed operations has always been among our goals.
4. In respect of certain references in the report: We would appreciate your efforts in
refraining from references to information qualified as anecdotal in the PPAR.
Also while other World Bank–financed research in Bulgaria (more specifically
the 2017 World Bank impact evaluation Supporting Disadvantaged Children to
Enter Kindergarten: Experimental Evidence Bulgaria, based on the impact of a
Springboard for School Readiness program) might be useful, we would caution on
differences in substance and scope, which may render findings not entirely
relevant to the assessment of the Social Inclusion Project.
We hope above comments to be helpful in finalizing the
Sincerely yours,

117
MARINELA PETROVA
DEPUTY MINISTER OF FINANCE
Mr. Frank I-leemskerk
Executive
Director
The World
Bank
Mr. Biser Petkov
Minister of Labour and Social Policy
Mr. Antony Thompson
Country Manager
The World Bank Bulgaria Country Office