THE COSTS OF SUBURBAN SPRAWL AND URBAN DECAY IN RHODE ISLAND

Title: Dense Downtown vs. Suburban Dispersed: A Pilot Study on UrbanSustainability
Authors: Antony Wood, Executive Director, Council on Tall Buildings and Urban HabitatPeng Du, Academic Coordinator, Council on Tall Buildings and Urban Habitat
Subjects: Sustainability/Green/EnergyUrban DesignUrban Infrastructure/Transport
Keywords: DensityEnergy ConsumptionInfrastructureTransportationUrban Planning
Publication Date: 2016
Original Publication: Cities to Megacities: Shaping Dense Vertical Urbanism
Paper Type: 1. Book chapter/Part chapter2. Journal paper3. Conference proceeding4. Unpublished conference paper5. Magazine article6. Unpublished
© Council on Tall Buildings and Urban Habitat / Antony Wood; Peng Du
ctbuh.org/papers

34 Rethinking the City | 反思城市
Background to This Study: Urbanization and the Density Debate
Against the backdrop of United Nations statistics indicating 187,000 people urbanizing on the planet every day1, the accommodation of these 2.4 billion new urban dwellers over the next 35 years is one of the key issues that need to be addressed in considering the continued existence of the human race on this planet. Over the past decade or so, it has become widely believed that these one million new urban dwellers every week would be more sustainably accommodated through the densification of city centers rather than through the spread of suburban low-rise ‘sprawl’. The concentration of people in denser cities — sharing land, space, infrastructure, and facilities — is typically thought to offer greater energy efficiency than the expanded
Dense Downtown vs. Suburban Dispersed: A Pilot Study on Urban Sustainability
This paper presents the initial findings of a ground-breaking two-year CTBUH-funded research project investigating the real environmental and social sustainability of people’s lifestyles in a number of high-rise residential towers in downtown Chicago, and a comparable number of low rise homes in suburban Oak Park, Chicago – based on actual energy bills and other real data. The study is ground-breaking because, to date, similar studies have been mostly based on very large data sets of generalized data regarding whole-city energy consumption, or large-scale transport patterns, which often misses important nuances. This study has thus prioritized quality of real data (based on around 250 households in both high rise and low rise case studies), over quantity. In both urban and suburban cases, the following factors have been assessed: (i) home operational energy use, (ii) embodied energy of the dwelling, (iii) home water consumption, (iv) mobility and transport movements, (v) urban/suburban Infrastructure, and (vi) quality of life. The full results of this seminal study will be published in the form of a CTBUH Research Report publication in 2017. Presented below is an overview of the initial (and, currently, unverified) findings of the research, together with the limitations of the study that should be taken into account, as well as future plans for developing this important pilot study.
Keywords: Sustainability, Energy, Infrastructure, Density, High-Rise Buildings
本论文呈现的研究初步成果来自于CTBUH资助的开拓性研究项目,该项目为期两年,基于大量的芝加哥市中心的高层住宅及相对应数量的芝加哥郊区橡树公园的低层住宅,通过采集能源账单和其它真实数据,研究人们日常生活中真实的物质环境和社交活动的可持续性发展。这项研究是开拓性的,因为到目前为止,相似的研究都是基于整个城市能源使用量、大规模交通模式的拥有超大数据集的广义数据,因而容易忽略重要的微观差别。本研究把真实数据的质量放在第一位,质量优先于数量(本研究所调查的高层住宅组和低层住宅组各有250个左右的案例)。在城市和郊区两组的案例中,综合评定了下列参数:(i)家庭运行能源消耗(ii)住房内含能源(iii)家庭用水消耗(iv)通勤交通活动(v)城市的/郊区的基础设施,以及(vi)生活质量。这项开创性的完整研究成果将在2017年出版的《CTBUH研究报告》中呈现。本文的内容是介绍这项研究的初步成果(目前未经验证)、研究过程中需要考虑的限制条件以及这项初探研究未来的发展计划。
关键词: 可持续发展, 能源, 基础设施, 密度, 高层建筑
Abstract | 摘要Antony Wood | 安东尼•伍德
Executive Director | 执行理事长 Council on Tall Buildings and Urban Habitat 世界高层建筑与都市人居学会
Dr. Antony Wood has been Executive Director of the Council on Tall Buildings and Urban Habitat since 2006, responsible for the day-to-day running of the Council. Based in Chicago, Antony is also a Research Professor in the College of Architecture at the Illinois Institute of Technology, where he convenes various tall building design studios. His field of speciality is the design, and in particular the sustainable design, of tall buildings. Prior to moving to Chicago, he worked as an architect in Hong Kong, Bangkok, Jakarta, Kuala Lumpur and London. His PhD explored the multi-disciplinary aspects of skybridge connections between tall buildings.
安东尼•伍德博士,自2006年起就任世界高层建筑与都市人居学会执行理事长,负责学会的日常运作,学会总部位于芝加哥。安东尼博士也是伊利诺伊理工大学建筑学院建筑研究教授,并负责管理多个高层建筑设计课程。其专业领域是高层建筑设计,尤其是高层建筑的可持续设计。到芝加哥前,他曾在香港、曼谷、雅加达、吉隆坡和伦敦等地任建筑师,他的博士论文从多个学科的角度探讨了摩天大楼之间的空中廊桥连接问题。
密集的市中心和分散化的郊区:城市可持续发展的初探研究
研究背景:城市化和城市密度的论述
联合国统计数据显示,城市化使得每天有将近18.7万的新增城市人口1,在未来35年里还会增加24亿。考虑到地球上人口数日益增多,这些新增城市人口是一个亟需解决的重要问题。过去的十年里,人们普遍相信每周新增1百万的城市人口居住在密集的城市中心,比居住在不断蔓延的低密度郊区更加可持续化。在高密度城市中人口集中——分享土地,空间,基础设施,公共设施——比水平扩散的城市能源使用效率更高,后者在基础设施建设和城市通勤上需要使用更多的土地,需要消耗更多能源(造成更多污染)。因此人们广泛认为,“垂直城市”比“分散的水平城市”更加可持续化,这个概念毫无疑问是过去二十年全球高层建筑建设热潮中的重要推手,尤其是在发展中国家(图1)。
Peng Du | 杜鹏
Academic Coordinator | 学术协调人 Council on Tall Buildings and Urban Habitat 世界高层建筑与都市人居学会
Dr. Peng Du is currently Academic Coordinator at CTBUH, and Visiting Assistant Professor in the College of Architecture, IIT. He has been involved in teaching and coordinating numerous design studios and seminars on tall buildings and sustainable cities, as well as developing proposed/on-going research projects. Dr. Du has been also serving on the jury of the CTBUH international design and research funding competitions and peer-reviewer of multiple high-quality SCI indexing research journals, such as Energies, Sustainability, Buildings, etc.
杜鹏博士现任CTBUH学术协调人和伊利诺伊理工大学建筑学院访问助理教授。他参与过许多与高层建筑和可持续城市相关的设计课程及研讨课的教学和协调工作,同时他还一直发展研究课题申报方案并承担正在进行中的研究课题。杜博士还担任过多个CTBUH全球设计与研究基金竞赛的评委,同时还担任多个高水准SCI检索研究期刊的同行评审员,其中包括:《Energies》、《Sustainability》和《Buildings》等。
Research Professor | 研究教授 Illinois Institute of Technology | 伊利诺伊理工大学 Visiting Professor of Tall Buildings| 高层建筑方向访问教授 Tongji University | 同济大学 Chicago, USA | 芝加哥,美国
Visiting Assistant Professor | 访问助理教授 Illinois Institute of Technology | 伊利诺伊理工大学 Chicago, USA | 芝加哥,美国
CTBUH Research ProjectCTBUH研究项目
Supported By | 支持单位:
Volume 1 and 2 book.indb 34 9/12/2016 7:52:41 PM

CTBUH 2016 Shenzhen · Guangzhou · Hong Kong Conference | 2016年CTBUH深圳 · 广州 · 香港国际会议 35
1: This urbanization is due to three predominant factors: (i) general population growth, forecasted by United Nations to increase from 7.2 billion in 2014 to 9.6 billion globally by 2050; (ii) the movement of people from countryside to city, motivated by an expectation of higher economic opportunity and quality of life; and (iii) the birth of more people in those cities. The latest reports from the United Nations estimates an annual global urbanized population increase of 68.3 million per year, which equates to a weekly rate of almost 1.3 million, a daily rate of around 187,000, and a total urban population increase of 2.4 billion by 2050. Source: United Nations, Department of Economic and Social Affairs, Population Division, (2015). World Urbanization Prospects, The 2014 Revision: Highlights. [online] Available at: https://esa.un.org/unpd/wup/Publications/Files/WUP2014-Highlights.pdf [Accessed 24 Jul. 2016]1: 城市化有三大主要因素:(i)总人口增长,联合国公布全球人口将从2014年的72亿增长到2050年的96亿;(ii)人向往更好的经济机会和更高的生活品质,从乡村流向城市;(iii)城市中出生人口更多。最新的联合国报告测算出全球人口每年增长约6830万,也就是说每周增加约130万,每天增加约18.7万。到2050年全球城市增加的总人口是24亿。来源:联合国经济及社会理事会人口事务部(2015)。全球城市化发展报告,2014修订版:提纲。网址:https://esa.un.org/unpd/wup/Publications/Files/WUP2014-Highlights.pdf[2016.6.24访问]
horizontal city, which requires more land usage as well as a higher energy expenditure (and pollution creation) in both infrastructure and mobility. It has thus become widely assumed that the “dense vertical” city is more sustainable than the “dispersed horizontal” city and this concept has certainly become a large factor in the unprecedented increase in the construction of tall buildings globally over the last two decades, especially in the developing world (see Figure 1).
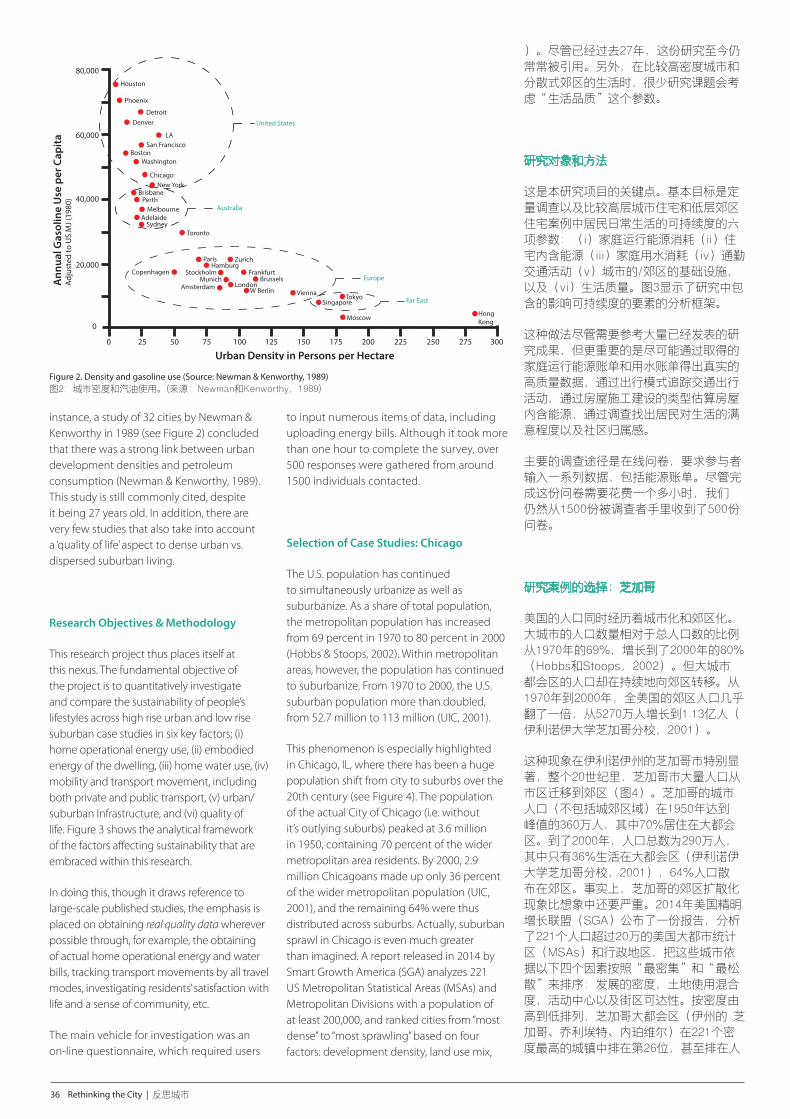
Though this belief in the sustainability benefits of ‘dense’ versus ‘dispersed’ living is driving the development of many cities across the world, the principle has rarely been examined at a detailed, quantitative level. Studies to date have been mostly generic, based on large data sets of generalized data regarding whole-urban energy consumption, or large-scale transport patterns. In some cases, seminal studies are still informing policy that are now several decades out of date. For
尽管在全世界范围内,关于可持续发展上“高密度”优于“分散化”的信条驱动了很多城市的发展,但是该理论却罕有微观层面定量数据的支持。迄今为止的研究大部分是定性分析,基于整个城市能源使用量、大规模交通模式的拥有超大数据集的广义数据。一些研究案例还在引用几十年前的成果。比如,Newman和Kenworthy在1989年通过研究32个城市总结出城市发展密度和石油消耗量之间有强烈的联系(Newman和Kenworthy,1989)(图2
Figure 1. Tall buildings completed (and the Total Number in Existence) each year, over 200m, 300m and 600m from 1968, (as of Jan 2016) – showing the unprecedented increase in tall building construction over the last decade or two – driven largely by increasing population growth and urbanization, and the belief in dense high-rise development being more sustainable than dispersed low-rise development (Source: Council on Tall Buildings and Urban Habitat)图1:自1968年以来每年完成的200m、300m和600m高度的高层建筑数量(以及现有高层建筑的总数)。截止2016年1月,过去十至二十年间前所未有的高层建筑建设增长,其驱动力很大程度是人口增长和城市化,以及坚信高密度的高层建筑比分散化的低层建筑在更加可持续化的观念。(来源:世界高层建筑与都市人居学会)
Notes: 1. We can predict 2016–2017 building completions with some accuracy
due to projects now in advanced construction. A range is given to indicate the challenging factors in predicting building completion dates.
2. Totals after 2001 take into account the destruction of the World Trade Center Towers 1 and 2.
注释:1. 由于正在施工的建筑的工期基本能被确定,因此我们能够较准确
的估计2015-2016年即将建成的建筑数量。但考虑到一些不确定性因素会影响建筑最终的建成时间,所以我们给出了一个建成数量的范围值以供参考。
2. 自2001年之后,200米以上建筑的总数量都不包含被撞毁的世贸中心1号塔与2号塔
0
20
40
60
80
100
Num
ber o
f bui
ldin
gs 2
00 m
+ co
mpl
eted
eac
h ye
ar
10
30
50
70
90
110
120
130
140
1960
1
1963
2
1964
1
1967
2
1968
1
1971
2
1975
4
1976
4
1977
3
1978
3
1979
2
1980
3
1981
3
1984
7
1985
6
1986
9
1987
6
1988
6
1991
14
1994
5
1995
1
1969
3
1
1973
6
1
1974
6
1
1982
5
1
1983
11
1
1989
8
1
1990
15
3
1993
6
1996
10
2
1997
13
2
1998
17
3
1999
13
220
00
23
2
2001
22
1
2002
17
1
2003
31
1
2004
18
1
2005
31
1
2007
31
3
2008
47
4
2009
50
3
2011
80
9
1970
3
2006
27
2
1972
8
1992
19
2010
73
9
1
2014
2013
74
1966
1965
1962
1961
2012
1
69
1
9
1
2015
18
27
135
8
11
2016
140
110
2
2017
106
13
99
15
25
115
2 6 11 11 15
1920 1930 1940 1950 1960 1970 1980 1990 2000 2010 20110
100
200
300
400
500
600
700
800
900
2012 2013 2014
1,000
144
11
69
5283
265
24
612
50
692
59
761
67 76
835
87
934
21 2 21
2015
3 3
1,040
1,100
100
1,200
1,150
1,182
118
127
2016
Number of 200 m+ buildings Projected number of 200 m+ buildings
Number of supertalls (300 m+) Projected number of supertalls (300 m+)
Number of megatalls (600 m+) Projected number of megatalls (600 m+)
200米以上建筑数量 预计的200米以上建筑数量
超高层建筑 (300米以上) 数量 预计的超高层建筑(300米以上)数量
巨型高层建筑(600米以上)数量 预计的巨型高层建筑(600米以上)数量
1920年至2015年 每10年内200米以上建筑总数
1960年至2017年每年竣工的200米以上高层建筑
Total Number of 200 m+ Buildings in Existence in Each Decade from 1920 to 2015
Buildings 200 Meters or Taller Completed Each Year from 1960 to 2017
Volume 1 and 2 book.indb 35 9/12/2016 7:52:41 PM
36 Rethinking the City | 反思城市
instance, a study of 32 cities by Newman & Kenworthy in 1989 (see Figure 2) concluded that there was a strong link between urban development densities and petroleum consumption (Newman & Kenworthy, 1989). This study is still commonly cited, despite it being 27 years old. In addition, there are very few studies that also take into account a ‘quality of life’ aspect to dense urban vs. dispersed suburban living.
Research Objectives & Methodology
This research project thus places itself at this nexus. The fundamental objective of the project is to quantitatively investigate and compare the sustainability of people’s lifestyles across high rise urban and low rise suburban case studies in six key factors; (i) home operational energy use, (ii) embodied energy of the dwelling, (iii) home water use, (iv) mobility and transport movement, including both private and public transport, (v) urban/suburban Infrastructure, and (vi) quality of life. Figure 3 shows the analytical framework of the factors affecting sustainability that are embraced within this research.
In doing this, though it draws reference to large-scale published studies, the emphasis is placed on obtaining real quality data wherever possible through, for example, the obtaining of actual home operational energy and water bills, tracking transport movements by all travel modes, investigating residents’ satisfaction with life and a sense of community, etc.
The main vehicle for investigation was an on-line questionnaire, which required users
to input numerous items of data, including uploading energy bills. Although it took more than one hour to complete the survey, over 500 responses were gathered from around 1500 individuals contacted.
Selection of Case Studies: Chicago
The U.S. population has continued to simultaneously urbanize as well as suburbanize. As a share of total population, the metropolitan population has increased from 69 percent in 1970 to 80 percent in 2000 (Hobbs & Stoops, 2002). Within metropolitan areas, however, the population has continued to suburbanize. From 1970 to 2000, the U.S. suburban population more than doubled, from 52.7 million to 113 million (UIC, 2001).
This phenomenon is especially highlighted in Chicago, IL, where there has been a huge population shift from city to suburbs over the 20th century (see Figure 4). The population of the actual City of Chicago (i.e. without it’s outlying suburbs) peaked at 3.6 million in 1950, containing 70 percent of the wider metropolitan area residents. By 2000, 2.9 million Chicagoans made up only 36 percent of the wider metropolitan population (UIC, 2001), and the remaining 64% were thus distributed across suburbs. Actually, suburban sprawl in Chicago is even much greater than imagined. A report released in 2014 by Smart Growth America (SGA) analyzes 221 US Metropolitan Statistical Areas (MSAs) and Metropolitan Divisions with a population of at least 200,000, and ranked cities from “most dense” to “most sprawling” based on four factors: development density, land use mix,
0 25 50 75 100 125 175 200 225 250 275 300
0
20,000
40,000
60,000
80,000
Ann
ual G
asol
ine
Use
per
Cap
itaAd
just
ed to
US
MJ (
1980
)
Urban Density in Persons per HectareChart showing how density elevates car use reduces
Houston
Phoenix
DetroitDenver
San FranciscoLA
BostonWashington
ChicagoNew York
BrisbanePerth
MelbourneAdelaide
SydneyToronto
Paris ZurichHamburg
Copenhagen Stockholm FrankfurtMunich
Amsterdam LondonBrussels
W Berlin Vienna TokyoSingapore
Moscow Hong Kong
Europe
Far East
Australia
United States
150
Figure 2. Density and gasoline use (Source: Newman & Kenworthy, 1989) 图2:城市密度和汽油使用。(来源:Newman和Kenworthy,1989)
)。尽管已经过去27年,这份研究至今仍常常被引用。另外,在比较高密度城市和分散式郊区的生活时,很少研究课题会考虑“生活品质”这个参数。
研究对象和方法
这是本研究项目的关键点。基本目标是定量调查以及比较高层城市住宅和低层郊区住宅案例中居民日常生活的可持续度的六项参数:(i)家庭运行能源消耗(ii)住宅内含能源(iii)家庭用水消耗(iv)通勤交通活动(v)城市的/郊区的基础设施,以及(vi)生活质量。图3显示了研究中包含的影响可持续度的要素的分析框架。
这种做法尽管需要参考大量已经发表的研究成果,但更重要的是尽可能通过取得的家庭运行能源账单和用水账单得出真实的高质量数据,通过出行模式追踪交通出行活动,通过房屋施工建设的类型估算房屋内含能源,通过调查找出居民对生活的满意程度以及社区归属感。
主要的调查途径是在线问卷,要求参与者输入一系列数据,包括能源账单。尽管完成这份问卷需要花费一个多小时,我们仍然从1500份被调查者手里收到了500份问卷。
研究案例的选择:芝加哥
美国的人口同时经历着城市化和郊区化。大城市的人口数量相对于总人口数的比例从1970年的69%,增长到了2000年的80%(Hobbs和Stoops,2002)。但大城市都会区的人口却在持续地向郊区转移。从1970年到2000年,全美国的郊区人口几乎翻了一倍,从5270万人增长到1.13亿人(伊利诺伊大学芝加哥分校,2001)。
这种现象在伊利诺伊州的芝加哥市特别显著,整个20世纪里,芝加哥市大量人口从市区迁移到郊区(图4)。芝加哥的城市人口(不包括城郊区域)在1950年达到峰值的360万人,其中70%居住在大都会区。到了2000年,人口总数为290万人,其中只有36%生活在大都会区(伊利诺伊大学芝加哥分校,2001),64%人口散布在郊区。事实上,芝加哥的郊区扩散化现象比想象中还要严重。2014年美国精明增长联盟(SGA)公布了一份报告,分析了221个人口超过20万的美国大都市统计区(MSAs)和行政地区,把这些城市依据以下四个因素按照“最密集”和“最松散”来排序:发展的密度,土地使用混合度,活动中心以及街区可达性。按密度由高到低排列,芝加哥大都会区(伊州的 芝加哥、乔利埃特、内珀维尔)在221个密度最高的城镇中排在第26位,甚至排在人
Volume 1 and 2 book.indb 36 9/12/2016 7:52:41 PM

CTBUH 2016 Shenzhen · Guangzhou · Hong Kong Conference | 2016年CTBUH深圳 · 广州 · 香港国际会议 37
Social
Environmental
Sustainability
Satisfaction with Life Scale (SWLS)
Overall Residential Environment
Sense of Community Index (SCI)
Urban/Suburban Infrastructure Measurement
Road Network
Electricity Supply
Gas Supply
Water Supply
Travel
Safety
Social Interaction
Accessibility
Assessment of
DowntownHigh-Rise
vs.SuburbanLow-Rise
Living
Home Water Consumption
Home Energy Consumption
Building
Operational Energy(OE)
Embodied Energy(EE)
Quality of Life(QoL)
Private Automobile
Travel Behavior Public Transport
Walking/Bicycling/Other
Figure 3. Analytical framework of the factors embraced in this study (Source: By Authors) 图3:研究包含的各个要素组成的分析框架。(来源:作者)
Figure 4. Developed land in Chicago, 1900, 1950 & 2005 (Source: CMAP, 2010, p. 66) 图4:1900、1950、2005芝加哥已开发土地。(来源:芝加哥都会规划部(CMAP), 2010, p. 66)
activity centering, and street accessibility. Chicago MSA (Chicago-Joliet-Naperville, IL) was ranked 26th out of 221 on the densest cities and towns list, placed even lower than Los Angeles, which has been widely considered as one of the most sprawling cities in the country (SGA, 2014).
Chicago is thus well positioned for a study exploring density vs. sprawl from a sustainability point of view. In addition, being the birthplace of the tall building and one of the main crucibles for experimentation in the typology in the century or more since then, Chicago is perfect for a study focused on urban density and tall buildings. In line
们普遍认为最松散的城市之一洛杉矶的后面(SGA,2014)。
因此,说到研究密集城市和扩散化城市可持续度的课题,芝加哥是非常好的研究对象。它是高层建筑的诞生地,在过去的一个多世纪也是高层建筑最蓬勃的实验场,另外芝加哥有着同大多数美国城市一样至
Volume 1 and 2 book.indb 37 9/12/2016 7:52:42 PM

38 Rethinking the City | 反思城市
with many other cities around the world over the past decade or two, it has seen both a suburbanization at the same time as a densification of its downtown area and a resurgence of people seeking high-rise urban living.
The study was thus undertaken based on two distinct case study sets: four residential towers in the City of Chicago as the downtown high-rise case studies, and Oak Park as the suburban low-rise case study. The relative geographic locations and connected transportation systems of these two areas are shown in Figure 5.
Case Study Set 1: Chicago Downtown Residential Towers All of the four downtown residential towers are located in areas of relative high urban density and served by numerous forms of public transport. Specifically, Aqua Tower is located on the edge of the Chicago Loop (approximate published density = 7,200 people/km2), the Legacy at Millennium Park is located within the Chicago Loop, and the Commonwealth Plaza (two towers) is located on the edge of the Lakeview neighborhood (approximate published density = 12,000 people/km2), about 8km north of the Chicago Loop (US Census Bureau, CTBUH) (see Figure 6). The choice of these four residential towers was mainly because of their unique locations, and the research team having a good relationship with each building ownership / management so as to encourage a high number of responses from residents. The varied towers were also chosen so as to enable a comparison across high-rise residential types and locations, as well as with the low-rise suburban scenario.
Figure 6. Buildings included in the downtown high-rise case studies (Left to Right): Aqua Tower, the two Commonwealth Plaza Towers and Legacy Tower (Source: Authors) 图6:市中心高层住宅案例组的建筑(由左至右):水纹大厦,Legacy大厦和两栋联邦广场大厦。来源:作者。(图像来源:CTBUH)
Figure 5. Locations of case study sets relative to central Chicago and major transportation systems (Oak Park for suburban low-rise homes, downtown Loop for Aqua and Legacy Towers, and Lakeview for Commonwealth Towers) (Source: Authors) 图5:两组研究案例位置与芝加哥市区的关系以及主要的交通系统(橡树园是郊区的低层住宅,洛普区的水纹大厦和Legacy大厦以及湖景区的联邦大厦)。(来源:作者。)
1:125,000
Oak Park
Loop
Lakeview
Aurora
CTA Red LineCTA Blue LineCTA Yellow LineCTA Orange LineCTA Green LineCTA Pink LineCTA Brown LineMetra Commuter TrainMajor Expressways
Commonwealth Towers
Legacy Tower
Aqua Tower
Volume 1 and 2 book.indb 38 9/12/2016 7:52:50 PM

CTBUH 2016 Shenzhen · Guangzhou · Hong Kong Conference | 2016年CTBUH深圳 · 广州 · 香港国际会议 39
Case Study Set 2: Oak Park Oak Park, a district accommodating 52,287 inhabitants (approximate published density = 4,262/km2), is located 14km from Chicago city center, and forms the low-rise suburb case study in this research (Source: American Community Survey, US Census Bureau). Oak Park constitutes a relatively dense mix of single-family homes and apartment blocks, with a very walkable environment, and is plugged into much of Chicagoland’s public transport system (especially the mass transit CTA green and blue lines, and a main Metra train line).
The choice of this case study is perhaps surprising for those who are familiar with the Chicago urban agglomeration, since Oak Park is considered somewhat “sustainable” in many aspects, especially in comparison to most of the further outlying suburbs such as Aurora or Naperville, which would likely have shown a more marked contrast in the energy implications of transportation and supporting infrastructure to the downtown case studies than Oak Park. However, a large objective of this research project was to have applicability to many cities around the world, and thus to take a ‘best case urban’ versus ‘worst case suburban’ comparison would not be productive. Since the USA is one of the most energy-profligate nations when it comes to residential energy consumption, it is believed that Oak Park as a case study may be more akin, in agglomerated terms, to European or Asian situations, where there is good suburban access to public transport, and local amenities.
It should also be noted that one of the research team members and authors of this report resides in Oak Park and this was a significant factor in choosing this area as the “suburban low-rise” case study. As stated, the objective of the research was to get a high “quality” of data, rather than just “quantity”, and thus choosing areas with a strong personal foothold was considered advantageous. This definitely had a positive impact on the project. Due to the personal encouragement of friends and neighbors to undertake the study, as well as enlisting the official help of the Village of Oak Park (the municipal authority), and the Schools District, 273 households in the suburban study alone engaged in the study, from the 565 approached (a response rate of 48%).
Survey Responses / Stakeholder Engagement / Household Demographics
Although it took more than one hour to complete the survey, 522 responses were
gathered across both high rise and low rise scenarios, from 1561 households contacted, with 235 responses giving “completed” data (see Figure 7). The response rate was thus 48% in the low-rise suburban scenario, 25% in the high-rise urban scenario, and 33% overall. Against published studies, these are very high responses rates, especially considering the complexity of the questionnaire, the time engagement needed, the supply of utility bills, and the highly personal nature of some information requested. As previously mentioned, this high response rate is at least partly due to the strong partnerships with municipal authorities and building owners/developers/architects, as well as the personal connection of members of the research team with the residents in the case studies selected.
Although the percentage of responders in the high rise scenarios was lower than the low rise, the total number of questionnaire responses in both scenarios (downtown high-rise = 249; and suburban low-rise = 273) is comparable, which is obviously beneficial as the sample sizes for the research project. The demographics and other relevant data from the surveys is shown in Figure 8.
As can be seen from the results in Figure 8, much of the demographic data is comparable across the high rise and low rise scenarios (gender, ethnicity, home ownership, etc). The biggest differences are in the number of retirees per household (20% downtown vs. 6% suburban), number of children under 18 in the household (6% downtown vs. 38% suburban), the average resident age (51 years of age downtown vs. 32 years of age suburban), average household income ($232,000 downtown vs. $182,000 suburban), and household size (1.9 people
Responses 反馈
Downtown High-Rise
市中心高层住宅
Suburban Low-Rise
郊区低层住宅
Aqua Tower (b) 水纹大厦
Commonwealth Plaza
联邦大厦
Legacy Legacy大厦
Total: 4 Towers 总值:4座大厦
Oak Park 橡树园
Total No. of completed responses (a)
40 31 41 112 123
Total No. of partially completed responses (a)
29 32 76 137 150
Total No. of responses 69 63 117 249 273
Total No. of households contacted directly
264 375 357 996 565
Response rate 26.1% 16.8% 32.8% 25% 48.3% Note: (a) Considering that not all questions were compulsory, a “Completed” questionnaire is considered as one where 60-100% of questions were answered. A ‘Partially Completed’ questionnaire is considered as one where less than 60% of questions were answered. (b) Aqua Tower features 18 floors of hotel space (334 Rooms), 30 floors of rental apartments (474 Units) and 25 stories of owned condominiums (264 Units). Due to legal issues raised by the building owner and management, only condo residents (264) were able to participate in the survey. 注释:(a) 考虑到并非所有问题都是强制性的,“完整”问卷指完成60%-100%问题的问卷。“部分完整”指完成问题少于60%的问卷。(b) 如第二章指出的,水纹大厦包含18层的酒店(334个房间),30层出租公寓(474个单元)以及25层产权公寓。因为建筑所有者和管理方提出的法律问题,仅仅产权公寓(264个单元)可以参与到本研究中。
Figure 7. Respondee engagement (Source: Authors) 图7:问卷反馈总结。(来源:作者)
今仍在扩展的郊区。但是,同世界上很多其他城市一样,过去的十几二十年,它同时经历着郊区化和市中心高密度化,现在越来越多的人们重新燃起在布满高楼的城市中生活的意愿。
本研究选取的两组研究案例位于芝加哥的两个区域:第一组的市中心高层案例是芝加哥市区的4栋住宅塔楼,第二组的郊区低层案例是位于橡树园的低层住宅。两者相对地理位置以及相互连接的交通系统如图表6所示。
第一组研究对象:芝加哥中心区的高层住宅楼 所有中心区的四座高层住宅楼坐落在相对高密度的城市区域,有多种公共交通可以到达。水纹大厦位于芝加哥洛普区的边缘(人口密度约7200人/平方公里),位于千禧公园附近的Legacy大厦也在洛普区,联邦广场(包含两座塔楼)位于洛普区北边8公里处的湖景区的边缘(人口密度约12000人/平方公里)(美国人口普查局,CTBUH)(见图7)。选择这四栋高楼的主要原因是它们位置独特,而且研究团队与这四栋大楼的业主/管理运营方关系较好,这样能够获得较多的问卷反馈。选择多栋不同种类不同位置的大楼,可以比较高层住宅案例组内部的不同,也可以与低层郊区住宅案例组比较。
第二组研究对象:橡树园 橡树园,有52,287位居民居住在内(人口密度约4262人/平方公里),距离芝加哥市区14公里,是本研究的郊区低层住宅案例组(来源:美国社区调查,美国人口普查局)。橡树园由独栋住宅和公寓式住宅两类混合组成,社区内有良好的步行环境,并且还有芝加哥大区的公共交通系统(特别是大型交通工具CTA绿线和蓝线,以及主要地铁线)。
Volume 1 and 2 book.indb 39 9/12/2016 7:52:50 PM

40 Rethinking the City | 反思城市
per household downtown vs. 3.3. people per household suburban).
Interpreting this data, we can conclude that these factors are all likely linked, with the high rise residences accommodating an older populace, with more retirees and certainly less children, and a higher disposable income2. This, at least in part, seems to confirm the notion that downtown high rise apartments are predominantly accommodating the “empty nesters” in many US cities, whilst a suburb such as Oak Park predominantly seems to cater for families. Specifically, the households embraced in this study in Oak Park include 273 children under 18 years old, approximately 38% of the total household members, whereas there are only 16 children, or approximately 5.5%, in the downtown high-rises case studies.
The data on household size has an impact on many other parts of this study, since much of the data is invariably reported per household, per person and per square meter. In the case of the high rise scenarios, the average Household size of 1.9 is almost half that of the Oak Park scenarios, at 3.3 people per Household. As we can see from the table, this then has an impact on the average Gross Floor Area of dwelling (GFA) and also car ownership per household. Whilst, as one might expect, the average GFA per Household in the suburban setting is 53% greater than the high rise setting (226m2 compared with 147m2), when the actual number of people living in the household is taken into account, the suburban homes see a greater GFA efficiency, at 68.6m2 per person, compared with 77.4m2 per person in the high rise scenarios. A similar thing happens with car ownership, with 1.8 cars per household in the suburban setting compared with 1.2 cars downtown, but only 0.5 cars suburban compared with 0.6 for downtown, on a per person basis.
It must be stated that this demographic skewing towards comparing predominantly affluent, white, older/retired couples and singles in the high rise scenarios, with affluent, largely white families in the suburban scenario, became a major limitation of the research project. This is discussed more in the Limitations of the Study and Future Research section. It should also be noted that another factor affecting this research is that older people were more perhaps more likely to respond to the questionnaire, since they generally have more time to commit to taking such time-consuming surveys. Young
Characteristics特征
Downtown High-Rise 市中心高层
Suburban Low-Rise 郊区低层
Aqua Tower 水纹大厦
Commonwealth Plaza
联邦广场
Legacy Legacy大厦
Average: 4 Towers
平均值:4座大厦
Oak Park 橡树园
Occupants (a)
Female% 43% 46% 49% 47% 48%
White Ethnicity% 81% 85% 92% 87% 88%
Children (Under 18)% 4% 14% 2% 6% 38%
Retiree% 15% 18% 24% 20% 6%
Avg. Resident Age (yrs) 48.5 47.8 54.6 51.1 31.8
Household (HH) (a)
Home Ownership% 93% 88% 84% 88% 88%
Avg. Residence Time (yrs)
4.2 14.7 2.4 7.1 10.2
Avg. Annual HH Income 254,000 153,000 280,000 232,000 182,000
Avg. Household Size (occupants)
1.8 2.0 1.9 1.9 3.3
Avg. GFA/HH (m2) 132.0 128.2 181.1 147.1 226.4
Avg. GFA/person (m2) 73.3 64.1 95.3 77.4 68.6
Car Ownership/HH 1.4 1 1.2 1.2 1.8
Car Ownership/person 0.8 0.5 0.6 0.6 0.5
# of Available Parking Spaces/HH
1.7 0.8 1.3 1.4 1.8
Building (b)
TypeCondo
ApartmentHotel
Condo Condo Condo
75% single family house, 15% 2-5 storey
apartment/condo building, 5% townhouse,
5% other 1
Completion Year 2010 1956 2009 N/A71.9% built before 1950 24.7% built 1950–1999
3.4% built after 2000
Height 250 m 77 m 262 m N/A Typically 10 m or lower
# of Floors 86 27 73 Typically 1–3
# of Units 738 375 357 N/A Typically 1 per abode
Structural Material Concrete Steel/Concrete Concrete N/AWood Frame, Stone
or Brick
# of Available Parking Spaces
1,271 293 449 N/A N/A
Neighborhood (c)
Loop Lakeview Loop N/A Oak Park
Published Neighborhood
Population22,655 64,631 22,655 N/A 51,781
Published Neighborhood Density
7,200/km2 12,000/km2 7200/km2 N/A 4,262/km2
Distance to Chicago Loop
Walkable 6 km (average) Walkable N/A 11–16 km (average)
Public Transport System in Reasonable Walking
Distance
All CTA Lines, All Metra Lines & Multiple Bus
Lines
CTA Red, Purple and Brown Lines, Metra UP-N Line & Multiple Bus
Lines
All CTA Lines, All Metra Lines & Multiple Bus
Lines
N/AGreen & Blue CTA lines, Metra UP-West Line &
Pace Buses
Figure 8. Basic characteristics of the two case study sets (Source: Authors; (a) Data source: the survey completed by the households across all the cases; (b) Data source: Building management companies, CTBUH Skyscraper Center & U.S. Census Bureau; (c) Data source: U.S. Census Bureau & Chicago Metropolitan Agency for Planning (CMAP))图8:两组研究对象的基本特征。(来源:作者) 注释:(a) 数据来源:所有的调查案例中那些完整回答问卷的家庭;(b) 数据来源:物业管理公司,CTBUH 摩天大楼中心以及美国人口普查局;(c) 数据来源:美国人口普查局以及芝加哥都会规划部(CMAP)
2: Actually both high-rise and low-rise scenarios show a high affluence, at $232,000 and $182,000 average annual household income respectively – compared with the Chicago metropolitan average of $60,564. Source: American Community Survey, U.S. Census Bureau. 20132: 实际上高层住宅组和低层住宅组都表现出高收入的特征,两种年家庭收入分别是23.2万美元和18.2万美元——对比芝加哥都市区的平均收入仅有60,564美元。来源:美国社区调查,美国人口普查局,2013.
Volume 1 and 2 book.indb 40 9/12/2016 7:52:50 PM

CTBUH 2016 Shenzhen · Guangzhou · Hong Kong Conference | 2016年CTBUH深圳 · 广州 · 香港国际会议 41
professionals in the downtown scenarios are often busy with life and work, and were difficult to capture effectively in this research.
Analysis and Results
Home Operational Site Energy Use This category comprises the site energy3 used for space heating and cooling, hot water heating, lighting, cooking, appliance / equipment operation, and all other forms of home operating energy usage. Data was gathered by collecting and analyzing actual energy bills (i.e., electric, gas, and, for the high-rise towers, chilled water4 bills) for a 12-month period, and all converted into MJ per year5.
In the case of the high rise buildings, common areas and facilities (such as lobbies, corridors, elevators, centralized MEP plant services, etc.) were taken into account, and a share of these allocated across all households in the building on a share-of-total-floor-area-according-to-unit-area basis. The types of energy bills paid by building management as opposed to individual unit owners differed across all the high rise scenarios and are explained in the notes section of Figure 9. It should be noted that it was not possible to obtain building energy bills for Aqua Tower, so that case study has been omitted from this part of the study.
As Figure 9 shows, the findings of the energy audit are perhaps somewhat surprising, with the total energy consumption on a per square meter basis being similar across both high rise and low rise scenarios (1,258 and 1,202 GJ per annum respectively, thus actually 5% higher in the high rise buildings). The higher general floor area in the suburban homes means a greater energy consumption per household in the low-rise setting but, conversely, the more people living in those households meant that the energy consumption per person was less in the low-rise setting.
This is a perhaps surprising result, given the prevailing belief that single-family suburban homes, especially of the older type predominantly included in this research, are large, extravagantly-occupied and more energy-profligate, especially with a high envelope surface-area-to-floor-area ratio for greater potential heat loss/gain, whilst modern high rise buildings have more energy-efficient construction and building services and a lower envelope surface-area-to-floor-area ratio for reduced potential heat loss/gain, coupled with a high potential benefit of heat (or even cooling) share between residential units. But, although this
3: Site energy is considered as the energy directly consumed at a facility typically measured with utility meters (i.e., the energy consumed directly by the buildings in their location). Some studies consider “Source Energy”, which is the sum of the energy consumed at a facility as well as the energy required to extract, convert, and transport that useful energy to the facility (Deru, et al., 2007). The variance in Source Energy between a building using gas for heating/cooling or electricity for heating/cooling can be very high. So, since this study is predominantly focused on a comparison across building types with differing energy-use systems, and not a commentary on the suitability of those systems, all energy consumption figures in the study are based on “site energy”.4: The chilled water in the Legacy Tower is provided by the city’s district chilled water system, Thermal Chicago, which serves over 100 buildings within the city. It is one of the most advanced, reliable, and efficient cooling systems in the world. The system includes five chilled water generation plants serving the Loop, West Loop, South Loop and River North areas. Commonwealth Plaza has its own chillers, so does not have chilled water bills from Thermal Chicago.5: The conversion of all site energy consumption into MJ or GJ, to enable comparisons across energy types and buildings, was undertaken by using published conversion factors (ASHRAE, 2013) in conjunction with the data collected from utility bills. Thus, in the case of electricity, “kWh” was converted to MJ using the conversion: MJ = kWh × 3.6 MJ/kWh. In the case of gas, “therm” was converted to MJ using the conversion: MJ = therm × 105.5 MJ/therm. In the case of chilled water supply, “ton-hour” was converted to MJ using the conversion: MJ = ton-hour × 12.66 MJ/ton-hour)/6.1. This 6.1 figure is the estimated coefficient of performance (COP) for the electric motor driven centrifugal chillers used by Thermal Chicago’s downtown chilled water loop. Unfortunately, the exact COP of the chillers was not available; a conservative estimate of 6.1 was used, as it is the COP for a baseline centrifugal chiller according to ASHRAE 90.1-20073:末端耗能通常被视为用电表测量的设施所直接消耗的能源(即建筑物在其位置上直接消耗的能源)。有些研究看重“源能耗”,即设施消耗的总能源,以及提取、转换和运输对设施有用的能源所需的能源(Deru等,2007)。使用气体加热/冷却或电加热/冷却的建筑物之间的源能差异是非常高的。因此,由于本研究的主要关注具有不同能源使用系统的建筑类型之间的比较,而不是对这些系统可持续性发展的述评,因此本研究中所有能源消耗数据以“末端耗能”为基准。4: Legacy大厦的冷却水由市区冷冻水系统“芝加哥加热”所提供,它服务于全市范围内超过100个建筑。该系统是世上最先进、可靠、有效的冷冻系统之一,包括有五个冷却水发电厂,服务于环、西环路、南环路、北河地区。联邦广场自身拥有制冷机,因此没有芝加哥加热的冷冻水费用。5: 通过结合水电费中的数据并利用已发表的转换因子(ASHRAE,2013),消费的所有末端能耗转化为兆焦耳(MJ)或吉焦耳(GJ),以便于在不同能源类型与建筑之间进行数据比较。因此,关于用电量,通过使用公式:MJ =kWh×3.6 MJ /kWh,“千瓦时(kWh)”转化为了兆焦耳(MJ)。关于燃气量,通过使用公式:MJ =therm×105.5 MJ /therm,“热(therm)”转换为兆焦耳(MJ)。关于冷冻水供应,通过使用公式:MJ =ton-hour×12.66 MJ /ton-hour)6.1,“吨小时(ton-hour)”转换为兆焦耳(MJ)。6.1这个数字是对于热芝加哥市中心的冷冻水回路所使用的电动机驱动的离心式冷水机组所估计的性能系数(COP)。可惜的是,无法获取冷水机组的准确性能系数;之所以采用6.1的保守估计,是因为据ASHRAE 90.1-2007所示,它是基线离心式冷水机组的性能系数(COP)。
Utility Supply能量供应
Downtown High-Rise市中心高层
Suburban Low-Rise
郊区低层
Commonwealth Plaza (a)
联邦广场
Legacy (b)
Legacy大厦
Average: 3 Towers (c)
平均值: 3座大厦Oak Park 橡树园
Building Management Paid
Electricity (MJ/m2) 150 585 368 N/A
Gas (MJ/m2) 1,010 115 562 N/A
Chilled Water (MJ/m2) N/A 40 20 N/A
Individual Household Paid
Electricity (MJ/m2) 130 285 216 209
Gas (MJ/m2) N/A N/A N/A 994
Total (MJ/m2/year) 1,290 1,229 1,258 1,202
Total (GJ/HH/year) 156 216 187 275
Total (GJ/person/year) 98 122 110 87
Notes on Energy Provision:(a) Commonwealth Towers: The electricity bills paid by Building Management covers air conditioning, lighting, and mechanical systems of the common areas, as well as chilled water for the whole building (common areas + individual units). The gas bills paid by Building Management cover the gas usage for heating the whole building (common areas + individual units), as well as cooking in individual units. Commonwealth Towers have their own chillers, with the energy consumed accounted for in the electricity bills paid by Building Management. The electricity bills paid by individual units cover air conditioning, lighting, and appliances of individual units.(b) Legacy Tower: The electricity bills paid by Building Management cover air conditioning, heating, lighting, and mechanical systems of the common areas. The gas bills paid by Building Management cover common area feature fireplaces, and cooking in individual units. The chilled water in the Legacy Tower is provided by the city’s district chilled water system, Thermal Chicago, which serves over 100 buildings within the city. The electricity bills paid by individual units cover air conditioning, heating, lighting, and appliances of individual units.(c) Aqua Tower: It was not possible to include Aqua Tower in this part of the survey since energy bills for the common areas were unobtainable.
能源供应注意事项:(a) 联邦大厦:建筑管理所支付的电费包括空调、照明和公共区域的机械系统,以及整个建筑的冷冻水系统(公共区域+个人单位)。建筑管理所支付的燃气费包括加热整个建筑(公共区域+个人单位)的燃气使用,以及私人单位烹饪的燃气使用。联邦大厦拥有自己的冷水机组,其消耗的能源包括在建筑管理所支付的电费中。个人单位所支付的电费包括空调、照明和他们的电器。(b) Legacy大厦:建筑管理所支付的电费包括空调,取暖,照明,以及公共区域的机械系统。建筑管理所支付的燃气费包括公共区域内富有特色的壁炉,以及个人单位的烹饪所耗。Legacy大厦的冷却水由市区冷冻水系统Thermal Chicago所提供,它服务于全市范围内超过100个建筑。个人单位所支付的电费包括空调、加热、照明和他们的电器。(c) 水纹大厦:本研究的这一部分未包括水纹大厦,因为无法获得其公共区域的能源账单。
Figure 9. Annual operational energy (Source: Authors) 图9:年度运营能源。(来源:作者)
选择橡树园这个案例,可能会让那些熟悉芝加哥城市板块的人感到惊讶,因为橡树园在众多方面被认为是一个“可持续社区”,特别是同那些更偏远的郊区比如Aurora和Naperville比较而言,如果选用Aurora和Naperville会在交通工具能源的能源消耗和配套基础设施上与市中心高层住宅案例组有显著不同。但是,该研究一个很大的目标是要对全球多数城市适用,因此选用“最佳案例”对比“最差案例”并没有什么意义。考虑到美国是一个能源挥霍大国,橡树园这个区块作为案例,它的能源消耗类似于欧洲和亚洲的情况,郊区都有良好的公共交通和配套设施。
Volume 1 and 2 book.indb 41 9/12/2016 7:52:50 PM

42 Rethinking the City | 反思城市
might be true of other scenarios, it was not the finding here. It is also perhaps surprising that the energy comparison between the 1956 completed Commonwealth Towers, with their single-glass curtain wall, and the 2009 completed Legacy Tower, with its double-glazed curtain wall and modern facilities, was not greater (just 5% greater for the older building).
Although a large part of this anomaly may be linked to the limitations of this research study (i.e. that the high rise scenarios basically focused on building predominantly accommodating affluent, semi-retired people living in large area apartments), such energy consumption differences are indeed curious. Certainly in post-data reflection and follow up discussions with residents, the following two factors seem to play a role:
1. Though the construction and systems in the more modern high rise building are indeed more efficient than in the older high rise and single family homes, the higher provision of facilities (i.e., indoor pool, whirlpool spa, fitness center, library, communal room, etc.) is such that more energy is needed to operate them. Though this thus has a detrimental effect on energy use, one would expect that it would have a positive effect on Quality of Life, and satisfaction with the home in particular.
2. Resident control seems to be a significant factor. In a single family home the user has direct control of all operating systems and can dictate when certain systems (e.g. heat / cool) are operating, based on the preferences of a small number of people (i.e. the family). This is less flexible in a high rise building where, often, the MEP systems are running even if people don’t want them. Some residents described scenarios where the central heating (or cooling) was on but residents had windows open because it was too hot / too cold inside the apartment. Further verification work in this area is needed.
Home Embodied Energy Home Embodied energy is the energy consumed in all activities necessary to construct the building, including the embodied energy in the materials themselves, and the direct energy used by the contractors / sub-contractors for all on-site and off-site activities to facilitate any construction, prefabrication, administration and transportation of goods. In addition, during a building’s life, embodied energy is added
through goods and services used in the maintenance and refurbishment of the home.
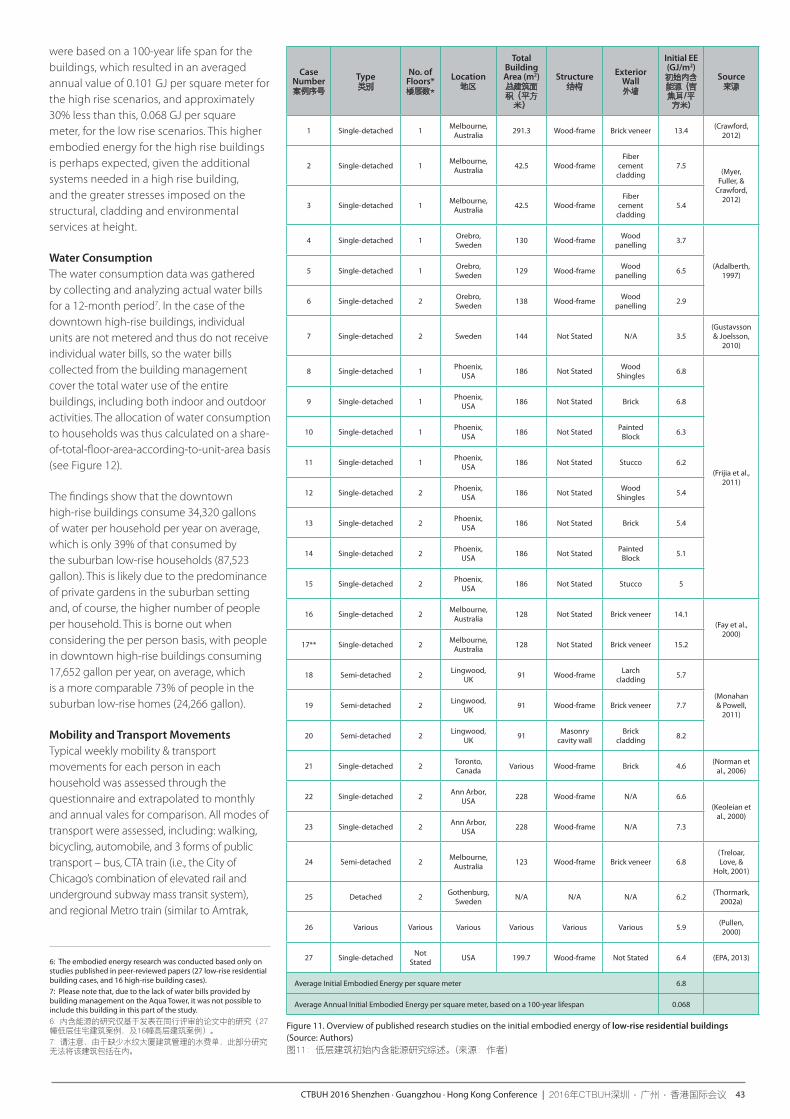
It was outside the scope of this research project to undertake the very detailed calculations of embodied energy for four high rise buildings and more than 200 homes of differing construction in Oak Park. Instead, then available published studies on initial embodied energy (i.e. not including retrofits and refurbishments during the life of the buildings) for both high rise and low rise buildings were gathered, and an average value of initial embodied energy per square meter was used for both sets of scenarios (see Figures 10 and 11)6. Both scenarios
Case Number案例序号
Type类别
No. of Floors*楼层数*
Location地区
Total Building Area (m2)总建筑面积(平方米)
Structure结构
Envelope外墙
Initial EE (GJ/m2)初始内含能源 (吉焦耳/平方米)
Source来源
1 Office 7Melbourne,
Australia27,350
Reinforced concrete
Reinforced concrete
façade panel
11.9
(Treloar et al., 2001)
2 Office 15Melbourne,
Australia47,000
Reinforced concrete
Granite façade panel
16.1
3 Office 42Melbourne,
Australia99,350
Reinforced concrete
Concrete façade panel
18.0
4 Office 52Melbourne,
Australia129,950
Reinforced concrete
Granite façade panel
18.4
5 Office 7-9 Japan Various Various Various 9(Suzuki &
Oka, 1998)
6 Office 8 Japan 2,802
Steel reinforced concrete +
Steel
Not Stated 10.1
(Oka, Suzuki, & Konnya,
1993)
7 Office 8 Japan 3,500Steel
reinforced concrete
Not Stated 11.2
8 Office 18 Japan 22,861 Steel Not Stated 11.9
9 Office 25 Japan 21,600 Steel Not Stated 8
10 Office 31 Japan 88,049 Steel Not Stated 10.5
11 Residential 12 Sweden 2,802Reinforced concrete
Not Stated 3.7(Gustavsson & Joelsson,
2010)
12 Residential 15Toronto, Canada
Not Stated Not Stated Not Stated 5.5(Norman et
al., 2006)
13 Education 19Shijiazhuang,
China49,166
Reinforced concrete
Not Stated 6.3(Chang, Ries, & Lei, 2012)
14 Office 38Bangkok, Thailand
60,000 ConcreteBrick and
curtain wall
6.8(Kofoworola & Gheewala,
2009)
15 Residential 40Hong Kong,
China39,040 Not Stated
Concrete façade panel
7.2(Chen,
Burnett, & Chau, 2001)
16 Residential 40Hong Kong,
China26,600 Not Stated
Concrete façade panel
7
Average Initial Embodied Energy per square meter 10.1
Average Annual Initial Embodied Energy per square meter, based on a 100-year lifespan 0.101
Figure 10. Overview of published research studies on the initial embodied energy of high-rise buildings (Source: Authors)图10:高层建筑初始内含能源研究综述。(来源:作者)
选择橡树园作为“郊区低层住宅”案例还有另外一个重要原因,研究组中的一位成员以及本文的作者均居住在橡树园。如前文所述,研究的目标是要获得高质量的数据,不仅仅是数量多而已。因此选择一个有紧密人脉关系的区域是很有优势的,对研究项目一定有积极影响。在居住区和学区中,可以利用人际关系来鼓励朋友或邻居参与到研究中,也便于获得橡树园管理人员的帮助(市政当局)。在郊区低层住宅案例组的研究中,我们接触了565户居民中,有273户居民完成了调查问卷(反馈率48%)。
Volume 1 and 2 book.indb 42 9/12/2016 7:52:50 PM
CTBUH 2016 Shenzhen · Guangzhou · Hong Kong Conference | 2016年CTBUH深圳 · 广州 · 香港国际会议 43
were based on a 100-year life span for the buildings, which resulted in an averaged annual value of 0.101 GJ per square meter for the high rise scenarios, and approximately 30% less than this, 0.068 GJ per square meter, for the low rise scenarios. This higher embodied energy for the high rise buildings is perhaps expected, given the additional systems needed in a high rise building, and the greater stresses imposed on the structural, cladding and environmental services at height.
Water Consumption The water consumption data was gathered by collecting and analyzing actual water bills for a 12-month period7. In the case of the downtown high-rise buildings, individual units are not metered and thus do not receive individual water bills, so the water bills collected from the building management cover the total water use of the entire buildings, including both indoor and outdoor activities. The allocation of water consumption to households was thus calculated on a share-of-total-floor-area-according-to-unit-area basis (see Figure 12).
The findings show that the downtown high-rise buildings consume 34,320 gallons of water per household per year on average, which is only 39% of that consumed by the suburban low-rise households (87,523 gallon). This is likely due to the predominance of private gardens in the suburban setting and, of course, the higher number of people per household. This is borne out when considering the per person basis, with people in downtown high-rise buildings consuming 17,652 gallon per year, on average, which is a more comparable 73% of people in the suburban low-rise homes (24,266 gallon).
Mobility and Transport Movements Typical weekly mobility & transport movements for each person in each household was assessed through the questionnaire and extrapolated to monthly and annual vales for comparison. All modes of transport were assessed, including: walking, bicycling, automobile, and 3 forms of public transport – bus, CTA train (i.e., the City of Chicago’s combination of elevated rail and underground subway mass transit system), and regional Metro train (similar to Amtrak,
6: The embodied energy research was conducted based only on studies published in peer-reviewed papers (27 low-rise residential building cases, and 16 high-rise building cases).7: Please note that, due to the lack of water bills provided by building management on the Aqua Tower, it was not possible to include this building in this part of the study.6: 内含能源的研究仅基于发表在同行评审的论文中的研究(27幢低层住宅建筑案例,及16幢高层建筑案例)。7: 请注意,由于缺少水纹大厦建筑管理的水费单,此部分研究无法将该建筑包括在内。
Case Number案例序号
Type类别
No. of Floors*楼层数*
Location地区
Total Building Area (m2)总建筑面积(平方米)
Structure结构
Exterior Wall外墙
Initial EE (GJ/m2)初始内含能源 (吉焦耳/平方米)
Source来源
1 Single-detached 1Melbourne,
Australia291.3 Wood-frame Brick veneer 13.4
(Crawford, 2012)
2 Single-detached 1Melbourne,
Australia42.5 Wood-frame
Fiber cement
cladding7.5
(Myer, Fuller, &
Crawford, 2012)
3 Single-detached 1Melbourne,
Australia42.5 Wood-frame
Fiber cement
cladding5.4
4 Single-detached 1Orebro, Sweden
130 Wood-frameWood
panelling3.7
(Adalberth, 1997)
5 Single-detached 1Orebro, Sweden
129 Wood-frameWood
panelling6.5
6 Single-detached 2Orebro, Sweden
138 Wood-frameWood
panelling2.9
7 Single-detached 2 Sweden 144 Not Stated N/A 3.5(Gustavsson & Joelsson,
2010)
8 Single-detached 1Phoenix,
USA186 Not Stated
Wood Shingles
6.8
(Frijia et al., 2011)
9 Single-detached 1Phoenix,
USA186 Not Stated Brick 6.8
10 Single-detached 1Phoenix,
USA186 Not Stated
Painted Block
6.3
11 Single-detached 1Phoenix,
USA186 Not Stated Stucco 6.2
12 Single-detached 2Phoenix,
USA186 Not Stated
Wood Shingles
5.4
13 Single-detached 2Phoenix,
USA186 Not Stated Brick 5.4
14 Single-detached 2Phoenix,
USA186 Not Stated
Painted Block
5.1
15 Single-detached 2Phoenix,
USA186 Not Stated Stucco 5
16 Single-detached 2Melbourne,
Australia128 Not Stated Brick veneer 14.1
(Fay et al., 2000)
17** Single-detached 2Melbourne,
Australia128 Not Stated Brick veneer 15.2
18 Semi-detached 2Lingwood,
UK91 Wood-frame
Larch cladding
5.7
(Monahan & Powell,
2011)19 Semi-detached 2
Lingwood, UK
91 Wood-frame Brick veneer 7.7
20 Semi-detached 2Lingwood,
UK91
Masonry cavity wall
Brick cladding
8.2
21 Single-detached 2Toronto, Canada
Various Wood-frame Brick 4.6(Norman et
al., 2006)
22 Single-detached 2Ann Arbor,
USA228 Wood-frame N/A 6.6
(Keoleian et al., 2000)
23 Single-detached 2Ann Arbor,
USA228 Wood-frame N/A 7.3
24 Semi-detached 2Melbourne,
Australia123 Wood-frame Brick veneer 6.8
(Treloar, Love, &
Holt, 2001)
25 Detached 2Gothenburg,
SwedenN/A N/A N/A 6.2
(Thormark, 2002a)
26 Various Various Various Various Various Various 5.9(Pullen, 2000)
27 Single-detachedNot
StatedUSA 199.7 Wood-frame Not Stated 6.4 (EPA, 2013)
Average Initial Embodied Energy per square meter 6.8
Average Annual Initial Embodied Energy per square meter, based on a 100-year lifespan 0.068
Figure 11. Overview of published research studies on the initial embodied energy of low-rise residential buildings (Source: Authors)图11:低层建筑初始内含能源研究综述。(来源:作者)
Volume 1 and 2 book.indb 43 9/12/2016 7:52:51 PM

44 Rethinking the City | 反思城市
which provides medium- and long-distance inter-city rail service). In addition, all types of typical journeys were embraced, including: work, school, shops, restaurant/entertainment, family/friends and “other” (specify if applicable).
The journey to each primary destination allowed for two pattern inputs: primary journey pattern and secondary journey pattern. In each pattern, frequency (times per week), travel time (minutes), and distance (miles) via each mode of travel involved in this journey were examined. Thus, for example, the survey allowed for the responder to indicate a 10 minute walk followed by 30 minute train journey to get to work on three days of the week, and a 5 minute bicycle ride followed by a 40 minute bus journey to get to work on two days of the week. In addition, car ownership and the types of cars were investigated.
Figure 13 summarizes the average weekly distances traveled by all modes of transport to all destinations for both downtown and suburban homes, presented on a per-household and per person basis.
As we can see, Oak Park households travel almost two-and-a-half times as far on a weekly basis as the downtown households (287km downtown vs. 700km suburban), although the time spent travelling on a per person basis is only 9% greater (6.6 hours downtown vs. 7.2 hours suburban).The breakdown of transport mode is 57% by private automobile, 37% by public transport, and 6% walking / cycling / “other” in the suburban scenario. Conversely, the downtown households travel 65% by private automobile, 16% by public transport, and 19% by walking / cycling / “other”. The higher automobile / lower public transport use with the downtown households is potentially counter-intuitive, but it must be remembered that the distance travelled by car is much lower than in the suburban setting. These journeys are predominantly being undertaken to go shopping, or visit places outside the city (as opposed to work / recreation) and the higher walking / biking distance indicates that many of the journeys that are undertaken in the suburban setting by public transport, are undertaken on foot in the downtown scenario.
Within the four downtown residential towers, the Commonwealth Plaza households traveled the most by walking, bicycling and bus (likely because of their greater distance from CTA / Metra infrastructure), and the Legacy households traveled the most by both (for likely the exact inverse reason).
Urban/Suburban Infrastructure Urban/suburban infrastructure includes all the networks and elements that are required
Water Consumption
Downtown High-Rise市中心高层
Suburban Low-Rise郊区低层
Commonwealth Plaza
联邦广场
Legacy Legacy大厦
Average: 3 Towers
平均值: 3座大厦
Oak Park橡树公园
Water (gallon/m2/year) 243 207 225 366
Water (gallon/HH/year) 31,153 37,488 34,320 87,523
Water (gallon/person/year) 15,576 19,727 17,652 24,266
Travel Characteristics
Downtown High-Rise市中心高层
Suburban Low-Rise郊区低层
Aqua Tower 水纹大厦
Commonwealth Plaza
联邦广场
LegacyLegacy 大厦
Average: 4 Towers平均值: 4座
大厦
Oak Park橡树园
Frequency (times) 22.6 26.8 18.6 22.7 40.9
Total Time per household (hrs)
11.2 16.5 10.1 12.6 23.7
Total Time per person (hrs) 6.2 8.3 5.3 6.6 7.2
Walk (km) 43.6 57.3 32.2 44.3 37.0
Bike (km) 1.8 16.4 6.0 8.0 4.8
Auto (km) 207.4 217.6 131.8 185.6 399.3
Bus (km) 3.5 52.0 3.1 19.5 9.3
CTA Train (km) 15.3 13.2 33.2 20.4 53.9
Metra Train (km) 4.8 1.6 11.3 6.0 194.7
Other (km) 2.9 1.0 4.7 2.9 0.8
Total per Household (km) 279.4 359.0 222.1 286.6 699.9
Total per Person (km) 147.1 179.5 123.4 150.8 212.1
to support inhabitation; roads, transportation, water, sewage, power, lighting supply, etc. This was by far the most difficult part of this study to assess, partly because of the shear amount of different infrastructure contained in any urban or suburban scenario, and partly because of the relative infancy of both the methodologies for assessing the embodied energy of infrastructure and the lack of previously published studies. To get some appreciation of the relative amount and density of infrastructure in both downtown and suburban scenarios, certain infrastructure networks in both locations were mapped (see Figure 14 as an example). In addition, provision for networks running through the areas between the locations and the points of supply were factored in.
The infrastructure networks studied included; (i) road (surface area); (ii) electrical supply (length of supply network); (iii) gas supply (length of supply network); and (iv) water supply (length of supply network). In all cases the networks were assessed against the total population in each area, including a factor for daytime population gain/loss through
Figure 12. Annual water consumption (Source: Authors)图12:年均用水量。(来源:作者)
Figure 13. Household travel data to all the destinations during a typical week (Source: Authors)图13:一周内家庭典型出行数据 (来源:作者)
调查反馈/相关利益者参与/家庭人口结构
我们一共发出了1561份问卷,尽管完成所有问题需要一个多小时,高层建筑组和低层建筑组仍共有522份问卷反馈到研究者手上,其中235份问卷反馈是包含完整数据 的(见图4)。反馈率分别为低层建筑组48%,高层建筑组25%,平均值33%。与许多已发表的研究相比,本研究有很高的反馈率,尤其是考虑到问卷的复杂程度、投入的时间后更是如此,此外我们还收集了供能供水账单以及高度个人化的信息,也增加了问卷回收难度。正如前文提到的,高反馈率部分得益于和市政当局以及所研究建筑的业主/开发商/建筑师的良好关系,还有研究团队与当地居民的良好关系。
尽管高层建筑组的反馈率低于低层建筑组,但是两组的反馈数量是比较接近的(市中心高层建筑组=249;郊区低层建筑组=273),得益于研究开始时选定的样本规模。调查中得到的人口学数据以及其他相关数据如下图8所示。
从上文的结果可以看出,高层住宅组和低层住宅组的许多人口学数据是比较接近的
Volume 1 and 2 book.indb 44 9/12/2016 7:52:51 PM

CTBUH 2016 Shenzhen · Guangzhou · Hong Kong Conference | 2016年CTBUH深圳 · 广州 · 香港国际会议 45
shifting work patterns, from published Census data (basically daytime population gain in the downtown high rise scenarios, and daytime population loss in the suburban scenarios). This “infrastructure per person” figure was then transferred into “infrastructure per household” and “infrastructure per m2 of household” figures using the average household size and GFA/household figures gleaned earlier.
Perhaps unsurprisingly, it is this assessment of infrastructure provision that shows the greatest difference between the urban and suburban scenarios, with the urban infrastructure provision per person in the downtown scenarios being much lower than in suburban scenarios, due to the more concentrated geographic area, and the higher number of people using such infrastructure, downtown. For example, the ratio of suburban-to-urban infrastructure provision for each network on a per person basis was approximated as
follows: (i) Surface Area of Roads: +1200%, (ii) Electrical Supply network: +528%; (iii) Gas Supply network: +563%; and (iv) Water Supply network: +564% (see Figure 15).
It is this area of the study that is currently under review and being developed. There are many significant assumptions and caveats made in these complicated assessments, and the figures reported above.
Analysis: Quality of Life
The Quality of Life (QoL) research relied on qualitative, rather than quantitative, data, with an extensive section of the questionnaire devoted to numerous questions focused on assessing both a Satisfaction With Life Scale (SWLS) and a Sense of Community Index (SCI). Published methodologies from Humanities
Figure 14. An example of infrastructure assessment: Overhead electrical cables mapping in Oak Park, IL (Source: Authors, with Illinois Institute of Technology students Ezgi Bay & Omar Almahdy)图14:伊利诺伊橡树园架空电缆长度 (来源:作者、伊利诺伊理工大学的学生Ezgi Bay和Omar Almahdy)
(性别,种族,房屋所有权等等)。差异最大的数据是户均退休人员的占比(市中心20%,郊区6%),户均小孩/学生数占比(市中心9%,郊区40%),居住者平均年龄(市中心51岁,郊区32岁),户均收入(中心区23.2万美元,郊区18.2万美元),以及户均人口(市中心每户平均1.9人,郊区平均每户3.3人)。
推演这些数据,我们可以得到的结论是这些因素可能都是相互关联的。高层住宅的居民是年龄较大的人群,退休率更高,小孩抚养压力更低,可支配收入额更高2。这些数据确认了大多数美国城市中流传的一个说法,即市中心高层住宅主要是“空巢家庭”居住,与此同时橡树园这样的郊区低层住宅主要是年轻家庭居住。参与本研究的橡树园家庭中有273个18岁以下的孩子,大约是家庭成员总数的38%,而市中心高层住宅这一组中只有16个小孩,大约占家庭成员总数的6%。
家庭成员数目对本研究的其他很多部分有影响,因为很多数据最后会按每一户,每一人,每一平方米来取单位值。在市中心高层案例组中户均人数是1.9人,几乎是橡树园中户均人数3.3人的一半。我们从表格中可以看出,这一差别影响了平均住宅建筑面积和平均汽车保有量。如大家普遍理解的那样,户均建筑面积上郊区住宅组比高层住宅组多出53%(226m2对应147m2
),当每一户中的人数考虑进来以后,郊区住宅组对比高层住宅组反而有更高的居住效率,郊区住宅人均居住面积是68.6m2
,高层住宅组的人均居住面积是77.4m2。汽车保有量也有相似的情况,郊区住宅组户均汽车保有量是1.8辆,高层住宅组是1.2辆,但是按人均来计算,郊区住宅组只有0.5辆,高层住宅组有0.6辆。
必须要说明的是,本研究中的人口学数据显示出一定的倾向性,高层住宅组中主要是富裕的白人退休老年夫妻和老年独居者,而郊区住宅组中主要是富裕的白人大家庭,这一点是本研究的局限处。在本文的研究限制与未来研究的章节有深入探讨。同时应该注意到另一个影响研究的因素是,老年人可能更愿意回答调查问卷,因为总的来说老年人有更多时间参与到这项耗时的调查中。高层建筑组中的年轻人们,常常忙着工作和生活,很难有效地参与到研究中。
家庭运营的末端能耗
该类别包括用于空间加热与冷却系统,热水加热,照明,烹饪,电器/设备运营,以及所有其他形式的家庭中使用的末端能源3
。通过收集和分析12个月期间的实际能源账单(例如电、气、高层大厦冷冻水4系统的账单),我们汇总数据并将其单位转化为兆焦耳(MJ)/年5。
Volume 1 and 2 book.indb 45 9/12/2016 7:52:52 PM

46 Rethinking the City | 反思城市
fields were used, including introducing regression analyses and other statistical tools to get as close to comparable results as possible. The questionnaire also embraced other satisfaction domains including travel, accessibility, social integration, safety and overall residential environment.
Perhaps unsurprisingly, given that the study involved evaluating predominantly affluent, white, semi-retired people in the high rise scenarios and affluent, white, middle class families in the suburban scenarios – both of whom had largely chosen to live where they reside – the Quality of Life indicators were high for both scenarios (see Figure 16). Those living in the high rise buildings had a slightly higher SWLS score (4.18 as opposed to 4.01, out of a possible 5), whereas those living in the suburban scenario had a slightly higher Sense of Community score (3.90 compared with 3.6, out of a possible 5). However, when controlling for demographic differences, the study found that residence type (urban and suburban scenarios) was not significantly associated with a sense of community. The factor that was found to be most associated with a sense of community, perhaps unsurprisingly, was household size (i.e, the greater the number of household members, the higher the sense of community).
Summary of Findings
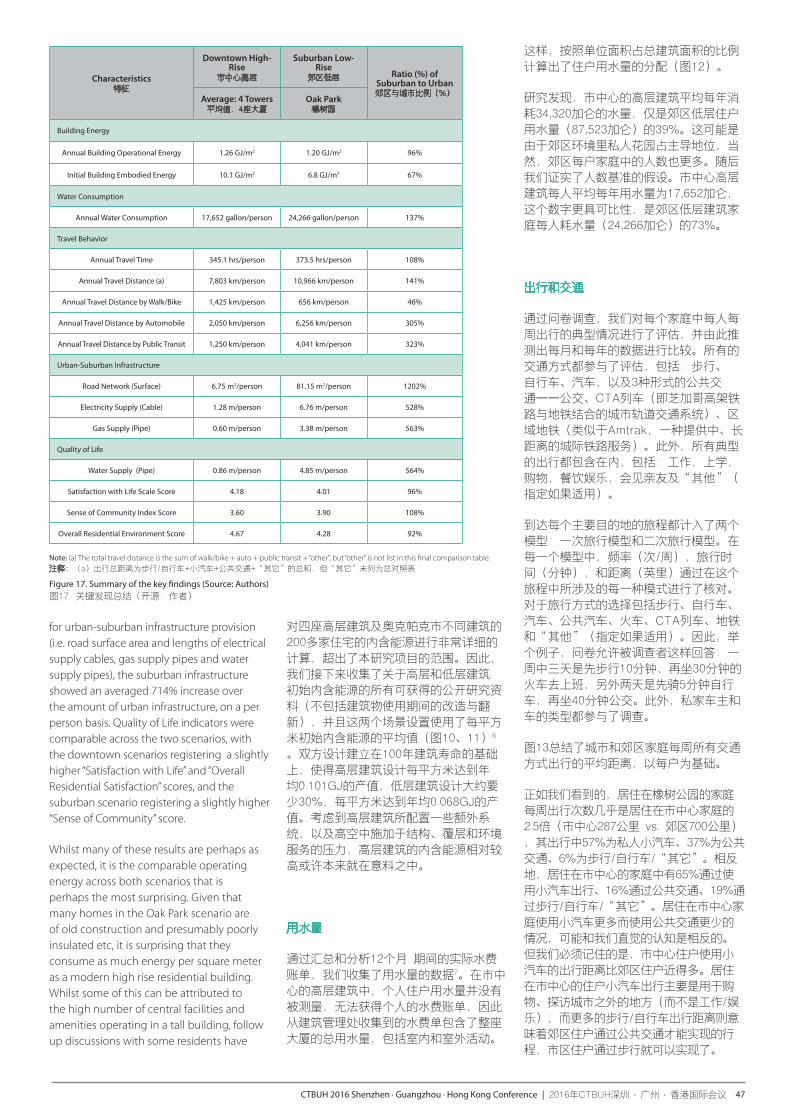
Figure 17 summarizes the key findings of this research, focusing on the ratio of Suburban-to-Urban values across all main data fields. Building operational and embodied energy are show on a GJ per square meter of floor space basis, whereas all other indicators are shown on a per person basis, so as not to allow the differing household physical size, or the number of people in each household, skew the results.
As mentioned in the relevant sections of this paper, operational energy across both high rise and low rise scenarios are virtually the same on a square meterage basis, whereas embodied energy in the low-rise scenario is approximately a third less than high rise. Water consumption is approximately a third more in the suburban setting than downtown. People in the suburban setting spend only around 8% more time travelling than downtown residents, but manage a 41% increase of actual kilometers travelled. The Oak Park residents travelled only 46% of the distance travelled by downtown residents by bike/walking, but 305% of the distance travelled by automobile, and 323% by public transport. Examining the four fields studied
Infrastructure Measurement基础设施测算
Downtown Chicago芝加哥市中心
Oak Park橡树园
Per Person每人
Per HH每户
Per sq.m 每平方米
Per Person每人
Per HH每户
Per sq.m每平方米
Road Network (Surface Area) (sq.m) 6.75 12.83 0.09 81.15 267.80 1.18
Electricity Supply (Length of Cable) (m) 1.28 2.43 0.02 6.76 22.31 0.10
Gas Supply (Length of Pipe) (m) 0.60 1.14 0.01 3.38 11.15 0.05
Water Supply (Length of Pipe) (m) 0.86 1.63 0.01 4.85 16.01 0.07
Figure 15. Measurement of urban vs. suburban infrastructure (Source: Authors)图15:城市与郊区基础设施测量 (来源:作者)
Figure 16. Average scores of the QoL Indicators (Source: Authors)图16:生活质量指标平均分 (来源:作者)
空间等),但也意味着我们要花费更多的能源来运行它们。尽管这样会对能源使用造成有害影响,但人们会期待它会对人们的生活质量带来积极影响,尤其是对家庭环境的满意度。
2. 居民控制似乎是一个非常重要的因素。在单户住宅中,使用者根据一小批人(即家人)的偏好,可以直接控制所有运营系统,并且能支配某些系统(比如加热/制冷)的运行时间。但在一个高层建筑中就不这么灵活了,即使在人们不需要的时候,机电系统也会自行运转着。有些居住者表示在中央制热(或制冷)的地方,他们会让窗户敞开,因为在屋里太热或太冷了。这方面验证还需要更多的探索。
家庭内含能源
家庭内含能源指建造房屋时所有必要活动中所消耗的总能源,包括材料本身的内含能耗,承包商/分包商为促进建设而使用的所有现场和非现场活动的直接能源、预制、管理及货物运输。此外,建筑物在使用期间,内含能耗也会因家里维修和翻新过程中所使用的货物和服务而不断增加。
在高层大厦中,像大堂、走廊、电梯、机电设备服务中心等公共区域和设施用电都需要被考虑在内,大厦内每个住户依据其单位面积占总建筑面积的比例,被分配相应的份额。相对于个别单元业主,建筑管理所提供的能源种类和支付形式,在不同的高层环境中也有所不同,图9的说明部分会对此进行解释。注:由于无法获取水纹大厦的建筑能源账单,所以,我们省略了这一部分的案例研究。
如图9所示,能源审计的研究结果也许有点令人惊讶,因为每平方米的总能耗在高层建筑和低层建筑这两种情况下大同小异(分别为1258和1202 GJ每年,因此实际在高层建筑中要高出5%)。郊区住宅的总面积越大,意味着在低层建筑中每个住户的能源消耗越大,但相反,家庭中居住的人数越多,意味着在低层建筑中每个人的能源消耗越少。
这个结果或许令人惊讶,当前人们可能会觉得,单户郊区住宅,特别是这个研究项目所主要包括的更旧的住宅类型,不仅宽阔,奢华地占据了大量空间,还存在更多的能源浪费,尤其是表面面积与地板面积比例过高会导致更大的潜在的热损失/增益,而现代的高层建筑有更多的节能建造和建筑服务,并且表面面积与地板面积较低,以及住宅单位之间制热(甚至冷却)共享,因此存在潜在的高受益,可以减少潜在的热损失/增益。不过,虽然这可能在某些环境下属实,但在这里并非如此。或许同样令人惊讶的是,1956年竣工且有着单层玻璃幕墙的联邦大厦,与2009年竣工,有着双层玻璃幕墙和现代化设施的Legacy大厦,这两者之间能源比较的差异并没有更大(新建筑仅比旧的多5%)。
虽然这种异常很大一部分可能与本研究的局限性有关(即高层建筑方案基本上侧重于为富裕的、半退休的、居住在宽大公寓里的人提供),这样的能源消费差异确实很奇怪。当然在数据之后的反思和后续与居民的讨论中,以下两个因素似乎起到了作用:
1. 尽管在更现代的高层建筑中的那些建造和系统,确实比旧的高层单户住宅中的更有效率,也拥有更高的服务水平和设施水平(例如室内泳池,漩涡水疗中心,健身中心,图书馆,公共
Quality of Life (QoL) Indicators
生活质量指标
Downtown High-Rise市中心高层
Suburban Low-Rise郊区低层
Average: 4 Towers
平均值:4座大厦
Oak Park橡树园
Satisfaction with Life Scale (SWLS)
4.18 4.01
Sense of Community Index (SCI)
3.60 3.90
Other Satisfaction Domains
Travel 4.55 4.29
Accessibility 4.76 4.31
Social Integration 4.46 4.19
Safety 4.44 4.2
Overall Residential Environment
4.67 4.28
Volume 1 and 2 book.indb 46 9/12/2016 7:52:52 PM
CTBUH 2016 Shenzhen · Guangzhou · Hong Kong Conference | 2016年CTBUH深圳 · 广州 · 香港国际会议 47
for urban-suburban infrastructure provision (i.e. road surface area and lengths of electrical supply cables, gas supply pipes and water supply pipes), the suburban infrastructure showed an averaged 714% increase over the amount of urban infrastructure, on a per person basis. Quality of Life indicators were comparable across the two scenarios, with the downtown scenarios registering a slightly higher “Satisfaction with Life” and “Overall Residential Satisfaction” scores, and the suburban scenario registering a slightly higher “Sense of Community” score.
Whilst many of these results are perhaps as expected, it is the comparable operating energy across both scenarios that is perhaps the most surprising. Given that many homes in the Oak Park scenario are of old construction and presumably poorly insulated etc, it is surprising that they consume as much energy per square meter as a modern high rise residential building. Whilst some of this can be attributed to the high number of central facilities and amenities operating in a tall building, follow up discussions with some residents have
Characteristics特征
Downtown High-Rise
市中心高层
Suburban Low-Rise
郊区低层 Ratio (%) of Suburban to Urban郊区与城市比例(%)
Average: 4 Towers平均值:4座大厦
Oak Park橡树园
Building Energy
Annual Building Operational Energy 1.26 GJ/m2 1.20 GJ/m2 96%
Initial Building Embodied Energy 10.1 GJ/m2 6.8 GJ/m2 67%
Water Consumption
Annual Water Consumption 17,652 gallon/person 24,266 gallon/person 137%
Travel Behavior
Annual Travel Time 345.1 hrs/person 373.5 hrs/person 108%
Annual Travel Distance (a) 7,803 km/person 10,966 km/person 141%
Annual Travel Distance by Walk/Bike 1,425 km/person 656 km/person 46%
Annual Travel Distance by Automobile 2,050 km/person 6,256 km/person 305%
Annual Travel Distance by Public Transit 1,250 km/person 4,041 km/person 323%
Urban-Suburban Infrastructure
Road Network (Surface) 6.75 m2/person 81.15 m2/person 1202%
Electricity Supply (Cable) 1.28 m/person 6.76 m/person 528%
Gas Supply (Pipe) 0.60 m/person 3.38 m/person 563%
Quality of Life
Water Supply (Pipe) 0.86 m/person 4.85 m/person 564%
Satisfaction with Life Scale Score 4.18 4.01 96%
Sense of Community Index Score 3.60 3.90 108%
Overall Residential Environment Score 4.67 4.28 92%
Note: (a) The total travel distance is the sum of walk/bike + auto + public transit + “other”, but “other” is not list in this final comparison table. 注释:(a)出行总距离为步行/自行车+小汽车+公共交通+“其它”的总和,但“其它”未列为总对照表
Figure 17. Summary of the key findings (Source: Authors)图17. 关键发现总结(开源:作者)
对四座高层建筑及奥克帕克市不同建筑的200多家住宅的内含能源进行非常详细的计算,超出了本研究项目的范围。因此,我们接下来收集了关于高层和低层建筑初始内含能源的所有可获得的公开研究资料(不包括建筑物使用期间的改造与翻新),并且这两个场景设置使用了每平方米初始内含能源的平均值(图10、11)6
。双方设计建立在100年建筑寿命的基础上,使得高层建筑设计每平方米达到年均0.101GJ的产值,低层建筑设计大约要少30%,每平方米达到年均0.068GJ的产值。考虑到高层建筑所配置一些额外系统,以及高空中施加于结构、覆层和环境服务的压力,高层建筑的内含能源相对较高或许本来就在意料之中。
用水量
通过汇总和分析12个月 期间的实际水费账单,我们收集了用水量的数据7。在市中心的高层建筑中,个人住户用水量并没有被测量,无法获得个人的水费账单,因此从建筑管理处收集到的水费单包含了整座大厦的总用水量,包括室内和室外活动。
这样,按照单位面积占总建筑面积的比例计算出了住户用水量的分配(图12)。
研究发现,市中心的高层建筑平均每年消耗34,320加仑的水量,仅是郊区低层住户用水量(87,523加仑)的39%。这可能是由于郊区环境里私人花园占主导地位,当然,郊区每户家庭中的人数也更多。随后我们证实了人数基准的假设。市中心高层建筑每人平均每年用水量为17,652加仑,这个数字更具可比性,是郊区低层建筑家庭每人耗水量(24,266加仑)的73%。
出行和交通
通过问卷调查,我们对每个家庭中每人每周出行的典型情况进行了评估,并由此推测出每月和每年的数据进行比较。所有的交通方式都参与了评估,包括:步行、自行车、汽车,以及3种形式的公共交通——公交、CTA列车(即芝加哥高架铁路与地铁结合的城市轨道交通系统)、区域地铁(类似于Amtrak,一种提供中、长距离的城际铁路服务)。此外,所有典型的出行都包含在内,包括:工作,上学,购物,餐饮娱乐,会见亲友及“其他”(指定如果适用)。
到达每个主要目的地的旅程都计入了两个模型:一次旅行模型和二次旅行模型。在每一个模型中,频率(次/周),旅行时间(分钟),和距离(英里)通过在这个旅程中所涉及的每一种模式进行了核对。对于旅行方式的选择包括步行、自行车、汽车、公共汽车、火车、CTA列车、地铁和“其他”(指定如果适用)。因此,举个例子,问卷允许被调查者这样回答:一周中三天是先步行10分钟,再坐30分钟的火车去上班,另外两天是先骑5分钟自行车,再坐40分钟公交。此外,私家车主和车的类型都参与了调查。
图13总结了城市和郊区家庭每周所有交通方式出行的平均距离,以每户为基础。
正如我们看到的,居住在橡树公园的家庭每周出行次数几乎是居住在市中心家庭的2.5倍(市中心287公里 vs. 郊区700公里),其出行中57%为私人小汽车、37%为公共交通、6%为步行/自行车/“其它”。相反地,居住在市中心的家庭中有65%通过使用小汽车出行、16%通过公共交通、19%通过步行/自行车/“其它”。居住在市中心家庭使用小汽车更多而使用公共交通更少的情况,可能和我们直觉的认知是相反的。但我们必须记住的是,市中心住户使用小汽车的出行距离比郊区住户近得多。居住在市中心的住户小汽车出行主要是用于购物、探访城市之外的地方(而不是工作/娱乐);而更多的步行/自行车出行距离则意味着郊区住户通过公共交通才能实现的行程,市区住户通过步行就可以实现了。
Volume 1 and 2 book.indb 47 9/12/2016 7:52:52 PM

48 Rethinking the City | 反思城市
indicated that a lack of control over the direct household environment (too hot / too cold) is also having a detrimental impact on high rise energy consumption.
By far the biggest difference between urban and suburban “sustainability”, perhaps not surprisingly, seems to be in terms of urban infrastructure provision, with the urban scenario approximately a seventh of that provided in the suburban scenario. Whilst acknowledging that this part of the work was the most difficult to ascertain, and the calculations were far from an exact science, the study shows that it is perhaps this field where the most future work needs to be undertaken – to better understand both the operating and embodied energy of infrastructure provision, and how this can be maximized even further in a concentrated urban environment. Perhaps the most useful concluding statement to this pilot study then would be that all buildings need to take every effort to reduce both the energy expended in their materials / construction, and that consumed in their operation, but that the greatest benefit to sustainable cities of the future seems to be in the benefits of concentrated and shared land use and infrastructure.
Limitations of the Study and Future Research
Overall, this pilot study provides a quantitative comparison of the sustainability implications of Chicago downtown high-rise and suburban low-rise living, based on the collection of real data and best available data in the following areas: (i) home operational energy use, (ii) embodied energy of the dwelling, (iii) home water consumption, (iv) mobility and transport movements, (v) urban/suburban Infrastructure, and (vi) quality of life. It offers an initial understanding of the sustainability of residential life-styles across human, building, and infrastructure scales based on actual case studies in and around Chicago, IL.
Much has been learnt in the undertaking of this pilot study. Whilst work is currently continuing in order to verify all findings and publish the much more in-depth results in the CTBUH Research Report family of publications in early 2017 (see Figure 18), extensive thought is already being given to a more significant Phase 2 of the study, which would embrace a greater number of building types, households, socio-economic groups and, ideally, cities/locations/cultures. The extent of the study is largely dependent on the level of external research funding that can be obtained.
聚焦于评估生活满意度(SWLS)和社区意识指数(SCI)。采用人文科学领域已发表的方法论,包括引入回归分析和其他统计工具,以获得尽可能接近可比结果。调查问卷还包括了其它满意度类别,比如交通、可达性、社会交往、安全和总体居住环境。
也许这并不奇怪,因为参与研究的主要是高层住宅中的富人、白人、半退休的人和富人、白人、郊区的中产阶级家庭,两者都选择生活在他们居住的地方,两部分人的生活质量指标都较高。那些生活在高层建筑有一个SWLS评分更高(4.18比4.01,满分5),而那些生活在郊区的社区感得分更高(3.90比3.6,满分5)。然而,控制人口的差异时,研究发现,居住型(城市和郊区)并不一定显示出相关的社区意识(图16)。相关显示社区意识的因素是家庭规模的研究样本(即,更多的家庭成员数量,更强的社区意识)。
结果总结
图17总结了这项研究的关键性结果,在所有的主要参数中重点关注郊区与城市的价值比例。建筑运营能与内含能以GJ/平方米建筑面积为单位衡量。鉴于所有其他指标都是建立在人均的基础上的,这样避免了因为房屋实际规模,或者说每个家庭的人数不同而导致结果出现偏差。
正如论文相关部分所述,按照每平方米的能量计算,建筑运营能在高层建筑与低层建筑情形下几乎相同。然而低层建筑的建筑内含能大约高层建筑不到。郊区建筑耗水量比市中心建筑大约多出三分之一。住在郊区的人在通勤时间上只比市中心住户多出8%,但实际里程数多出了41%。橡树园的住户的自行车行/步行距离是市中心
在所有情况下,汽车是每户总路程最重要的贡献者。市中心高层住宅家庭平均每周出行的公里数是185.6,约橡树园家庭的46%(399.3公里)。在四个住宅楼中,Legacy 大厦家庭最少依赖汽车出行(131.8公里),也许是因为他们更靠近芝加哥市中心的公共设施。市中心高层住户以步行、自行车和公交出行的平均里程都大于橡树园住户,但通过CTA列车,尤其是地铁的平均出行里程,橡树园住户比市中心的家庭要多得多,大概因为这是从郊区到市区工作的重要通勤方式。在市中心的四栋住宅楼中,联邦广场的家庭出行最依赖步行、自行车和公交(可能是因为他们离CTA /地铁更远),Legacy大厦家庭却最依赖后两种旅行方式(由于完全相反的原因)。
城市/郊区基础设施
城市/郊区基础设施,包括所有需要支持人居的网络和组成;道路、交通、供水、污水处理、电力、照明等。这是这项研究迄今为止最难评估的一部分,一部分原因是在任何城市或郊区方案中所包含的不同基础设施的切损量,还有部分原因是对基础设施所包含能源的评估方法论相对处于婴儿期,缺乏早先发表的研究。要获得市中心和郊区基础设施相对数量和密度的评估,我们标记了两地特定基础设施网络的位置(以图14为例)。此外,还把两地之间网络运行和供应点之间的供给包含在内。
研究的基础设施网络包括(一)道路(表面);(二)供电(供应网长度);(三)供气(供应网长度);(四)供水(供应网长度)。在所有情况下,根据地区总人口对网络进行评估,包括白天由于工作模式切换人口的增益/损失这一因素,来源是公布的人口普查数据(基本上白天在市中心高层的人口增加,白天在郊区的人口减少)。
也许不出所料,这个基础设施供应的评估体现出了城市和郊区之间最大的差异。城市基础设施人均供应在比郊区低得多,这是由于市中心更集中的地理区域,以及更多的人使用基础设施造成的。例如,郊区到城市基础设施供应的每一个网络上以每户为基础上,比例近似如下:(一)道路面积:+2088%;(二)供电网络:+ 917%;(三)供气网络:+978%;(四)供水网络:+980%。
这一领域的研究目前仍在进行并审阅中。这些复杂的评估和上述数据中,产生了诸多重要假设和解释。
生活质量
这部分的研究主要依靠定性,而不是定量和数据,结合问卷调查,通过众多问题,
Figure 18. CTBUH Research Report to be released in 2017 (Source: Authors)图18. 针对本课题的《CTBUH研究报告》将于2017年出版发行(来源:作者)
Volume 1 and 2 book.indb 48 9/12/2016 7:52:53 PM
CTBUH 2016 Shenzhen · Guangzhou · Hong Kong Conference | 2016年CTBUH深圳 · 广州 · 香港国际会议 49
住户的46%,但其机动车里程数是后者的305%,公共交通里程数是后者的323%。考察城市-郊区基础设施供给的四个方面(即:道路面积,电缆长度,燃气供应管与给水管),郊区基础设施的人均拥有量比城市基础设施多出714%。生活质量量表可以在两种情形间作出比较:在市中心, “生活满意度”与“整体居住满意度”都有稍高于郊区的分值;而在郊区,“社区归属感”一项有稍高于市中心的分值。
这些结论可能正如预期一样,相比之下两个案例中运营所耗能源的对比结果也许是最令人意外的了。鉴于橡树园的很多家庭居住建筑破旧,其围护结构的隔绝性想必也不如人意,不过令人惊讶的是它们每平方米消耗的能源竟然和现代化高层建筑一样多。这种现象部分归因于高层建筑中大量中央设备以及便利设施。一些居民指出的对家居环境缺乏直接控制(过冷/过热)也会给高层建筑能耗带来有害的影响。
到目前为止,城市和郊区“可持续化”的最大区别,就城市基础设施方面的投资而言,城市大概是郊区的七分之一,这也许并不令人惊讶。然而这部分工作最难查明,且相关计算远非一门精切的科学,为了更好的理解基础设施供给的运营能耗和内含能耗,以及如何在一个集中的城市环境中将其最大化,研究表明未来可能要在这个领域开展最多的工作。在这个试验性研究中最有用的结语可能是:所有的建筑都需要尽最大努力减少在材料/建造以及在它们运营时消耗的能源,但未来可持续化城市最大的受益点也许来自集中与共享的土地利用和基础设施。
研究的局限性和未来的研究
总体而言,本初步研究提供了芝加哥市区高层和郊区低层生活的一个定量比较、可持续发展的研究结果,根据收集的真实数据和最佳可用的数据,在以下几个方面着手研究:(i)家庭运行能源消耗(ii)住房内含能源(iii)家庭用水消耗(iv)通勤交通活动(v)城市的/郊区的基础设施,以及(vi)生活质量。它以芝加哥,伊利诺伊州及其周边地区的实际案例为基础,通过研究人类、建筑和基础设施规模,提供了一个人居生活方式可持续发展的初步理解。
在该初步研究的进行过程中我们学到了很多,同时,为了验证研究结果,并于2017年初在CTBUH研究报告上发表,工作仍在继续(图18)。更重要的第二阶段研究被赋予了更广泛的思考,将囊括更多的建筑类型、家庭、社会经济团体,以及最理想的是,城市/地点/文化。这项研究的范围很大程度上取决于可获得的外部研究经费。
无论如何,以下因素被公认为迄今为止的研究中重大的局限性,需要在任何后续的研究中加以解决:
局限1:人口特征 抽样调查不代表在芝加哥的城市和郊区的真实人口。如论证的第4部分中,大多数城市和郊区居民是白人(例如,超过87%的居民在这两种情况中都是白人)和富人(例如,超过87%的家庭年收入在这两种情况中都高于芝加哥大都会区的平均家庭收入,在2013年约60,000美元),所以不反映真实的人口差异。这种局限可能会很大程度影响这项研究中的结果/结论。例如,富人可能会消耗更多的能源,并对他们的生活更感到满意,无论住在哪里。
此外,城市和郊区的人口特征差异很大。这些变量包括年龄(例如,市区居民的平均年龄为51.1岁,比橡树园居民大将近20岁),就业状况(例如,更多的退休人员生活在市中心区,约20%,在橡树园只有6%),居住时间(例如,市中心家庭的平均居住时间为7.1年,但在橡树园,这一数字是10.2年),和家庭规模(例如,市中心家庭的平均家庭规模为1.9人,但在橡树园,这一数字是3.3人)。此局限也可能高度影响这项研究中的结果/结论。例如,有一小部分人在市中心的高层建筑居住一个单元,导致了人均面积更大(例如,77m2
芝加哥高层和69m2橡树园低层),这进一步造成了人均运行能耗的研究结果更大。 当然影响本研究的其中一项最大的偏差是在任何转化成以人均为基础的郊区案例中的孩子/家庭的所占比例过高(市中心的住户人口中孩子所占的比例为6%,而橡树园这一比例为38%)。更多的孩子人数,相应地导致了郊区案例的户均人口,这一定程度上影响了最终的比较结果。 未来任何的研究都需要确保在这两种城市形态中的人口特征达到更好的平衡。
局限2:住宅区位 橡树园离芝加哥市中心仅11-16公里,构成了一个相对密集的单户住宅和公寓楼居住区,有步行环境,并多方位加入到多芝加哥的公共交通系统中,如第4部分论证的。因此,橡树园并不代表典型的美国郊区。一个不太密集的偏远郊区如奥罗拉或内珀维尔,在运输能源的意义及基础配套设施方面可能会表现出更明显的对比。
局限3:高层建筑类型 这项研究中的四个住宅楼,特别是水纹大厦和Legacy大厦,比典型的高层建筑更高。具体而言,无论是水纹大厦(262米高,86层)和Legacy大厦(250米高,73层),几乎都可以归类到超高型8,这可能会比普通的高层建筑消耗更多的能量用于电梯、水泵运行系统。此外,水纹大厦和Legacy大厦被认为是芝加哥的豪华住宅建筑,提供了众多高品质的现场管理服务和设施,这当然需要比普通住宅楼更多的运行能源。
局限4:能源数据可用性 由于内含能源(EE)的必要信息(即建筑材料的数量规格)无法获得,这项研究并没有着手进行完整详细的实际建筑EE评估,
Regardless, the following factors are recognized as significant limitations in the study undertaken to date, which need to be addressed in any subsequent studies:
Limitation 1: Pool of Participants The sample is not representative of the true population spectrum in urban and suburban areas of Chicago (or other cities for that matter). The majority of the residents across both urban and suburban scenarios are white (more than 87%) and wealthy (more than 87% of the households’ annual income in both scenarios is higher than the median household income of the Chicago metropolitan area, which was about $60,000 in 2013). This limitation highly affects the study. For example, wealthy people might tend to consume more energy and feel more satisfied with their lives no matter where they live.
Several other demographic characteristics are very different between the urban and suburban scenarios. Those variables include age (the average age of the downtown residents is 51.1 years old, almost 20 years older than Oak Park residents), employment status (e.g., more retired people live in the downtown scenarios, with a 20% share vs. only 6% in Oak Park), and household size (e.g., the average household size of the downtown households is 1.9 people but in Oak Park this figure is 3.3 people). Certainly one of the biggest differences that affected the study, most notably in any assessments translated to a per person basis, was the much higher occurrence of children/families in the suburban scenario (6% of children in the downtown scenarios versus 38% in Oak Park). This higher number of children, and consequently people per household in the suburban scenario, skewed results somewhat. Any future research needs to ensure a better balance of demographics across both scenarios.
Limitation 2: Residential Location Located only 11-16 km from Chicago city center, Oak Park constitutes a relatively dense amalgamation of single-family homes and apartment blocks, with a relatively walkable environment, and is plugged into much of Chicagoland’s public transport system. Thus, Oak Park is not representative of a typical American suburb case though it may be more akin to European or Asian scenarios . A less dense outlying suburb such as Aurora or Naperville would likely show a far more marked contrast with downtown scenarios in the factors embraced in this study.
Limitation 3: High-Rise Building Type Two of the four residential towers in this study, Aqua Tower and the Legacy Building, are taller than typical high-rise residential
Volume 1 and 2 book.indb 49 9/12/2016 7:52:53 PM

50 Rethinking the City | 反思城市
而是广泛参考了已经出版的建筑EE研究。然而,在已发表一些高层建筑研究中,几乎没有住宅,更不幸的是没有一个位于美国。虽然这项研究结果提供了一个完整的市中心高层和郊区低层建筑物EE的合理理解,但如果有市区四个住宅楼基于实际的建筑材料数量和规格的详细EE数据,结果会更准确。
另外,水纹大厦不幸被排除在OE分析之外。原因是从建筑管理方面收集到的能源使用数据太有限,无法进行合理的OE分析。因此,高层OE结果不代表所有研究的四栋住宅楼。
局限5:生活质量指标 在衡量生活满意度和社区意识中,只对有限的变量进行了调查和控制。在研究中包含了性别、年龄、收入、家庭规模等人口统计数据,但其他变量也可能影响居民的生活满意度,如个性、健康状况、婚姻状况等,在研究中并未考虑和控制。因此,控制这些有限变量所得出的结果表明市中心高层的居民生活满意度更高,但如果考虑并控制更多的变量,结果可能有很大不同。虽然随机分配居住类型是不实际的或可能涉及到道德伦理,不过为了进一步控制居住类型对生活满意度的影响,我们可以采用更严格的研究方法,如案例控制设计和数据匹配。
后续研究
有兴趣参与本研究的后续阶段(包括提供基金支持),请发邮件与执行理事长安东尼·伍德联系:[email protected].
buildings. Specifically, both Aqua Tower (262-meter tall, 86-story) and the Legacy Building (250-meter tall, 73-story) can be almost categorized into the super-tall category8, which typically consume more operational energy for elevators, water system, pumps, etc. than a more typical high-rise building. Moreover, both Aqua Tower and the Legacy Building are considered as luxury residential buildings in Chicago that offer numerous high-quality on-site management service and amenities, which certainly require much more operational energy than a regular residential tower.
Limitation 4: Energy Data Availability Since the necessary information for an embodied energy (EE) calculation (i.e., quantities and specifications of materials in the buildings) was not available, the research did not undertake a full detailed assessment of the actual EE in the case study buildings, and instead, an extensive literature review on published building EE studies was conducted. However, few of the high-rise cases in the published research studies were residential, and unfortunately none of them were located in the U.S. Although the findings of this study provide a reasonable understanding of the EE of downtown high-rise and suburban low-rise buildings, the result would be more accurate if a detailed EE calculation of all the buildings was conducted based on the actual quantities and specifications of materials in the buildings.
Also, Aqua Tower was unfortunately excluded in the operational energy (OE) analysis since the energy usage data received from its building management was too limited to be used to conduct a reasonable OE analysis. Therefore, the high-rise OE results were not representative of all the four residential towers in this research. Future research should ensure that building management are fully in support of the study and will provide all relevant data.
Limitation 5: Quality of Life Indicators Only limited variables were investigated to measure life satisfaction and a sense of community. Demographics such as gender, age, income, household size, etc. were tested in the study, but other variables that might also influence residents’ life satisfaction, such as personality, health constitution, marriage status, etc. were not considered in the study or controlled for. The research thus shows that residents in downtown high-rises have a higher life satisfaction when controlling for these limited variables, but the results might be very different if more variables are considered.
The Future
For interest in or involvement in future phases of this study, including possible research funding, contact Executive Director, Antony Wood at [email protected].
References: Crawford, R. (2012). An As-Occupied Life Cycle Energy Assessment of a Residential Building. In Proceedings of the 46th Annual Conference of the Architectural Science Association, Gold Coast, Australia, 14–16 November 2012.
Du, P., Wood, A., & Stephens, B. (2016). Empirical Operational Energy Analysis of Downtown High-Rise vs. Suburban Low-Rise Lifestyles: A Chicago Case Study. Energies, 9(6), 445.
Du, P., Wood, A., Stephens, B., & Song, X. (2015). “Life-Cycle Energy Implications of Downtown High-Rise Vs. Suburban Low-Rise Living: An Overview and Quantitative Case Study for Chicago Buildings”, 5(3), 1003-1024.
Du, P., Wood, A., Stephens, B. (2015). Life Cycle Assessment of Urban vs. Suburban Residential Mobility in Chicago. Architecture Research Centers Consortium (ARCC) 2015 Conference Proceedings. 6th – 9th April, 2015. pp.188-195.
Newman, P.W.G.; Kenworthy, J.R. (1989). “Gasoline Consumption and Cities”, J. Am. Plan. Assoc. 55, 24–37.
Norman, J.; MacLean, H.L.; Kennedy, C.A. (2006). “Comparing High and Low Residential Density: Life-Cycle Analysis of Energy Use and Greenhouse Gas Emissions”, J. Urban Plan. Dev. 132, 10–21.
Note: Due to the limitation of the pages of the conference proceedings, the Reference Section here doesn’t include the full references on this study. Full references will be found in the CTBUH Research Report, which will be released in 2017.注:因为受本论文集的篇幅所限,这里的参考文献并没有列出所有的参考资料。完整的参考文献请参见即将在2017年出版的CTBUH研究报告。
8: The Council on Tall Buildings and Urban Habitat (CTBUH) defines “super-tall” as a building over 300 meters (984 feet) in height. The Legacy Building is the current tallest residential building and 13th tallest building in Chicago, and Aqua Tower is the current 5th tallest mixed-used building and 10th tallest building in Chicago. Note: At the time of writing, there are only 106 completed supertall buildings in the world and only 14 of these are purely residential. (Source: CTBUH.)8: 世界高层建筑与都市人居学会(CTBUH)将高度300米(984英尺)及以上的建筑定义为“超高层建筑”。Legacy大厦在芝加哥所有高层建筑中排名第13,住宅型建筑中位列第一。水纹大厦在所有高层建筑中排名第10,多功能高层建筑中排名第5。来源:CTBUH
Volume 1 and 2 book.indb 50 9/12/2016 7:52:53 PM