Building value in Wholesale Banking
21
Building value in Wholesale Banking Isabel Fernandez, Head of Wholesale Banking Investor Day 2019 Frankfurt • 25 March 2019
Transcript of Building value in Wholesale Banking

Building value in Wholesale Banking
Isabel Fernandez, Head of Wholesale Banking
Investor Day 2019
Frankfurt • 25 March 2019

Wholesale Banking overview
2
Underlying result before tax (in € mln)
1,978
2,5332,668
2,846 2,755
9.4%
10.7%10.5%
10.9%
11.4%
Conservative risk profile as senior
and secured lender
One of the most efficient
wholesale banks49% C/I ratio
* ROE based on a 12% CET1 ratio
2014 2015 20172016 2018
2014 2015 20172016 2018
CAGR 8.6%
40+ countries
Sustainability
• 1st bank to start steering loan portfolio to Paris climate goals
• 1st bank launching sustainability improvement loans
• A growing green bonds franchise
Accelerate digitalisation
• Industry leader in the Distributed Ledger Technology (DLT) space
• > 700 IT applications decommissioned
• 30% of primary relationships use our InsideBusiness portal
Wholesale Banking strengths
Underlying return on equity*

• Harmonised cross-border documentation
• Harmonised product offering
• Uniform tooling for client-facing staff
* KYC – Know Your Customer
Our strategic priorities drive primary client growth
3
• 100% of all data in one data lake
• Platform strategy
• Build, partner with or buy innovative solutions
• Leading sustainable finance offering
• Consistency
• Pragmatic approach
• Product-agnostic client teams
• Know Your Customer
• Improve service level across geographies
Leverage the network
Primaryclients
Unleash sector potential
• Sector expertise to expand strategic services
Strengthen the basics
Innovate for the future

Wholesale Banking is accelerating growth in primary clients
4
Number of clients
Share of Primary
Cross-buyProduct value
Value
Active clients 84%Primary clients* 16%
Client segmentation Primary clients Active clients
Average # of products 4.1 1.2
Average # of countries 4.5 1.1
Total revenues** €2.9 bln €2.4 bln
Revenues / RWA 550 bps 350 bps
* Established client relationship with 2 products or more and across 2 countries or more ** Excluding €0.5 bln of revenues from non-Wholesale Bank clients using Wholesale Bank network and products

Commercial excellence
Revenues per client Cross-buy* ratio Fee income / RWA
Profit before tax YoY Increase NPS score**
Primary clients are 5x more profitable
5
Active Primary
14%
24%
Total WB
Primary
5x
Active Primary Active Primary Active Primary
1.6x3x7x
* Cross-buy = non-lending revenues over total revenues** NPS = Net Promoter Score

• >700 applications decommissioned
• Native Language Processing robotics
WB transformation delivering efficiency
6
WholesaleTOM
Support functions
Processes Shared Services
Data
Way ofWorking
IT
• One Agile Way of Working rolled out to 4,500 employees
• 80% of core banking systems connected to the Data Integration Layer
• Organisational redesign in 44 countries
• 2 global operations Shared Service Centres
• Pan-European Daily Banking Desk
• Single account opening process in 18 countries
• Cross-border cash management in 18 countries
• >30 (sub-)processes robotised

Organisation changed to unleash sector potential
7
* TMT - Telecom, Media & Technology
Diversified corporates
Financial Institutions
TMT* & Healthcare
Transportation & Logistics
Energy
Real Estate, Infra & Construction
Commodities, Food& Agri
Energy
20 years of expertise
Sector relevant solutions
Traditional bank
“Buy our products”
Client point of view
“Do you understand my business?”
...
...
Financial markets
Term loans
Payments & Cash Management

We serve clients throughout our network in over 40 countries
8
Asia
18%
45%
37%
32%
27%
41%
EMEA
Americas44%
47%
9%
Incoming revenues (revenues from local subsidiaries of foreign companies)
Local revenues
Outgoing revenues (revenues from foreign subsidiaries of local companies)
Virtual client teams bring our best sector and
product expertise where our clients
are
Client profitability
monitored on a global basis
Geographic and product-agnostic approach

Wholesale Banking total underlying income 2018 diversified across…
…products …geographies …sectors
35%
10%6%
29%
16%
3%
Project and Asset-based Finance excl. TCF
Real Estate Finance
Trade and Commodity Finance (TCF)
General Lending & Transaction Services
Financial Markets
Bank Treasury & Other
Our network ensures a diversified income stream
9
17%
5%
5%
10%
5%7%12%
21%
11%
7%
NL
BeluxGermany
Other Challengers
Growth MarketsUK
European NetworkAmericas
Asia
Other
€5.8bln
€5.8bln
28%
20%
12%
11%
11%
10%
8%
Diversified corporates
Financial Institutions
Commodities, Food & Agri
Energy
Real Estate, Infra & ConstructionTMT & Healthcare
Transportation & Logistics
€5.8bln

Roadmap from current market position
10
Primary clients • Grow primary clients
Income• Lending growth ~2-3% per annum
• Fees to grow faster than NII
Costs
• Further efficiency in running the bank
• Digital first
• Improve sales effectiveness
Efficiency
ROE • Maintain focus on ROE as the key business driver
• Manage RWA density despite regulatory changes
• Careful off-boarding of sub-profitable clients generating RWA
• Slower asset growth and balance sheet actions (higher capital velocity)
RWA (Basel IV & TRIM)
Mitigating actions

Product features, data quality and regulations
Disintermediation and capital relief Income enhancement
General Lending
Industry Lending
Financial Markets
Increase external rating coverage
Basel IV and TRIM mitigants
11
~50% of portfolio matures / is
refinanced before Basel IVRefined collateral
recognition under various IRB* approaches
Data enhancement
Selective capital relief transactions
Significant risk transfers and future flow partnerships
Effective hedging strategies
* IRB – Internal Ratings Based approach
No regret Contingent upon regulations and other actions
PreparingPrepared & ReadyStarted
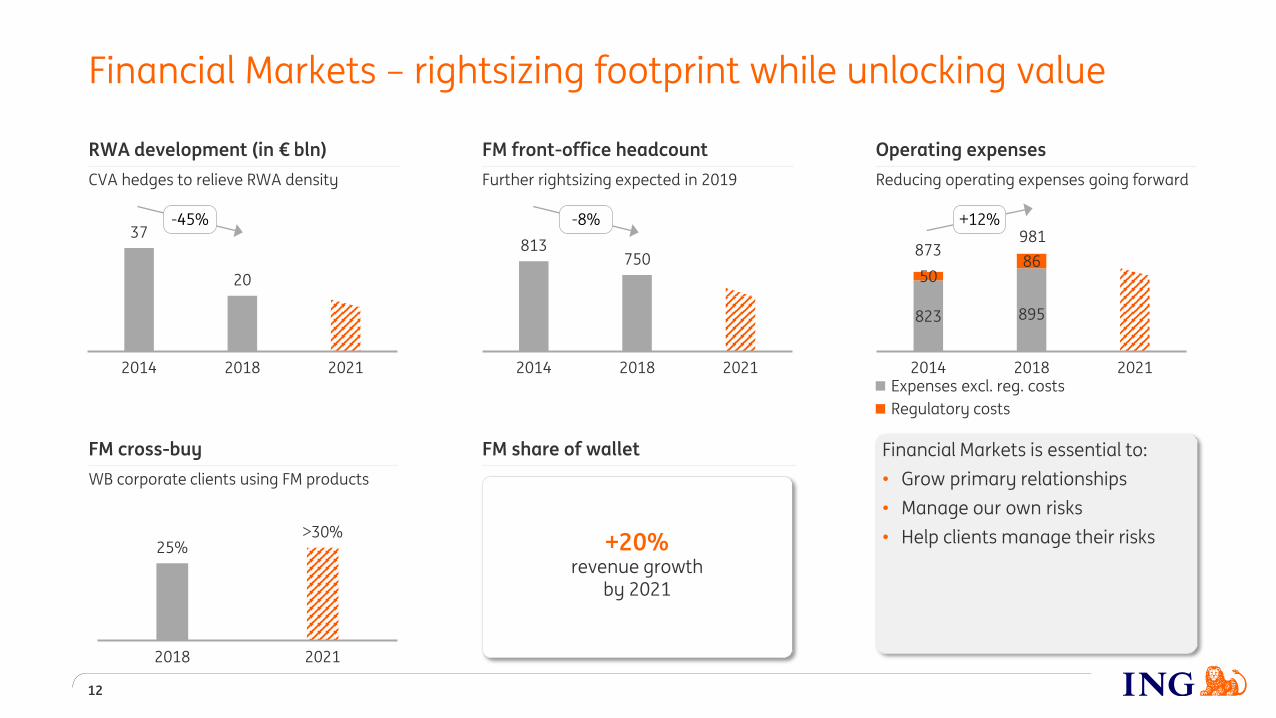
37
20
2014 2018 2021
12
813750
2014 2018 2021
823 895
5086
2014 2018 2021
Financial Markets – rightsizing footprint while unlocking value
Regulatory costs
873981
Expenses excl. reg. costs
+12%-8%
RWA development (in € bln)
CVA hedges to relieve RWA density
FM front-office headcount
Further rightsizing expected in 2019
Operating expenses
Reducing operating expenses going forward
-45%
Financial Markets is essential to:
• Grow primary relationships
• Manage our own risks
• Help clients manage their risks
FM cross-buy
WB corporate clients using FM products
FM share of wallet
25%>30%
2018 2021
+20%revenue growth
by 2021

Innovation to drive value in Wholesale Banking
13
Build
ING and Payvision working together on building frictionless payments
and (beyond) banking experiences
Buy
Merchant Service Platform
>80 payment methods
>150 currencies
Partner
Corporate accounts
aggregator
Cross-border payments
Voltron
Global innovation leader in trade finance
Top 5 in DLT*
Payments
Syndication
Trade PaymentsCash Management
Financial Markets
Bank Mendes Gans
• Pooling; improving visibility on your corporate’s liquidity and interest results
• Netting; efficiency in cross border payments
Katana LENS
Generates data-driven trade ideas
• …alerts of trade opportunities before research analysts recommend the same trade
* DLT – Distributed Ledger Technology. Source: Forbes** €40 mln is the contribution of Net fee and commission income since acquisition at the end of 1Q18
25% Reduction in bond
trading pricing error costs
+58% YoY volume
growth since 2017
€40 mlnNet fee income**
in 2018

Terra: steering our loan book to meet climate goals
14
Terra approach
• Steering our loan book towards the Paris Agreement’s well-below 2˚C-goal
Empowering clients
• Supporting our clients’ technology transition and reduced carbon footprint
Financing impact
• Financing investments needed to transition to a low-carbon society

0.55.5
14.6
0.8
7.1
16.5
1
11
29
Social Impact
Finance
Industry ESG
leaders
Climate finance
2017
2018
Target 2022
We aim to double our Responsible Finance portfolio by 2022 (in € bln)
We are a leader in the growing ESG debt market
15
Global annual sustainable debt issuance* Strong momentum with WB clients
> 40 Sustainability improvement loan mandates
since 2017**~€220 bln€4
bln
Euro Green Bond League Table (Ex-SSA)*
160
2012
Ranking #3
# issues
20182012 2018
* Source: Bloomberg** Product launched in 2017; +50% of mandates in a role as sustainability coordinator
7.0%
5.9%
5.4%
4.7%
4.5%
4.5%
3.4%
2.8%
2.7%
2.4%
Peer 1
Peer 2
Peer 3
Peer 4
Peer 5
Peer 6
Peer 7
Peer 8
Peer 9
FY2018 Global Green Loans League Tables*
Market Share34
27
24
20
25
22
16
9
14
11
Number of Green loan transactions in 2018
#ING

Appendix
16

Primary clients 16%
Daily Banking Value Proposition Strategic Services Value Proposition
Organisation changed to unleash sector potential
17
TMT* & Healthcare
Transportation & Logistics
Diversified corporates
EnergyReal Estate, Infra
& ConstructionFinancial Institutions
Commodities, Food& Agri
LendingFinancial Markets
CF / GCM / CS&A*SectorTransaction Services
Increased commercial effectiveness
Relationship Manager led virtual client
teams / product agnostic
With specific sector expertise
Focusing to expand primary
relationships
Through two clear value propositions
Active clients 84%
* CF – Corporate Finance; GCM – Global Capital Markets; CS&A – Capital Structuring & Advisory; TMT - Telecom, Media & Technology
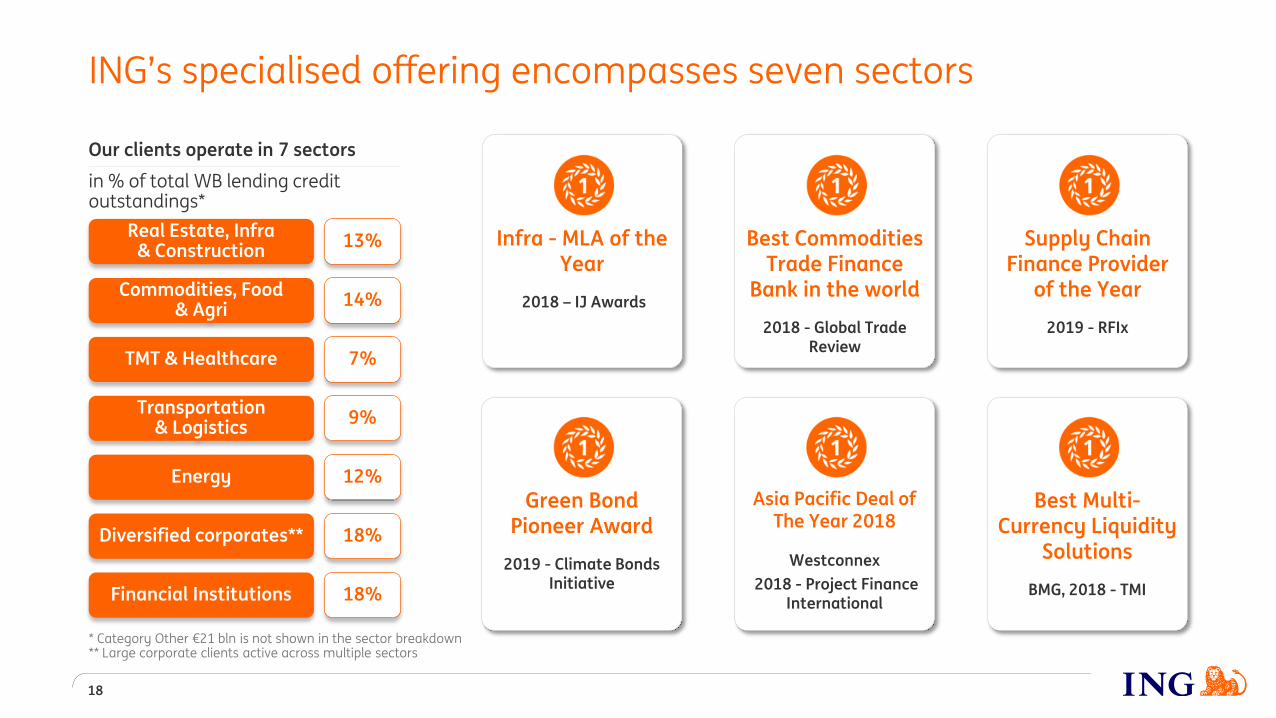
ING’s specialised offering encompasses seven sectors
18
TMT & Healthcare
Transportation & Logistics
Diversified corporates**
Energy
Real Estate, Infra & Construction
Financial Institutions
Commodities, Food & Agri
7%
9%
18%
12%
13%
18%
14%
Infra - MLA of the Year
2018 – IJ Awards
Our clients operate in 7 sectors
in % of total WB lending credit outstandings*
* Category Other €21 bln is not shown in the sector breakdown** Large corporate clients active across multiple sectors
Supply Chain Finance Provider
of the Year
2019 - RFIx
Best Commodities Trade Finance
Bank in the world
2018 - Global Trade Review
Green Bond Pioneer Award
2019 - Climate Bonds Initiative
Best Multi-Currency Liquidity
Solutions
BMG, 2018 - TMI
Asia Pacific Deal of The Year 2018
Westconnex
2018 - Project Finance International

80 100
2013 2018
Primary
3.0
2013 2018
Sustainable
Total number of clients Customer lending WB France (in € bln)
League tables
Total revenues WB France*** (in € mln)
Selected sustainable transactions by ING France
Illustrative country example - WB France performance
19
60%
#12 #5
#7 #3
#10 #7
#12 #9
IG syndicated loans*
Green hybrid bondSustainability-linked RCF
Green bondESG-linked RCF
53%47%
France International
€179 mln€159 mln
2013 2018
Lending Non-lending
Collaboration / Network
% of revenues in 2018
IG corporate bonds**
Acquisition Finance deals**
Real Estate Finance deals*
+39%
338
244
x2.3
* Source: Dealogic** Source: Bloomberg*** Revenues made on French clients in France and their subsidiaries across WB network
8.2
3.5
201161
+40

Terra: steering our loan book to meet climate goals
20
Terra• Our strategy to steer our lending book towards the Paris Agreement’s
well-below 2˚C-goal.
Methodology
• Measures needed shift in technology for key sectors against actual and future technologies used by clients
• Developed with 2° Investing Initiative
• Open source – banks around the world are engaged
Progress
• Four large international banks joined our pledge
• Completed analysis of lending exposure to the automotive sector
• Started taking action to help make our mortgage portfolio energy positive
Next steps
• Analyse the other target sectors
• Engage with clients on the findings
• Report on progress

Important legal information
21
ING Group’s annual accounts are prepared in accordance with International Financial Reporting Standards as adopted by the European Union (‘IFRS-EU’). In preparing the financial information in this document, except as described otherwise, the same accounting principles are applied as in the 2018 ING Group consolidated annual accounts. All figures in this document are unaudited. Small differences are possible in the tables due to rounding.Certain of the statements contained herein are not historical facts, including, without limitation, certain statements made of future expectations and other forward-looking statements that are based on management’s current views and assumptions and involve known and unknown risks and uncertainties that could cause actual results, performance or events to differ materially from those expressed or implied in such statements. Actual results, performance or events may differ materially from those in such statements due to a number of factors, including, without limitation: (1) changes in general economic conditions, in particular economic conditions in ING’s core markets, (2) changes in performance of financial markets, including developing markets, (3) potential consequences of the United Kingdom leaving the European Union or a break-up of the euro, (4) changes in the fiscal position and the future economic performance of the US including potential consequences of a downgrade of the sovereign credit rating of the US government, (5) potential consequences of a European sovereign debt crisis, (6) changes in the availability of, and costs associated with, sources of liquidity such as interbank funding, (7) changes in conditions in the credit and capital markets generally, including changes in borrower and counterparty creditworthiness, (8) changes affecting interest rate levels, (9) inflation and deflation in our principal markets, (10) changes affecting currency exchange rates, (11) changes in investor and customer behaviour, (12) changes in general competitive factors, (13) changes in or discontinuation of ‘benchmark’ indices, (14) changes in laws and regulations and the interpretation and application thereof, (15) changes in compliance obligations including, but not limited to, those posed by the implementation of DAC6, (16) geopolitical risks, political instabilities and policies and actions of governmental and regulatory authorities, (17) changes in standards and interpretations under International Financial Reporting Standards (IFRS) and the application thereof, (18) conclusions with regard to purchase accounting assumptions and methodologies, and other changes in accounting assumptions and methodologies including changes in valuation of issued securities and credit market exposure, (19) changes in ownership that could affect the future availability to us of net operating loss, net capital and built-in loss carry forwards, (20) changes in credit ratings, (21) the outcome of current and future legal and regulatory proceedings, (22) operational risks, such as system disruptions or failures, breaches of security, cyber-attacks, human error, changes in operational practices or inadequate controls including in respect of third parties with which we do business, (23) risks and challenges related to cybercrime including the effects of cyber-attacks and changes in legislation and regulation related to cybersecurity and data privacy, (24) the inability to protect our intellectual property and infringement claims by third parties, (25) the inability to retain key personnel, (26) business, operational, regulatory, reputation and other risks in connection with climate change, (27) ING’s ability to achieve its strategy, including projected operational synergies and cost-saving programmes and (28) the other risks and uncertainties detailed in this annual report of ING Groep N.V. (including the Risk Factors contained therein) and ING’s more recent disclosures, including press releases, which are available on www.ING.com. (29) This document may contain inactive textual addresses to internet websites operated by us and third parties. Reference to such websites is made for information purposes only, and information found at such websites is not incorporated by reference into this document. ING does not make any representation or warranty with respect to the accuracy or completeness of, or take any responsibility for, any information found at any websites operated by third parties. ING specifically disclaims any liability with respect to any information found at websites operated by third parties. ING cannot guarantee that websites operated by third parties remain available following the publication of this document, or that any information found at such websites will not change following the filing of this document. Many of those factors are beyond ING’s controlAny forward looking statements made by or on behalf of ING speak only as of the date they are made, and ING assumes no obligation to publicly update or revise any forward-looking statements, whether as a result of new information or for any other reason.This document does not constitute an offer to sell, or a solicitation of an offer to purchase, any securities in the United States or any other jurisdiction.