BUILDING - agilent.com · For teaching purpose only March 8, 2016 1 BUILDING. BETTER SCIENCE....
46
For teaching purpose only March 8, 2016 1 BUILDING BETTER SCIENCE AGILENT AND YOU Fundamentals of Atomic Spectroscopy: Hardware
Transcript of BUILDING - agilent.com · For teaching purpose only March 8, 2016 1 BUILDING. BETTER SCIENCE....
For teaching purpose only
March 8, 2016
1
BUILDINGBETTER SCIENCEAGILENT AND YOU
Fundamentals of Atomic Spectroscopy: Hardware

For teaching purpose only
March 8, 2016
2
Agilent is committed to the educational community and is willing to provide access to company-owned material.
This slide set was created by Agilent for teaching purposes only.
If you wish to use the pictures, sketches, or drawings for any other purpose, please contact Agilent first.

March 8, 2016
For teaching purpose only
3
Table of Contents
Introduction• Classification• General• Timeline of Early Developments• What’s Measured?
Atomic Spectroscopy Techniques• Atomic Absorption Spectroscopy
− Principles of Operation− General Set Up− Lamp− Atomizer− System− Examples
Atomic Spectroscopy Techniques• Atomic Emission Spectroscopy
− General− MP-AES− ICP-OES− ICP-MS
− General Set Up− System
− Examples• Summary• Further Information

March 8, 2016
For teaching purpose only
4
Spectroscopy is a broad field with many subdisciplines, which can be classified by the type of material being analyzed. This presentation will focus on the first category, atomic spectroscopy.
IntroductionClassification
ToC
ATOMSAtomic spectroscopy• AAS• MP-AES• ICP-OES• ICP-MS
MOLECULESMolecular spectroscopy• UV-VIS• UV-VIS-NIR• FTIR• Fluorescence
CRYSTALS• X-ray
crystallography
NUCLEI• Nuclear
magnetic resonance
March 8, 2016
For teaching purpose only
5
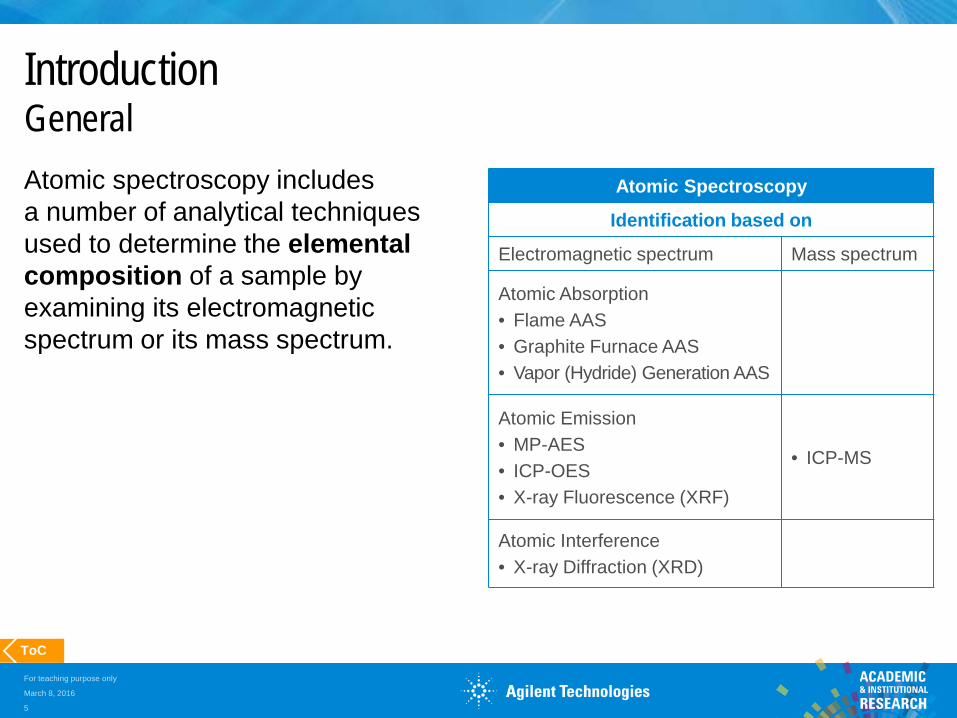
Atomic Spectroscopy
Identification based on
Electromagnetic spectrum Mass spectrum
Atomic Absorption• Flame AAS• Graphite Furnace AAS• Vapor (Hydride) Generation AAS
Atomic Emission• MP-AES• ICP-OES• X-ray Fluorescence (XRF)
• ICP-MS
Atomic Interference• X-ray Diffraction (XRD)
IntroductionGeneralAtomic spectroscopy includes a number of analytical techniques used to determine the elemental composition of a sample by examining its electromagnetic spectrum or its mass spectrum.
ToC
March 8, 2016
For teaching purpose only
6
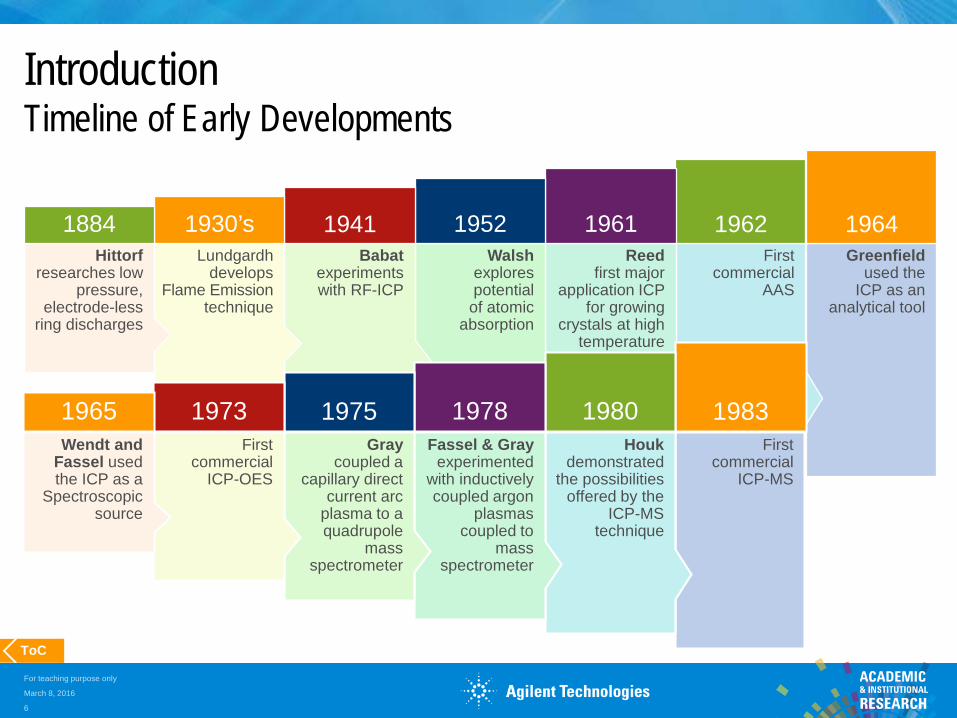
IntroductionTimeline of Early Developments
ToC
Greenfieldused the
ICP as an analytical tool
1964First
commercial AAS
1962Reed
first major application ICP
for growing crystals at high
temperature
1961Walsh
explores potential
of atomic absorption
1952Babat
experiments with RF-ICP
1941Lundgardh
develops Flame Emission
technique
1930’sHittorf
researches low pressure,
electrode-less ring discharges
1884
First commercial
ICP-MS
1983Houk
demonstrated the possibilities
offered by the ICP-MS
technique
1980Fassel & Gray
experimented with inductively coupled argon
plasmas coupled to
mass spectrometer
1978Gray
coupled a capillary direct
current arc plasma to a quadrupole
mass spectrometer
1975First
commercial ICP-OES
1973Wendt and
Fassel used the ICP as a
Spectroscopic source
1965

March 8, 2016
For teaching purpose only
7
IntroductionWhat’s Measured?
ToC
1. Absorption of energy causes an electron to move to a higher energy level (E2) AA
2. The excited electron will eventually drop back to the ground state and emit light at a particular wavelength (emission) MP-AES, ICP-OES
3. If there is enough energy, the electron will leave the atom completely and leave behind a positively charged ion (ionization) ICP-MSElectron
Nucleus
Emission
E2
E1
See notes for details

March 8, 2016
For teaching purpose only
8
Atomic Absorption SpectroscopyPrinciples of Operation
ToC
Atomic absorption spectroscopy (AAS) techniques rely on the fact that an atomized element will absorb light of a characteristic wavelength, elevating it from the ground state to an excited state.
The amount of light energy absorbed is proportional to the number of analyteatoms in the light path.
The technique is calibrated by introducing known concentrations of analyte atoms into the light path and plotting the absorption versus concentration curve.
March 8, 2016
For teaching purpose only
9
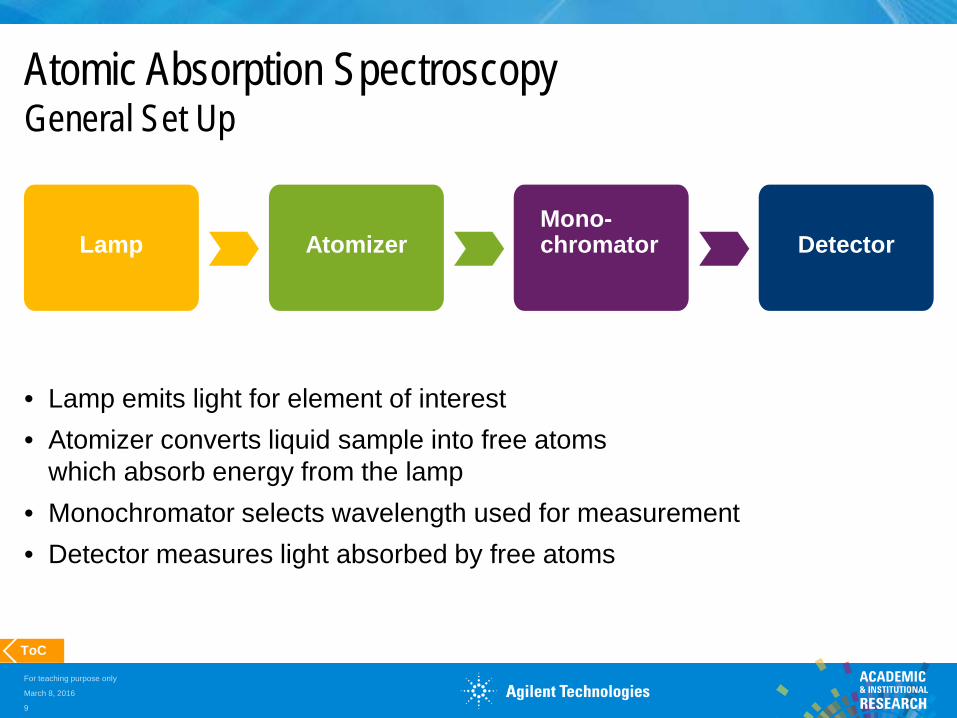
Atomic Absorption SpectroscopyGeneral Set Up
• Lamp emits light for element of interest• Atomizer converts liquid sample into free atoms
which absorb energy from the lamp• Monochromator selects wavelength used for measurement• Detector measures light absorbed by free atoms
ToC
Lamp AtomizerMono-chromator Detector

March 8, 2016
For teaching purpose only
10
The source of light primarily used with the atomic absorption technique is the hollow cathode lamp (HCL).
Typically each lamp is dedicated to the analysis of a single element, though in some cases a few elements can be combined into a single lamp.
Because of this limitation, atomic absorption is typically used for analysis of either a single element or a small number of elements.
ToC
Typical hollow cathode lamp construction
Cathode
AnodeGetter spot
Pyrexenvelope
Electrical contacts
Atomic Absorption SpectroscopyLamp
See notes for details

March 8, 2016
For teaching purpose only
11
Atomic Absorption SpectroscopyAtomizer Atomization is the process that converts a liquid sample into free atoms.
The diagram shows the different steps that occur during atomization, starting with the element being prepared as a solution.
Element M undergoes different stages:• Solution: MAliquid (compound)• Nebulization: MAliquid (compound)• Desolvation: MAsolid (A = solution anion)• Vaporization: MAgas
• Atomization: M0
• Excitation: M*• Ionization: M+
ToC
Light beam
AtomizationVaporizationLiquid melt
Solid
Aerosol
Free atoms
Compounddecomposition
Desolvation
Mixing
Nebulization
DropletprecipitationSolution

March 8, 2016
For teaching purpose only
12
Atomic Absorption SpectroscopyAtomizer
ToC
+
-+ energy
M0 M+ M0+E -E
Groundstate
Excited state
Groundstate
- energy
Atoms can absorb discrete amounts of energy:• Heat• Light at discrete wavelengths
An electron may change energy levels• An atom can pick up (absorption)
or release (emission) energy. • Atom becomes “excited”• Excitation is explained by the
transition of an electron from an inner orbit (higher energy) to an outer orbit.
March 8, 2016
For teaching purpose only
13
ToC
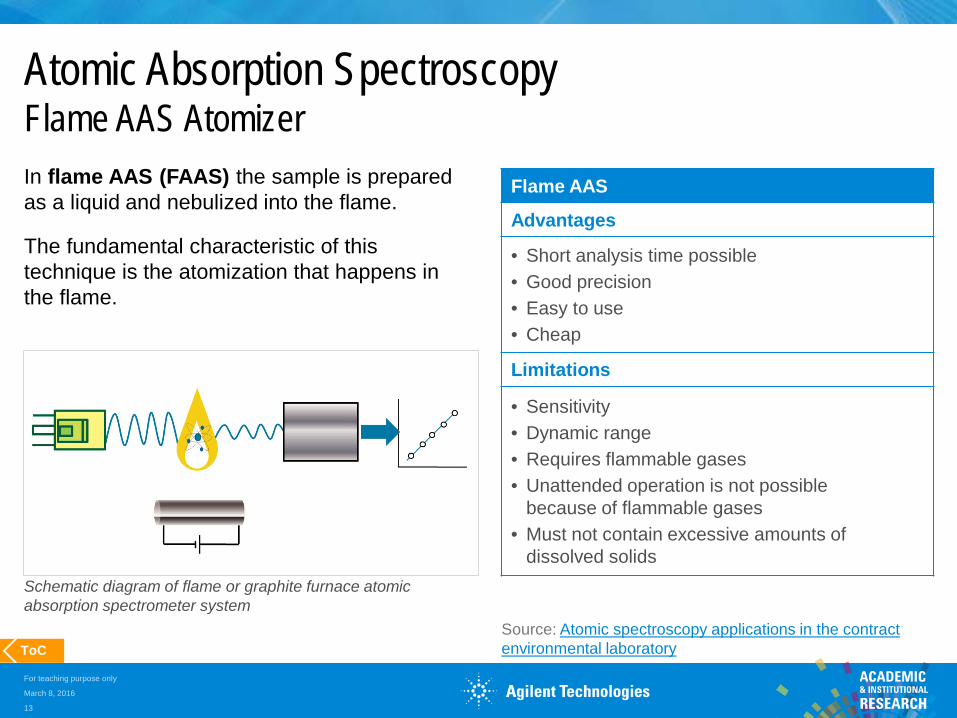
Atomic Absorption SpectroscopyFlame AAS Atomizer In flame AAS (FAAS) the sample is prepared as a liquid and nebulized into the flame.
The fundamental characteristic of this technique is the atomization that happens in the flame.
Schematic diagram of flame or graphite furnace atomic absorption spectrometer system
Flame AAS
Advantages
• Short analysis time possible• Good precision• Easy to use• Cheap
Limitations
• Sensitivity• Dynamic range• Requires flammable gases• Unattended operation is not possible
because of flammable gases• Must not contain excessive amounts of
dissolved solids
Source: Atomic spectroscopy applications in the contract environmental laboratory

March 8, 2016
For teaching purpose only
14
ToC
Atomic Absorption SpectroscopyGraphite Furnace AAS Atomizer Dissolution of sample into a liquid form is required in most cases.
Sample is injected into a graphite tube and electrothermally heated in different stages to atomize the analyte.
In graphite furnace atomic absorption (GFAAS) the atomization happens in three stages: • Drying• Ashing • Atomization
Graphite furnace operation is a complemen-tary technique to conventional flame AA and adds some advantages to the analysis.
Graphite furnace
Advantages
• High sensitivity due to− entire sample is atomized at one time− free atoms remain in the optical path longer
• Reduced sample volume • Ultra trace analysis possible• Can run unattended, even overnight
Limitations
• Very slow• Fewer elements can be analyzed• Poorer precision• More chemical interferences (compared to flame
AA)• Method development requires skill• Standard additions calibration required more
frequently (compared to flame AA)• Expensive consumables (graphite tubes)

March 8, 2016
For teaching purpose only
15
Atomic Absorption SpectroscopyGraphite Furnace AAS Atomizer The graphite tube sits in this apparatus which supplies an inert gas and a powerful to heat the tube, which then desolvates and atomizes the sample.
ToC

March 8, 2016
For teaching purpose only
16
Atomic Absorption SpectroscopyElemental Coverage in AAS
H Flame Only He
Li Be Flame & Furnace B C N O F Ne
Na Mg Al Si P S Cl Ar
K Ca Sc Ti V Cr Mn Fe Co Ni Cu Zn Ga Ge As Se Br Kr
Rb Sr Y Zr Nb Mo Tc Ru Rh Pd Ag Cd In Sn SB Te I Xe
Cs Ba La Hf Ta W Re Os Ir Pt Au Hg Tl Pb Bi Po At Rn
Fr Ra Ac
Ce Pr Nd Pm Sm Eu Gd Tb Dy Ho Er Tm Yb Lu
Th Pa U Np Pu AM Cm Bk Cf Es Fm Mo No Lr
ToC

March 8, 2016
For teaching purpose only
17
Atomic Absorption SpectroscopyOther AtomizersHydride generation techniqueSuitable for elements forming volatile hydrides (As, Sn, Bi, Sb, Te, Ge and Se) when reacted with a reducing agent, such as sodium borohydride.
Advantages
• Separation of specific elements as hydrides which can eliminate matrix interference
• Good sensitivity due to 100% sampling efficiency• Good precision• Faster than graphite furnace AA
Limitations
• Limited to specific elements• Some chemical interferences• Requires specific sample preparation (analyte
must be converted to a specific oxidation state)
Cold vapor technique Used specifically for mercury (has a large enough vapor pressure at ambient tempera-ture) which can be reduced to atomic state by a strong reducing agent, such as sodium borohydride, tin (II) chloride).
Advantages
• Eliminates many matrix interferences• Good sensitivity due to 100% sampling efficiency• Good precision• Faster than graphite furnace AA
Limitations
• Limited to mercury only• Mercury must be stabilized in solution
ToC

March 8, 2016
For teaching purpose only
18
Atomic Absorption SpectroscopySystem
ToC
Key Applications• Determination of trace metals/
impurities in oil, plants, water• Analysis of elements in fluids,
water, soil, food, serum, semiconductor material
• And many more

March 8, 2016
For teaching purpose only
19
ExampleFlame AAS: Determination of Low Levels of Gold in Mineral Ore
ToC
Wavelengthused (nm)
Characteristic concentration
(mg/L)
Detection limit
(mg/L)242.8 0.079 0.0054
267.6 0.14 0.0098
Flame AAS results for Au in mineral ore
Source: Extending the Analytical Range for Gold Using Agilent UltrAA Lamps

March 8, 2016
For teaching purpose only
20
ExampleGF AAS: Measuring Cd, Cu, Pb, Co, Ni in Marine Invertebrates
Signal graphics for Ni in CRM 786 R Mussel Tissue
ToCSource: Sequential Determination of Cd, Cu, Pb, Co and Ni in Marine Invertebrates by Zeeman GFAAS

March 8, 2016
For teaching purpose only
21
ExampleHydride Generation AAS: Determination of As, Sb and Se
Source: Determination of As, Sb and Se in Difficult Environmental Samples by Hydride GenerationToC
Sample preparation for As and SbOne sample preparation for both elements: 5 mL sample placed in 50 mL volumetric,25 mL HCl added.
• Mixed and cooled. 5 mL 20% urea added• Mixed and cooled. 2.5 mL 20% KI added• Diluted to mark with D.I. water.• Analyzed for As and Sb after 30 minutes
Sample Conc. (ppb) %RSD Mean absBlank 0.0 0.008
Standard 1 2.0 2.0 0.062
Standard 2 5.0 0.9 0.148
Standard 3 10.0 0.6 0.262
Standard 4 20.0 1.0 0.455
Standard 5 40.0 0.4 0.70
Sample preparation and typical calibration data for As using hydride generation

March 8, 2016
For teaching purpose only
22
Atomic Emission SpectroscopyGeneral Due to the limitations in AAS, techniques that don’t require dedicated lamps for each element have come into use. These techniques, called atomic emission spectroscopy (AES), rely on the fact that once an atom of a specific element is excited (as in atomic absorption), it emits light in a characteristic pattern of wavelengths (an emission spectrum)as it returns to the ground state.
The flame is not an ideal excitation source for atomic emission. Therefore hotter sources are used.
We will discuss the following techniques:• Microwave plasma atomic emission spectroscopy (MP-AES) • Inductively coupled plasma optical emission spectroscopy (ICP-OES)
ToC

March 8, 2016
For teaching purpose only
23
Atomic Emission SpectroscopyMicrowave Plasma Atomic Emission SpectroscopyNitrogen plasma is used to desolvate, atomize, and excite the atoms in the liquid sample that has been nebulized into it. The nitrogen plasma is considerably hotter (up to 5,000o K) than the air-acetylene flame used in AA.
The atomic emission is quite strong for most elements, leading to improved detection capability and linear dynamic range over flame AA for most elements.
The intensity of the light emitted is measured using optical detection at the wavelengths characteristic of the elements of interest.
MP-AESAdvantages
• Safe (no flammable gas)• Low operating costs as nitrogen can
be extracted from compressed air using a nitrogen generator
• No lamps required for analysis• Identification and quantitation of virtually
all metals and many metalloids.• Better performance than flame AASLimitations
• Higher initial cost than AAS• More interferences compared with flame AA
(including spectral interferences)• Not as sensitive as graphite furnace AAS or
ICP-MS• Not as productive as ICP-OES• No isotope determination
ToC

March 8, 2016
For teaching purpose only
24
Microwave Plasma Atomic Emission SpectroscopySystemKey Applications• Trace elements in geological
samples• Metals in soil extracts• Major elements in food and
beverages• Analysis of petroleum• Analysis of waste water
ToC
Waveguide
Sample introduction system Torch
Pre-optics
Plasma
Monochromator with CCD detector
Wavelength drive mechanism

March 8, 2016
For teaching purpose only
25
Microwave Plasma Atomic Emission SpectroscopyHow Does It Work?Agilent MP-AES runs from nitrogen extracted from air using a nitrogen generator.• Axial magnetic and radial electrical fields sustain the nitrogen plasma• Sample aerosol is introduced into nitrogen plasma
ToC

March 8, 2016
For teaching purpose only
26
Microwave Plasma Atomic Emission SpectroscopyHow Does It Work?• Axial emission from the nitrogen plasma is directed into the fast-scanning
monochromator optics• Wavelength-specific emissions are detected using a high-efficiency CCD
ToC
March 8, 2016
For teaching purpose only
27
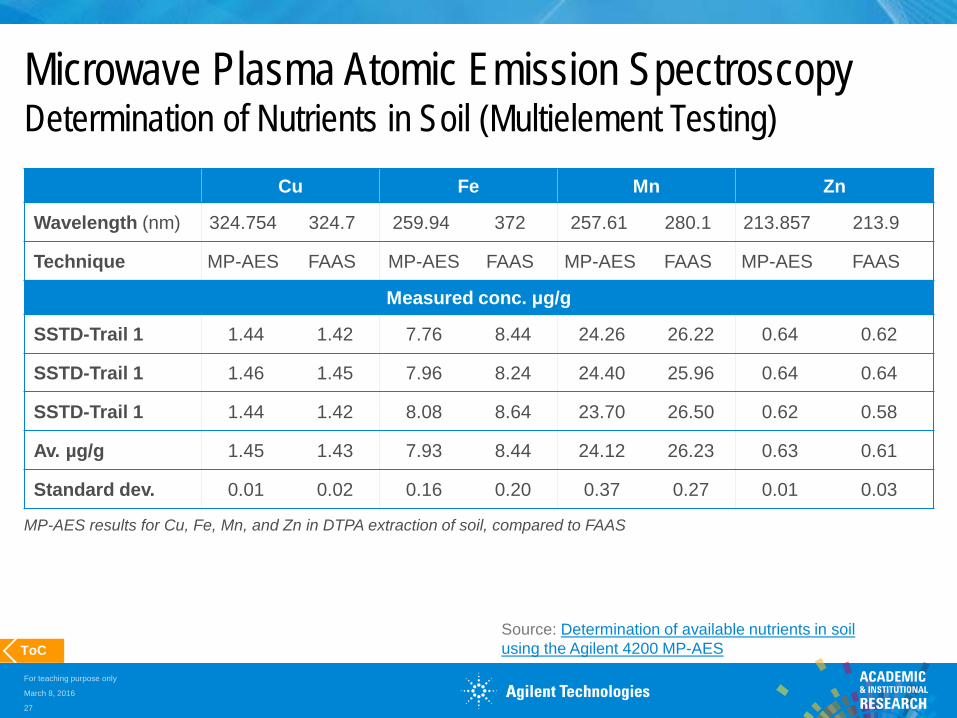
Microwave Plasma Atomic Emission SpectroscopyDetermination of Nutrients in Soil (Multielement Testing)
MP-AES results for Cu, Fe, Mn, and Zn in DTPA extraction of soil, compared to FAAS
ToC
Cu Fe Mn Zn
Wavelength (nm) 324.754 324.7 259.94 372 257.61 280.1 213.857 213.9
Technique MP-AES FAAS MP-AES FAAS MP-AES FAAS MP-AES FAAS
Measured conc. μg/g
SSTD-Trail 1 1.44 1.42 7.76 8.44 24.26 26.22 0.64 0.62
SSTD-Trail 1 1.46 1.45 7.96 8.24 24.40 25.96 0.64 0.64
SSTD-Trail 1 1.44 1.42 8.08 8.64 23.70 26.50 0.62 0.58
Av. µg/g 1.45 1.43 7.93 8.44 24.12 26.23 0.63 0.61
Standard dev. 0.01 0.02 0.16 0.20 0.37 0.27 0.01 0.03
Source: Determination of available nutrients in soil using the Agilent 4200 MP-AES

March 8, 2016
For teaching purpose only
28
Microwave Plasma Atomic Emission SpectroscopyMeasuring Major and Minor Elements in Milk
ToC
Element CertifiedValues (g/kg)
Uncertainty (g/kg)
Result (g/kg)
Recovery (%)
Ca 13.9 0.7 14.21 102
K 17 0.8 16.66 98
Mg 1.26 0.07 1.31 104
Na 4.19 0.23 4.25 101
P 11 0.6 11.27 102
Certified Values (g/kg)
Uncertainty (mg/kg)
Result (mg/kg)
Recovery (%)
Zn 44.9 2.3 45.89 102
Fe 53 4 50.51 95
Cu 5 0.23 5.13 103
Determination of Ca, K, Mg, Na, P, Fe, Zn and Cu in TMAH, Triton X-100, EDTA and ionization buffer by MP-AES 4200
Source: Measuring major and minor elements in milk using the Agilent MP-AES 4200

March 8, 2016
For teaching purpose only
29
Inductively Coupled Plasma Optical Emission SpectroscopyPrinciples of Operation
ICP- OES
Advantages
• Fastest sample throughput• Simultaneous multi-element analysis
(up to 73 elements)• Wide dynamic range (from sub-ppb to % level)• Tolerates complex matrices• Low argon gas consumption• Safe (no flammable gas)
Limitations
• Higher initial costs than AAS or MP-AES• More spectral interferences compared with
MP-AES• Not as sensitive as graphite furnace AAS or
ICP-MS• No isotope determination
ToC
An argon inductively coupled plasma (hotter than MP, up to 10,000o K) is used to desolvate, atomize, and excite the atoms in the liquid sample that has been nebulized into it.
The intensity of the light emitted is measured using optical detection at the wavelengths characteristic of the elements of interest.
ICP-OES is capable of measuring both atomic and ionic emission so more wavelengths can be monitored
These measurements can be compared to a standard to quantify the concentration of the elements in the sample.

March 8, 2016
For teaching purpose only
30
Inductively Coupled Plasma Optical Emission SpectroscopyGeneral Set Up
ToC
Argon plasma Spectrometer Quantification
Simplified schematic diagram of ICP-OES spectrometer system
Plasma torch can be viewed axially or radially. Some “dual view” instruments allow viewing of both orientations, depending on the analysis being performed. (Axial view gives longer path length and thus greater sensitivity.)

March 8, 2016
For teaching purpose only
31
ToC
Inductively Coupled Plasma Optical Emission SpectroscopySystemKey Applications• Monitoring of water/wastewater/solid wastes
• Determination of trace elements in water
• Mercury monitoring in environmental samples
• Quantitative analysis of multiple elements in water/soil/sediment environment samples
• Analysis of soil – analysis of micronutrient content (Agriculture)
• Determination of precious metals and gold
Sample introduction system
Solid State RF
Vertical torch
Electronics
Pumping system

March 8, 2016
For teaching purpose only
32
Inductively Coupled Plasma Optical Emission SpectroscopyAnalysis of Milk Powder
Source: Analysis of milk powders based on Chinese standard method using the Agilent 5100 SVDV ICP-OESToC
Element Certified value (mg/kg) Measured value (mg/kg) Recovery (%)
Major nutrients
K 766.491 13630 13070 96
Ca 315.887 9220 9750 106
P 213.618 7800 7160 92
Na 589.592 3560 3530 99
S 181.792 2650 2650 100
Minor and trace nutrients
Mg 279.078 814 749 92
Zn 202.548 28.0 28.9 103
Sr 421.552 4.35 4.37 101
Fe 259.940 1.8 1.9 107
Cu 327.395 0.46 0.46 100
Mo 204.598 0.29 0.27 92
Mn 257.610 0.17 0.18 103
Analysis of NIST milk powder 8435 SRM using the 5100 SVDV ICP-OES

March 8, 2016
For teaching purpose only
33
Inductively Coupled Plasma Optical Emission SpectroscopyAnalysis of Biodiesel Oil
ToCSource: Analysis of biodiesel oil (as per ASTM D6751 & EN 14214) using the Agilent 5100 SVDV ICP-OES
Element λ(nm)
Background correction
used
Calibration range
(mg/kg)
Correlationcoefficient
MDL (ppm)
Ca 422.673 Fitted 0-2 0.99995 0.004
K 766.491 FACT 0-2 0.99996 0.008
K 766.491 Fitted 0-2 0.99935 0.048
Mg 279.553 Fitted 0-2 0.99994 0.0004
Na 588.995 FACT 0-2 0.99991 0.002
Na 588.995 Fitted 0-2 0.99996 0.048
P 213.618 Fitted 0-2 0.99996 0.013
S 181.972 Fitted 0-2 0.99967 0.31
Calibration curve for P 213.618 nm line, using FBC background correction, shows excellent linearity across the calibrated range, with a correlation coefficient of 0.99986.
Agilent 5100 ICP-OES wavelengths and calibration parameters. All results are shown in solutions.

March 8, 2016
For teaching purpose only
34
Inductively Coupled Plasma Mass SpectrometryGeneralICP-MS combines two advantages:1. Argon ICP as a highly efficient ion source2. A mass spectrometer for fast scanning, high ion transmission and unit
mass resolution
The main difference to ICP-OES is to analyze atomic ions. Most elements have the first ionization potential of 4 to10 eV, which are efficiently ionized in argon ICP.
Ions are passed into the high vacuum region for separation and detection. Photons and neutral species are rejected.
The mass spectrometer separates ions based on their mass-to-charge ratio (m/z).
ToC

March 8, 2016
For teaching purpose only
35
Inductively Coupled Plasma Mass SpectrometryGeneralAn electron multiplier detector generates a pulse for each ion reaching it.
Since the charge on a singly ionized element is 1, the m/z is equal to the mass, so ICP-MS measures the elements as a simple spectrum of characteristic atomic (isotopic) mass from 6Li to 238U.
ToC
ICP-MSAdvantages
• Most sensitive technique• Multi-element analysis• Isotopic information (IR, ID analysis)• Wide dynamic range• Tolerates complex matrices
Limitations
• Less matrix tolerance than ICP-OES• Most expensive technique
(purchase and running costs)• Subject to isobaric interferences
March 8, 2016
For teaching purpose only
36
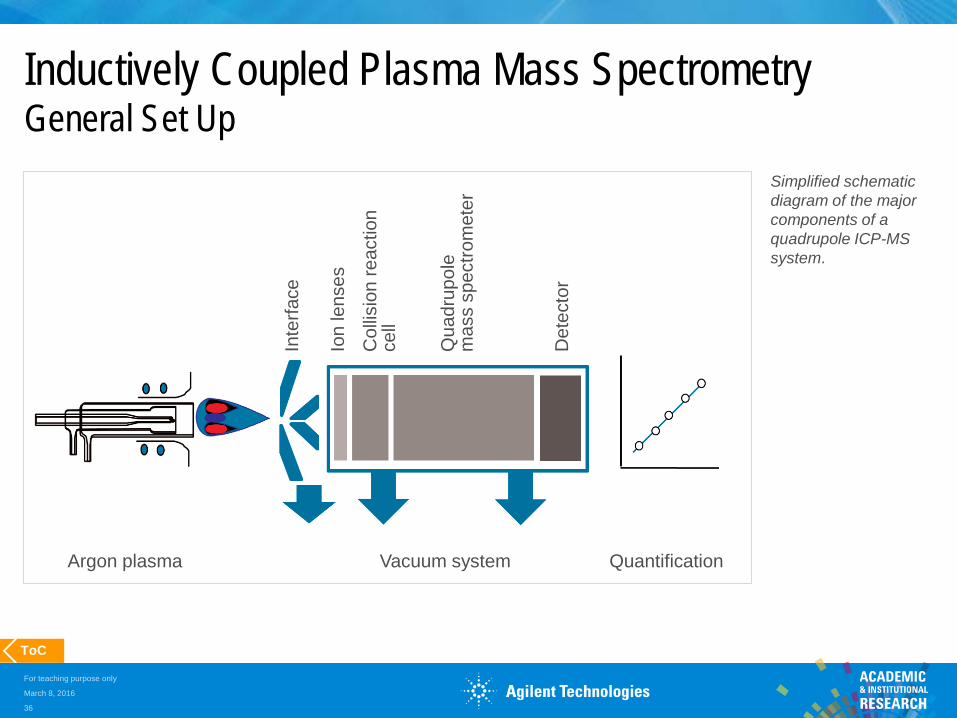
Inductively Coupled Plasma Mass SpectrometryGeneral Set Up
Simplified schematic diagram of the major components of a quadrupole ICP-MS system.
ToC
Argon plasma Vacuum system Quantification
Inte
rface
Ion
lens
es
Col
lisio
n re
actio
n ce
ll
Qua
drup
ole
mas
s sp
ectro
met
er
Det
ecto
r

March 8, 2016
For teaching purpose only
37
Turbo vacuum pump
Detector
Quadrupole mass spectrometer
Octopole reaction cell system (ORS)
Nebulizer andspray chamber
Inductively coupled plasma
RF generator
Peristaltic pump
Inductively Coupled Plasma Mass SpectrometrySystem
ToC

March 8, 2016
For teaching purpose only
38
Inductively Coupled Plasma Mass SpectrometryHow Helium Collision Cell Mode Removes Spectra Interference
ToC

March 8, 2016
For teaching purpose only
39
Inductively Coupled Plasma Mass SpectrometryICP-MS as a Chromatography DetectorIn addition to its common use as a standalone metals analyser, ICP-MS is increasingly applied as a detector for a range of chromatographic separation methods
• Capillary electrophoresis (CE)• Field-flow fractionation (FFF)• Ion chromatography (IC)• Liquid chromatography (HPLC)• Gas chromatography (GC)
In this configuration, the front-end technique separates the different species (with time), and the ICP-MS operates as a mass selective detector to measure the element(s) associated with the compound(s) of interest as they elute from the chromatograph.
ToC
March 8, 2016
For teaching purpose only
40
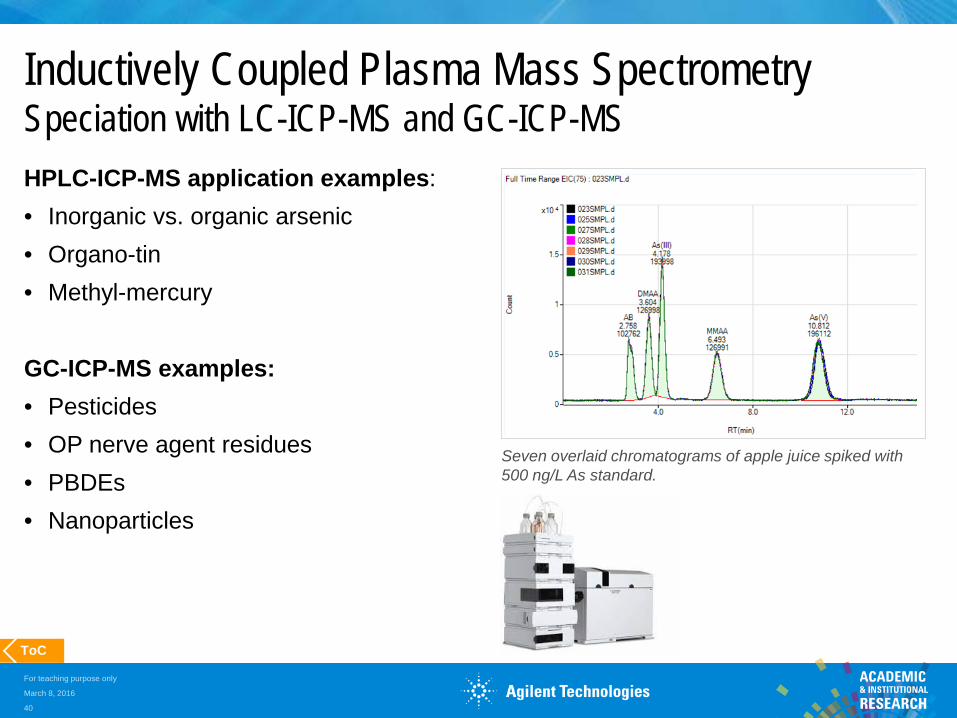
Inductively Coupled Plasma Mass SpectrometrySpeciation with LC-ICP-MS and GC-ICP-MSHPLC-ICP-MS application examples:• Inorganic vs. organic arsenic• Organo-tin• Methyl-mercury
GC-ICP-MS examples:• Pesticides• OP nerve agent residues• PBDEs• Nanoparticles
ToC
Seven overlaid chromatograms of apple juice spiked with 500 ng/L As standard.

March 8, 2016
For teaching purpose only
41
Inductively Coupled Plasma Mass SpectrometryDrinking Water AnalysisMost developed countries have enacted regulations and monitoring programs to ensure that the supply of drinking water is free from potentially harmful chemicals. The fast, multi-element technique of ICP-MS is widely used for this.
ToC
Calibration plot of Cd and Hg

March 8, 2016
For teaching purpose only
42
Inductively Coupled Plasma Mass SpectrometryTrace Metallic Impurity Analysis in High Purity HCl
As, which suffers ArCl+ interference, can be measured at trace levels.
HCl is frequently used to remove metallic impurities on the surface of silicon wafers. The manufacturing process of semiconductor devices requires routine monitoring of ultra-trace contaminants in HCl.
ToCSource: Direct analysis of trace metallic impurities in high purity hydrochloric acid by Agilent 7700s ICP-MS
Element m/z Mode DL ppt BEC ppt
Li 7 cool 0.016 0.004
Be 9 no gas 0.13 0.11
B 11 no gas 4.5 9.7
Na 23 cool 0.44 1.3
Mg 24 cool 0.11 0.22
Al 27 cool 0.79 1.1
K 39 cool/NH3 0.40 0.50
Ca 40 cool/NH3 1.1 2
As 75 He 4.0 16

March 8, 2016
For teaching purpose only
43
SummaryAtomic Spectroscopy Techniques
ToC
AAS MP-AES ICP-OES ICP-MS
FAAS GFAAS SQ QQQ
Detection Limits
100’sppb
10’s-100’sppt
ppb – 10’sppb
100’sppt-ppb
<ppt <ppt
Measurement mode
Sequential Sequential Sequential Simultaneous Sequential(MS)
Sequential(*MS/MS for difficult
interference problems)
Maximum samples/day
100-200(~6
elements)
50-100(~2 elements)
300-500 (~10
elements)
2000-2500(50+
elements)
750-1000(~50 elements)
500-750(~50 elements)
Working dynamic range
3-4 2-3 4-5 7-8 10-11 9
Operator skill required
Low Mid Low Mid High Highest

March 8, 2016
For teaching purpose only
44
Abbreviations
Abbreviation Definition
A absorbance
AAS atomic absorption spectroscopy
AES atomic emission spectroscopy
b path length (cm)
c speed of light (3 × 10⁸ ms-1)
εextinction coefficient or molar absorption (Lmol-1cm-1)
E oscillating electric field
E energy
h Planck’s constant (6.62 × 10⁻³⁴ Js)
I transmitted radiation
I0 incident radiation
Abbreviation Definition
ICP-OES inductively coupled plasma – opticalemission spectroscopy
ICP-MS inductively coupled plasma – atomic mass spectrometry
SQ single quadrupole mass spectrometry
QQQ triple quadrupole mass spectrometry
M oscillating magnetic fields
MP-AES microwave plasma atomic emission spectroscopy
T transmittance
v frequency (s-1)
XRF X-ray fluorescence
XRD X-ray diffraction
ToC
March 8, 2016
For teaching purpose only
45
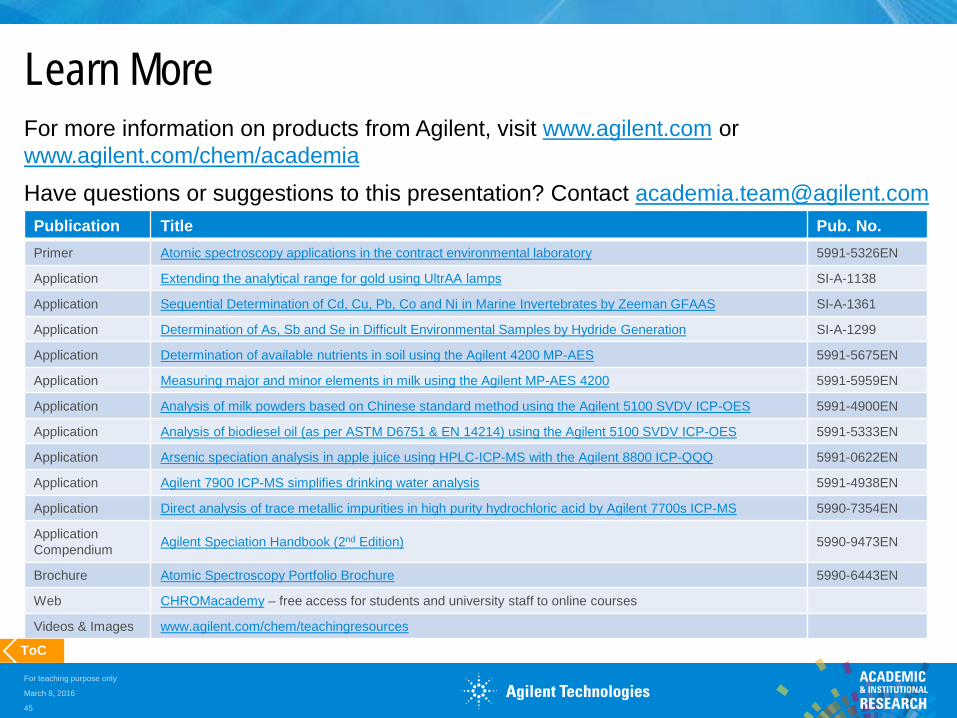
Learn MoreFor more information on products from Agilent, visit www.agilent.com or www.agilent.com/chem/academiaHave questions or suggestions to this presentation? Contact [email protected]
Publication Title Pub. No.Primer Atomic spectroscopy applications in the contract environmental laboratory 5991-5326EN
Application Extending the analytical range for gold using UltrAA lamps SI-A-1138
Application Sequential Determination of Cd, Cu, Pb, Co and Ni in Marine Invertebrates by Zeeman GFAAS SI-A-1361
Application Determination of As, Sb and Se in Difficult Environmental Samples by Hydride Generation SI-A-1299
Application Determination of available nutrients in soil using the Agilent 4200 MP-AES 5991-5675EN
Application Measuring major and minor elements in milk using the Agilent MP-AES 4200 5991-5959EN
Application Analysis of milk powders based on Chinese standard method using the Agilent 5100 SVDV ICP-OES 5991-4900EN
Application Analysis of biodiesel oil (as per ASTM D6751 & EN 14214) using the Agilent 5100 SVDV ICP-OES 5991-5333EN
Application Arsenic speciation analysis in apple juice using HPLC-ICP-MS with the Agilent 8800 ICP-QQQ 5991-0622EN
Application Agilent 7900 ICP-MS simplifies drinking water analysis 5991-4938EN
Application Direct analysis of trace metallic impurities in high purity hydrochloric acid by Agilent 7700s ICP-MS 5990-7354EN
Application Compendium Agilent Speciation Handbook (2nd Edition) 5990-9473EN
Brochure Atomic Spectroscopy Portfolio Brochure 5990-6443EN
Web CHROMacademy – free access for students and university staff to online courses
Videos & Images www.agilent.com/chem/teachingresources
ToC

For teaching purpose only
March 8, 2016
46
ToC
THANK YOU
Publication Number: 5991-6593EN