
BUILDING SCIENCE II: ACOUSTICS AND LIGHTING ANALYSIS OF DONUTES CAFE, SS15
110
-
Upload
joyeelee0131 -
Category
Design
-
view
1.187 -
download
3
Transcript of BUILDING SCIENCE II: ACOUSTICS AND LIGHTING ANALYSIS OF DONUTES CAFE, SS15

SCHOOL OF ARCHITECTURE, BUILDING & DESIGN CENTRE OF ARCHITECTURE STUDIES IN SOUTHEAST ASIA (MASSA)
BACHELOR OF SCIENCE (HONOURS) (ARCHITECTURE) BUILDING SCIENCE 2 (BLD61303)
LEE JO YEE LIM YEE QUN LING HUI SIM LIEW QIAO LI CHUNG WEI JING CHAN PIN QI
031488003191210313855031567103137890314676
TUTOR: MR EDWIN CHAN
PROJECT 1: LIGHTING & ACOUSTIC PERFORMANCE EVALUTION & DESIGN
DONUTES SS 15

1 | P a g e
CONTENTS PAGE
1.0 INTRODUCTION
1.1 Aim and Objective
1.2 Site Information
1.2.1 Site Introduction
1.2.2 Site Selection Reasons
1.2.3 Technical Drawings
2.0 LIGHTING PERFORMANCE EVALUATION
2.1 Literature Review
2.1.1 Architectural Lighting
2.1.2 Daylight Factor
2.1.3 Lumen Method
2.2 Precedent Studies
2.2.1 Introduction
2.2.2 Daylighting
2.2.3 Artificial Lighting
2.2.4 Conclusion
2.3 Research Methodology
2.3.1 Light Measuring Equipment (Digital Lux Meter)
2.3.2 Data Collection Method
2.4 Case Study
2.4.1 Introduction
2.4.2 Zoning
2.5 Existing Lighting Conditions
2.5.1 Existing Light Fixture
2.5.2 Materials
2.6 Lighting Data Analysis
2.6.1 Daytime Lux Reading
2.6.1.1 Zone A
2.6.1.2 Zone B & C
2.6.2 Night Time Lux Reading
2.6.2.1 Zone A
2.6.2.2 Zone B & C
2.6.3 Observation and Discussion
2.7 Lighting Calculation Analysis
2.7.1 Daylight Factor Analysis
2.7.1.1 Zone A
2.7.1.2 Zone B
2.7.1.3 Zone C
2 | P a g e
2.7.2 Artificial Lighting Analysis
2.7.2.1 Zone A
2.7.2.2 Zone B
2.7.2.3 Zone C
2.8 Conclusion
3.0 ACOUSTIC PERFORMANCE EVALUATION
3.1 Literature Review
3.1.1 Architecture Acoustic
3.1.2 Sound Pressure Level (SPL)
3.1.3 Reverberation Time (RT)
3.1.4 Sound Reduction Index (SRI)
3.2 Precedent Studies
3.3 Research Methodology
3.3.1 Acoustic Measuring Equipment
3.3.1.1 Digital Sound Level Meter
3.3.1.2 Camera
3.3.1.3 Measuring Tape
3.3.2 Methodology
3.3.3 Data Collection Procedures
3.4 Case Study
3.5 Existing Noise Sources
3.5.1 External Noise
3.5.1.1 Site Context
3.5.1.2 Vehicles
3.5.2 Internal Noise
3.5.2.1 Human Activities
3.5.2.2 Speakers
3.5.2.3 Air Conditioners
3.5.2.4 Electrical Appliances
3.5.3 Location of the Noise Sources
3.6 Materials and Properties
3.6.1 Furniture Material
3.6.2 Wall Material
3.6.3 Ceiling Material
3.6.4 Floor Material
3.7 Acoustic Tabulation and Analysis
3.7.1 Sound Intensity Level (SIL)
3.7.1.1 Sound Meter Reading of Retail Area (Zone A)
3.7.1.1.1 Peak Period
3.7.1.1.2 Non-Peak Period
3.7.1.1.3 Analysis
3.7.1.2 Sound Meter Reading of Reading Area (Zone B&C)
3 | P a g e
3.7.1.2.1 Peak Period
3.7.1.2.2 Non-Peak Period
3.7.1.2.3 Analysis
3.7.2 Reverberation Time (RT)
3.7.2.1 Zone A-Retail (Peak)
3.7.2.2 Zone A-Retail Area ( Non-Peak)
3.7.2.3 Zone B & C- Reading Area (Peak)
3.7.2.4 Zone B & C- Reading Area ( Non-Peak )
3.7.2.5 Analysis
3.7.3 Sound Reduction Index (SRI)
3.7.3.1 Zone A- Retail Area
3.7.3.1.1 Wall A
3.7.3.1.2 Wall B
3.7.3.2 Zone B & C- Reading Zone
3.7.3.2.1 Wall C
3.7.3.2.2 Wall D
3.7.3.3 Analysis
4.0 BIBLIOGRAPHY

4 | P a g e
CHAPTER
This chapter discuss on the aim and objective of this case study. Besides, this chapter also includes the
introduction of site chosen and reason behind.
1 I N T R O

5 | P a g e
1.0 INTRODUCTION
1.1 Aim and Objective
This Project mainly focus on the lighting and acoustic study of the case study, Donutes
SS15.
Lighting design essential element in architectural design and interior design. Via lighting,
solid volumes, colours, enclosed spaces and textures can only come to sight. Successive
building are building where standard required amount of lighting is achieved.
Acoustic design is an element which concerned with control of sound in spaces
especially enclosed spaces. The requirement varies in accordance to various functions. It is
crucial and essential to enhance the desired sound and to eliminate noise and undesired noise.
This project is mainly exploring students to the way of designing a good lighting system
and good acoustic system via a series of calculation. The objective of the lighting analysis is to
understand the daylighting and lighting besides acoustic characteristic and acoustic requirement
in the case study. Moreover, the study’s objective is to determine the characteristic and function
of the day lighting and artificial lighting and sound & acoustic within the intended space. Finally
is to critically report and analyse the space based on the data collected.
1.2 Site Information
1.2.1 Site Introduction
Donutes, a 24-hours operating bakery and café that is located in the brim of
SS15, Subang Jaya has emerged as the favourite gathering spot for local community,
especially youngsters. Originally from Taiwan, the bakery brand has expanded and
reached the shore of Malaysia in the year of 2013 when its first branch opened in Bandar
Puteri Puchong, followed by the second franchise in Damansara (2014) and the third
one in Subang Jaya (2015). We have chosen this café as our case study not only
because its experience in designing a good café atmosphere and also the high human
traffic in the building.

6 | P a g e
Figure 1.2.1: Exterior of Donutes Café
Figure 1.2.2: Outdoor smoking area
Figure 1.2.3: Interior of the café first floor – reading area

7 | P a g e
CHAPTER
Lighting or illumination is the deliberate use of light to achieve a practical or aesthetic effect. Lighting
includes the use of both artificial light sources like lamps and light fixtures, as well as natural
illumination by capturing daylight. Daylighting using windows, skylights, or light shelves is sometimes
used as the main source of light during daytime in buildings.
2 L I G H T

8 | P a g e
2.1 Literature Review
2.1.1 Architecture Lighting
Importance of Light in Architecture Light is the most important factor in the appreciation and understanding of
Architecture. The relationship between light and architecture is grounded in the principles of physics; it is about energy and matter but in this particular case it also implies an emotional effect on people. The word of space is directly connected to the way light integrates with it. Light interact with us and environment by our vision, experience and interpretation on elements. Based on architecture study, in any dimension we can analyze such as space, material or colour, it is essentially dependent on the lighting situation that involves both the object and the observer. The dynamic daylight and the controlled artificial lighting are able to affect not only distinct physical measurable setting in a space, but also to instigate and provoke different visual experiences and moods. In addition, light can perceive different atmospheres in the same physical environment. It also integrates an element of basic relevance for design of spaces which plays a significant role in the discussion of quality in architecture.
Natural Daylighting & Artificial Electrical Lighting
Natural light has always been important for architects. In a way, architects sculpt buildings in order that the light can play off their different surfaces. If done well, space and light can evoke positive emotional responses in people. Although architects should always strive towards achieving a building which can draw in as much natural daylight as possible, it is almost impossible to go on without electrical lighting taking into consideration in design especially that it need to function both day and night. Moreover, certain building typologies and uses are not suitable for daylighting such as museums and galleries because exposure to natural light could damage the artifacts. It is an important understanding of limitations and opportunities in using natural daylighting as well as artificial lighting and be able to apply it architecturally to achieve the best performing building.
Balance between Science & Art
The balance of science & art will create a visually appropriate light scene accordingly to the character and use of a space .Sciences of light production and luminaire photometric are important as they are balanced with the artistic application of light as a medium in our built environment. Electrical lighting systems and daylighting systems should be integrated together while considering the impacts of it.
There are three fundamental aspects in architectural lighting design for the illumination of building and spaces, including the aesthetic appeal, ergonomic aspect and energy efficiency of illumination. Aesthetic appeal focuses on the importance of illumination in retail environments. Ergonomic aspect is the measurement of how much function the lighting produces. Energy efficiency covers the issue of light wastage due to over illumination which could happen by unnecessary illumination of spaces or over providing light sources for aesthetic purposes. Each of these aspects are important when lighting works are carried out. It allows exploration on the attractiveness of the design by either providing subtle or strong lighting sources which creates different emotions for the users.
9 | P a g e
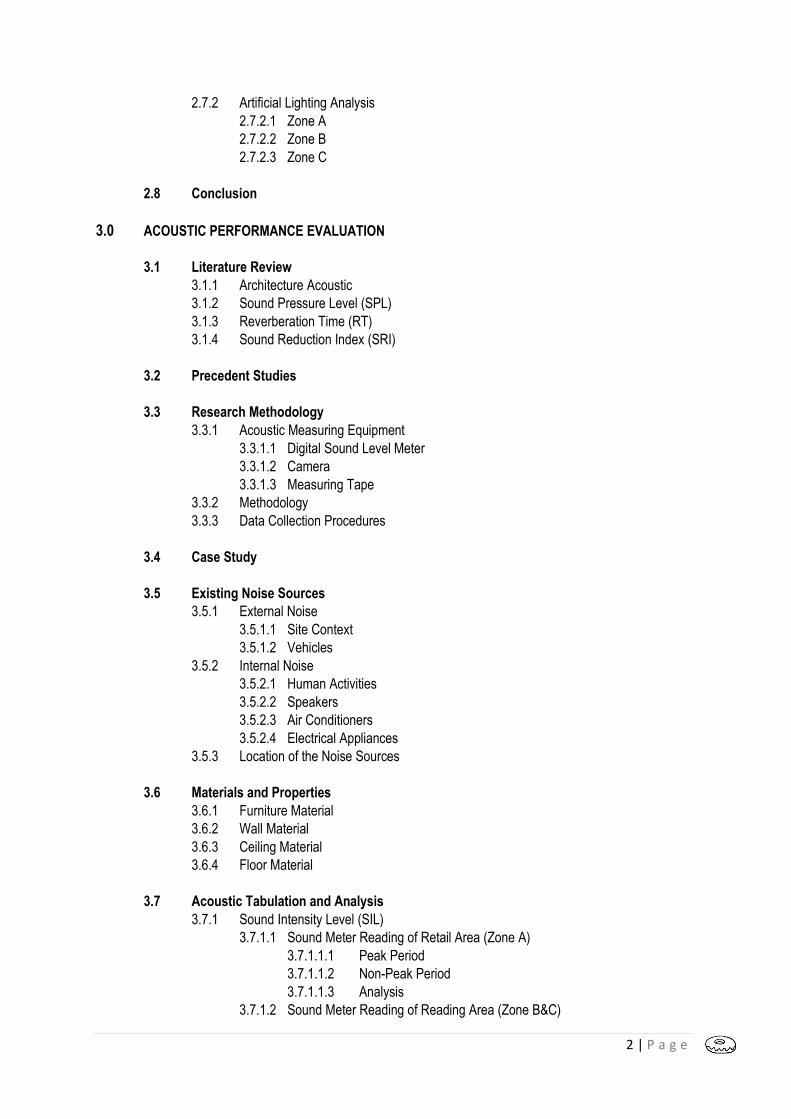
2.1.2 Daylight Factor
It is a ratio that represents the amount of illumination available indoors relative to the illumination present outdoors at the same time under overcast skies. Daylight factor is usually used to obtain the internal natural lighting levels as perceived on a plane or surface, in order to determine the sufficiency of natural lighting for the users in a particular space to conduct their activities. It is also simply known to be the ratio of internal light level to external light level, as shown below:
Daylight Factor, DF Indoor Illuminance, Ei Outdoor Illuminance, Eo
Where, Ei = Illuminance due to daylight at a point on the indoor working planes, Eo = Simultaneous outdoor illuminance on a horizontal plane from an unobstructed hemisphere of overcast sky.
Zone DF (%) Distribution
Very bright > 6 Large (including thermal and glare problem)
Bright 3 – 6 Good
Average 1 -3 Fair
Dark 0 – 1 Poor
Table 2.1 Daylight Factor and Distribution.

10 | P a g e
2.1.3 Lumen Method
Lumen method is used to determine the number of lamps that should be installed in a space.
This can be done by calculating the total illuminance of the space based on the number of fixtures and determine whether or not that particular space has enough lighting fixtures.
The number of lamps can be calculated by the formula below:
Where, N = Number of lamps required E = Illuminance level required (Lux) A = Area at working plane height (m2) F = Average luminous flux from each lamp (lm) UF = Utilisation factor, an allowance for the light distribution of the luminaire and the room surfaces MF = Maintenance factor, an allowance for reduced light output because of deterioration and dirt Room Index, RI, is the ratio of room plan area to half wall area between the working and luminaire planes. Which can be calculated by:
Where, L = Length of room W = Width of room Hm = Mounting height, the vertical distance between the working plane and the luminaire
11 | P a g e
2.2 PRECEDENT STUDY
2.2.1 Introduction
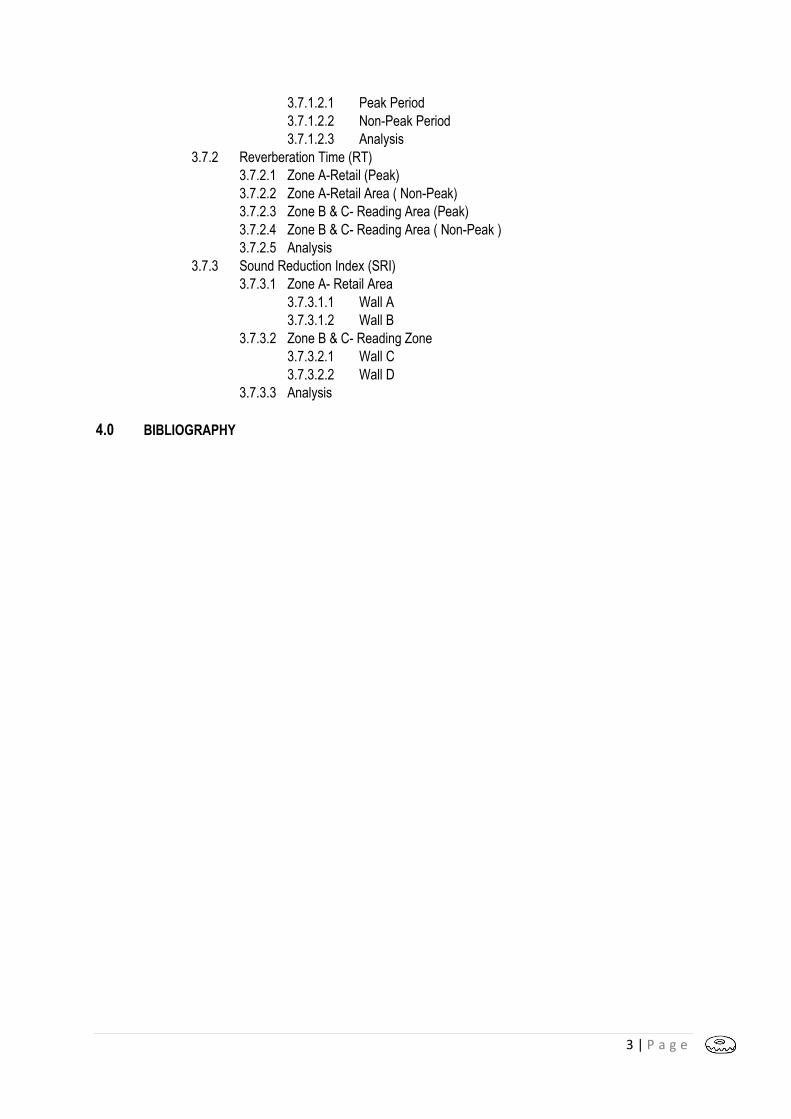
Place: The Netherlands (Zwijndrecht) Building type: Secondary school Contact: Truus de Bruin-Hordijk (Faculty of Architecture, Technical University Delft, The Netherlands)
Measurements were done in two classrooms. Classroom A, which is facing North-West, is
experienced as dark by teachers. Another classroom B, which is facing South-East, is experienced
bright by teachers. The judgement of the lighting expert is negative for classroom A and is neutral for
classroom B. Both classrooms have grey walls and much furniture in it (Figure 2.2.1). Dimensions of
the classrooms are: 7.2 x 7.2 x 3 m3. These are normal standard dimensions for primary and
secondary classrooms in The Netherlands.
Figure 2.2.1 Classroom B (window side and corridor side)

12 | P a g e
2.2.2 Daylighting
The daylight factors were measured on 23 September 2008 by a (not complete) overcast sky.
Table 2.2.1 and 2.2.2 show the daylight situation of the classrooms with daylight factors measured on a
regular grid on table height (0.75 m). Table 2.2.3 shows the daylight factors in the middle on the
blackboard and the outer left and right part of the blackboard. Classroom A has a green chalk board,
whereas classroom B has a white board.
The table proved that the daylight factor is decreased below 0.5% on the corridor side of
classroom.
Black Board
Teacher desk 2.2 0.56 0.30
8.9 2.5 0.66 0.29
11.6 2.9 0.74 0.29
12.3 2.3 0.63 0.31
Table 2.2.1 The daylight factors (%) on student table height in classroom A.
White Board
Teacher desk 2.2 0.77 0.42
8.3 2.4 0.88 0.4
8.5 2.7 0.86 0.46
8.8 2.3 0.72 0.34
Table 2.2.2 The daylight factors (%) on student table height in classroom B.
Board type Left Middle Right
Black board 3 1 0.4
White board 2.4 0.82 0.38
Table 2.2.3 The daylight factors (%) on the boards in both classrooms.
Window Zone Corridor Zone
Window Zone Corridor Zone

13 | P a g e
Figures below show luminance pictures, taken with a luminance camera with a fish-eye lens,
from the back-side of the classrooms. It shows the situation for a sitting student with eye level on 1.2 m.
The figures show the daylight situation with and without electrical lighting.
Figure 2.2.4 Classroom A without electrical lighting
Figure 2.2.5 Classroom A with electrical lighting
Figure 2.2.6 Classroom B without electrical lighting

14 | P a g e
Figure 2.2.7 Classroom B with electrical lighting
2.2.3 Artificial Lighting
Both classrooms have six high-efficient surface-mounted luminaires with mirror reflector
(Philips TCS298), each luminaire with one Philips TL5 HO 49 W/830 lamp (Figure 2.2.8) with
electronic ballast. The illuminance on the work plane is 350 lx at full power. The school has
replaced the old lamps and luminaires some years ago. The lamps were placed in two rows of three
luminaires parallel to the window façade. The lamps were dimmable and have daylight sensors. There
were also presence detectors in these classrooms (Figure 2.2.9). There was also asymmetric board
lighting.
Figure 2.2.8 Philips TL5 Lamp Figure 2.2.9 New Lighting Installation
The luminance values in the windows of the classroom A are higher than in the windows of
classroom B, because of the presence of trees outside the classroom B. That can explain the difference
in the measured daylight factors, and so more energy savings are expected due to daylight sensors.
The luminance images illustrate how the automatic dimming of the electric lighting can
compensate an asymmetrical day-light distribution on the work plane (windows zone/corridor zone),
and on the blackboard.

15 | P a g e
2.2.4 Conclusion
In conclusion, natural light is important and can be affected by other side factor, for example
the condition outside the window. Natural light provide enough light to work but not causing discomfort
by the over exposed reflection on white surface like white painted wall and book. Direct light from the
windows may perceive as uncomfortable when having a high contrast ratios, without electrical lighting.
Therefore, most of the seat placed in the middle of class, due to the comfortable yet sufficient light. This
case study can apply into our site. Café by consider the people occupancy according to light condition,
furniture arrangement and artificial light placement.
2.3 RESEARCH METHODOLOGY
2.3.1 Light Measuring Equipment
a) Lux Meter
Lux meter also known as Light meter is used to measure the intensity of light illumination as
distinguished by the human eye. The value gained does not correspond to the object value of
energy radiated, as different wavelength within specific spectrum is perceived with varying
sensitivity by the eye. Therefore, lux meter reading is reading that are taken in consideration of
this variables.
Most Lux meter registers brightness with an integrated photodetector. The photodetector is
held perpendicular to the light source for optimal exposure. Readouts are presented via digital
Photodetector LCD
Display

16 | P a g e
LCD display. Most Lux meter has measurement in variable range. The model of lux meter used
in this case study is Lux LX-101.
2.3.2 Data Collection Method
Procedure
1) Ground floor plan and first floor plan is measured and drawn.
2) 3 zones of case study area is determined and plotted with grid lines.
3) Measurement is taken at 1.5m and 1.0m high at each intersection points at different time
(Daytime and Night time)
4) Procedure 3 is repeated.
1.5m
1.0m
Figure 2.3.2.1 Position height of lux meter during measurement

17 | P a g e
2.4 CASE STUDY
2.4.1 Introduction
Figure 2.4.1.1 Location of Donutes Cafe
Figure 2.4.1.2 Exterior view of Donutes Cafe
Donutes Café is one of the shops located at SS15, Subang Jaya. It is a 2-storey shop lot, with
an open roof concept. The café is a place where mostly student’s hangout after classes and office staff
relax after long hours of work. Peak hours of the café is usually during the night.

18 | P a g e
The building itself is situated along a busy main road and surrounded by several high rise
buildings, therefore noise pollution might occur at certain times. Part of the shop is designed with
curtain walling. This allows natural daylighting to enter the space, besides being illuminated with
artificial lightings. However it also produces glares into the shop during evening hours. The site has
very minimal sun shading besides the surrounding buildings.
This particular site was chosen as our case study due to its well known lighting design
strategies used in the building and variety type of lighting, which allow us to expose to new knowledge.
Figure 2.4.1.3 Interior Space during daytime
Figure 2.4.1.4 Interior space at night
19 | P a g e
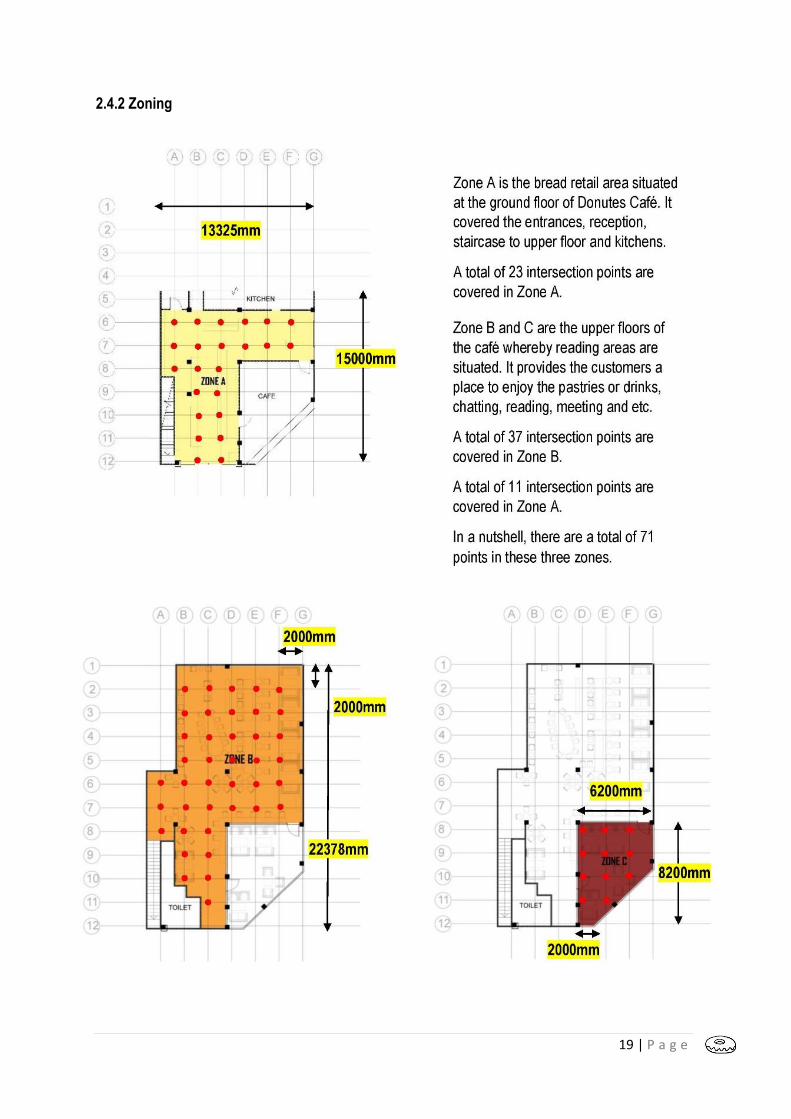
2.4.2 Zoning

20 | P a g e
2.5 EXISTING LIGHTING CONDITIONS
LEGEND
A B

21 | P a g e
Figure 2.5.1 Ceiling Plan of Zone A (Colour referring to Light Specification List)
A B

22 | P a g e
LEGEND

23 | P a g e
Figure 2.5.2 Ceiling Plan of Zone B and C (Colour referring to Light Specification List)
A B
A B
24 | P a g e
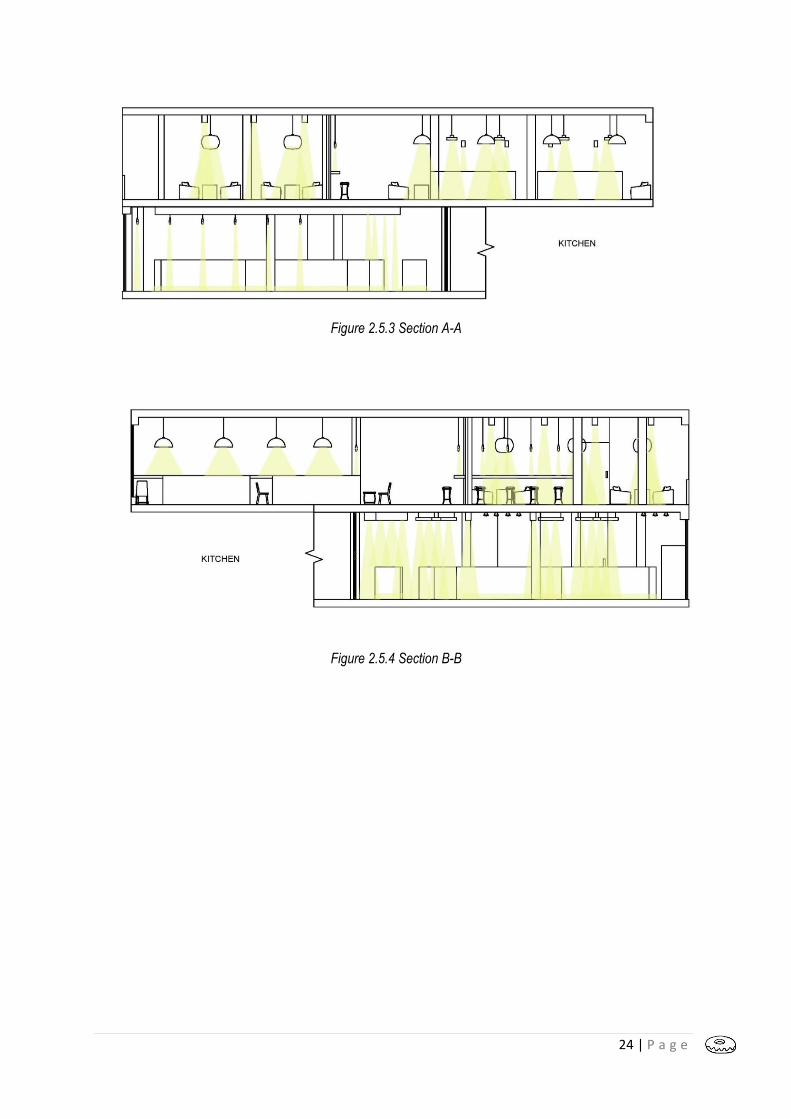
Figure 2.5.3 Section A-A
Figure 2.5.4 Section B-B

25 | P a g e
2.5.1 Existing Lighting Fixture
Indication Image Light Type Philips Fluoresent Light
Lamp Luminous Flux (lm) 1250
Specification Extra-long life of 50,000 hours
Rated Colour Temperature 4100K
Colour Rendering Index 98 Luminaire Type Open Fluorescent Strip light Wattage 8
Placement Hidden under ceiling or cabinet ( Display bread )
Light Type Leadare LED Bulb
Lamp Luminous Flux (lm) 400 lm
Specification E27 Life time approx. 25.000 hours.
Rated Colour Temperature 5000K
Colour Rendering Index 82 Luminaire Type Built in LED lamps Wattage 9
Placement Wall Lamp
Light Type LED Downlight
Lamp Luminous Flux (lm) 400 lm
Specification Life time approx. 35.000 hours.
Rated Colour Temperature 5000K
Colour Rendering Index 82 Luminaire Type Built in LED lamps Downlight Wattage 40
Placement Ceiling Lamp
Light Type Fluid Pendent Light Bulb
Lamp Luminous Flux (lm) 800
Specification Life time approx. 4.000 hours
Rated Colour Temperature 2700K
Colour Rendering Index 100 Luminaire Type Decorative pendent Downward Wattage 60
Placement Ceiling Lamp
Table 2.5.1.1 Light Specification
26 | P a g e
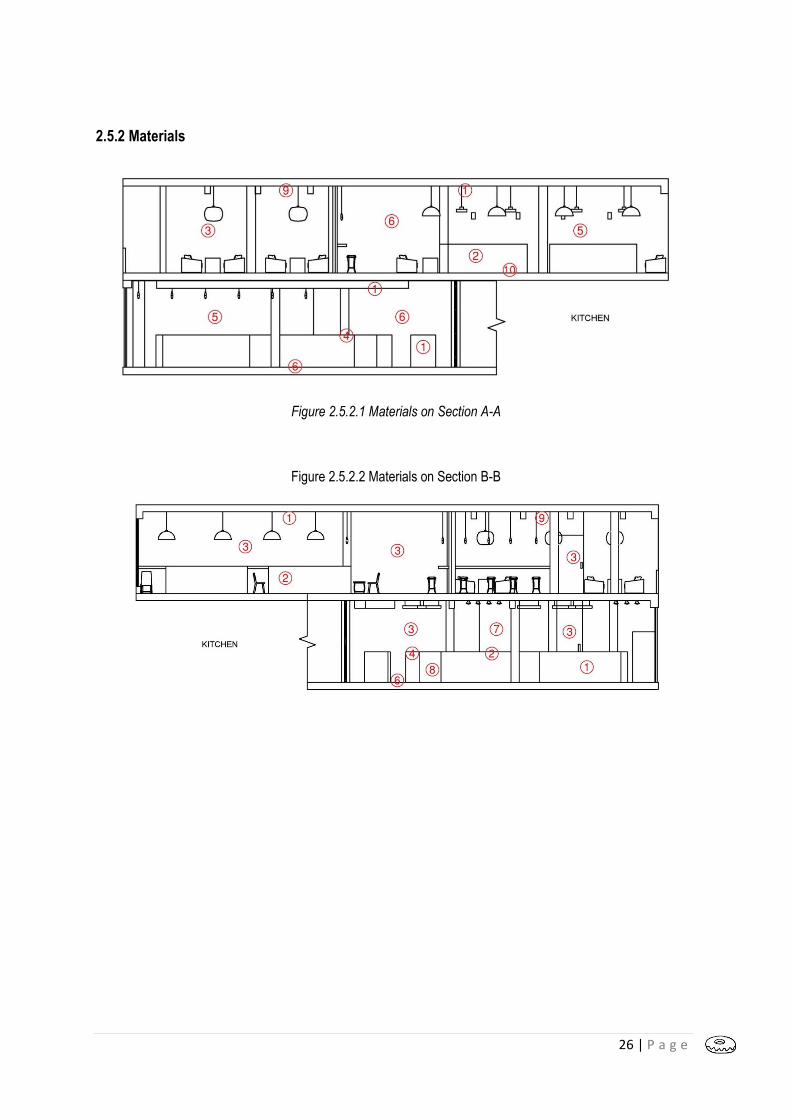
2.5.2 Materials
Figure 2.5.2.1 Materials on Section A-A
Figure 2.5.2.2 Materials on Section B-B

27 | P a g e
No. Location Materials Color Reflectance Surface
1. 1 Table
Brown 25 Semi -Rough
2. 1 Laminated wood bookshelves
Brown 25 Smooth
3. 2,1,3,4 Bread display stands White
45
Smooth
Marble
Wood Laminated Sheets
Brown
25 Smooth
Glass
Transparent
0 Smooth
Steel
Silver 12 Smooth
Table 2.5.14 Furniture Material
28 | P a g e
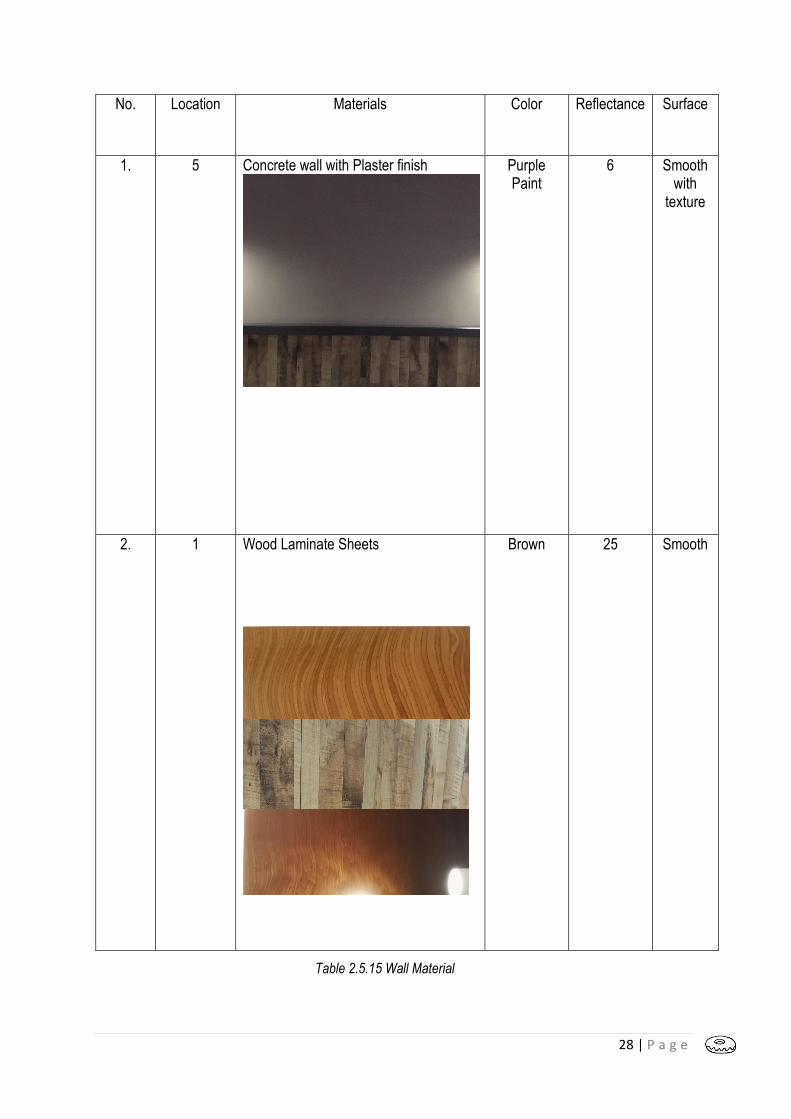
No. Location Materials Color Reflectance Surface
1. 5 Concrete wall with Plaster finish
Purple Paint
6 Smooth with
texture
2. 1 Wood Laminate Sheets
Brown 25 Smooth
Table 2.5.15 Wall Material

29 | P a g e
3. 6 Exposed Concrete
Grey 35 Smooth
4. 3 Glass
Trans- parent
0 Smooth
Table 2.5.16 Wall Material

30 | P a g e
5. 7 Mirror
Reflective 88 Smooth
7. 8 Laminated Granite Sheets
Dark Grey 40 Semi-Rough
Table 2.5.17 Wall Material

31 | P a g e
No. Zone Materials Color Reflectance Surface
1. 9 Concrete Ceiling with Black paint finish
Black 15 Rough
2. 2 Wood
Laminate Sheets
Wood 25 Smooth
Table 2.5.18 Ceiling Material

32 | P a g e
No. Zone Materials Color Reflectance Surface
1. 10 Porcelain Floor Tiles
Light Grey 70 Semi
Smooth
2. 2 Laminated Wood Flooring
Light Brown 25 Smooth
3. 6 Exposed Concrete
Dark Grey 39.5 Smooth
Table 2.5.19 Floor Material

33 | P a g e
2.6 LIGHTING DATA ANALYIS
2.6.1 Daytime Lux Reading
2.6.1.1 Zone A
Diagram 2.6.1 Daytime data result on Zone A
.
Data at 1.5m Height
Data at 1.0m Height
*

34 | P a g e
Diagram 2.6.2. Daytime light contour on Zone A – 12pm
Diagram 2.6.3 Daytime light contour on Zone A – 4pm
The lux reading shown above shows the lux level during 4pm to 6pm interval. Partially, the
artificial lighting were switched on during our data collection, but all of them are placing low to light up
the floor. So, for the whole ground floor area, the main source of light during daytime is the sunlight.
Referring to Diagram 2.6.1, the reading for the inner space are lower as it is deep inside and it rarely
exposes to sunlight. The highest reading recorded is at the entrance area, where receive more sunlight
through the glass sliding door.
35 | P a g e
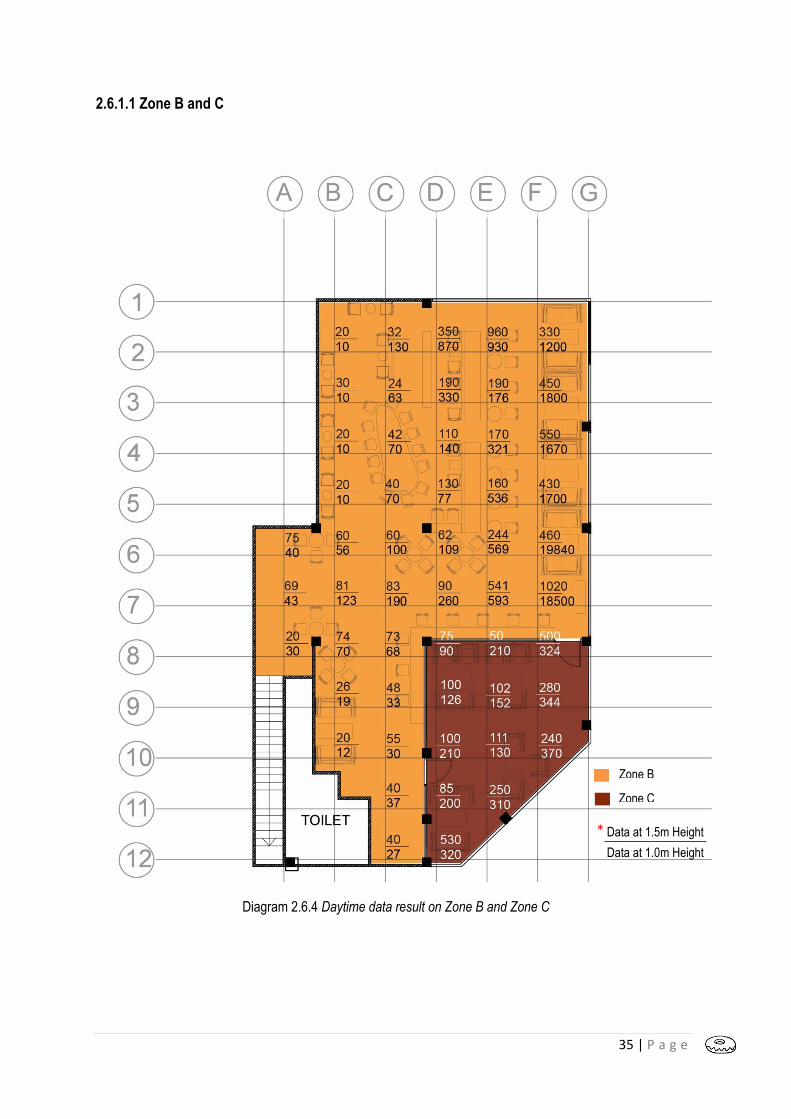
2.6.1.1 Zone B and C
Diagram 2.6.4 Daytime data result on Zone B and Zone C
Data at 1.5m Height
Data at 1.0m Height
*
Zone B
Zone C

36 | P a g e
Diagram 2.6.5 Daytime light contour on Zone B and Zone C
Within Zone B, a distinctively high reading is recorded along the glasses area, as the glasses
reflect the direct sunlight to the interior space. While the wall lights were switched on to light up the area
of gridline C2 to C5 and B8 to B10, because of the daylight is blocked by the partition and furniture.
Zone C is a semi-outdoor area where receives huge amount of sunlight as it is an open space
and yet surrounded with glasses.

37 | P a g e
2.6.2 Night Time Lux Reading
2.6.2.1 Zone A
Diagram 2.6.6 Night time data result on Zone A
The readings taken at 9pm at the night, which fully dependant on artificial lightings inside. The
higher lux readings are collected at the counter area (gridline C9-C11) as more artificial lightings are
installed to provide brightness for clear vision for people to order or paying. Overall, the luminance level
is above standard lux level, which is 200 lux (according to MS 1525).
Data at 1.5m Height
Data at 1.0m Height
*

38 | P a g e
Diagram 2.6.7 Night time light contour on Zone A
Diagram 2.6.8 Ceiling Plan of Zone A
According to Diagram 2.6.7, the area rendered with blue and purple area has lower luminance
level while red and orange area has higher luminance level. As shown in Diagram 2.6.8, more
downlights are installed around the counter and middle display area, which provide brighter
environment and thus exceed standard 200 lux. While moving towards the kitchen area, the luminance
level getting lower as that area is either walkway or corridor.

39 | P a g e
2.6.2.2 Zone B and C
Diagram 2.6.9 Night time data result on Zone B and C
The readings taken at 9pm at the night, which fully dependant on artificial lightings inside. At
certain areas, the readings are extremely low, which may drop to 2 or 3 lux. This is because this area is
main to be darker to create a more relaxing ambience. Overall, the luminance level is below the café
standard luminance level, which is 200 lux.
Data at 1.5m Height
Data at 1.0m Height
*
Zone B
Zone C

40 | P a g e
Diagram 2.6.10 Night time light contour on Zone B and C

41 | P a g e
Diagram 2.6.11 Ceiling plan of Zone B and C
According to Diagram 2.6.10, the area rendered with blue and purple area has lower luminance
level while red area has higher luminance level. As shown in Diagram 2.6.11, artificial lighting are all
placing near to the table to provide brightness to only targeted place. Most of the light are decorative
lighting and task lighting which did not provide general lighting to the whole area. Therefore, most of
the area are rendered in blue and purple colour which is considered very poorly lid.

42 | P a g e
2.6.3 Observation and Discussion
Observation 1
The readings of Zone A during daytime are lower than the readings collected during night time.
Discussion 1
The walkway outside Zone A has affected the daylighting as greatly reduce the coming in sunlight
because of the shaded. The artificial lighting is not bright compare to night time because ceiling
downlight are only turning on at night. During nigh time, the space looks brighter as the light reflecting
from ceiling and glasses. Hence, during daytime, the daylighting on Zone A is not sufficient.
Figure 2.6.1 Daytime on Zone A
Figure 2.6.2 Night time on Zone A

43 | P a g e
Observation 2
In opposite, the readings of Zone B and C during daytime are higher than the readings collected during
nigh time.
Discussion 2
By exclusively using full glass window on the west, Zone B and C receives much sunlight compare to
others. While during night time, decorative lightings and task lightings are used to focus on each table.
Also, because of the dark colour of wall and ceiling to create a relaxing ambiance, the whole area looks
dimmer.
Figure 2.6.3 Zone B (Grid D to G)
Figure 2.6.4 Night View on Zone B
Figure 2.6.5 Night view on Zone C

44 | P a g e
Observation 3
The readings collected at the inner space of Zone A, B and C are mostly under 200 lux, the standard
illumination level.
Discussion 3
The inner space area located far from the openings. The furniture and partitions are placing in layers
and blocking much of the sunlight. Thus, they receive inadequate sunlight during daytime. Poor
planning of placing artificial lightings was also darken down the area.
Figure 2.6.6 Daytime on Zone B
Figure 2.6.7 Daytime on Zone B
Grid A-C Grid D-G
45 | P a g e
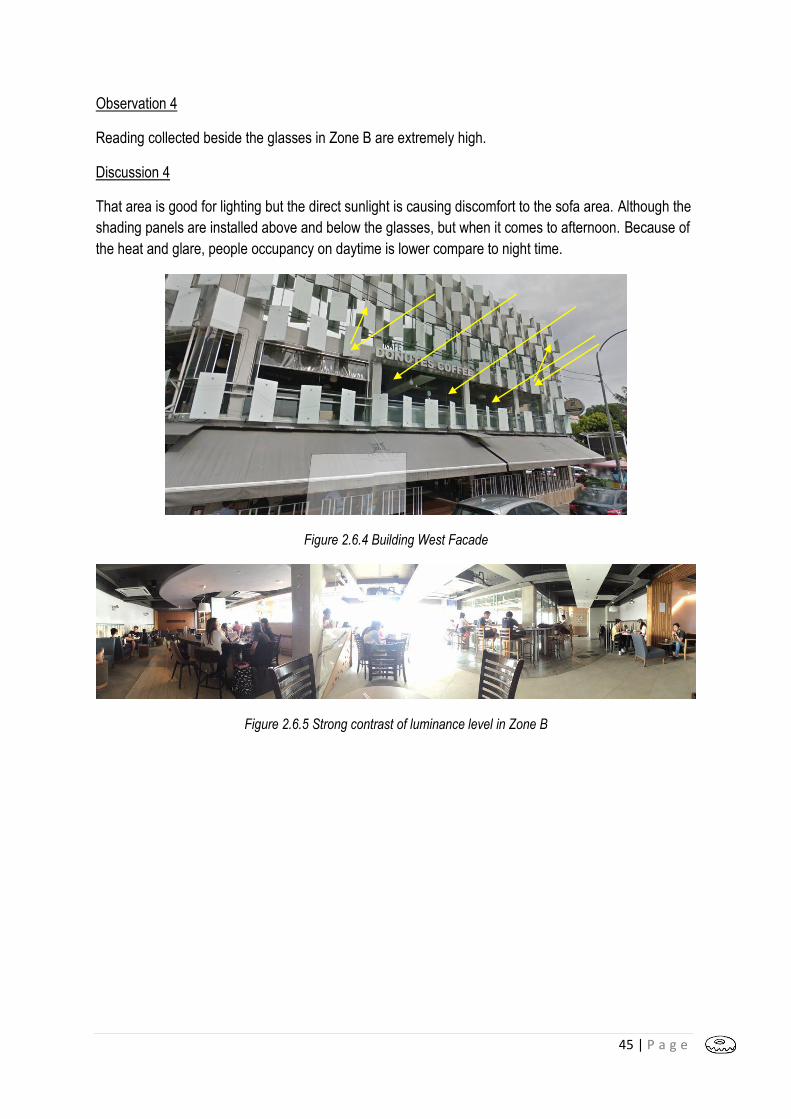
Observation 4
Reading collected beside the glasses in Zone B are extremely high.
Discussion 4
That area is good for lighting but the direct sunlight is causing discomfort to the sofa area. Although the
shading panels are installed above and below the glasses, but when it comes to afternoon. Because of
the heat and glare, people occupancy on daytime is lower compare to night time.
Figure 2.6.4 Building West Facade
Figure 2.6.5 Strong contrast of luminance level in Zone B

46 | P a g e
2.7 LIGHTING CALCULATION ANALYSIS
2.7.1 Daylight Factor Analysis
2.7.1.1 Zone A (Retail Area)
Time Weather Luminance At 1m (1x)
Average (1x) Luminance at 1.5m (1x)
Average (1x)
4pm – 6pm Clear sky 28-77 62 lux 49 - 81 65.7 lux
Table 2.5.1 Lux Reading at Zone A
Average Lux Reading 4pm – 6pm
1m 62
1.5m 65.7
Average lux value 63.85 lux (64 lux)
Table 2.5.2 Average Lux Value at Zone A
Luminance Level Example
120,000 lux Brightest sunlight
110,000 lux Bright sunlight
20,000 lux Shade illuminated by entire clear blue sky, midday
1000 – 2000 lux Typical over cast day, midday
400 lux Sunrise or sunset on clear day (ambient illumination)
<200 lux Extreme of darkest storm clouds, midday
40 lux Fully overcast, sunset/sunrise
< 1 lux Extreme of darkest storm cloud, sunset/rise
Table 2.5.3 Daylight intensity at different condition
Date and Time 4pm – 6pm (26 April 2016)
Average lux value reading 64 lux
Daylight Factor Calculation Formula D =
Standard direct sunlight 20,000 lux
Calculation D=(64/20000) x 100% = 0.32%
DF , % Distribution
>6 Very Bright With thermal and glare problem
3 – 6 Bright
1 - 3 Average
0 - 1 Dark
Table 2.5.4 Daylight Factor, DF
Daylight factor at Zone A, retail area is relatively low. The calculation shown is 0.32 and which
in the range of dark according to table provided in MS1525. This is due to the reason of the
cantilevered floor above, which covers up the five-foot walkway. The prevention of direct sun exposure
is purposely done to keep the indoor temperature low and thus keep the bread fresh.
(E external)
E internal x 100% E external
(E internal)

47 | P a g e
2.7.1.2 Zone B (Reading Area)
Time Weather Luminance At 1m (1x)
Average (1x) Luminance at 1.5m (1x)
Average (1x)
4pm – 6pm Clear sky 10-19840 186.7 lux 2-1020 1170.36 lux
Table 2.5.5 Lux Reading at Zone B
Average Lux Reading 4pm – 6pm
1m 186.7
1.5m 1170.36
Average lux value 678.5 lux
Table 2.5.6 Average Lux Value at Zone B
Luminance Level Example
120,000 lux Brightest sunlight
110,000 lux Bright sunlight
20,000 lux Shade illuminated by entire clear blue sky, midday
1000 – 2000 lux Typical over cast day, midday
400 lux Sunrise or sunset on clear day (ambient illumination)
<200 lux Extreme of darkest storm clouds, midday
40 lux Fully overcast, sunset/sunrise
< 1 lux Extreme of darkest storm cloud, sunset/rise
Table 2.5.7 Daylight intensity at different condition
Date and Time 4pm – 6pm (26 April 2016)
Average lux value reading 678.5 lux
Daylight Factor Calculation Formula D =
Standard direct sunlight 20,000 lux
Calculation D=(678.5/20000) x 100% = 2.89%
DF , % Distribution
>6 Very Bright With thermal and glare problem
3 – 6 Bright
1 - 3 Average
0 - 1 Dark
Table 2.5.8 Daylight Factor, DF
Daylight factor at zone B, reading area is considered high. The calculation shown is 2.89%,
which in the range of bright according to the table provided in MS 1525. The existence of glass around
the area had led high amount of lux to enter the interior space. This can save energy during daytime, as
only partial artificial lights are needed. However, the glare created is unpreventable as its location is at
the junction of turn in with existence of full wall of glass. Least shading device can be seen along the
glass window. The customers will also experience the high amount of glare during the noontime,
therefore shading device such as louvers is strongly recommended in this building.
(E external)
E internal x 100% E external
(E internal)

48 | P a g e
2.7.1.3Zone C (Smoking Area)
Time Weather Luminance At 1m (1x)
Average (1x) Luminance at 1.5m (1x)
Average (1x)
4pm – 6pm Clear sky 90-370 232.16 lux 50-530 201.9 lux
Table 2.5.9 Lux Reading at Zone C
Average Lux Reading 4pm – 6pm
1m 232.16
1.5m 201.9
Average lux value 217 lux
Table 2.5.10 Average Lux Value at Zone C
Luminance Level Example
120,000 lux Brightest sunlight
110,000 lux Bright sunlight
20,000 lux Shade illuminated by entire clear blue sky, midday
1000 – 2000 lux Typical over cast day, midday
400 lux Sunrise or sunset on clear day (ambient illumination)
<200 lux Extreme of darkest storm clouds, midday
40 lux Fully overcast, sunset/sunrise
< 1 lux Extreme of darkest storm cloud, sunset/rise
Table 2.5.11 Daylight intensity at different condition
Date and Time 4pm – 6pm (26 April 2016)
Average lux value reading 217 lux
Daylight Factor Calculation Formula D =
Standard direct sunlight 20,000 lux
Calculation D=(217/20000) x 100% =1.0%
DF , % Distribution
>6 Very Bright With thermal and glare problem
3 – 6 Bright
1 - 3 Average
0 - 1 Dark
Table 2.5.12 Daylight Factor, DF
Daylight factor at zone C, smoking area is moderate but relatively low compare to reading area.
The calculation shown is 1.0%, which is in the range of moderate according to the table provided
inMS1525. It is a partially open space which location is facing northwest, thus allows high amount of lux
to light up the place during daytime.
(E external)
E internal x 100% E external
(E internal)

49 | P a g e
2.7.1 Zone A Lightings
Dimensions of Space (L x W) (m)
(6.0 x 6.5) / (6.8 x 15)
Total Floor Area (m²) 107.8
Standard Illuminance Required (lux)
200
Type of Lighting Fixture
Fluorescent Light (8W)
LED E27 Bulb (9W) LED Downlight (12W)
Number of Lighting Fixture / N
10 6 28
Lumen of Lighting Fixture / F (lm)
1250 700 900
Height of Luminaries (m)
3.5 2.0 3.5
Height of Working Plan (m)
1.3 1.3 1.3
Mounting Height / H (m)
2.2 0.7 2.2
Reflection Factors (%) Ceiling : 30.0 Wall : 10.0
Ceiling : 22.5 Wall : 10.0
Ceiling : 50.0 Wall : 10.0
Room Index
𝑅𝐼 =𝐿 𝑥 𝑊
𝐻 𝑥 (𝐿 + 𝑊)
= 6.0 x 6.5 / 2.2 x (6.0 + 6.5) = 1.4 , =6.8 x 15.0 / 2.2 x (6.8 + 15.0) =2.0 1.4 + 2.0 / 2.0 =1.7 =2.0
= 6.0 x 6.5 / 0.7 x (6.0 + 6.5) = 4.0 , =6.8 x 15.0 / 0.7 x (6.8 + 15.0) =6.7 4.0 + 6.7 / 2.0 =5.0
= 6.0 x 6.5 / 2.2 x (6.0 + 6.5) = 1.4 , =6.8 x 15.0 / 2.2 x (6.8 + 15.0) =2.1 1.4 + 2.1 / 2.0 =1.8
=2.0
Average
Utilisation Factor / Refer Chart
0.29 0.72 0.78
Maintenance Factor 0.8 0.8 0.8
Average Illuminance /lux
1.5m: 281.0 Average Illuminance: (281+ 211.4) / 2=246.7 1.0m: 211.4
Number of Light Required
𝑁
=𝐸 𝑥 𝐴
𝐹 𝑥 𝑈𝐹 𝑥 𝑀𝐹
𝑁 = 200 𝑥 9.5m²
1250 𝑥 0.29 𝑥 0.8
= 6.5 = 7.0
𝑁 = 200 𝑥 12.3m²
700 𝑥 0.72 𝑥 0.8
= 6.0
𝑁 = 200 𝑥 86.05m²
900 𝑥 0.78 𝑥 0.8
= 30.6 = 31.0
Spacing requirement for light fitting S= 1.5 x Hm (Diffuse Light) 1.0 x Hm
(Direct Light)
S= 1.5 x 2.2 = 3.3m
S= 1.0 x 0.7 = 0.7 m
S= 1.0 x 3.5 = 3.5 m

50 | P a g e
Total average lux in the retail area is 246.2 lux. The standard illuminance required for the room
with retail purpose is 200 lux. It is bright-lit room where its illuminance exceeds 46.2 lux.
As it is an area of bread display session of the bakery, it requires slightly higher illuminance to
emphasize the cleanliness and food attractiveness. The area did a good job in creating a well-lit room
for bread display as a variation of light fittings is seen throughout the area. However, it would be cost
consuming in maintaining the light fittings.
Instead of having 44 light bulbs of different type to achieve the required lux, suggestion of 38
LED down lights can be done in a cheaper way to light up the place.

51 | P a g e
2.7.2 Zone B Lightings
Dimensions of Space (L x W) (m)
(10 x 13) / (8 x 4) / (6 x 2.5)
Total Floor Area (m²) 188.2
Standard Illumination Required (lux)
200
Type of Lighting Fixture
Fluorescent Light (8W)
LED E27 Bulb (9W) LED Downlight (12W) Fluid Pendant Light Bulb (60W)
Number of Lighting Fixture / N
6 26 16 4
Lumen of Lighting Fixture / F (lm)
1250 700 900 800
Height of Luminaries (m)
3.0 2.0 3.0 2.3
Height of Working Plan (m)
0.45 0.7 0.7 0.45
Mounting Height / H (m)
2.55 1.3 2.3 1.85
Reflection Factors (%)
Ceiling (Plywood) : 25.0 Wall (Grey paint) : 25.0
Ceiling (Grey paint) : 25.0 Wall (Grey paint) : 25.0
Ceiling (Plywood) : 25.0 Wall (Glass) : 0
Ceiling (White paint) : 70.0 Wall (Glass) : 0
Room Index
𝑅𝐼 =𝐿 𝑥 𝑊
𝐻 𝑥 (𝐿 + 𝑊)
= 10.0 x 13.0 / 2.55 x (10.0 + 13.0) = 2.2 , =8.0 x 4.0 / 2.55 x (8.0 + 4.0) =1.0 , =6.0 x 2.5 / 2.55 x (6.0 + 2.5) =0.7 , = 2.2 + 1.0 + 0.7 / 3.0 = 3.9 =4.0
= 10.0 x 13.0 / 1.3 x (10.0 + 13.0) = 4.3 , =8.0 x 4.0 / 1.3 x (8.0 + 4.0) =2.0 , =6.0 x 2.5 / 1.3 x (6.0 + 2.5) =1.35 , = 4.3 + 2 + 1.35 / 3.0 = 2.55 =3.0
= 10.0 x 13.0 / 2.3 x (10.0 + 13.0) = 2.45 , =8.0 x 4.0 / 2.3 x (8.0 + 4.0) =1.15 , =6.0 x 2.5 / 2.3 x (6.0 + 2.5) =0.77 , = 2.45+1.15+0.77/3.0 = 1.5 =2.0
= 10.0 x 13.0 / 1.85 x (10.0 + 13.0) = 3.0 , =8.0 x 4.0 / 1.85 x (8.0 + 4.0) =1.4 , =6.0 x 2.5 / 1.85 x (6.0 + 2.5) =1.0 , = 3.0 + 1.4 + 1.0 / 3.0 = 1.8 =2.0
Average
Utilisation Factor / Refer Chart
0.60 0.15 0.39 0.67
Maintenance Factor 0.8 0.8 0.8 0.8
Average Illuminance / Lux
1.5m: 49.7 Average Illuminance: (49.7 + 33) / 2= 41.35 1.0m: 33
Number of Light Required
𝑁 =𝐸 𝑥 𝐴
𝐹 𝑥 𝑈𝐹 𝑥 𝑀𝐹
𝑁 = 200 𝑥 12.6m²
1250 𝑥 0.15 𝑥 0.8
= 16.8
= 17.0
𝑁 = 200 𝑥 72.8m²
700 𝑥 0.6 𝑥 0.8
= 43.0
𝑁 = 200 𝑥 74.2m²
900 𝑥 0.67 𝑥 0.8
= 30.7
= 31.0
𝑁 = 200 𝑥 74.2m²
800 𝑥 0.39 𝑥 0.8
= 22.9
= 23.0 Spacing requirement for light fitting S= 1.5 x Hm (Diffuse Light) 1.0 x Hm
(Direct Light)
S= 1.5 x 2.55 = 3.8m
S= 1.0 x 0.7 = 0.7m
S= 1.0 x 2.3 = 2.3m
S= 1.5 x 1.85 = 2.7m
Data at 1.5m Height
Data at 1.0m Height
*
52 | P a g e
Total average lux in the reading area is 41.35lux where standard lux required is 200 lux. It is a
dimly lit up room which lacking 158.65lux.
In order to achieve the required lux, 17 of LED Leadfare Bulb E27 lights, 11 of indirect
fluorescent light E27, 23 more Fluid Pendant light bulb, and 31 more LED down light need to be added
into the area to achieve 200lux. Instead of having 82 type of light fittings, 77 of fluid pendant light can
used to achieve the standard illuminance and achieve the certain level of romantic and relaxing
ambient.

53 | P a g e
2.7.3 Zone C Lightings
Dimensions of Space (L x W) (m)
(13.4 x 10.6) / (8.8 x 4.2) / (2.5 x 5.8)
Total Floor Area (m²) 92.8
Standard Illumination Required (lux)
200
Type of Lighting Fixture LED Downlight (12W) Fluid Pendant Light Bulb (60W)
Number of Lighting Fixture / N
7 5
Lumen of Lighting Fixture / F (lm)
800 900
Height of Luminaries (m) 2.3 4.0
Height of Working Plan (m)
0.45 0.45
Mounting Height / H (m) 1.85 3.55
Reflection Factors (%) Ceiling (Black paint) : 15.0 Wall (Glass) : 0
Ceiling (Black paint) : 15.0 Wall (Glass) : 0
Room Index
𝑅𝐼 =𝐿 𝑥 𝑊
𝐻 𝑥 (𝐿 + 𝑊)
= 13.4 x 10.6 / 3.55 x (13.4 + 10.6) = 2.0 , =8.8 x 4.2 / 3.55 x (8.8 + 4.2) =1.0 , =2.5 x 5.8 / 3.55 x (2.5 + 5.8) =1.0 , 2.0 + 1.0 + 1.0 / 3.0 = 1.0
= 13.4 x 10.6 / 1.85 x (13.4 + 10.6) = 3.0 , =8.8 x 4.2 / 1.85 x (8.8 + 4.2) =2 , =2.5 x 5.8 / 1.85 x (2.5 + 5.8) =1.0 , 3.0 + 2.0 + 1.0 / 3.0 = 3.0
Average
Utilisation Factor / Refer Chart
0.31 0.72
Maintenance Factor 0.8 0.8
Average Illuminance / Lux
1.5m: 18.3 Average Illuminance: (18.3 + 12.58) / 2= 15.45 1.0m: 12.58
Number of Light Required
𝑁 =𝐸 𝑥 𝐴
𝐹 𝑥 𝑈𝐹 𝑥 𝑀𝐹
𝑁 = 200 𝑥 20.0m²
900 𝑥 0.72 𝑥 0.8
= 7.0
𝑁 = 200 𝑥 24.0m²
800 𝑥 0.31 𝑥 0.8
= 24.0
Spacing requirement for light fitting S= 1.5 x Hm (Diffuse Light) 1.0 x Hm (Direct Light)
S= 1.0x 1.85 = 1.85m
S= 1.5 x 3.5 = 5.25m

54 | P a g e
Total average lux in smoking area is 15.45 lux. The standard illuminance required for the room
is 200 lux. It is under insufficiency of light.
The difference between the required lux with the current reading is 184.55 lux. It needs another
24 Fluid light bulbs to achieve the standard lux. The low reading is gained due to the large number of
diffusing light around the area (Fluid Pendant Light). Low reflectance of the surrounding material also
affect to the low reading, the dark colour ceiling paint and glass window.

55 | P a g e
2.8 CONCLUSION
In conclusion, natural lighting in Donutes SS15 is relatively good based on the daylight factor
calculation, which range around average to moderate. The sufficiency of day lighting strongly
influenced by the openings provided. The strategic location at the corner lot had made Donutes SS15 a
successful place for natural lighting. However, based on the data collected, there’s a huge contrast in
daylight factor of the certain points although at the same floor area. This is caused by the existing
partition and furniture being separated in to an enclosed area to form a semi-private space.
Figure2.8.1Corner location of DonutesSS15
Figure2.8.2 Glass area along the edge of building (Reading Area)

56 | P a g e
The low daylight factor reading is due to the existing sunshade along the five-foot walkway. The
shaded area is then utilized to be a usable outdoor chatting area. However, this had blocked large
amount of natural light to be able to strike through the interior. Therefore, some artificial lights are
turned on during daytime to aid on the lighting effect, but overall appear dark inside except the bread
display area with display lights on.
Figure2.8.3 Glass area along the edge of building (Smoking Area)
Figure2.8.4 Partition blocking the sun exposure to inner space
Figure2.8.5 Contrast between lighting quality

57 | P a g e
Artificial lighting is relatively considered good and had achieved the standard of 200lux at the
ground floor retail area. Most of the artificial lights available in Donutes SS15 are located in low position
and low in power. Therefore, there’re number of them but resulted in moderate lighting effect which is
cost consuming and wasting energy.
Most of the light fittings are ambient based, not meant for general lighting to bring out the
ambience of a relaxing, eating and chatting area. Ordinary light fittings are not suitable for this building
as it serves as a relaxing hang out area. It cannot be placed a standard spacing of lights like in factory.
Therefore, the variation of light fittings is acceptable but only to be enhanced by improving the light bulb
luminous flux, and increase the number. The placement of the luminaires should be able to follow the
working planes, which are the table surface, allowing optional work to be carrying out in the comfortable
light.
Figure2.8.6 overhanging sunshade
Figure2.8.7 Well-litted ground floor (Bread Display Area)

58 | P a g e
Figure2.8.8 Dim lighted smoking area
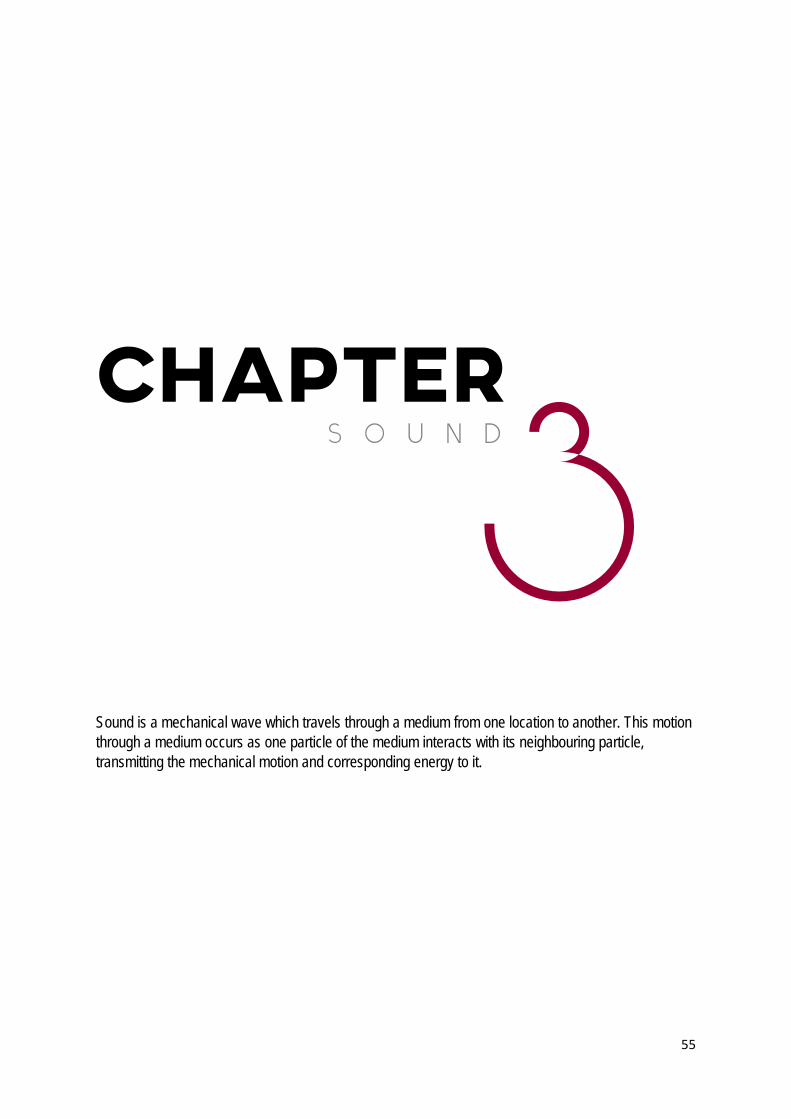
CHAPTER
Sound is a mechanical wave which travels through a medium from one location to another. This motion through a medium occurs as one particle of the medium interacts with its neighbouring particle, transmitting the mechanical motion and corresponding energy to it.
3 S O U N D
55

3.0 ACOUSTIC PERFORMANCE EVALUATION 3.1 Literature Review
3.1.1 Architecture Acoustic
Architecture acoustic is the branch of physic study that deals with the production, control, transmission, reception and effects of sound. The study of acoustics is important when designing a desirable atmosphere with concern and control of sound in spaces. The aim of the study is to preserve and enhanced desired sound in one space and on the other hand reduce or eliminate sound that interrupt with our activities known as noise.
3.1.2 Sound Pressure Level (SPL) It is a term most often used in measuring the magnitude of sound in decibels (dB). It is a relative quantity in that it is the ratio between the actual sound pressure and a fixed reference pressure. SPL of a place can be measure with a sound level meter weighted according to a specific frequency response pattern.
Figure 1: Some typical sound pressure levels
Calculation of sound pressure can be calculated with this formula:
56

3.1.3 Reverberation Time (RT)
Reverberation is the prolongation of sound as a result of successive reflections in an enclosed space after the sound source is turned off. Reverberation time is defined as the length of time required for sound to decay 6 decibels from its initial level. However, a reverberation is different from than an echo where the former is perceived when the reflected sound wave reaches your ear in less than 0.1 second after the original sound wave. There is no time delay between the perception of the reflected sound wave and the original sound wave since the original sound wave is still held in memory. Reverberation Time (RT) is an important index for describing the acoustical quality of an enclosure.
Formulas: 0.16 V A Where: RT= reverberation time (sec)
V=volume of the room (cu.m) A=total absorption of room surfaces (sq.m sabins)
3.1.4 Sound Reduction Index (SRI)
The Sound Reduction Index (SRI) or Transmission Loss TL of a partition measures the number of decibels lost when a sound of a given frequency is transmitted through the partition.
RT =
57
3.2 Acoustics Precedent Studies
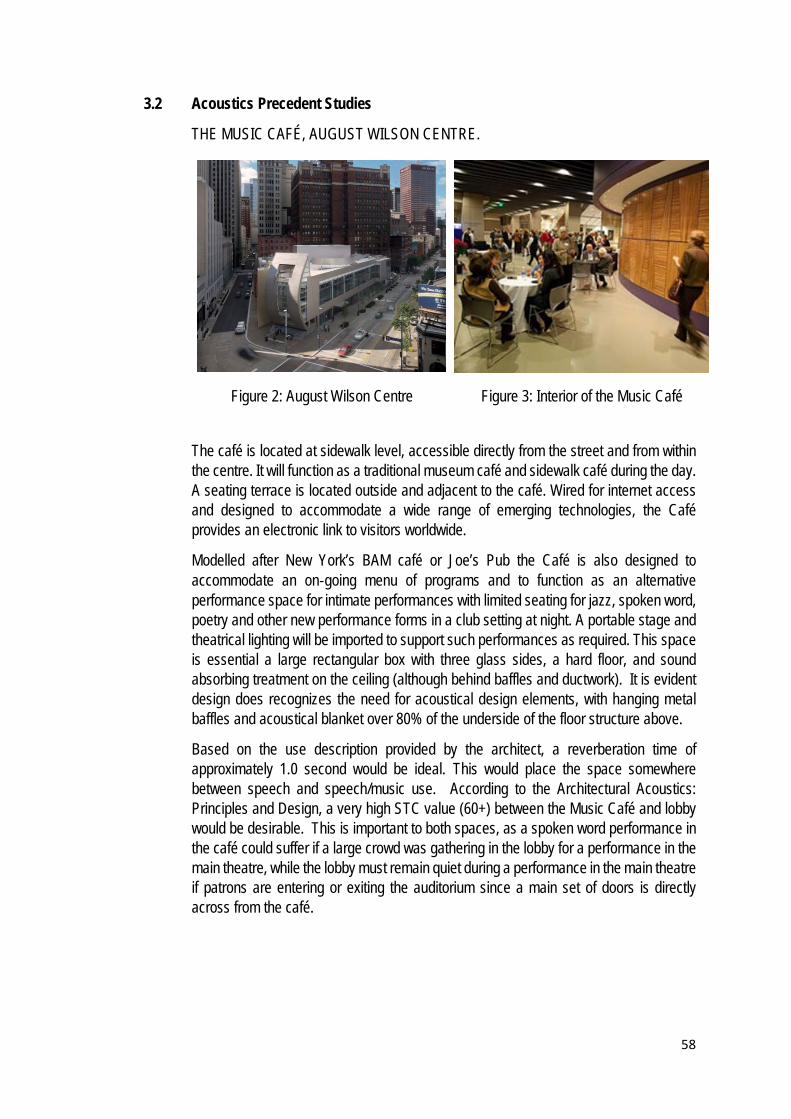
THE MUSIC CAFÉ, AUGUST WILSON CENTRE.
The café is located at sidewalk level, accessible directly from the street and from within the centre. It will function as a traditional museum café and sidewalk café during the day. A seating terrace is located outside and adjacent to the café. Wired for internet access and designed to accommodate a wide range of emerging technologies, the Café provides an electronic link to visitors worldwide.
Modelled after New York’s BAM café or Joe’s Pub the Café is also designed to accommodate an on‐going menu of programs and to function as an alternative performance space for intimate performances with limited seating for jazz, spoken word, poetry and other new performance forms in a club setting at night. A portable stage and theatrical lighting will be imported to support such performances as required. This space is essential a large rectangular box with three glass sides, a hard floor, and sound absorbing treatment on the ceiling (although behind baffles and ductwork). It is evident design does recognizes the need for acoustical design elements, with hanging metal baffles and acoustical blanket over 80% of the underside of the floor structure above.
Based on the use description provided by the architect, a reverberation time of approximately 1.0 second would be ideal. This would place the space somewhere between speech and speech/music use. According to the Architectural Acoustics: Principles and Design, a very high STC value (60+) between the Music Café and lobby would be desirable. This is important to both spaces, as a spoken word performance in the café could suffer if a large crowd was gathering in the lobby for a performance in the main theatre, while the lobby must remain quiet during a performance in the main theatre if patrons are entering or exiting the auditorium since a main set of doors is directly across from the café.
Figure 2: August Wilson Centre Figure 3: Interior of the Music Café
58

Figure 7.1.2 illustrates that the existing reverberation times are far from ideal. One important consideration, however, is that the manufacturer of the metal baffle ceiling system (Chicago Metallic) does not have acoustical data for the product. Therefore, the product has been omitted from the calculations. Including the baffles in the calculation would likely reduce the very high reverberation times at the lower frequencies, but it would also reduce the reverberation times at the higher frequencies which are already lower than ideal.
Additional analysis of the sound transmission class (STC) on the wall between the café and the main lobby reveals a potential for unwanted noise transfer between the spaces. At 46, the calculated STC falls far below the ideal value of 60+. This problem is generated by the use of glass doors and partitions between the spaces. Changing the glass type from ½” tempered glass to ½” laminated glass improves the STC to 49, but this is only a marginal increase. To really improve this potentially negative situation, significant changes to the architecture are required. These changes may include changing the glass to another material such as wood or creating a small vestibule at the entrances.
These changes, however, would significantly alter the architecture. It would be appropriate to point out the problem to the architect, but it is unlikely that the changes would be made. Improving the reverberation time is a much more realistic change. In order to do this, the metal baffles and acoustical blanket are eliminated, replacing them with floating fiberglass sound absorbing panels that are faced in perforated metal. This
59
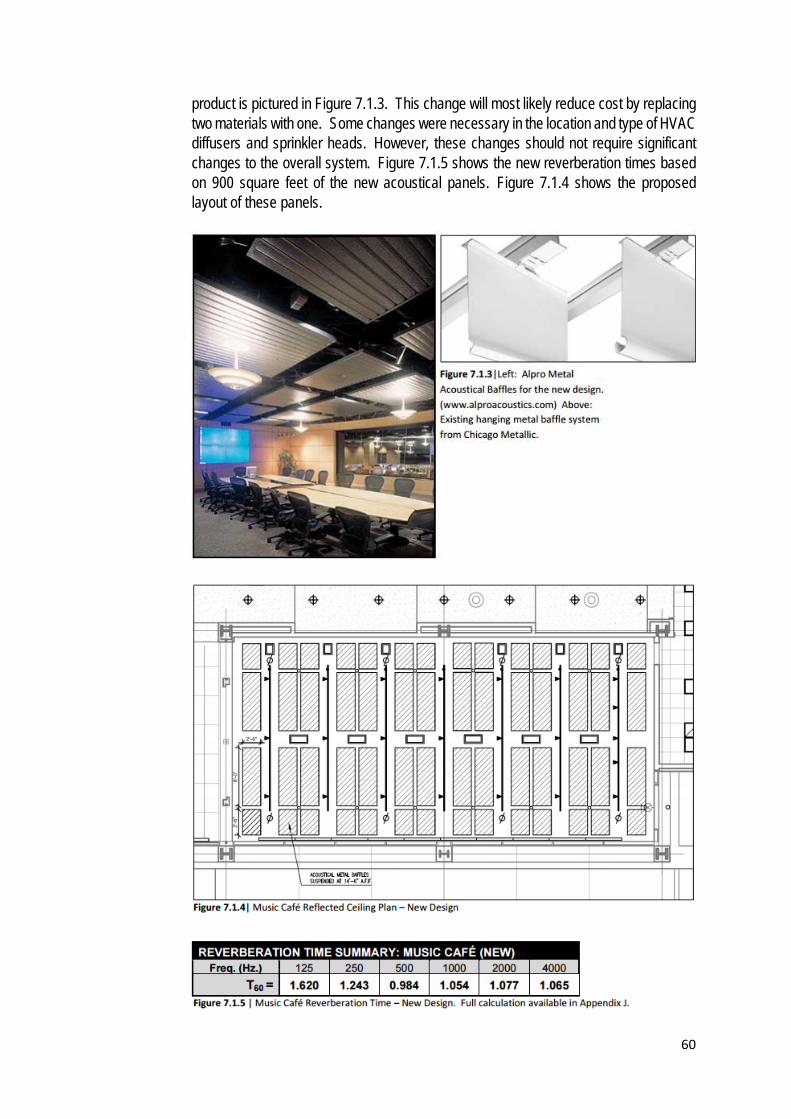
product is pictured in Figure 7.1.3. This change will most likely reduce cost by replacing two materials with one. Some changes were necessary in the location and type of HVAC diffusers and sprinkler heads. However, these changes should not require significant changes to the overall system. Figure 7.1.5 shows the new reverberation times based on 900 square feet of the new acoustical panels. Figure 7.1.4 shows the proposed layout of these panels.
60

The new reverberation times are very close to the desired values. According to Architectural Acoustics: Principles and Design, optimum reverberation times at 125 hertz should be 1.3 times the ideal reverberation time at 500 hertz and a multiplier of 1.15 should be used at 250 hertz. These multipliers are used to correct for the fact that the human ear is less sensitive at lower frequencies. With these factors included, the new design is very near the target. The new ceiling system will provide superior acoustical performance at a reduced cost.
CONCLUSION:
In conclusion, noise reduction within a space can be achieved by two methods: improvement of reverberation time and also increasing the STC value. Reverberation time can be improved to ideal level through the use of absorptive materials on ceilings and surrounding walls, providing an optimum acoustical environment. On the other hand, STC values can be increased by changing the materials of the wall in between spaces, which reduces transmission of sound from a space to another, eliminating unwanted noise.
61

3.3 Research Methodology 3.3.1 Acoustic Measuring Equipment
3.3.1.1 Sound Level Meter The device is used to measure the sound level in a particular point in a space. The measured unit is in (dB).
Figure 4: Front and rear view of the measuring device
Specification
Manufacturer LUTRON Lighting Model SL-4023SD Dimension/ Weight 245x68x45 mm / 489g without battery Range 30-130 dB Linearity +- 1.5 dB Grade of Accuracy Not assigned
3.3.1.2 Camera
Camera is used to capture the source of noise such as mechanical devices, speakers, and existing activities and also to record the existing materials in the environment.
3.3.1.3 Measuring Tape It is used to determine the positions of the sound level meter from the ground level and also used to determine the 1.5m x 1.5m grid on the studying area.
62

3.3.2 Methodology a) Preliminary study on the types of spaces to choose a suitable enclosed
area for the study of acoustics. b) Obtain approval from the management office and conduct visits to the case
study site. c) Measure and produce the technical drawings such as floor plans, sections
and elevation digitally based on on-site measurements. d) After standardizing the drawings, determine the grid line of 2m x 2m e) Delegate tasks among group members and clarify on the method of taking
readings and using the tools and equipment before data collection begins. f) Collect data based on the proper procedures (read on 3.3.3). g) Observe and record the existing external and internal noise sources. h) Compile and tabulate the data or reading. i) Carry out calculation and analysis. Draw a conclusion or recommendations
at the end of the analysis.
3.3.3 Data Collection Procedures a) Draw grid lines of 2m x 2m on the site floor plan to identify the position of
data collecting. b) Stand at the intersection point of the grid and hold the measuring device at
1m from the ground. c) Wait patiently until the readings shown on the device are stable coherent
with the surrounding noise and record it down. d) Stand firm and prevent talking while taking readings. e) Specify the noise source that might affect the readings. f) Repeat the steps above for the rest of the intersection points. g) Conduct the study for peak hour (9pm) and non-peak hour (5pm) to
analyze different acoustics condition at different hour.
Figure 5 : One meter measured from the floor level to detect the surrounding noise
63

Zone A is the bread retail area situated at the ground floor of Donutes Café. It covered the entrances, reception, staircase to upper floor and kitchens.
A total of 23 intersection points are covered in Zone A. 13325mm
15000mm
22378mm
2000mm
2000mm
Zone B and C are the upper floors of the café whereby reading areas are situated. It provides the customers a place to enjoy the pastries or drinks, chatting, reading, meeting and etc.
A total of 25 intersection points are covered in Zone B and 12 points in Zone C.
In a nutshell, there are a total of 60 points in these three zones.
64
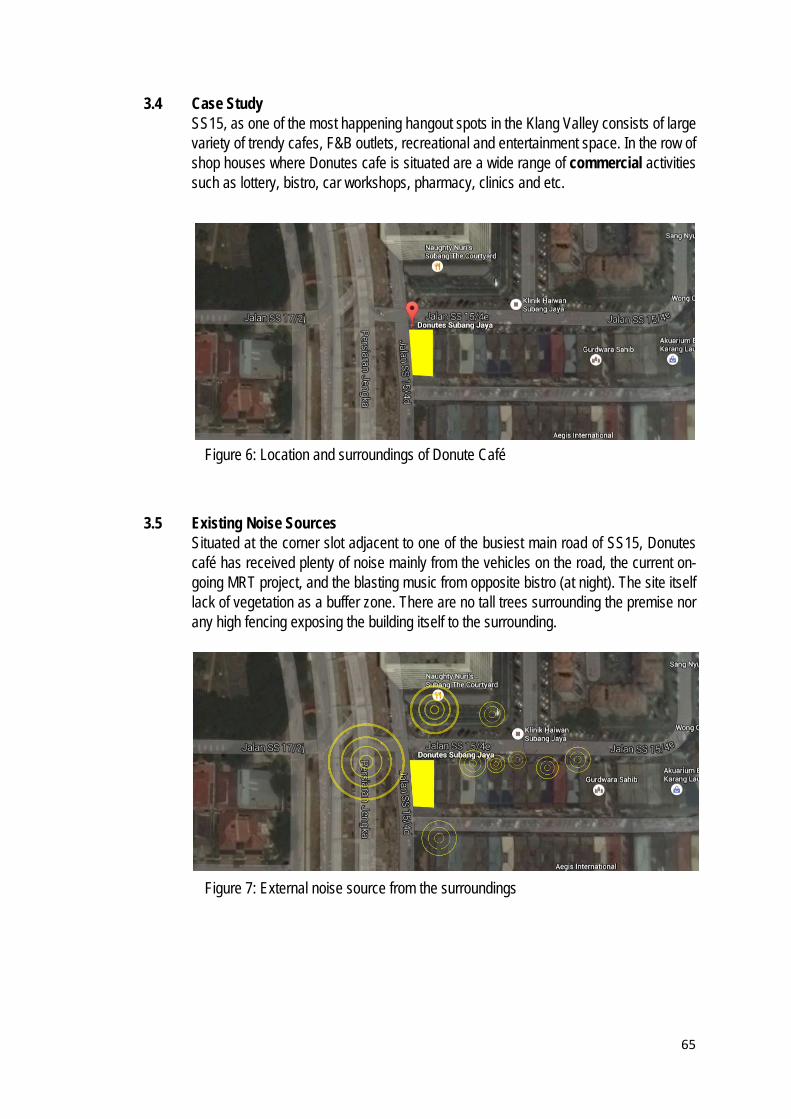
3.4 Case Study SS15, as one of the most happening hangout spots in the Klang Valley consists of large variety of trendy cafes, F&B outlets, recreational and entertainment space. In the row of shop houses where Donutes cafe is situated are a wide range of commercial activities such as lottery, bistro, car workshops, pharmacy, clinics and etc.
3.5 Existing Noise Sources Situated at the corner slot adjacent to one of the busiest main road of SS15, Donutes café has received plenty of noise mainly from the vehicles on the road, the current on-going MRT project, and the blasting music from opposite bistro (at night). The site itself lack of vegetation as a buffer zone. There are no tall trees surrounding the premise nor any high fencing exposing the building itself to the surrounding.
Figure 6: Location and surroundings of Donute Café
Figure 7: External noise source from the surroundings
65

3.5.1 External Noise 3.5.1.1 Site Context
Opposite the Donutes café is a mix-development building houses a lot of F&B business and one of them is the Naughty Nuri’s Bistro. The bistro blasts its music out loud and can be heard from a far distance. Needless to say, it is a major noise to Donutes Café especially at Zone B&C.
Figure 8: Naughty Nuri’s Bistro located at the front entrance of café
Figure 9: Nasi Kandar Pelita located at the rear façade of the café
3.5.1.2 Vehicles The honking and vehicle accelerating noise from the vehicles at main road can cause undesirable noise during the after work rush hours (5pm to 7pm).
66
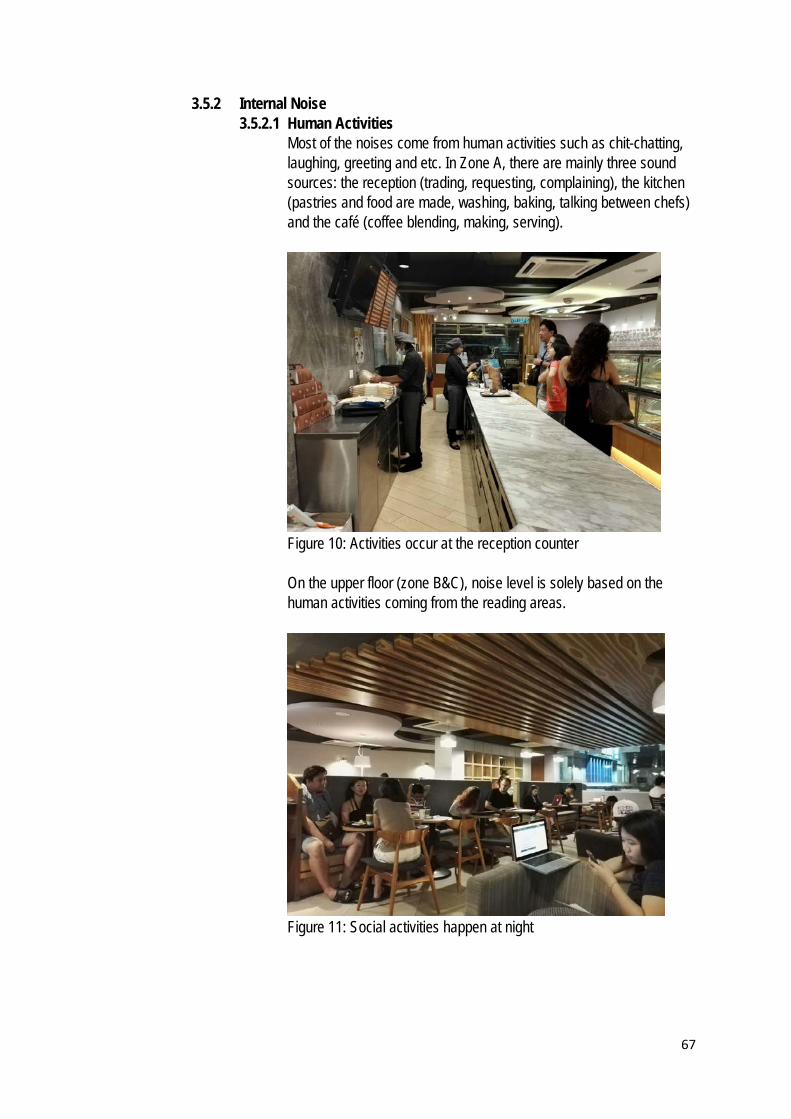
3.5.2 Internal Noise 3.5.2.1 Human Activities
Most of the noises come from human activities such as chit-chatting, laughing, greeting and etc. In Zone A, there are mainly three sound sources: the reception (trading, requesting, complaining), the kitchen (pastries and food are made, washing, baking, talking between chefs) and the café (coffee blending, making, serving).
Figure 10: Activities occur at the reception counter On the upper floor (zone B&C), noise level is solely based on the human activities coming from the reading areas.
Figure 11: Social activities happen at night
67
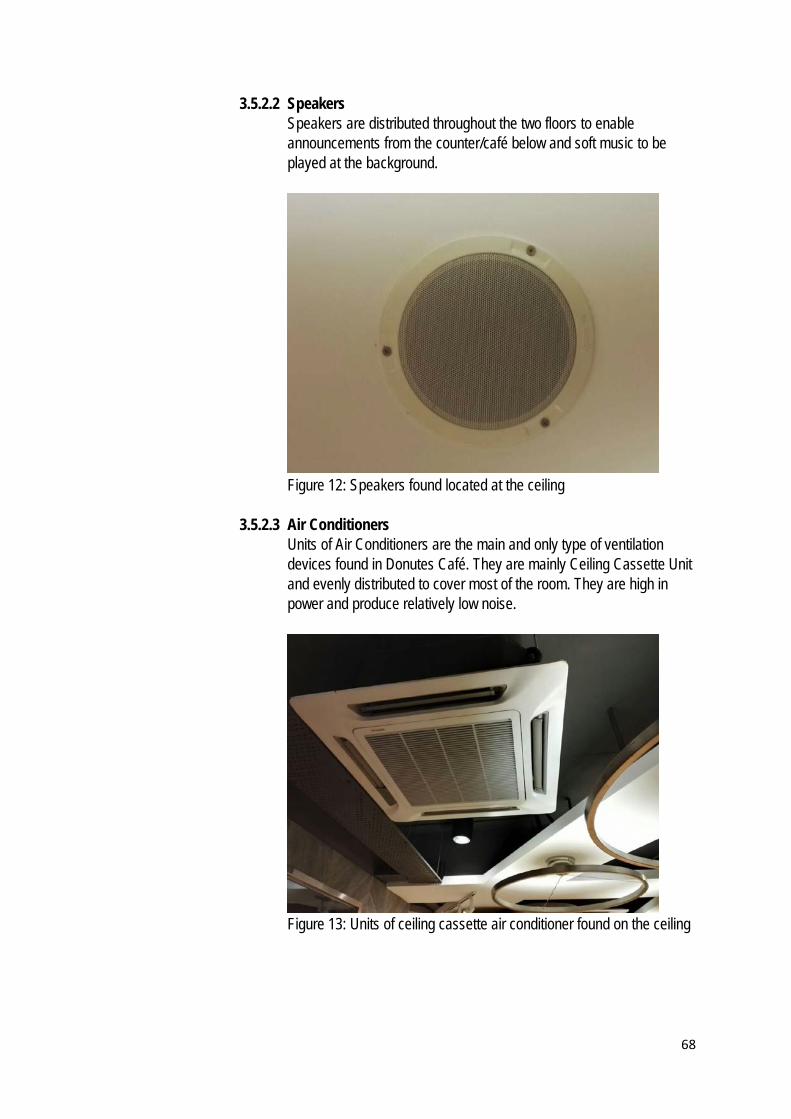
3.5.2.2 Speakers Speakers are distributed throughout the two floors to enable announcements from the counter/café below and soft music to be played at the background.
Figure 12: Speakers found located at the ceiling
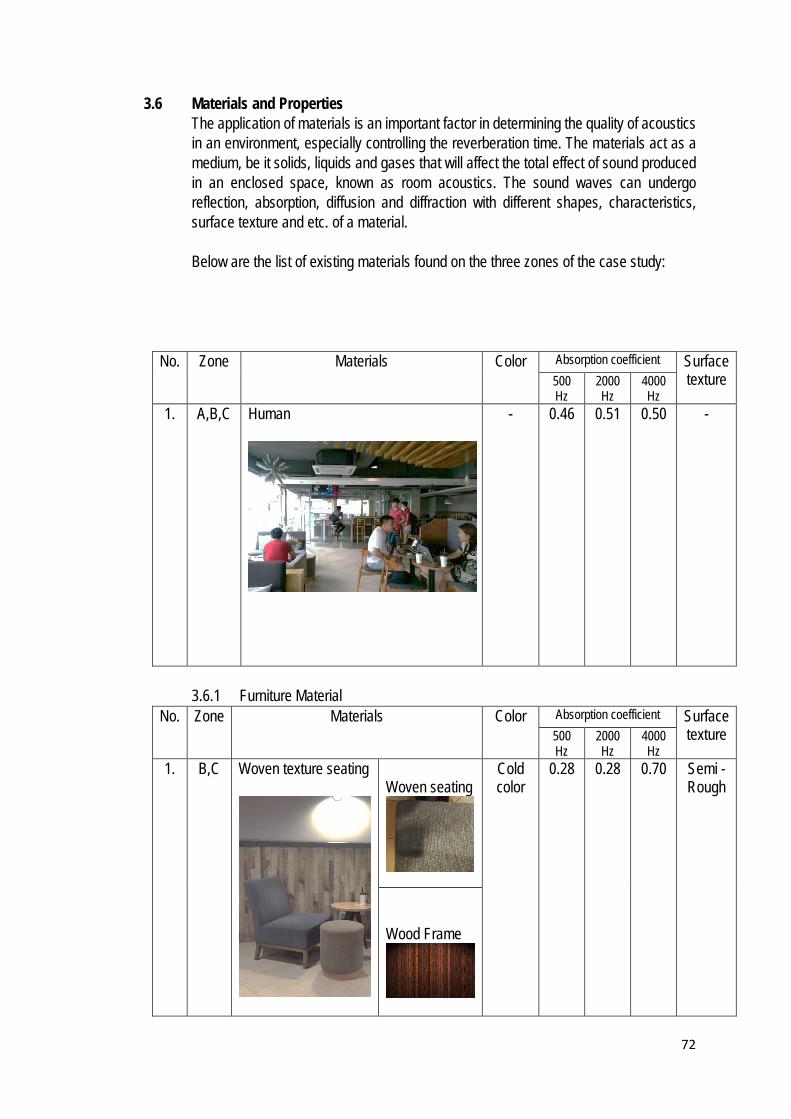
3.5.2.3 Air Conditioners Units of Air Conditioners are the main and only type of ventilation devices found in Donutes Café. They are mainly Ceiling Cassette Unit and evenly distributed to cover most of the room. They are high in power and produce relatively low noise.
Figure 13: Units of ceiling cassette air conditioner found on the ceiling
68

3.5.2.4 Electrical Appliances Appliances such as bread stand that generate cool air to keep food like sandwiches and salads fresh comes with a mini air conditioner. Hence, the bread stand produce noise on its own.
Figure 14: Speakers found located at the ceiling
69

3.5.3 Locations of the noise sources
Figure 14: Identification of noise sources found at ground floor.
Air-conditioner
Speakers
Display Fridge
Human Activity
70 dB
70

Figure 15: Identification of noise sources found at first floor.
Air-conditioner
Speakers
Display Fridge
Human Activity
70 dB
71
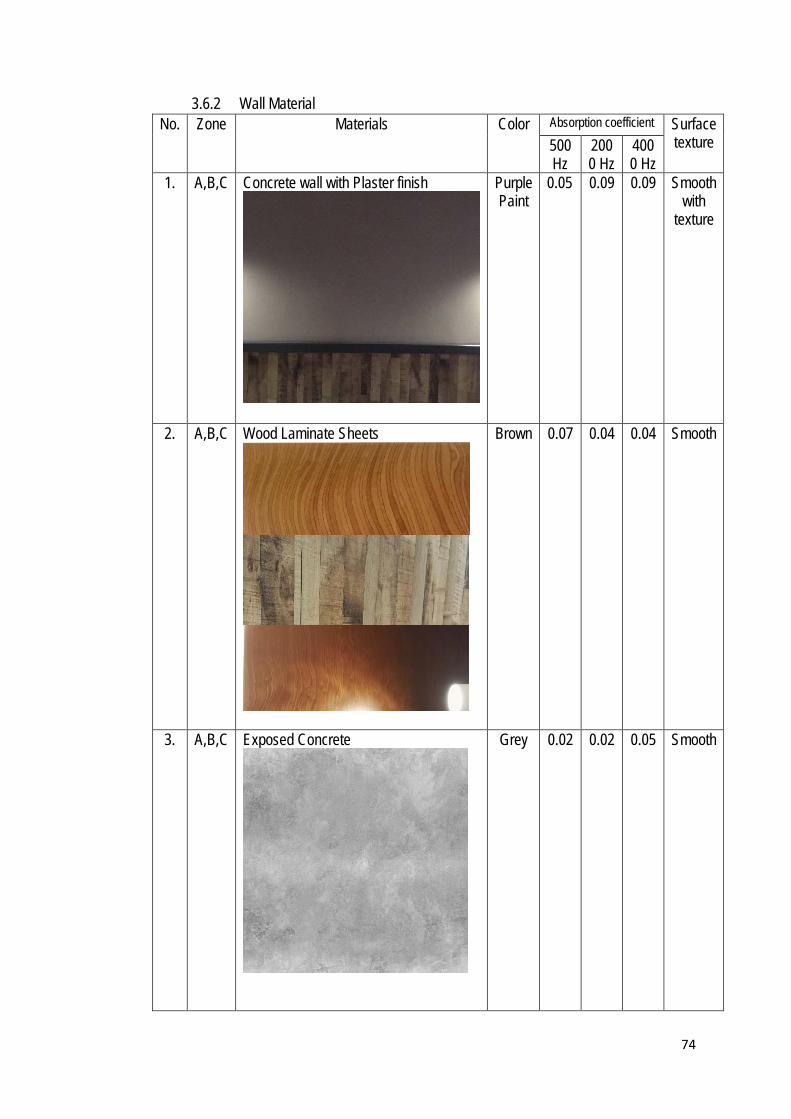
3.6 Materials and Properties The application of materials is an important factor in determining the quality of acoustics in an environment, especially controlling the reverberation time. The materials act as a medium, be it solids, liquids and gases that will affect the total effect of sound produced in an enclosed space, known as room acoustics. The sound waves can undergo reflection, absorption, diffusion and diffraction with different shapes, characteristics, surface texture and etc. of a material. Below are the list of existing materials found on the three zones of the case study:
No. Zone Materials Color Absorption coefficient Surface texture 500
Hz 2000 Hz
4000 Hz
1. A,B,C Human
- 0.46 0.51 0.50 -
3.6.1 Furniture Material
No. Zone Materials Color Absorption coefficient Surface texture 500
Hz 2000 Hz
4000 Hz
1. B,C Woven texture seating
Woven seating
Cold color
0.28 0.28 0.70 Semi -Rough
Wood Frame
72

2. A,B Laminated wood bookshelves
Brown 0.07 0.09 0.09 0.07
3. A Bread display stands White 0.01
0.02
0.02
Smooth
Marble
Laminated Wood Sheets
Brown 0.07 0.04 0.04 Smooth
Glass
Transparent
0.12 0.04 0.02 Smooth
Steel
Silver 0.09 0.11 0.11 Smooth
73
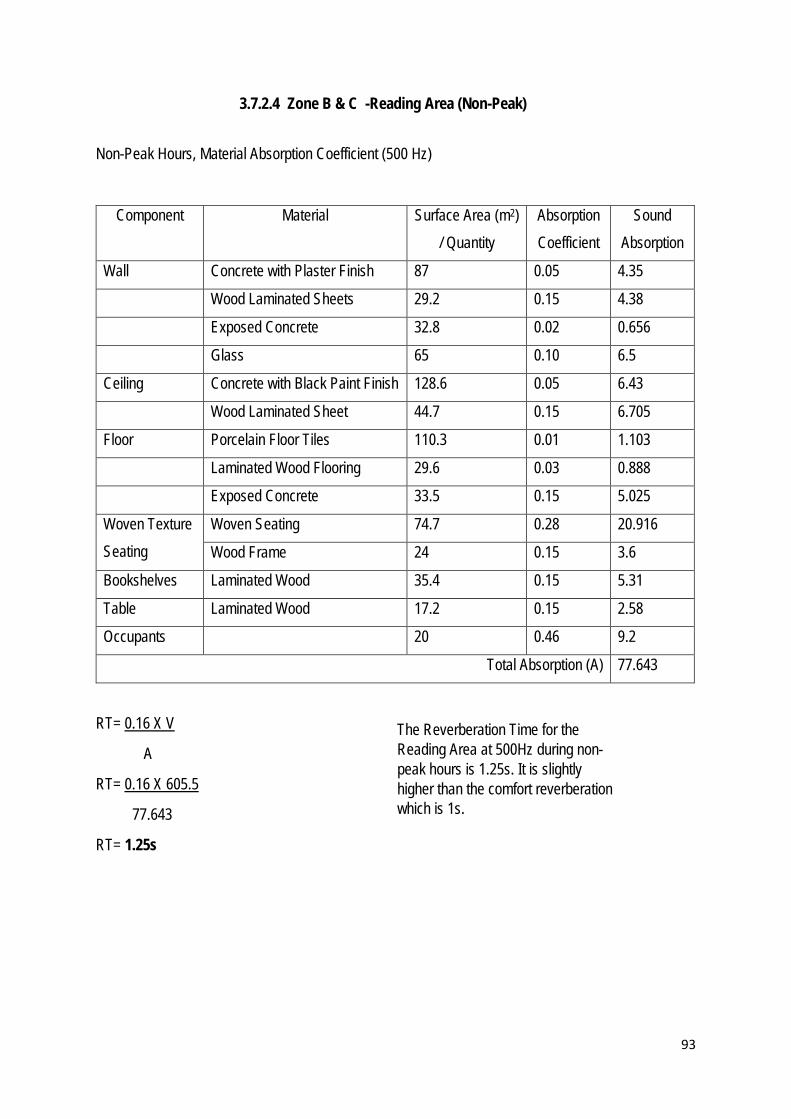
3.6.2 Wall Material No. Zone Materials Color Absorption coefficient Surface
texture 500 Hz
2000 Hz
4000 Hz
1. A,B,C Concrete wall with Plaster finish
Purple Paint
0.05 0.09 0.09 Smooth with
texture
2. A,B,C Wood Laminate Sheets
Brown 0.07 0.04 0.04 Smooth
3. A,B,C Exposed Concrete
Grey 0.02 0.02 0.05 Smooth
74

4. A,B,C Glass
Trans- parent
0.12 0.04 0.02 Smooth
5. B Mirror
Reflective
0.12 0.04 0.02 Smooth
6. A Wood Door
Grey Paint
0.06 0.10 0.10 Rough
7. A Laminated Granite Sheets
Dark Grey
0.02 0.05 0.05 Semi-Rough
75

3.6.3 Ceiling Material No. Zone Materials Color Absorption coefficient Surface
texture 500 Hz
2000 Hz
4000 Hz
1. A,B,C Concrete Ceiling with Black paint finish
Black 0.05 0.09 0.09 Rough
2. B Wood Laminate Sheets
Wood 0.07 0.04 0.04 Smooth
76

3.6.4 Floor Material No. Zone Materials Color Absorption coefficient Surface
texture 500 Hz
2000 Hz
4000 Hz
1. A,B Porcelain Floor Tiles
Light Grey
0.01 0.02 0.02 Semi Smooth
2. A,B Laminated Wood Flooring
Light Brown
0.03 0.05 0.05 Smooth
3. C Exposed Concrete
Dark Grey
0.15 0.02 0.02 Smooth
77

3.7 Acoustic Tabulation and Analysis 3.7.1 Sound Intensity Level (SIL)
3.7.1.1 Sound Meter Reading of Retail Area (Zone A) 3.7.1.1.1 Peak Period
Position of the hearer
Highest readings
The noise are caused around the cashier / reception area
78

3.7.1.1.2 Non-peak Period
Position of the hearer
The noise are caused by the heavy flow of vehicles from the road outside during evening
Noise caused around the cashier /reception area
79

Sound Intensity Level Calculation for Zone A (Peak Hour) Highest Readings: 75, 73, 72
SIL = 10 log ( 𝐼𝐼𝐴𝐴𝐼𝐼𝑜𝑜
)
75 = 10 log ( 𝐼𝐼𝐴𝐴1 𝑋𝑋 10−12
)
7.5 = log ( 𝐼𝐼𝐴𝐴1 𝑋𝑋 10−12
)
107.5 = 𝐼𝐼𝐴𝐴1 𝑋𝑋 10−12
IA = 1 x 10-12 x 107.5
= 3.1623 x 10⁻⁵
Itotal = (3.1623 x 10⁻⁵) + (1.9953 x 10⁻⁵) + (1.5849 x 10⁻⁵) = 6.7425 x 10⁻⁵
Hence, SIL = 10 log ( 𝐼𝐼𝐼𝐼𝑜𝑜
)
= 10 log ( 6.7425 𝑋𝑋 10−5
1 𝑋𝑋 10−12 )
= 78.29 dB
Sound Intensity Level Calculation for Zone A (Non - Peak Hour) Highest Readings: 68.2, 65 ,73
SIL = 10 log ( 𝐼𝐼𝐴𝐴𝐼𝐼𝑜𝑜
)
68.2 = 10 log ( 𝐼𝐼𝐴𝐴1 𝑋𝑋 10−12
)
6.82 = log ( 𝐼𝐼𝐴𝐴1 𝑋𝑋 10−12
)
106.82 = 𝐼𝐼𝐴𝐴1 𝑋𝑋 10−12
IA = 1 x 10-12 x 106.82
= 6.6069 x 10⁻⁶
Itotal = (6.6069 x 10⁻⁶) + (3.1623 x 10⁻⁶) + (1.9933 x 10⁻⁵) = 2.9722 x 10⁻⁵
Hence, SIL = 10 log ( 𝐼𝐼𝐼𝐼𝑜𝑜
)
= 10 log ( 6.7425 𝑋𝑋 10−5
1 𝑋𝑋 10−12 )
= 74.73 dB
SIL = 10 log ( 𝐼𝐼𝐵𝐵𝐼𝐼𝑜𝑜
)
73 = 10 log ( 𝐼𝐼𝐵𝐵1 𝑋𝑋 10−12
)
7.3 = log ( 𝐼𝐼𝐵𝐵1 𝑋𝑋 10−12
)
107.3 = 𝐼𝐼𝐵𝐵1 𝑋𝑋 10−12
IB = 1 x 10-12 x 107.3
= 1.9953 x 10⁻⁵
SIL = 10 log ( 𝐼𝐼𝐶𝐶𝐼𝐼𝑜𝑜
)
72 = 10 log ( 𝐼𝐼𝐶𝐶1 𝑋𝑋 10−12
)
7.2 = log ( 𝐼𝐼𝐶𝐶1 𝑋𝑋 10−12
)
107.2 = 𝐼𝐼𝐶𝐶1 𝑋𝑋 10−12
IC = 1 x 10-12 x 107.2
= 1.5849 x 10⁻⁵
SIL = 10 log ( 𝐼𝐼𝐵𝐵𝐼𝐼𝑜𝑜
)
65 = 10 log ( 𝐼𝐼𝐵𝐵1 𝑋𝑋 10−12
)
6.5 = log ( 𝐼𝐼𝐵𝐵1 𝑋𝑋 10−12
)
106.5= 𝐼𝐼𝐵𝐵1 𝑋𝑋 10−12
IB = 1 x 10-12 x 106.5
= 3.1623 x 10⁻⁶
SIL = 10 log ( 𝐼𝐼𝐶𝐶𝐼𝐼𝑜𝑜
)
73 = 10 log ( 𝐼𝐼𝐶𝐶1 𝑋𝑋 10−12
)
7.3 = log ( 𝐼𝐼𝐶𝐶1 𝑋𝑋 10−12
)
107.3 = 𝐼𝐼𝐶𝐶1 𝑋𝑋 10−12
IC = 1 x 10-12 x 107.3
= 1.9933 x 10⁻⁵
80

3.7.1.1.3 Analysis
The noise at the ground floor (Zone A, retail area) are mainly caused by two sources: cashier area and vehicles. Due to the L shaped nature of the retail area, the noise that propagates mainly from the front part of the building are not able to reach the area behind, leaving some acoustic shadow*. Such area can be determined by the sound reflection ray diagrams below:
Regardless peak or non-peak period, the propagation of sound rays from the highest readings are not able to reach the upper right of the retail zone.
The difference in the sound intensity level between the peak and non-peak period of Zone A is small, 78.29dB – 74.73 dB = 3.56dB.
*An acoustic shadow or sound shadow is an area through which sound waves fail to propagate, due to topographical obstructions or disruption of the waves via phenomena such as wind currents, buildings, or sound barriers.
Figure 16: Sound Reflective Rays diagram of Zone A during Peak Hours
Figure 17: Sound Reflective Rays diagram of Zone A during Non-Peak Hours
81

3.7.1.2 Sound Meter Reading of Reading Area (Zone B & C) 3.7.1.2.1 Peak Period
Position of the hearer
Noise caused by the chatting of a group of people at the table and its location near to the entrance of the staircase.
82

3.7.1.2.2 Non-peak Period
Position of the hearer
Loudest noise in the room caused by chatting and social activities
83

Sound Intensity Level Calculation for Zone B & C (Peak Hour) Highest Readings: 79.6, 79.6, 74.4
SIL = 10 log ( 𝐼𝐼𝐴𝐴𝐼𝐼𝑜𝑜
)
79.6 = 10 log ( 𝐼𝐼𝐴𝐴1 𝑋𝑋 10−12
)
7.96 = log ( 𝐼𝐼𝐴𝐴1 𝑋𝑋 10−12
)
107.96 = 𝐼𝐼𝐴𝐴1 𝑋𝑋 10−12
IA = 1 x 10-12 x 107.96
= 9.120 x 10⁻⁵
Itotal = (9.120 x 10⁻⁵) + (9.120 x 10⁻⁵) = 1.824 x 10⁻⁴
Hence, SIL = 10 log ( 𝐼𝐼𝐼𝐼𝑜𝑜
)
= 10 log ( 1.824 𝑋𝑋 10−4
1 𝑋𝑋 10−12 )
= 82.61 dB
Sound Intensity Level Calculation for Zone B & C(Non - Peak Hour) Highest Readings: 73.5, 75.7, 69.8
SIL = 10 log ( 𝐼𝐼𝐴𝐴𝐼𝐼𝑜𝑜
)
73.5 = 10 log ( 𝐼𝐼𝐴𝐴1 𝑋𝑋 10−12
)
7.35 = log ( 𝐼𝐼𝐴𝐴1 𝑋𝑋 10−12
)
107.35 = 𝐼𝐼𝐴𝐴1 𝑋𝑋 10−12
IA = 1 x 10-12 x 107.35
= 2.2387 x 10⁻⁵
Itotal = (2.2387 x 10⁻⁵) + (3.7154 x 10⁻⁵) = 5.9541 x 10⁻⁵
Hence, SIL = 10 log ( 𝐼𝐼𝐼𝐼𝑜𝑜
)
= 10 log ( 5.9541 𝑋𝑋 10−5
1 𝑋𝑋 10−12 )
= 77.75 dB
SIL = 10 log ( 𝐼𝐼𝐵𝐵𝐼𝐼𝑜𝑜
)
79.6 = 10 log ( 𝐼𝐼𝐵𝐵1 𝑋𝑋 10−12
)
7.96 = log ( 𝐼𝐼𝐵𝐵1 𝑋𝑋 10−12
)
107.96 = 𝐼𝐼𝐵𝐵1 𝑋𝑋 10−12
IB = 1 x 10-12 x 107.96
= 9.120 x 10⁻⁵
SIL = 10 log ( 𝐼𝐼𝐵𝐵𝐼𝐼𝑜𝑜
)
75.7 = 10 log ( 𝐼𝐼𝐵𝐵1 𝑋𝑋 10−12
)
7.57 = log ( 𝐼𝐼𝐵𝐵1 𝑋𝑋 10−12
)
107.57= 𝐼𝐼𝐵𝐵1 𝑋𝑋 10−12
IB = 1 x 10-12 x 107.57
= 3.7154 x 10⁻⁵
84

3.7.1.2.3 Analysis
The noise at the first floor (Zone B&C, reading area) are caused mainly by human activities such as chit-chat, meeting, discussing and etc. During the peak hours, the noise propagate and penetrate through Zone C leaving the far edge of Zone B less uninterrupted whereas in the non-peak hours, noises filled up the entire Zone B and acoustic shadowing the far edge of Zone C.
We can hereby make a statement that the upper and lowest edges of first floor are the quietest areas, because the noise propagated from the main source are the weakest.
The difference in the sound intensity level between the peak and non-peak period of Zone B is small, 82.61dB – 77.75 dB = 4.86dB.
Figure 18: Sound Reflective Rays diagram of Zone B&C during Peak Hours
Figure 19: Sound Reflective Rays diagram of Zone B&C during Non-Peak Hours
85

3.7.2 Reverberation Time (RT)
Reverberation time is the time taken for a sound to decay by 60dB from its original level. It depends on the distance between the surfaces of the room, the absorption of the surfaces and also the frequency of the sound.
Volume of Zone A – Retail Area
V = 173m2 X 3.5m
=605.5m3
Volume of Zone B & C– Reading Area
V = 116m2 X 3.5m
=406m3
86

3.7.2.1 Zone A- Retail Area (Peak)
Peak Hours, Material Absorption Coefficient (500 Hz)
Component Material Surface Area (m2) / Quantity
Absorption Coefficient
Sound Absorption
Wall Concrete with Plaster Finish 65.3 0.05 3.265
Wood Laminated Sheets 30.8 0.15 4.62
Exposed Concrete 28.1 0.02 0.562
Glass 27.6 0.10 2.76
Mirror 15.7 0.10 1.57
Wood Door 2.1 0.15 0.315
Laminated Granite Sheets 25.4 0.02 0.508
Ceiling Concrete with Black Paint Finish 64.8 0.05 3.24
Suspended Plasterboard 43.2 0.8 34.56
Floor Porcelain Floor Tiles 102.8 0.01 1.028
Laminated Wood Flooring 13 0.03 0.39
Bread Display Stands
Marble 10 0.01 0.1
Wood Laminated 18 0.15 2.7
Glass 50.8 0.10 5.08
Steel 39.8 0.09 3.582
Occupants 10 0.46 4.6
Total Absorption (A) 68.88
RT= 0.16 X V
A
RT= 0.16 X 406
68.88
RT= 0.94s
The Reverberation Time for the Retail Area at 500Hz during peak hours is 0.94s. This does not fall within the comfort reverberation.
87

Peak Hours, Material Absorption Coefficient (2000 Hz)
Component Material Surface Area (m2) / Quantity
Absorption Coefficient
Sound Absorption
Wall Concrete with Plaster Finish 65.3 0.09 5.877
Wood Laminated Sheets 30.8 0.10 3.08
Exposed Concrete 28.1 0.02 0.562
Glass 27.6 0.05 1.38
Mirror 15.7 0.05 0.785
Wood Door 2.1 0.10 0.21
Laminated Granite Sheets 25.4 0.05 1.27
Ceiling Concrete with Black Paint Finish 64.8 0.09 5.832
Suspended Plasterboard 43.2 0.6 25.92
Floor Porcelain Floor Tiles 102.8 0.02 2.056
Laminated Wood Flooring 13 0.05 0.65
Bread Display Stands
Marble 18 0.02 0.36
Wood Laminated 50.8 0.10 5.08
Glass 39.8 0.05 1.99
Steel 10 0.11 1.1
Occupants 10 0.51 5.1
Total Absorption (A) 61.252
RT= 0.16 X V
A
RT= 0.16 X 406
61.252
RT= 1.06s
The Reverberation Time for the Retail Area at 2000Hz during peak hours is 1.06s. This does not fall within the comfort reverberation.
88

3.7.2.2 Zone A -Retail Area (Non-Peak)
Non-Peak Hours, Material Absorption Coefficient (500 Hz)
Component Material Surface Area (m2) / Quantity
Absorption Coefficient
Sound Absorption
Wall Concrete with Plaster Finish 65.3 0.05 3.265
Wood Laminated Sheets 30.8 0.15 4.62
Exposed Concrete 28.1 0.02 0.562
Glass 27.6 0.10 2.76
Mirror 15.7 0.10 1.57
Wood Door 2.1 0.15 0.315
Laminated Granite Sheets 25.4 0.02 0.508
Ceiling Concrete with Black Paint Finish 64.8 0.05 3.24
Suspended Plasterboard 43.2 0.8 34.56
Floor Porcelain Floor Tiles 102.8 0.01 1.028
Laminated Wood Flooring 13 0.03 0.39
Bread Display Stands
Marble 10 0.01 0.1
Wood Laminated 18 0.15 2.7
Glass 50.8 0.10 5.08
Steel 39.8 0.09 3.582
Occupants 3 0.46 1.38
Total Absorption (A) 65.66
RT= 0.16 X V
A
RT= 0.16 X 406
65.66
RT= 0.99s
The Reverberation Time for the Retail Area at 500Hz during non-peak hours is 0.99s. This does not fall within the comfort reverberation.
89

Non-Peak Hours, Material Absorption Coefficient (2000 Hz)
Component Material Surface Area (m2) / Quantity
Absorption Coefficient
Sound Absorption
Wall Concrete with Plaster Finish 65.3 0.09 5.877
Wood Laminated Sheets 30.8 0.10 3.08
Exposed Concrete 28.1 0.02 0.562
Glass 27.6 0.05 1.38
Mirror 15.7 0.05 0.785
Wood Door 2.1 0.10 0.21
Laminated Granite Sheets 25.4 0.05 1.27
Ceiling Concrete with Black Paint Finish 64.8 0.09 5.832
Suspended Plasterboard 43.2 0.6 25.92
Floor Porcelain Floor Tiles 102.8 0.02 2.056
Laminated Wood Flooring 13 0.05 0.65
Bread Display Stands
Marble 18 0.02 0.36
Wood Laminated 50.8 0.10 5.08
Glass 39.8 0.05 1.99
Steel 10 0.11 1.1
Occupants 3 0.51 1.53
Total Absorption (A) 57.682
RT= 0.16 X V
A
RT= 0.16 X 406
57.682
RT= 1.13s
The Reverberation Time for the Retail Area at 2000Hz during non-peak hours is 1.13s. It is slightly higher than the comfort reverberation which is 1s.
90

3.7.2.3 Zone B & C -Reading Area (Peak)
Peak Hours, Material Absorption Coefficient (500 Hz)
Component Material Surface Area (m2) / Quantity
Absorption Coefficient
Sound Absorption
Wall Concrete with Plaster Finish 87 0.05 4.35
Wood Laminated Sheets 29.2 0.15 4.38
Exposed Concrete 32.8 0.02 0.656
Glass 65 0.10 6.5
Ceiling Concrete with Black Paint Finish 128.6 0.05 6.43
Wood Laminated Sheet 44.7 0.15 6.705
Floor Porcelain Floor Tiles 110.3 0.01 1.103
Laminated Wood Flooring 29.6 0.03 0.888
Exposed Concrete 33.5 0.15 5.025
Woven Texture Seating
Woven Seating 74.7 0.28 20.916
Wood Frame 24 0.15 3.6
Bookshelves Laminated Wood 35.4 0.15 5.31
Table Laminated Wood 17.2 0.15 2.58
Occupants 60 0.46 27.6
Total Absorption (A) 96.043
RT= 0.16 X V
A
RT= 0.16 X 605.5
96.043
RT= 1.01s
The Reverberation Time for the Reading Area at 500Hz during peak hours is 1.01s. This does not fall within the comfort reverberation.
91

Peak Hours, Material Absorption Coefficient (2000 Hz)
Component Material Surface Area (m2) / Quantity
Absorption Coefficient
Sound Absorption
Wall Concrete with Plaster Finish 87 0.09 7.83
Wood Laminated Sheets 29.2 0.10 2.92
Exposed Concrete 32.8 0.02 0.656
Glass 65 0.05 3.25
Ceiling Concrete with Black Paint Finish 128.6 0.09 11.574
Wood Laminated Sheet 44.7 0.10 4.47
Floor Porcelain Floor Tiles 110.3 0.02 2.206
Laminated Wood Flooring 29.6 0.05 1.48
Exposed Concrete 33.5 0.02 0.67
Woven Texture Seating
Woven Seating 74.7 0.28 20.916
Wood Frame 24 0.10 2.4
Bookshelves Laminated Wood 35.4 0.10 3.54
Table Laminated Wood 17.2 0.10 1.72
Occupants 60 0.51 30.6
Total Absorption (A) 94.232
RT= 0.16 X V
A
RT= 0.16 X 605.5
94.232
RT= 1.03s
The Reverberation Time for the Reading Area at 2000Hz during peak hours is 1.03s. This does not fall within the comfort reverberation.
92
3.7.2.4 Zone B & C -Reading Area (Non-Peak)
Non-Peak Hours, Material Absorption Coefficient (500 Hz)
Component Material Surface Area (m2) / Quantity
Absorption Coefficient
Sound Absorption
Wall Concrete with Plaster Finish 87 0.05 4.35
Wood Laminated Sheets 29.2 0.15 4.38
Exposed Concrete 32.8 0.02 0.656
Glass 65 0.10 6.5
Ceiling Concrete with Black Paint Finish 128.6 0.05 6.43
Wood Laminated Sheet 44.7 0.15 6.705
Floor Porcelain Floor Tiles 110.3 0.01 1.103
Laminated Wood Flooring 29.6 0.03 0.888
Exposed Concrete 33.5 0.15 5.025
Woven Texture Seating
Woven Seating 74.7 0.28 20.916
Wood Frame 24 0.15 3.6
Bookshelves Laminated Wood 35.4 0.15 5.31
Table Laminated Wood 17.2 0.15 2.58
Occupants 20 0.46 9.2
Total Absorption (A) 77.643
RT= 0.16 X V
A
RT= 0.16 X 605.5
77.643
RT= 1.25s
The Reverberation Time for the Reading Area at 500Hz during non-peak hours is 1.25s. It is slightly higher than the comfort reverberation which is 1s.
93

Non-Peak Hours, Material Absorption Coefficient (2000 Hz)
Component Material Surface Area (m2) / Quantity
Absorption Coefficient
Sound Absorption
Wall Concrete with Plaster Finish 87 0.09 7.83
Wood Laminated Sheets 29.2 0.10 2.92
Exposed Concrete 32.8 0.02 0.656
Glass 65 0.05 3.25
Ceiling Concrete with Black Paint Finish 128.6 0.09 11.574
Wood Laminated Sheet 44.7 0.10 4.47
Floor Porcelain Floor Tiles 110.3 0.02 2.206
Laminated Wood Flooring 29.6 0.05 1.48
Exposed Concrete 33.5 0.02 0.67
Woven Texture Seating
Woven Seating 74.7 0.28 20.916
Wood Frame 24 0.10 2.4
Bookshelves Laminated Wood 35.4 0.10 3.54
Table Laminated Wood 17.2 0.10 1.72
Occupants 20 0.51 10.2
Total Absorption (A) 73.832
RT= 0.16 X V
A
RT= 0.16 X 605.5
73.832
RT= 1.31s
The Reverberation Time for the Reading Area at 2000Hz during non-peak hours is 1.31s. It is slightly higher than the comfort reverberation which is 1s.
94

3.7.2.5 Analysis We have calculated the Reverberation Times (RT) for retail area and reading area in 500Hz and 2000Hz to find out the ranges of values in different sound frequency. The results are tabulated into the table below:
Area Period Range (sec) Zone A
(Retail Area) Peak 0.94 - 1.06
Non-peak
0.99 - 1.13
Zone B & C (Reading Area)
Peak 1.01 -1.03
Non-peak
1.25 - 1.31
It can be concluded that the RT during the non-peak is higher than peak hours due to the decreasing of number of occupants in the room. This is because human is also a sound absorber that plays a part in affecting the RT of a space. We have identified that Donutes Café has applied a design strategy in reducing its bouncing noises from the surface. The design of double ceiling of the retail area has efficiently reduced the RT by using suspended plasterboard as sound absorber.
Figure 20: Suspended plaster boards found above the retail area
Figure 21: Suspended wooden panels found above the reading area
95
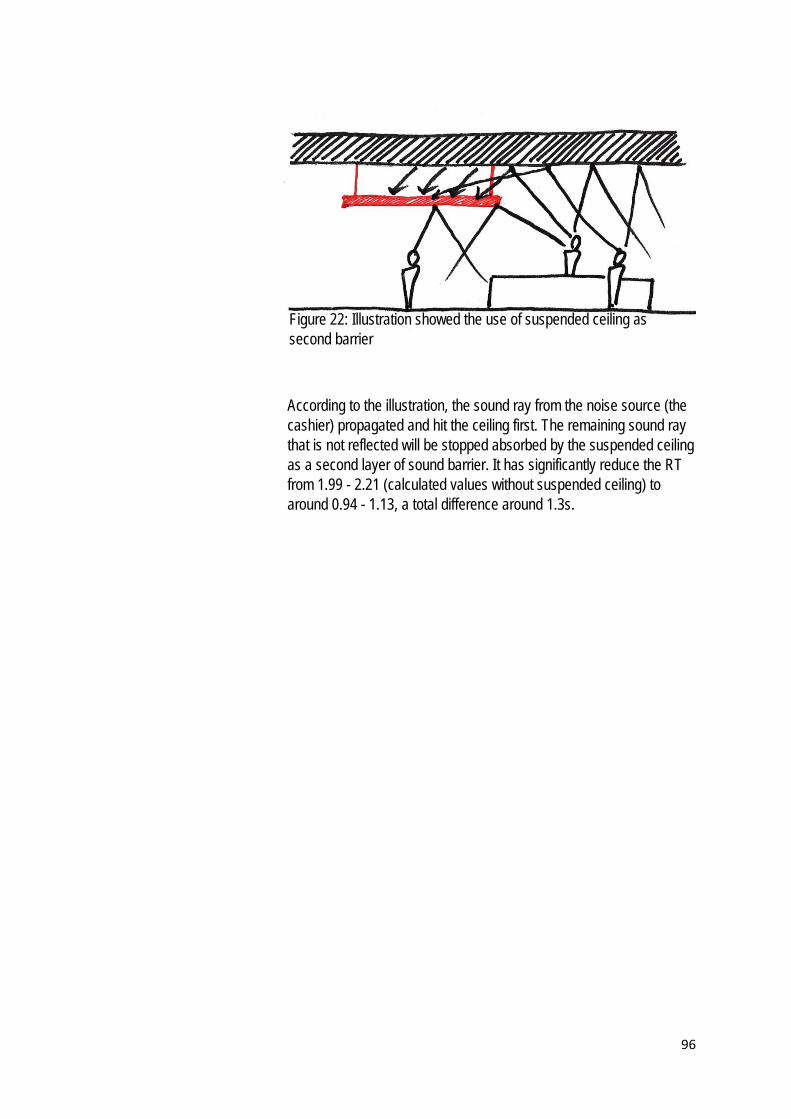
According to the illustration, the sound ray from the noise source (the cashier) propagated and hit the ceiling first. The remaining sound ray that is not reflected will be stopped absorbed by the suspended ceiling as a second layer of sound barrier. It has significantly reduce the RT from 1.99 - 2.21 (calculated values without suspended ceiling) to around 0.94 - 1.13, a total difference around 1.3s.
Figure 22: Illustration showed the use of suspended ceiling as second barrier
96

3.7.3 Sound Reduction Index (SRI)
Component Material Color Finish Surface Area (m2)
Sound Reduction Index (R) (500Hz)
Transmission Coefficient,
(T) T= 1
𝑙𝑙𝑙𝑙𝑙𝑙−1 ( 𝑅𝑅10)
Wall Gypsum plasterboard
Dark Grey Semi-Rough
○AE
A13.19 A○BE
A21.98 52 6.310 X 10⁻⁶
Window Glass
Transparent Smooth A○BE
A8.56 26 2.512 X 10⁻³
Door Glass
Transparent Smooth A○AE
A12.46 A○BE
A3.85 30 1 X 10⁻³
Air-conditioner
Speakers
Display Fridge
Human Activity
A
B
97

Figure 23: Elevation of Wall A
3.7.3.1.1 Wall A
𝑇𝑇𝑂𝑂 = (𝑇𝑇1 𝑋𝑋 𝐴𝐴1)+(𝑇𝑇2 𝑋𝑋 𝐴𝐴2)(𝐴𝐴1+ 𝐴𝐴2)
= �6.310 𝑋𝑋 10−6 𝑋𝑋 13.19�+� 1 𝑋𝑋 10−3 𝑋𝑋 12.46�( 13.19+12.46 )
= 4.890 X 10⁻⁴
R= 10 log ( 1𝑇𝑇𝑜𝑜
)
= 10 log ( 14.890 𝑋𝑋 10−4
)
= 10 log (2044.99)
= 33.11dB
Hence, overall SRI= 33.11dB.
98
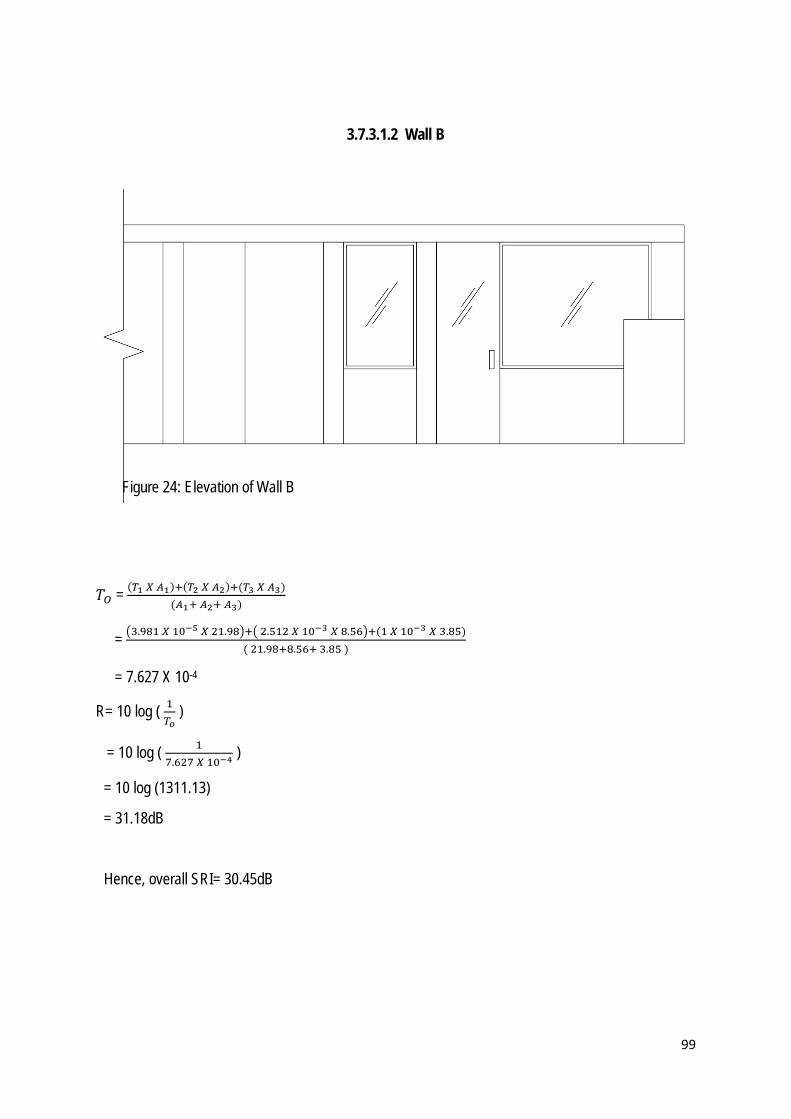
3.7.3.1.2 Wall B
𝑇𝑇𝑂𝑂 = (𝑇𝑇1 𝑋𝑋 𝐴𝐴1)+(𝑇𝑇2 𝑋𝑋 𝐴𝐴2)+(𝑇𝑇3 𝑋𝑋 𝐴𝐴3)(𝐴𝐴1+ 𝐴𝐴2+ 𝐴𝐴3)
= �3.981 𝑋𝑋 10−5 𝑋𝑋 21.98�+� 2.512 𝑋𝑋 10−3 𝑋𝑋 8.56�+(1 𝑋𝑋 10−3 𝑋𝑋 3.85)( 21.98+8.56+ 3.85 )
= 7.627 X 10⁻⁴
R= 10 log ( 1𝑇𝑇𝑜𝑜
)
= 10 log ( 17.627 𝑋𝑋 10−4
)
= 10 log (1311.13)
= 31.18dB
Hence, overall SRI= 30.45dB
Figure 24: Elevation of Wall B
99

3.7.3.2 Zone B & C – Reading Zone
Component Material Color Finish Surface Area (m2)
Sound Reduction Index (R) (500Hz)
Transmission Coefficient,
(T) T= 1
𝑙𝑙𝑙𝑙𝑙𝑙−1 ( 𝑅𝑅10)
Wall Brick wall
Purple Paint
Smooth A○C E
A17.01 A○D E
A 7.67 54 3.981 X 10⁻⁶
Window Glass
Transparent
Smooth A○C E
A14.88 A○D E
A14.55 26 2.512 X 10⁻³
Door Glass
Transparent
Smooth A○C E
A3.30 30 1 X 10⁻³
Air-conditioner
Speakers
Display Fridge
Human Activity
C
D
100
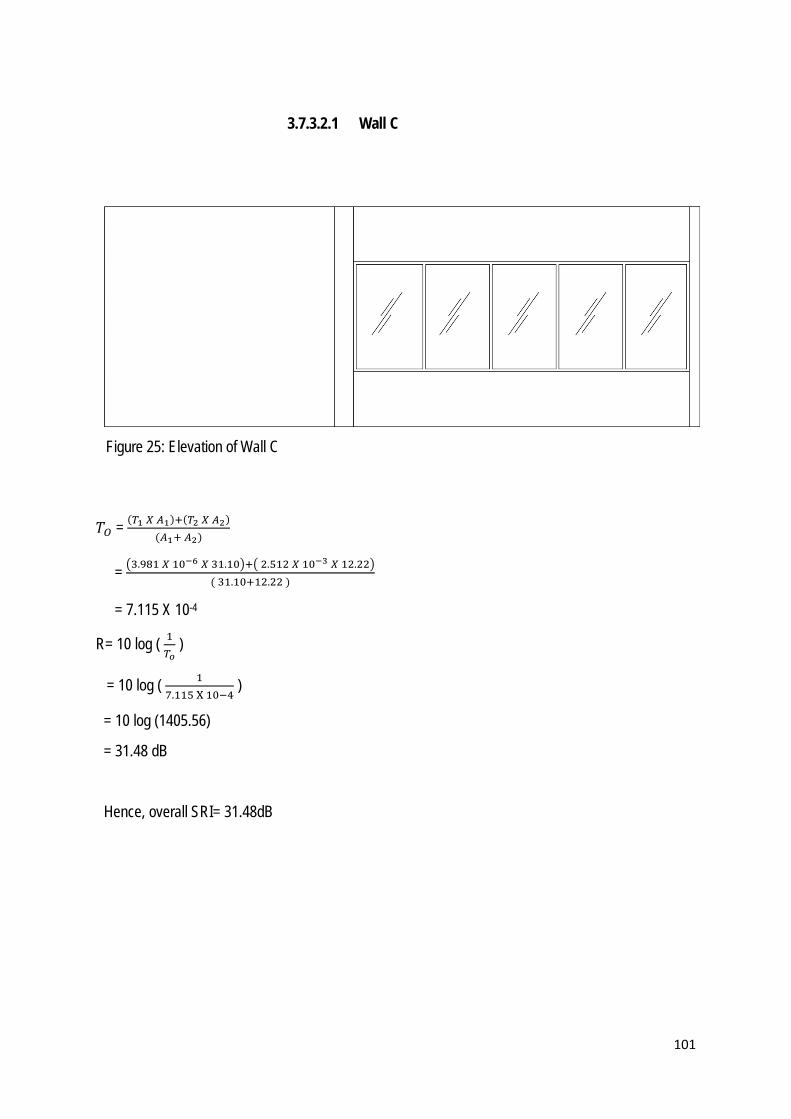
3.7.3.2.1 Wall C
𝑇𝑇𝑂𝑂 = (𝑇𝑇1 𝑋𝑋 𝐴𝐴1)+(𝑇𝑇2 𝑋𝑋 𝐴𝐴2)(𝐴𝐴1+ 𝐴𝐴2)
= �3.981 𝑋𝑋 10−6 𝑋𝑋 31.10�+� 2.512 𝑋𝑋 10−3 𝑋𝑋 12.22�( 31.10+12.22 )
= 7.115 X 10⁻⁴
R= 10 log ( 1𝑇𝑇𝑜𝑜
)
= 10 log ( 17.115 X 10⁻⁴
)
= 10 log (1405.56)
= 31.48 dB
Hence, overall SRI= 31.48dB
Figure 25: Elevation of Wall C
101
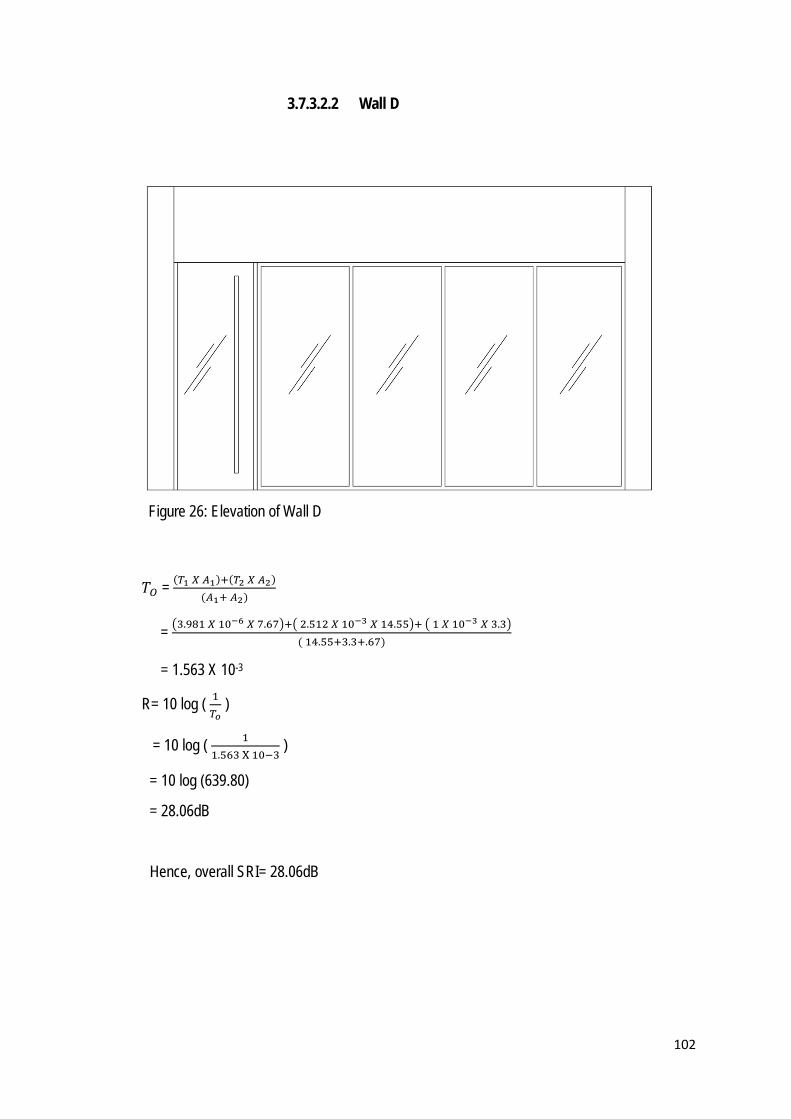
3.7.3.2.2 Wall D
𝑇𝑇𝑂𝑂 = (𝑇𝑇1 𝑋𝑋 𝐴𝐴1)+(𝑇𝑇2 𝑋𝑋 𝐴𝐴2)(𝐴𝐴1+ 𝐴𝐴2)
= �3.981 𝑋𝑋 10−6 𝑋𝑋 7.67�+� 2.512 𝑋𝑋 10−3 𝑋𝑋 14.55�+ � 1 𝑋𝑋 10−3 𝑋𝑋 3.3�( 14.55+3.3+.67)
= 1.563 X 10⁻³
R= 10 log ( 1𝑇𝑇𝑜𝑜
)
= 10 log ( 11.563 X 10⁻³
)
= 10 log (639.80)
= 28.06dB
Hence, overall SRI= 28.06dB
Figure 26: Elevation of Wall D
102

3.7.3.3 Analysis
Based on the calculations obtained, the gypsum plasterboard walls on the ground floor give an SRI of 33.11dB and 30.45dB for Wall A and Wall B respectively. This relates back to the sound pressure level data recorded with exterior data being 84.7dB and interior data 58dB. Noise from the external surrounding transmitted into the ground floor retail area can be reduced up to 26.7dB as it passes through the medium that separated interior and exterior. On the other hand, the brick walls on the first floor give an SRI of 31.48dB and 28.06 respectively to Wall C and Wall D. An abundance of glass used on Wall D causes it to have a low reduction index. This relates back to the sound pressure level data recorded with exterior data being 83dB and interior data 63.6dB. Noise from the external surrounding transmitted into the first floor reading area can be reduced up to 20.63 dB as it passes through the medium separating them.
One of the factor that contributes to the transmission of noise into the internal space is through the leakage of sound via the gap present in between glass doors and the walls. The presence of this gap is to prevent the shatter of glass doors when it is being shut with a great impact. However, this gap allows noise to leak into interior space, increasing sound pressure level within the space.
Figure 27: Direct impact sound through gap between glass doors and walls.
103

3.8 Conclusion
From the analysis, it is evident that the sound level within the café is higher than the recommended value of 45dB for restaurants. This is due to the placement of the building within the site context of a chaotic environment: corner lot adjacent to the main road, with no vegetation acting as buffering zone. At the same time, it is also located right beside SS15 Courtyard, which houses numerous restaurants, contributing even more to the increase in sound level.
Besides that, the reverberation time of the space also does not fall into the comfortable zone of 1 second with the highest value being 1.31 seconds and the lowest value being 0.94 seconds. This is due to the abundance of materials with low absorption coefficient like concrete, wood and glass covering large percentages of the surface area within the café. Therefore, little sound is absorbed by these materials and majority of the sound waves are reflected back into the internal space causing multiple reflections from different surfaces within the café. However, this situation can be improved by the usage of sound absorbing materials like carpets and curtains which will reduce the sound energy as sound waves pass through it, facilitating reduction in reverberation time which in turn reduces sound levels.
In addition to that, the sound reduction index of this café is also relatively low as compared to the standard sound reduction index of a typical wall, which is 35dB. The highest value obtained is 33.11dB and lowest value being 28.06dB. This is mainly due to the extensive use of glass enveloping the façade. In order to improve this situation, the thickness of the glass can be increased or the area of glass covering the walls can be decreased. Moreover, a sound lock can also be installed to prevent leakage of sound through penetrations of walls for services installation purposes or gaps in between doors and walls.
In conclusion to the findings from this analysis, the acoustic condition in Donutes Café is below average in terms of its functional space requirement. The high reverberation time and low sound reduction levels require adequate changes to the materials covering surfaces within the café to achieve a comfortable acoustical environment.
Figure 28: An example of achieving ideal reverberation time through usage of materials with good absorbance.
104

4.0 BIBLIOGRAPHY