
BUILDING SAFER COMMUNITIES
36
BOOKFOUR A TOOLKIT FOR PARTICIPATORY SAFETY PLANNING BUILDING SAFER COMMUNITIES THROUGH SYSTEMIC APPROACHES TO VIOLENCE PREVENTION ANALYSING THE SAFETY SITUATION
Transcript of BUILDING SAFER COMMUNITIES

BOOKFOUR
A TOOLKIT FOR PARTICIPATORY SAFETY PLANNING
BUILDING SAFER COMMUNITIESTHROUGH SYSTEMIC APPROACHESTO VIOLENCE PREVENTION
ANALYSING THE SAFETY SITUATIONThe “Toolkit for Participatory Safety Planning” was developed by the “Inclusive
Violence and Crime Prevention Programme” in close cooperation with its partners.
Deutsche Gesellschaft für Internationale Zusammenarbeit (GIZ) GmbH Inclusive Violence and Crime Prevention for Safe Public Spaces (VCP) Programme
GIZ Office Pretoria, P.O. Box 13732, Hatfield 0028 Hatfield Gardens, Block E, Third Floor, 333 Grosvenor Street, Pretoria, South Africa
The toolkit is also available on: www.saferspaces.org.za

Published by
Deutsche Gesellschaft für Internationale Zusammenarbeit (GIZ) GmbH
Based on
Systemic Prevention of Youth Violence: A Handbook to Design and PlanComprehensive Violence Prevention Measures
Responsible/Advice and implementation
Inclusive Violence and Crime Prevention for Safe Public Spaces Programme (VCP) Dr Tina Silbernagl
Concept and realisation
Heike Spohr Christiane Erkens
Editing
Frank Meintjies
Design
www.studio112.co.za
Special thanks to…
Department for Cooperative Governance Civilian Secretariat for Police South African Local Government Association Department for Social Development Gauteng Provincial Department for Community SafetyDepartment for Social Development Eastern Cape ProvinceJoburg City Safety Programme West Rand District MunicipalityAmahlathi Local Municipality Mandela Bay Development Agency Nelson Mandela Metropolitan University Centre for Justice and Crime Prevention Council for Scientific and Industrial Research Mbumba Development ServicesSeriti InstitutePhaphama InitiativeJoint Gender FundRestless DevelopmentTwaai Design

BOO
KFO
UR
PAGE 1
THE A
NA
LYSIS PHA
SECOntEntS
List of Abbreviations 2
The Analysis Phase 3
Tools for the Analysis Phase 4
Tool One: Typology of Violence 5
Tool Two: What´s behind the Violence? Risk Factor Analysis 8
Tool Three: “Escape from the Prison of the Mind” 11
Tool Four: The Violence Tree 16
Tool Five: What makes us strong? 19
Tool Six: “Market Place of Resources” 23
Tool Seven: Choosing the Problem or Focus Area/s to Work on 25
Annex 1 to Chapter E: List of Figures 28

PAGE 2
BMZ Federal Ministry for Economic Cooperation and Development of Germany
CBO Community-based Organisation
CJCP Centre for Justice and Crime Prevention
CSF Community Safety Forum
CSVR Centre for the Study of Violence and Reconciliation
CPF Community Policing Forum
CSIR Council for Scientific and Industrial Research
DSD Department for Social Development
IDP Integrated Development Plan
ISCPS Integrated Social Crime Prevention Strategy
MDG Millennium Development Goals
MRC Medical Research Centre
NDP National Development Plan
NGO Non-Governmental Organisation
SAPS South African Police Service
UNDP United Nations Development Programme
UN HABITAT United Nations Human Settlement Programme
UNODC United Nations Office on Drugs and Crime
WB World Bank
WHO World Health Organisation – Organisation of the United Nations
Symbols used in this toolkit
Observations which mean: “Watch out! Pay attention! Make sure you consider this observation! Possible trap or difficult situation.”
tip means: “This is a proposal. You decide whether you like it and use it”.
Important note or observation.
LISt OF ABBREvIAtIOnS
tH
E An
ALY
SIS PH
ASE
BOO
KFO
UR
PAGE 3
PAR
TIC
IPATIO
NIN
FO CO
LLECT
ION
DATA
AN
ALYSIS
PLAN
NIN
GIM
PLEMEN
TATIO
N
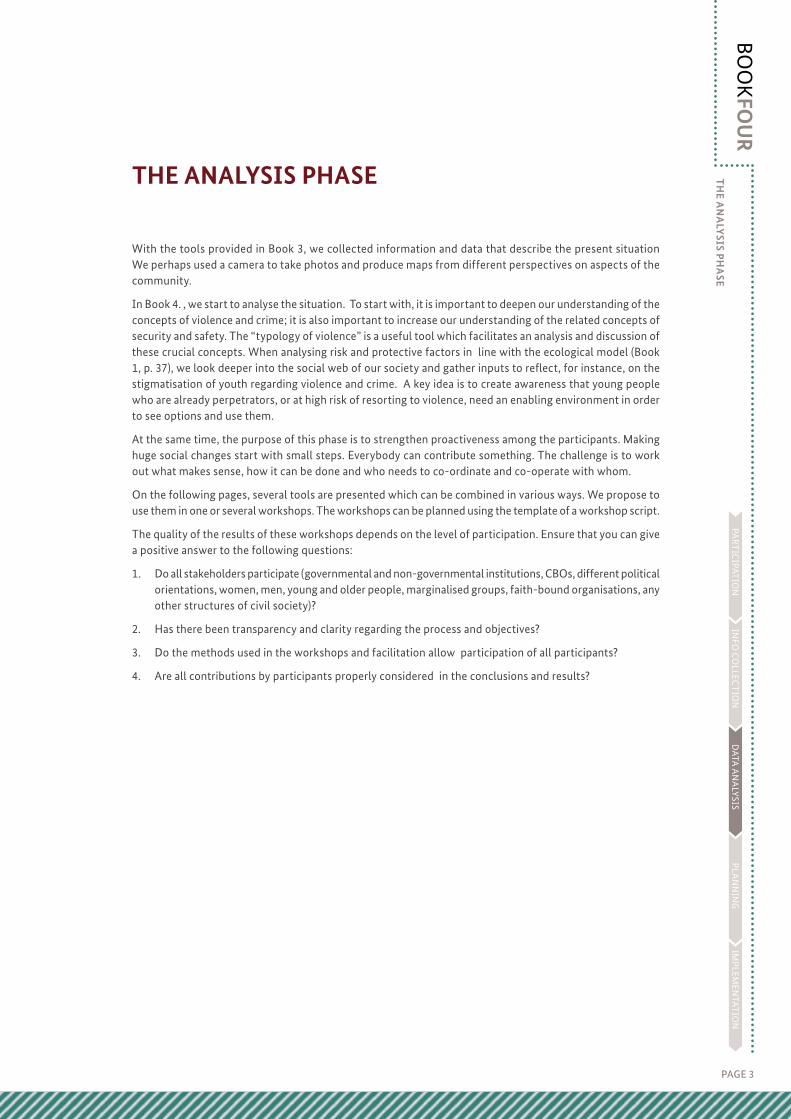
With the tools provided in Book 3, we collected information and data that describe the present situation We perhaps used a camera to take photos and produce maps from different perspectives on aspects of the community.
In Book 4. , we start to analyse the situation. To start with, it is important to deepen our understanding of the concepts of violence and crime; it is also important to increase our understanding of the related concepts of security and safety. The “typology of violence” is a useful tool which facilitates an analysis and discussion of these crucial concepts. When analysing risk and protective factors in line with the ecological model (Book 1, p. 37), we look deeper into the social web of our society and gather inputs to reflect, for instance, on the stigmatisation of youth regarding violence and crime. A key idea is to create awareness that young people who are already perpetrators, or at high risk of resorting to violence, need an enabling environment in order to see options and use them.
At the same time, the purpose of this phase is to strengthen proactiveness among the participants. Making huge social changes start with small steps. Everybody can contribute something. The challenge is to work out what makes sense, how it can be done and who needs to co-ordinate and co-operate with whom.
On the following pages, several tools are presented which can be combined in various ways. We propose to use them in one or several workshops. The workshops can be planned using the template of a workshop script.
The quality of the results of these workshops depends on the level of participation. Ensure that you can give a positive answer to the following questions:
1. Do all stakeholders participate (governmental and non-governmental institutions, CBOs, different political orientations, women, men, young and older people, marginalised groups, faith-bound organisations, any other structures of civil society)?
2. Has there been transparency and clarity regarding the process and objectives?
3. Do the methods used in the workshops and facilitation allow participation of all participants?
4. Are all contributions by participants properly considered in the conclusions and results?
tHE AnALYSIS PHASE

PAGE 4
Overview on proposed tools and Options for their Use
# P tool topics, aspects covered, character of the tooltime required
Required facilitation skills
1Typology of Violence
Awareness raising supports the understanding of important concepts of violence
Min 90 min x
2 Risk Factor AnalysisRisk factors are analysed, the ecological model is introduced for better structuring and understanding of inter-dependencies of the context.
Min 90 min x
3“Escape from the Prison of Mind”
Empathy (understanding and compassion) is strengthened for young people who live in adverse conditions; risk and protective factors are discussed, as well as violence-prevention activities.
Min 90 min x
4The Tree of Violence
Problem or focus areas are formed, clustering risk factors; cause-effect relationships for violence are discussed, analysed and visualised
Min 90 min x
5What makes us strong?
Analysis of protective factors and relevant actors on the different levels of the ecological model, putting young people in the centre of the analysis
Min 120 min x
6Market Place of Resources
Analysis of existing and potential projects/initiatives/contributions to violence and crime prevention and community safety, as well as existing and potential co-operation
Min 120 min x
7Choosing the Problem or Focus Areas
Problem or focus area/s for further planning are selected, discussing concrete criteria.
Min 90 min x
Very easy to use Easy to useRequires some facilitation skills
Requires good facilitation skills
Requires very good facilitation skills
tOOLS FOR tHE AnALYSIS PHASE

tH
E An
ALY
SIS PH
ASE
BOO
KFO
UR
PAGE 5
PAR
TIC
IPATIO
NIN
FO CO
LLECT
ION
DATA
AN
ALYSIS
PLAN
NIN
GIM
PLEMEN
TATIO
N
TOOLOnEtYPOLOgY OF vIOLEnCE
What you need as basis for this tool:The tool works best if participants have had a previous presentation on the definitions of violence. Such a presentation should have covered self-directed, inter-personal and collective violence.(See Book 1, p. 51-53).
Objective:To ensure participants are familiar with the typology of violence, as developed by WHO.
To enable participants to forge links with their own experiences with the proposed systematisation.
To generate discussion of the forms of violence, and get participants to start to distinguish between violence and non-violence, as well as between violence and crime.
To ensure that participants have a broader perspective of violence and crime, shifting from a narrower to a wider understanding of violence.
Aspects of Data Collection/Analysis:Types and nature of violence occurring in the neighbourhood/community and its victims.
Material needed:3 or 4 pin boards (if available), 3 or 4 big sheets of paper (either big brown paper or several flipchart papers connected), several markers in different colours (black, blue, red), moderation cards in 4 different colours or paper in 4 different colours, cut into the size of A-5 size, clue dots, if available , pins, glue and/or tape..
Preparation:One pin board per group – max: 4. You write out Typology of Violence and then use it as the title this tool on each pin board or flipchart. You also place the first few levels of the WHO typology of violence (as indicated by the blue frame in Figure 1) on the board or flipchart. Then place 4 cards with the nature of violence (green frame in Figure 1) to the left. Leave enough space so group members can add other cards.
As facilitator, you should be familiar with the complete typology of violence and the concepts of violence and crime (as below):

PAGE 6
TOOLOnEtYPOLOgY OF vIOLEnCE
Representation of the WHO Typology of Violence:
This is how you would reflect it on the flipchart paper:
Figure 1: Typology of Violence, VCP workshop 02./03.09.13, Jansenville, Ikwezi
Procedure:Divide the whole group into working groups of 5-7 participants each. Depending on the context, it can make sense to have different working groups according to gender, culture or age.
The concrete tasks for the working groups depend on how you decide to divide the groups. In the following example, we use three groups: one purely male group, one purely female group and one mixed group (male and female) with young people only.
Step 1 for group work:
Please identify in step one of the types of violence which occur in your neighbourhood/community and which specifically affect men and boys (for the male group), women and girls (for the female group) and young people (for the youth group). If the type of violence is self-directed, use the green cards. If the form of violence is interpersonal, use the yellow cards, and if it is collective violence, use the blue cards.
violence
nature of violence:
Physical
Sexual
Psychological
Deprivation
Acquaintance StrangerPartner ElderChild
Suicide Self-Abuse Family Partner Community Social Political Economic
InterpersonalSelf-Directed Collective

tH
E An
ALY
SIS PH
ASE
BOO
KFO
UR
PAGE 7
PAR
TIC
IPATIO
NIN
FO CO
LLECT
ION
DATA
AN
ALYSIS
PLAN
NIN
GIM
PLEMEN
TATIO
N
TOOLOnEtYPOLOgY OF vIOLEnCE
Step 2 for group work:
Use the following symbols on the cards to indicate.♀ affects above all girls and women (for the female group)♂ affects above all boys and men (for the male group)♀ affects above all young women or teenage girls (for the youth group)♂ affects above all young men or teenage boys (for the youth group)
Please identify in step 2 those types of violence which affect everyone to a similar degree. These cards should be without a symbol.
Step 3 for group work:
You may want to add this step. Ask groups to identify those types of violence which you think are a crime. Facilitator: check participants’ recollection of the difference between violence and crime as they start work on this step. Participants can indicate which types of violence is a crime. They can stick small dots on the flipchart or make a big coloured dot with a marker.
Plenary discussion:
The groups present their results in the plenary. There will probably be different perceptions of victimisation or other aspects. Use the discussion to point out that it is normal for different groups in our society to see things differently. Through facilitation, draw out the gender, age or culture dimensions of violence. Also, draw attention to difference between crime and violence.
Observations:The objective of the final discussion and conclusions is not to identify what is “correct” and what is “wrong”. It is rather to work out that there are differences with regard to what types of violence affects which. The exercise also highlights differences in how respective groups perceive violence.
End Product:
1hr 30
By the end of the exercise, the objectives would be achieved, including participants’ refamiliarisation with the typology of violence, linking their own knowledge of violence to the typology and creating a deeper understanding of violence as taking a variety of forms.
Additional outputs would include:
• Pin boards showing the different perspectives and perceptions of defined groups on the different types of violence. Concrete examples of different type of violence are generated.
• The gender, age or culture dimensions of violence are discussed, referring to the differences of the group results.
• The differences between crime and violence are discussed.
PAGE 8
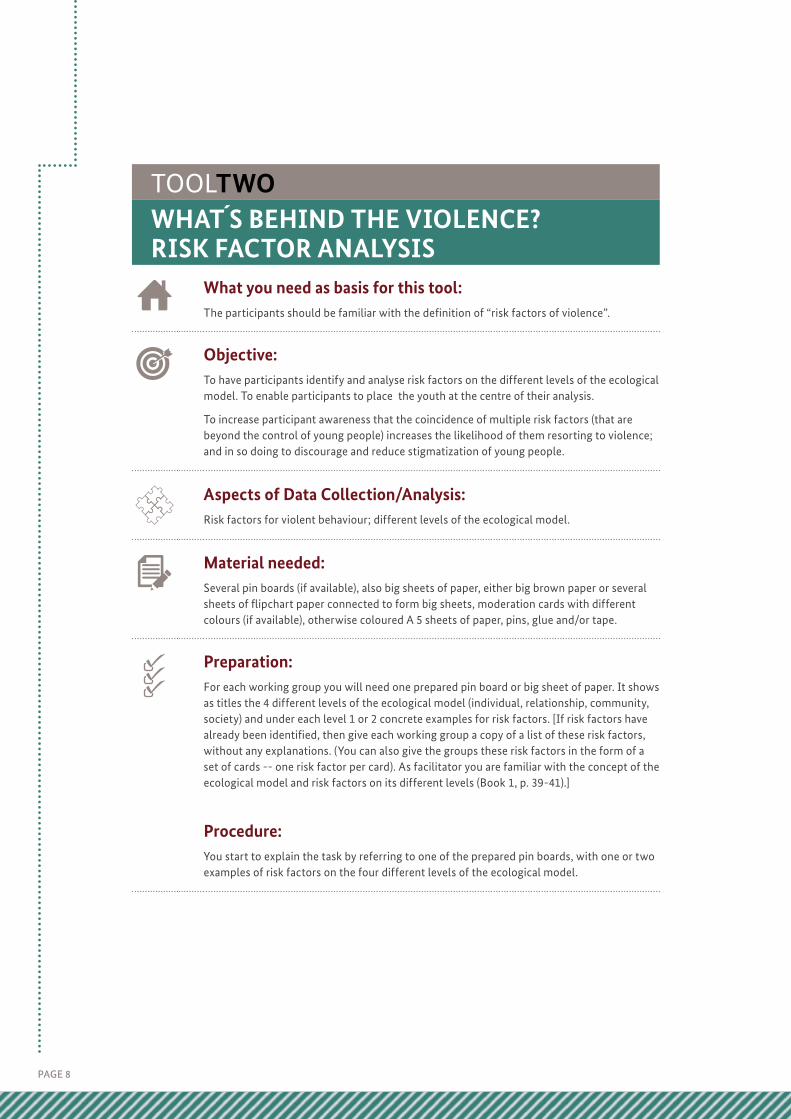
TOOLtWOWHAt´S BEHInD tHE vIOLEnCE? RISk FACtOR AnALYSIS
What you need as basis for this tool:The participants should be familiar with the definition of “risk factors of violence”.
Objective:To have participants identify and analyse risk factors on the different levels of the ecological model. To enable participants to place the youth at the centre of their analysis.
To increase participant awareness that the coincidence of multiple risk factors (that are beyond the control of young people) increases the likelihood of them resorting to violence; and in so doing to discourage and reduce stigmatization of young people.
Aspects of Data Collection/Analysis:Risk factors for violent behaviour; different levels of the ecological model.
Material needed:Several pin boards (if available), also big sheets of paper, either big brown paper or several sheets of flipchart paper connected to form big sheets, moderation cards with different colours (if available), otherwise coloured A 5 sheets of paper, pins, glue and/or tape.
Preparation:For each working group you will need one prepared pin board or big sheet of paper. It shows as titles the 4 different levels of the ecological model (individual, relationship, community, society) and under each level 1 or 2 concrete examples for risk factors. [If risk factors have already been identified, then give each working group a copy of a list of these risk factors, without any explanations. (You can also give the groups these risk factors in the form of a set of cards -- one risk factor per card). As facilitator you are familiar with the concept of the ecological model and risk factors on its different levels (Book 1, p. 39-41).]
Procedure:You start to explain the task by referring to one of the prepared pin boards, with one or two examples of risk factors on the four different levels of the ecological model.

tH
E An
ALY
SIS PH
ASE
BOO
KFO
UR
PAGE 9
PAR
TIC
IPATIO
NIN
FO CO
LLECT
ION
DATA
AN
ALYSIS
PLAN
NIN
GIM
PLEMEN
TATIO
N
TOOLtWOWHAt´S BEHInD tHE vIOLEnCE? RISk FACtOR AnALYSIS
task 1 (if you provide a list of risk factors already identified)
Have a look at the different risk factors on the cards which you now distribute. These are risk factors which have been found in your neighbourhood/community in a previous phase of this process. Have a closer look and discuss on which level you would place the respective risk factor. On which level it is effective? Place it there.
OR task 1 (if so far no risk factors have been identified)
What are factors in your neighbourhood/community that increase the likelihood that young people may develop violent behaviour? Write them on the cards – one risk factor per card.
task 2 (if so far no risk factors have been identified)
Have a closer look at the risk factors and discuss on which level you would place the respective risk factor, on which level it is effective. Place it there.
task2 or 3 respectively:
Depending on the participants of the workshop and the tools planned to follow, there can be a final task in which each group identifies with glue dots (or dots made with markers) which of the risk factors are most prevalent in their community, and which, according to the participants, contribute most to violence. The prioritisation allows you to continue working with selected risk factors in a forthcoming stage of using the toolkit.
Figure 2: Risk Factor Analysis, VCP workshop, 02./03.09.13 in Jansenville, Ikwezi

PAGE 10
TOOLtWOWHAt´S BEHInD tHE vIOLEnCE? RISk FACtOR AnALYSIS
Plenary:
The groups present their summarised results, showing their respective pin boards or big flipchart sheets.
One option: each group presents the prioritised risk factors with explanations, as well as those risk factors which caused longer discussions. If issues remain unclear, these should be taken up by the facilitator/s and explained.
Observations: (Additional notes for the facilitator)
You can modify this tool in various forms. Instead of placing the risk factors as shown above, they can be placed in the ecological model, which is prepared by drawing concentric circles, with youth in the middle (as done in tool A5). Another option is to analyse the risk factors with a specific gender, age or culture perspective.
In any case: pay attention to limit the complexity of this analysis to a manageable extent.
End Product:
1hr 30
By the end of the exercise, the objectives set for this exercise would have been met. The key outputs include:
• Pin boards which show the diversity of risk factors for violence, placed in different categories that relate to the different levels of the ecological model.
• The participants have continued the process of shifting their perspective on violence and crime.
• They have put youth in the centre of analysis.
• The participants are familiar with the idea that young people often cannot influence the risk factors contributing to violence, and thus the participants have moved a step away from stigmatising youth.

tH
E An
ALY
SIS PH
ASE
BOO
KFO
UR
PAGE 11
PAR
TIC
IPATIO
NIN
FO CO
LLECT
ION
DATA
AN
ALYSIS
PLAN
NIN
GIM
PLEMEN
TATIO
N
TOOLtHREE“ ESCAPE FROM tHE PRISOn OF
tHE MInD”The following story was originally published in The Sunday Times, 3 June 2012. It has been shortened and reproduced with permission.
“ Escape from the Prison of the Mind” by Tshekiso Molohlanyi
When people ask why there is so much violent crime in this country, I want to tell them that I know why. Not the big answer on behalf of all violent criminals in South Africa, but a small answer on behalf of me.
There are things I have done – bad things – which I wish I could undo, but I can’t bring myself to tell you about them. I could give you a fancy reason that I don’t want to incriminate myself because justice is one-sided, but the truth is I’m scared of going back to prison.
I came out of jail consumed by anger, but determined to leave the gangster life. As a result I was forced to leave Khuma township, near Stilfontein in the North West province and go live with my grandfather in Ventersdorp. Every morning I was sent out to tend his sheep and cattle. He was strict to the point of never talking to me, and I spent most days on the hills crying in frustration, with only animals to listen. Eventually I cursed myself enough not to care what happened to me, and went home to face whatever. Nobody was there to help me bury my past, but me on my own.
During my time in prison I saw someone being strangled to death and then dismembered into three pieces. No one was charged for that. I feared to talk because I was scared that they would do the same thing to me. I was trapped in a living hell beyond anything I’d experienced outside. I was bullied and spent days without food. My gangster friends deserted me. But actually I went into prison already filled with rage. Prison did nothing to help me, but my fury had preceded it.
It was a fury borne out of bitterness and a desire for revenge. Sometimes I could contain it by smoking dagga mixed with nyaope (one very dangerous drug!) and rat poison. It killed our anxiety and boosted our confidence. It made us fearless and willing to act without hesitation. I craved money and popularity, and used drugs to hide my shame and loneliness and battle the demons within me. But that never solved the problem; instead it made matters worse. One day I was alone when I was attacked by rival gangsters. I was stabbed with a knife just above my left eye, dragged behind a moving car and left for dead. Later, I found opportunity to drive my anger through those who had belittled me, but instead of satisfying me that made me even madder.
Yet at home I was small like an ant, obedient like a sheep. Neither my father nor my mother had ever shown me love, and I feared them, not without reason. I don’t blame them though; the choices I made were mine. While I was with them, I just bottled up my anger until I could find a place to smash that bottle and hurt somebody with the shards.

PAGE 12
TOOLtHREE“ ESCAPE FROM tHE PRISOn OF
tHE MInD”The people I hurt often lived on the other side of the mine dump that hides Khuma township from Stilfontein. It’s the side with the lush green golf course and the nice houses. The people who lived there took no notice of us, and I felt very small when I went there. It was there that I decided I would definitely be a ‘somebody’ in life, and thought that becoming a gangster would give me the self-esteem I wanted so badly. I was ten years old when I joined that gang.
I’m now part of another gang called Activate! It brings together young leaders from across South Africa, building their sense of identity, belonging and common purpose. That purpose is to make our country a better place. I had completed school after being released from prison, but had no money to study to become the political journalist that I wanted to be. I applied for bursaries and loans, but nobody seemed to want to give money to an ex-convict. So I decided to join loveLife’s debating programme, and eventually became a ground-BREAKER, one of loveLife’s young leaders. I loved the cut and thrust of debate. A year later, I was thrilled to be given a learnership to study child- and youth care work, but it became a dead end. For some reason there was no graduation, and I am still waiting for my certificate. The whole thing was yet another failure in my life, a fantasy without a happy ending. Still, I kept applying and was appointed as a sports facilitator as part of the Expanded Public Works Programme until March this year. I am now once again unemployed. In fact, to write this article, I had to ask for money to use a computer at an internet café. So mine is not the typical rags-to-riches story you read in newspapers. It doesn’t have a fairy-tale ending, at least not yet.
But I can tell you that I’m never going back to prison, and that I’ll always keep hustling for real opportunity. My friends and I would like to start a non-government organisation that can help young people navigate their lives, mediating access to opportunities for education and work. Every community should have such an information hub. I think I can lift my curse by helping other young people who lose hope, bit-by-bit, that their lives will get better.
There are so many other young people out there just like me. Our smouldering anger has few outlets. Lately, several politicians have taken to calling us a ‘ticking time bomb’. They mean well, but they need to understand that the implied threat gives us a perverse sense of power in the same way that gangs hold sway through menace. Please stop defining us in terms of deficit and destructive risk. It feeds our pessimism. It traps us in the prisons of our minds. […]
Many young people in South Africa are still looking for a new identity. They don’t want to be defined as heirs of apartheid, but as shapers of the future. […] We should be asking how we can capitalise on the youth dividend, rather than how we can deal with the ‘problem of youth unemployment’.
We need to build ‘small connections’ for young people in every little town and rural area as much as we develop the grand schemes for jobs and education. […]

tH
E An
ALY
SIS PH
ASE
BOO
KFO
UR
PAGE 13
PAR
TIC
IPATIO
NIN
FO CO
LLECT
ION
DATA
AN
ALYSIS
PLAN
NIN
GIM
PLEMEN
TATIO
N
TOOLtHREE“ ESCAPE FROM tHE PRISOn OF
tHE MInD”Finally, we need role models in our communities who constitute a different sort of gang leader, whom other young people respect and trust. But leadership won’t just happen by itself, or even through training programmes. Those individuals who do benefit will crave to escape from the circumstances that keep pulling them down. We need to learn from the West Sides and the B.D.C’s and the 27’s that leadership development requires systematic organisation and structured networks, so that even the leaders feel that they are part of something bigger than themselves.
Complete version published in Sunday Times 3 June 2012. © Sunday Times
What needs to be in place before using this tool:You can use this tool at various stages of the process. It can be used, for example, in the very beginning of an analysis workshop or after using the tools 1 or 2 of this book.
Objective:To raise awareness of the situation of many young people in South Africa.
To get participants to realise the urgency of providing opportunities and avoiding their stigmatisation of young people.
To get participants to engage in an initial discussion of risk and protective factors in the neighbourhood/community as well as existing activities that contribute to the prevention of violence.
Aspects of Data Collection/Analysis:Risk factors, protective factors, ideas for prevention activities, different aspects of the situation of young people in the neighbourhood/community. Depends on the discussion and issues brought up by the participants and/or the questions you raise as facilitator.
Material needed:Flipchart paper and markers for visualisation of important issues brought up in the discussion, and conclusions drawn.
Preparation:Copy the story several times, so that each working group has at least one text. You may record the story beforehand so that you can play it in the beginning, read it aloud yourself or have somebody read it. Prepare questions which you want the working groups to discuss or work on. Write them on a flipchart paper so that the participants can copy them, or have a sheet of paper with the questions ready for each working group. Under ‘procedure’ you find one option for such questions. You can formulate other questions, if you want to put the focus on other issues.

PAGE 14
TOOLtHREE“ ESCAPE FROM tHE PRISOn OF
tHE MInD”Procedure:Divide the big group into smaller working groups (6-8 people per group). One option is to form completely mixed groups, and an integrated energiser is the ‘lifeboat’:
The lifeboat (energiser to form groups): Distribute several flipchart papers on the floor explaining that these are lifeboats. Put a number on each sheet. Tell the group that all participants are on a huge ship which will sink within 5 seconds after you have shouted, “four people in one lifeboat”. To start, everyone has to wander around in the room. When you shout, “four people in one lifeboat”, everybody has five seconds to stand on one of the flipchart papers together with no fewer and no more than three others (in the case of four). In the role play, every bigger or smaller group drowns, as well as those who have not found a boat at all. Those who have managed to get “four people in one lifeboat” can form groups. You repeat this game several times with only those who drowned. Thus each lifeboat forms a working group. The last few participants who are too few to form a group, should be allowed to join other groups.
Explain in the beginning that the participants will hear a story a real story written by a young man called Tshekiso Molohlanyi, and first published in The Sunday Times in 2012. Show the prepared questions on the flipchart and read them. Ask the participants to take notes while listening to the story.
Then let the participants hear the story and start the group work. The working groups are asked to visually present the results of their discussions on a flipchart paper. This might be in words, drawings or any other way they choose.
Questions for the working groups:
Are there any circumstances described by Tshekiso which you can find in your community? Which ones? Who is affected by these circumstances (risk factors)?
Are there any circumstances or conditions in your community which support young people to turn their backs on violent or criminal behaviour? What are these (protective factors)?
Tshekiso points to some things he thinks should and can be done. Are there any things already done in your community, or which could be done? What are they (prevention activities)?
Plenary discussion:
If there are groups who chose to visualise their responses rather than write them down, ask these groups to present their results first. Ask them to present the issues they consider most important.

tH
E An
ALY
SIS PH
ASE
BOO
KFO
UR
PAGE 15
PAR
TIC
IPATIO
NIN
FO CO
LLECT
ION
DATA
AN
ALYSIS
PLAN
NIN
GIM
PLEMEN
TATIO
N
TOOLtHREE“ ESCAPE FROM tHE PRISOn OF
tHE MInD”Then ask the first group which captured their answers in words to mention one new aspect with regard to risk factors. Then the next group gives feedback, mentioning only new points (points which have not been raised before by other groups). Continue in this way until all points have been covered in the feedback. You follow the same procedure for the protective factors and for existing prevention activities.
Figure 3: Newspaper clipping from the article published by the Sunday Times.
Observations: (Additional notes for the facilitator)
Another option is to play or read the story aloud in the plenary, and start an open plenary discussion. Let the participants bring their own focus to bear, and visualise important comments, insights or conclusions.
End Product:
1hr 30
By the end of the activity, the objectives set for this tool have been achieved, including the following:
• Awareness of the problem of stigmatization of youth has been raised among participants.
• Risk and protective factors in the neighbourhood/community has been discussed, as well as existing activities that contribute to the prevention of violence.

PAGE 16
TOOLFOURtHE vIOLEnCE tREEAnalysis of Cause-Effect Relationships Between Risk Factors
What needs to be in place before you can use this tool:Risk factors for violence must already be identified for analysis.
Objective:To identify and understand causes and effects and to understand the relationships between the identified risk factors. This is an important step for later planning and defining measures or action steps.
Aspects of Data Collection/Analysis:Risk factors and cause-effect relationships.
Material needed:Big brown paper, moderation cards, markers.
Preparation:Write the identified risk factors on moderation cards (one risk factor per card). The cards are laid out on the floor. A big tree with roots and branches is drawn on a separate big brown paper (about 1.5 x 2.5 m).
Procedure:This work is done with the whole group.
In a first step, the participants arrange the cards into clusters by categorising the risk factors according to problem areas. These problem areas are also often called focus areas. If different risk factors are identified for girls and boys, men and women, it is important to indicate this clearly on the cards (e.g., using symbols for different sexes). It might be possible to group some risk factors to several problem areas. In that case, you can write more than one card with the same risk factor.
Possible problem areas or focus areas:
• Health(drugs,HIV/AIDS);
• Work/prospectsforthefuture;
• Communitycohesion/youthincommunity;
• School/education.

tH
E An
ALY
SIS PH
ASE
BOO
KFO
UR
PAGE 17
PAR
TIC
IPATIO
NIN
FO CO
LLECT
ION
DATA
AN
ALYSIS
PLAN
NIN
GIM
PLEMEN
TATIO
N
TOOLFOURtHE vIOLEnCE tREEAnalysis of Cause-Effect Relationships Between Risk Factors
These are only examples to provide orientation. The areas can be named after the clustering has been completed.
Step 1:
Please have a look at the risk factors, and group them according to problem areas. Which ones belong together? Once finished with grouping them, write the name of the relevant problem area in bold on a card and place this alongside the relevant group of risk factors. If one risk factor belongs to more than one problem areas, participants can write the same risk factor on more than one card. In this way, one risk factor can be used in several problem areas.
In a second step, the most relevant or “burning” problem area will be selected by the participants. This is the one to start with.
Step 2:
Which is the problem area which is most relevant or “burning” in your community? Which is the one you want to analyse first?
A third step includes the identification of a central risk factor or problem (trunk) and the causes (roots) and effects or consequences (branches) of this central risk factor for violence. The risk factors are related to each other again with cause-effect relationships. This means: a risk factor can be the consequence of another risk factor, and at the same time the cause of a third one.
Step 3:
In the third step, we focus on this burning problem. The third step of the exercise includes the identification of a central risk factor or problem (trunk) and the causes (roots) and effects or consequences (branches) of this central risk factor for violence. The risk factors are related to each other again with cause-effect relationships. This means: a risk factor can be caused by another risk factor, and at the same time be the cause of a third risk factor. These are the instructions to use with participants as you work on Step 3:
1. Please select the risk factor you consider to be the main problem (trunk).
2. Which are causes of this risk factor/problem (roots), which are the effects or consequences (branches)? Place the cards accordingly on the tree.
See the following illustration, where the main problem is shown in the middle of the length of the tree. The causes are shown as the roots, and the effects as the branches.

PAGE 18
TOOLFOURtHE vIOLEnCE tREEAnalysis of Cause-Effect Relationships Between Risk Factors
EFFECT C
AU
SESEFFEC
T CA
USES
Frequent sexual assaults by some teachers
Frequent sexual assaults by male students
Sexual assualts are played down at
institutional level
Sexual violence viewed by men as a positive aspect
of the male role
Experience of being treated disrespectfully
Irregular and poor quality
school classes
Authoritarian teacher-student
relationship
Teachers don’t turn up regularly
at school
Culture of violence
Missing motivation or incentives for youth
Barely any jobs available in the area
De ciant professional formation of teachers
Marginalisation of people in the
region XY
Youth gangs can be attractive, provide feeling of power,
belonging and income
Feeling/experience of powerlessness
Use of violence reduces feeling of powerlessness
Low self esteem
Little respect from others
School dropouts
No income
No future prospects
Figure 4: Violence tree for problem area: education, future prospects
Observations: (Additional notes for the facilitator)
New risk factors can be added at any time during the exercise. “Problem trees” can be drawn for each problem area, and prioritised.
End Product:
1hr 30
By the end of this activity, participants would have identified, and understood, causes and effects and as well as the relationships between the identified risk factors established.
During the process, participants would have produced the following:
• The formulation of problem areas.
• The development of a problem tree with cause-effect relationships through a process of thorough discussion and analysis.

tH
E An
ALY
SIS PH
ASE
BOO
KFO
UR
PAGE 19
PAR
TIC
IPATIO
NIN
FO CO
LLECT
ION
DATA
AN
ALYSIS
PLAN
NIN
GIM
PLEMEN
TATIO
N
TOOLFIvEWHAt MAkES US StROng?Analysis of Protective Factors and Relevant Actors in the World Café
What work should be completed before this tool can be used:An analysis of risk factors has been carried out already. If a prioritization of risk factors has been done, these can be picked up now. It is also advisable that you have previously completed a presentation of the definitions for risk and protective factors.
Objective:To engage participants in identifying and analysing protective factors on the different levels of the ecological model.
To collectively place the youth in the centre of their analysis.
To identify the respective actors, on different levels who can contribute to a strengthening of the protective factors.
Aspects of Data Collection/Analysis:Protective factors, placed on the different levels of the ecological model, and actors (organisations, institutions, or individuals) from the neighbourhood/community or externally that are or can be important for the preservation or strengthening of protective factors.
Material needed:Big brown paper, moderation cards with different colours, markers, tape. Small moderation cards (e.g. 9.5 x 14 cm); colours: blue, yellow, green, red as well as small round cards (diameter 10cm); colours again: blue, yellow, green and red.
Preparation:You need four circles of brown paper - one very large, one large, one medium and one small. The biggest one should have a diameter of at least 2.20m. The next circle has a diameter of 1.80m, the next one of 1.30m and the smallest one a diameter of 0.80m. A drawn circle on each paper indicates the outer lines of the next smaller circle that should fit in its centre.
[Four circles of brown paper are needed. The biggest one should have a diameter of at least 2.20m. The next circle has a diameter of 1.80m, the next one of 1.30m and the smallest one a diameter of 0.80m. A drawn circle on each paper indicates the outer lines of the next smaller circle. $$ report $$]
Prepare four working stations. If your room is not big enough, the stations might well be in different rooms or outside. In each station you place one of the circles on the floor, together with sufficient moderation cards, markers and tape.

PAGE 20
TOOLFIvEWHAt MAkES US StROng?Analysis of Protective Factors and Relevant Actors in the World Café
The biggest circle gets the title “society”, the second biggest gets the title “community”, the medium circle gets the title “relationship” and the smallest gets the title “individual”. In the centre of the smallest circle (titled individual) you draw and/or write ‘young people’ (as in Figure 5).
Procedure – the World Café method:
The facilitation process being used is called “World Café”. This method is a perfect method for the identification of the protective factors and their placing in the ecological model. Firstly, you form four groups with an equal number of participants. Group 1 starts in station 1, group 2 at station 2, group 3 at station 3 and group 4 begins at station 4. You explain that each group will start at their station and then move to work at the next station. In the end, groups will have had a chance to work at all stations. The task will be the same at all four stations (although with a different focus).
Station1
Station2
Station3
Station4
Figure 5: World Café on risk and protective factors in ecological model
You explain the task below giving one or two examples for each station (level of the ecological model).
task 1:
Please identify for each level (individual, relationship, community, society) all protective factors that decrease the risk of young people in your community developing violent behaviour. Write one factor per card and place the card on the circle, representing the level you are analysing. Ensure that the inner circle stays free (except in station 1, which just has a symbol or words for ‘young people’ in the middle).
Variation: The participants have selected 1-3 risk factors most relevant to their community. Then the task is to identify all protective factors for these risk factors.
For the first stage, the groups have 10 minutes, for the next three stages they will have about seven minutes each. When explaining the exercise, tell the groups how much time they will have at each station. After the first 10 minutes you ask the groups to rotate: group 1 rotates to station 2, group 2 goes to station 3, group 3 to 4, and group 4 rotates to station 1. Thus, each group will have worked once at each station.

tH
E An
ALY
SIS PH
ASE
BOO
KFO
UR
PAGE 21
PAR
TIC
IPATIO
NIN
FO CO
LLECT
ION
DATA
AN
ALYSIS
PLAN
NIN
GIM
PLEMEN
TATIO
N
TOOLFIvEWHAt MAkES US StROng?Analysis of Protective Factors and Relevant Actors in the World Café
The next step uses the same method. But the aim is to identify key actors. In a this step, key actors who have a supporting, strengthening influence on the identified protective factors are identified on each level.
task 2:
level of“community”
level of“society” level of
“relationship”
“individual”level
Figure 6: Analysis of several risk factors and relevant key actors (VCP workshop, 26. – 30.08.13)
You ask groups to identify for each level all those (key actors) who have, can have or should have a positive influence on the protective factors. Who are the relevant persons or actors who can strengthen the protective factors? Actors can be public individuals, organisations or institutions like the mayor, the department for education, as well as private individuals who can be positive role models for the youth.
If each working group has four members or more, it is possible to work with a “relator” in each station. These four relators stay at their respective stations. Their job is to briefly summarise the discussions of the previous working group/s at this station.
After every group has worked on each of the four levels, the circles will be put on top of each other, first the biggest (outer) circle representing the society level, followed by the “community level”, then the “relationship level” and on top the “individual level”. Thus the ecological model is completed, composed of all four levels.
Observations: (Additional notes for the facilitator)
Make sure that the circles are big enough, so that all cards can be placed without obscuring each other. In this activity, you can focus on all the risk factors facing youth. Or you may decide to focus on a few risk factors. (The decision on the number of risk factors to be analysed depends on the set purpose, the more risk factors analysed, the more complex the analysis becomes.)

PAGE 22
TOOLFIvEWHAt MAkES US StROng?Analysis of Protective Factors and Relevant Actors in the World Café
Figure 7: Analysis of selected risk factor (VCP workshop on 02./03.09.13 in Jansenville, Ikwezi).
Adding relevant persons, actors, institutions
In Figure 7 the different levels are already composed. The ecological model is complete with all its levels. The respective protective factors (on square cards) have been identified, and key actors who can strengthen the identified protective factors, have been added for each level (on round cards).
The figure demonstrates that it is very important to work on circles big enough to show all cards without overlapping. It also demonstrates the complexity of this analysis.
Therefore, it may be advisable to start this work by focusing on selected, prioritized risk factors within one problem area, in order to keep the complexity manageable. Figure 7 shows an analysis of just one selected risk factor, with protective factors and relevant key actors (indicated using different colours – blue cards have been used for protective factors, yellow for the actors).
End Product:
2hr
The objectives set for the use of this tool have been achieved, namely
• The participants have identified and analysed protective factors on the different levels of the ecological model.
• They have placed the youth in the centre of their analysis.
• Participants have also identified the respective actors, on different levels who can contribute to a strengthening of the protective factors
In the process of meeting the objectives, participants have completed an ecological model with all levels and with respective protective factors.
In doing so, the participants have assumed a perspective which is the basis for a better understanding of the importance of primary and secondary prevention measures.

tH
E An
ALY
SIS PH
ASE
BOO
KFO
UR
PAGE 23
PAR
TIC
IPATIO
NIN
FO CO
LLECT
ION
DATA
AN
ALYSIS
PLAN
NIN
GIM
PLEMEN
TATIO
N
TOOLSIX“MARkEt PLACE OF RESOURCES”Analysis of Existing Projects/Initiatives, as well as existing and potential co-operations
What needs to be in place before you use this tool:This exercise works well if many different stakeholders, institutions and organisations active in the community, internal as well as external, are participating. Possibly they don´t yet know much about the work of some of the others. It makes sense to have previously analysed risk and protective factors.
Objective:To ensure participants are more informed about who is doing what in the area.
To begin to identify possible areas of co-operation between actors.
Aspects of Data Collection/Analysis:Relevant organisations and institutions and their work in the area, and expertise.
Material needed:Several tables or pin boards, big brown paper, several markers of different colours, tape, flipchart paper, A -4 sized white paper, wax crayons.
Preparation:Provide as many tables with space around them as there are organisations or institutions which will present their work in relation to violence, crime prevention and community safety. It is helpful to inform invited organisations and participants beforehand that they will have the opportunity to present their work. Prepare a flipchart with the guiding questions for the exhibition (see below).
Procedure:Every institution, initiative and organisation that will present its work in relation to crime, violence prevention and community safety, gets one table or space to present it. These can include small CBOs, like a theatre group or sports club. They are all invited to use visual material, like posters, as well as information sheets or flyers.
Distribute additional material, like flipchart paper, markers, wax crayons etc., so that material for the displays can still be prepared.

PAGE 24
TOOLSIX“MARkEt PLACE OF RESOURCES”Analysis of Existing Projects/Initiatives, as well as existing and potential co-operations
guiding questions (for the exhibition):
• Whatisyourorganisationdoingtocontributetothepreventionofviolenceandcrimeand community safety?
• Whatpotentialdoesyourorganisationhavetocontributetoviolenceandcrimeprevention and community safety in the future?
• Whathavebeenthemainachievementssofar?Whatarethemajorchallenges?
• Withwhomdoyouwork,andwhereexactly(targetgroupsandlocation)?
• Withwhichotherorganisationsareyouco-operating?
• Withwhichotherorganisationswouldyouliketoco-operate,andinwhatway?
Give enough time (e.g. 30-45 min.) to prepare the visual presentations and ‘market stalls’. Then open the market place. The participants are invited to visit the market stalls in their market place. It is helpful if one person from each organisation stays at their own market stall to answer possible questions from interested visitors. Should there be several organisations with only one participant, the opportunity can be provided to put specific questions about these organisations in the following plenary session.
The objective is to get to know each other`s work and identify opportunities for co-operation.
In the plenary session following the exhibition session, the facilitator draws the different “market stalls” on a big sheet of paper. He or she does so with the help of the participants Respective moderation cards with the organisations and institutions, and the sectors they might belong to, can be prepared beforehand. Identified opportunities for co-operation are graphically presented.
Observations: (Additional notes for the facilitator)
Encourage the participants to be realistic when describing achievements, and to also list challenges to be overcome. Emphasise that this is not a competition (who is best?) but rather an opportunity to discover opportunities for co-operation.
End Product:
2hr
The objective set for this exercise has been achieved, namely:
• Participants have become more familiar with who is doing what in the area and possible options for co-operation have been discussed.
• In the process of achieving the objective, participants have achieved the following:
• Participating institutions and organisations have shared information on their work with regard to violence and crime prevention and community safety, as well as on potentials to contribute to violence and crime prevention and community safety.
• Existing and potential opportunities for co-operation are identified.

tH
E An
ALY
SIS PH
ASE
BOO
KFO
UR
PAGE 25
PAR
TIC
IPATIO
NIN
FO CO
LLECT
ION
DATA
AN
ALYSIS
PLAN
NIN
GIM
PLEMEN
TATIO
N
TOOLSEvEnCHOOSIng tHE PROBLEM OR FOCUS AREA/S tO WORk On
What needs to be in place before you use this tool:You need to have already worked on the risk factors, and identified problem or focal areas. It is helpful to have identified which organisations and institutions are active in which fields in the community, their potentials and expertise, as well as opportunities for co-operation. If a study has been conducted, then the information will be shared among the participants, so that all existing information can be taken into account.
Objective:To specify which of the problem areas ( that is sometimes also called focus areas) should form the target of the measures to be planned.
Aspects of Data Collection/Analysis:
Problem or focus areas and related aspects, potential boundary partners and their expertise, potential for co-operation.
Material needed:Flipchart paper, markers with different colours, glue dots with different colours if available, or beans of different colours.
Preparation:Prepare a matrix on a flipchart like the one shown below (leave the cells for later evaluation empty). Ensure that the participants have all relevant information with regard to an analysis of organisations or institutions working in the area. Participants would have information about organisations’ as well as their expertise and capacities.
Procedure:The participants will form a collective decision by means of (1) a discussion, followed by (2) a decision-making process. In preparation, it is important to determine how many problem areas will be addressed - and for how many problem areas it is possible and realistic to plan measures.
To keep the planning process and the project manageable, a good number is between one and three. If you are developing a safety plan, there might be more than three areas, if enough organisations and institutions will be implementing the measures.

PAGE 26
TOOLSEvEnCHOOSIng tHE PROBLEM OR FOCUS AREA/S tO WORk On
1. The discussion should deal with the following questions for each of the problem areas identified in previous steps. (We also call each of the questions (a) to (d) the criteria that we are using in our process of making decisions):
(a) How urgent is the need for action in this problem area?
(b) How realistic are the chances of achieving long-term social change in this problem area by using appropriate measures?
(c) What expertise and potential for achieving results do prospective implementing organisations possess for this problem area?
(d) What are the prospects for co-operation?
As facilitator you will lead the group to ask these questions In relation to each problem area. Note key conclusions for each focus area on flipcharts.
By asking these questions, you will decide which problem areas the group wants to work on (when starting to plan measures). If participants cannot reach agreement, you can go on to 2. below.
2. If no consensus is achieved during the discussion, a decision-making process should be started. For a prioritisation of problem areas, consider the above-mentioned criteria. Additional criteria may have arisen from the discussion and can be added. The criteria are inserted in a matrix. Now, every participant receives three glue dots per criterion and focus area. If you have three focus areas you need three different colours. With three criteria, every participant receives 9 glue dots in green, 9 in black and 9 in red. With four criteria, every participant receives 12 glue dots in green, 12 in black and 12 in red.
task 1:
Assess each focus area according to each of the shown criteria, and award between 0 and 3 points (dots) for each criterion and focus area.
0 dots means: not urgent, not realistic, no expertise and capacity, no potential for co-operation
3 dots mean: very urgent, completely realistic, much expertise and capacity, high potential for co-operation.
As facilitator you can point at one of the cells in the matrix and give an example.
The figure shows a fairly complicated example. Focus area 1 is seen as the most urgent. But participants think there is little prospect of achieving long-lasting changes in this area, and the expertise and capacity of potential partners is still low. This might lead to the conclusion to not favour this area. = Participants see focus area 2 as more urgent than area 3, but in area 3 there is more expertise, and the possible implementing organisations have a higher capacity.

tH
E An
ALY
SIS PH
ASE
BOO
KFO
UR
PAGE 27
PAR
TIC
IPATIO
NIN
FO CO
LLECT
ION
DATA
AN
ALYSIS
PLAN
NIN
GIM
PLEMEN
TATIO
N
TOOLSEvEnCHOOSIng tHE PROBLEM OR FOCUS AREA/S tO WORk On
As facilitator you can point to the matrix below and discuss it as an example.
Once the participants have finished posting their dots, you ask the participants to have another look at the results. Check what conclusions can be drawn, and facilitate the final decision-making.
task 2:All these insights facilitate a second, shorter discussion round. If again a decision cannot be made, then every participant receives another three glue dots. Participants must allocate these to the focus areas (overall). They can put their dots around the words Focus Area 1, Focus Area 2 or Focus Area 3 on the matrix.
Figure 9: Matrix for Selection of Focus Areas
You have received three glue dots. Please award them directly to the focus areas. If you favour one area specifically, you may allocate all three dots to that area. You may also award two dots to one area, and one dot to another area, leaving the rest without dots.
After a final count, the decision is made according to the total points awarded.
Observations:In deciding whether to work in one, two, three or more focus areas, it is good to keep in mind that it´s often better to put quality before quantity, meaning it´s often better to complete one or two projects successfully than to finish five without major impact, or start five and not finish them.
End Product:
1hr 30
By the end of the exercise, the objective, namely “To specify which of the problem areas should form the target of the measures to be planned,” would have been achieved.
In the process of achieving the objective, participants have:
• Based on discussion and the use of clear criteria, selected one or more focus areas for subsequent planning work.

PAGE 28
List of FiguresFigure 1: Typology of Violence, VCP workshop 02./03.09.13, Jansenville, Ikwezi
Figure 2: Risk Factor Analysis, VCP workshop, 02./03.09.13 in Jansenville, Ikwezi
Figure 3: Newspaper clipping from the article published by The Sunday Times.
Figure 4: Violence tree for problem area: education, future prospects
Figure 5: World Café on risk and protective factors in ecological model
Figure 6: Analysis of several risk factors and relevant key actors (VCP workshop, 26. – 30.08.13)
Figure 7: Analysis of selected risk factor (VCP workshop on 02./03.09.13 in Jansenville, Ikwezi).
Figure 8: Participants during workshop in Randfontein, 30./31.10.13
Figure 9: Matrix for Selection of Focus Areas
AnnEX 1 tO BOOk 4:

tH
E An
ALY
SIS PH
ASE
BOO
KFO
UR
PAGE 29
PAR
TIC
IPATIO
NIN
FO CO
LLECT
ION
DATA
AN
ALYSIS
PLAN
NIN
GIM
PLEMEN
TATIO
N
nOtES

PAGE 30
nOtES

tH
E An
ALY
SIS PH
ASE
BOO
KFO
UR
PAGE 31
PAR
TIC
IPATIO
NIN
FO CO
LLECT
ION
DATA
AN
ALYSIS
PLAN
NIN
GIM
PLEMEN
TATIO
N
nOtES

PAGE 32
nOtES


BOOKFOUR
A TOOLKIT FOR PARTICIPATORY SAFETY PLANNING
BUILDING SAFER COMMUNITIESTHROUGH SYSTEMIC APPROACHESTO VIOLENCE PREVENTION
ANALYSING THE SAFETY SITUATIONThe “Toolkit for Participatory Safety Planning” was developed by the “Inclusive
Violence and Crime Prevention Programme” in close cooperation with its partners.
Deutsche Gesellschaft für Internationale Zusammenarbeit (GIZ) GmbH Inclusive Violence and Crime Prevention for Safe Public Spaces (VCP) Programme
GIZ Office Pretoria, P.O. Box 13732, Hatfield 0028 Hatfield Gardens, Block E, Third Floor, 333 Grosvenor Street, Pretoria, South Africa
The toolkit is also available on: www.saferspaces.org.za