Building Resilience into Fragile Transportation Networks...
62
Building Resilience into Fragile Transportation Networks in an Era of Increasing Disasters Anna Nagurney Isenberg School of Management University of Massachusetts Amherst, Massachusetts 01003 Disaster Recovery and Mitigation Planning and Resilience Anna Nagurney Building Resilience into Fragile Transportation Networks
Transcript of Building Resilience into Fragile Transportation Networks...

Building Resilienceinto
Fragile Transportation Networksin an
Era of Increasing Disasters
Anna Nagurney
Isenberg School of ManagementUniversity of Massachusetts
Amherst, Massachusetts 01003
Disaster Recovery and Mitigation Planning and Resilience
Anna Nagurney Building Resilience into Fragile Transportation Networks

Acknowledgments
I would like to thank the Planning and Environment - Group; thePolicy and Organization - Group, and the Committee on CriticalTransportation Infrastructure Protection of TRB for sponsoringthis panel. Thanks also to Dr. Pamela Murray-Tuite of VT forpresiding at this panel.
Special acknowledgments and thanks to my students andcollaborators who have made research and teaching alwaysstimulating and rewarding.
Anna Nagurney Building Resilience into Fragile Transportation Networks

Transportation networks are the fundamental criticalinfrastructure for the movement of people andgoods in our globalized Network Economy.
Transportation networks also serve as the primaryconduit for rescue, recovery, and reconstruction indisasters.
Anna Nagurney Building Resilience into Fragile Transportation Networks

Recent disasters have vividly demonstrated the importanceand vulnerability of our transportation and criticalinfrastructure systems
• The biggest blackout in North America, August 14, 2003;
• Two significant power outages in September 2003 – one in theUK and the other in Italy and Switzerland;
• The Indonesian tsunami (and earthquake), December 26, 20o4;
• Hurricane Katrina, August 23, 2005;
• The Minneapolis I35 Bridge collapse, August 1, 2007;• The Mediterranean cable destruction, January 30, 2008;
• The Sichuan earthquake on May 12, 2008;
• The Haiti earthquake that struck on January 12, 2010 and theChilean one on February 27, 2010;
• The recent floods in northeastern Australia and Brazil and theaccompanying mudslides in the latter.
Anna Nagurney Building Resilience into Fragile Transportation Networks

Hurricane Katrina in 2005
Hurricane Katrina has been called an “American tragedy,” in whichessential services failed completely (Guidotti (2006)).
Anna Nagurney Building Resilience into Fragile Transportation Networks

The Haitian and Chilean Earthquakes
Anna Nagurney Building Resilience into Fragile Transportation Networks

It is a year since the devastating 7.0 earthquake shook Haiti, buton its first anniversary, piles of rubble remain a constant reminderof the destruction caused by the disaster.
According to the UN Development Programme (UNDP), almost200,000 buildings collapsed in Port-au-Prince and surroundingareas, creating an estimated 10 million cubic meters of shatteredconcrete, twisted steel and other debris (the equivalent of 10World Trade Center sites).
To-date, just a fifth of the debris has been cleared, blocking manyreconstruction efforts!
Marcel Fortier, head of the International Federation of Red Crossand Red Crescent Societies in Haiti noted that it would take 200trucks a total of 11 years to clear all the rubble caused by theearthquake in Haiti.
Anna Nagurney Building Resilience into Fragile Transportation Networks

Disasters have brought an unprecedented impact on human lives inthe 21st century and the number of disasters is growing. FromJanuary to October 2005, an estimated 97,490 people were killedin disasters globally; 88,117 of them because of natural disasters.
Frequency of disasters [Source: Emergency Events Database (2008)]
Anna Nagurney Building Resilience into Fragile Transportation Networks

The Emergency Events Database (2008) defines a disaster as anevent that fits at least one of the following criteria:
1). 10 or more people killed;
2). 100 or more people affected;
3). declaration of a state of emergency;
4). call for international assistance.
According to the Federal Emergency Management Agency (FEMA)(1992), a catastrophe disaster is “An event that results in largenumbers of deaths and injuries; causes extensive damage ordestruction of facilities that provide and sustain human needs;produces an overwhelming demand on state and local responseresources and mechanisms; causes a severe long-term effect ongeneral economic activity; and severely affects state, local, andprivate-sector capabilities to begin and sustain response activities.”
Anna Nagurney Building Resilience into Fragile Transportation Networks

Disasters have a catastrophic effect on human livesand a region’s or even a nation’s resources.
Anna Nagurney Building Resilience into Fragile Transportation Networks

Natural Disasters (1975–2008)
Anna Nagurney Building Resilience into Fragile Transportation Networks

However, although the average number of disasters has beenincreasing annually over the past decade the average percentage ofneeds met by different sectors in the period 2000 through 2005identifies significant shortfalls.
According to Development Initiatives (2006), based on data in theFinancial Tracking System of the Office for the Coordination ofHumanitarian Affairs, from 2000-2005, the average needs met bydifferent sectors in the case of disasters were:
I 79% by the food sector;
I 37% of the health needs;
I 35% of the water and sanitation needs;
I 28% of the shelter and non-food items, and
I 24% of the economic recovery and infrastructure needs.
Anna Nagurney Building Resilience into Fragile Transportation Networks

Fragile Networks
We are living in a world of Fragile Networks.Anna Nagurney Building Resilience into Fragile Transportation Networks
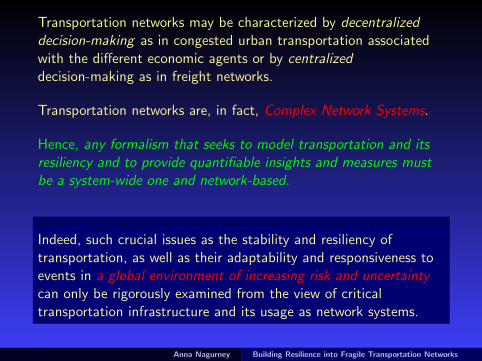
Transportation networks may be characterized by decentralizeddecision-making as in congested urban transportation associatedwith the different economic agents or by centralizeddecision-making as in freight networks.
Transportation networks are, in fact, Complex Network Systems.
Hence, any formalism that seeks to model transportation and itsresiliency and to provide quantifiable insights and measures mustbe a system-wide one and network-based.
Indeed, such crucial issues as the stability and resiliency oftransportation, as well as their adaptability and responsiveness toevents in a global environment of increasing risk and uncertaintycan only be rigorously examined from the view of criticaltransportation infrastructure and its usage as network systems.
Anna Nagurney Building Resilience into Fragile Transportation Networks
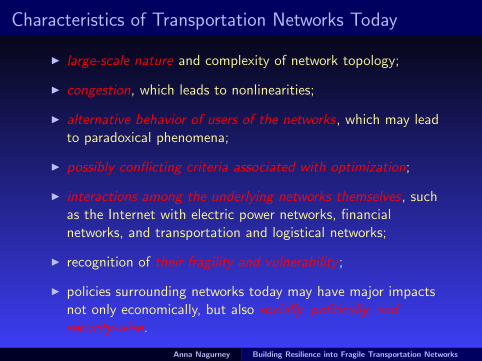
Characteristics of Transportation Networks Today
I large-scale nature and complexity of network topology;
I congestion, which leads to nonlinearities;
I alternative behavior of users of the networks, which may leadto paradoxical phenomena;
I possibly conflicting criteria associated with optimization;
I interactions among the underlying networks themselves, suchas the Internet with electric power networks, financialnetworks, and transportation and logistical networks;
I recognition of their fragility and vulnerability ;
I policies surrounding networks today may have major impactsnot only economically, but also socially, politically, andsecurity-wise.
Anna Nagurney Building Resilience into Fragile Transportation Networks

Transportation Network Design Must Capture the Behaviorof Users
Anna Nagurney Building Resilience into Fragile Transportation Networks

Behavior on Congested Networks
Flows are routed so as to minimize the total cost to society.
System-Optimized
Centralized Unselfish S–O
vs. vs. vs.��@@
@@��
��@@
@@��
Decentralized Selfish U–O
User-Optimized
Decision-makers select their cost-minimizing routes.
Anna Nagurney Building Resilience into Fragile Transportation Networks

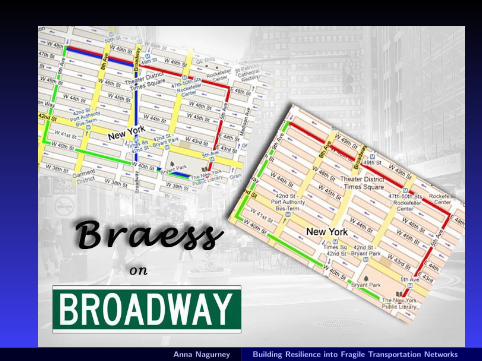
The Braess Paradox Around the World
1969 - Stuttgart, Germany - Thetraffic worsened until a newlybuilt road was closed.
1990 - Earth Day - New YorkCity - 42nd Street was closed andtraffic flow improved.
2002 - Seoul, Korea - A 6 laneroad built over theCheonggyecheon River thatcarried 160,000 cars per day andwas perpetually jammed was torndown to improve traffic flow.
Anna Nagurney Building Resilience into Fragile Transportation Networks
Anna Nagurney Building Resilience into Fragile Transportation Networks

Other Critical Infrastructure Networks that Behave likeTraffic Networks
The Internet and electric power networks
Anna Nagurney Building Resilience into Fragile Transportation Networks
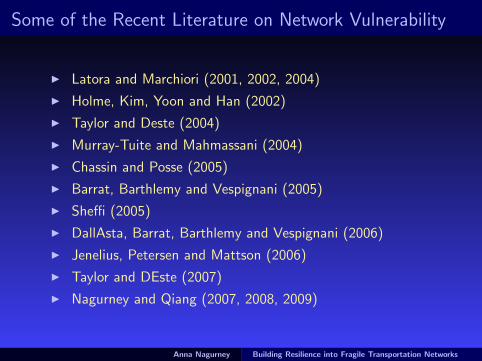
Some of the Recent Literature on Network Vulnerability
I Latora and Marchiori (2001, 2002, 2004)
I Holme, Kim, Yoon and Han (2002)
I Taylor and Deste (2004)
I Murray-Tuite and Mahmassani (2004)
I Chassin and Posse (2005)
I Barrat, Barthlemy and Vespignani (2005)
I Sheffi (2005)
I DallAsta, Barrat, Barthlemy and Vespignani (2006)
I Jenelius, Petersen and Mattson (2006)
I Taylor and DEste (2007)
I Nagurney and Qiang (2007, 2008, 2009)
Anna Nagurney Building Resilience into Fragile Transportation Networks

Network Centrality Measures
I Barrat et al. (2004, pp. 3748), The identification of the mostcentral nodes in the system is a major issue in networkcharacterization.
I Centrality Measures for Non-Weighted Networks• Degree, betweenness (node and edge), closeness (Freeman(1979), Girvan and Newman (2002))• Eigenvector centrality (Bonacich (1972))• Flow centrality (Freeman, Borgatti and White (1991))• Betweenness centrality using flow (Izquierdo and Hanneman(2006))• Random-work betweenness, Current-flow betweenness(Newman and Girvan (2004))
I Centrality Measures for Weighted Networks (Very Few)• Weighted betweenness centrality (Dall’Asta et al. (2006))• Network efficiency measure (Latora-Marchiori (2001))
Anna Nagurney Building Resilience into Fragile Transportation Networks

Which Nodes and Links Really Matter?
Anna Nagurney Building Resilience into Fragile Transportation Networks

The Nagurney and Qiang (N-Q) Network Efficiency /Performance Measure
Definition: A Unified Network Performance MeasureThe network performance/efficiency measure, E(G, d), for a givennetwork topology G and the equilibrium (or fixed) demand vectord, is:
E = E(G, d) =
∑w∈W
dwλw
nW,
where recall that nW is the number of O/D pairs in the network,and dw and λw denote, for simplicity, the equilibrium (or fixed)demand and the equilibrium disutility for O/D pair w, respectively.
Anna Nagurney Building Resilience into Fragile Transportation Networks

The Importance of Nodes and Links
Definition: Importance of a Network ComponentThe importance of a network component g ∈ G, I (g), is measuredby the relative network efficiency drop after g is removed from thenetwork:
I (g) =4EE
=E(G, d)− E(G − g , d)
E(G, d)
where G − g is the resulting network after component g is removedfrom network G.
Anna Nagurney Building Resilience into Fragile Transportation Networks

The Approach to Identifying the Importance of NetworkComponents
The elimination of a link is treated in the N-Q network efficiencymeasure by removing that link while the removal of a node ismanaged by removing the links entering and exiting that node.
In the case that the removal results in no path connecting an O/Dpair, we simply assign the demand for that O/D pair to an abstractpath with a cost of infinity.
The N-Q measure is well-defined even in the case ofdisconnected networks.
Anna Nagurney Building Resilience into Fragile Transportation Networks

The Advantages of the N-Q Network Efficiency Measure
• The measure captures demands, flows, costs, and behavior ofusers, in addition to network topology.
• The resulting importance definition of network components isapplicable and well-defined even in the case of disconnectednetworks.
• It can be used to identify the importance (and ranking) of eithernodes, or links, or both.
• It can be applied to assess the efficiency/performance of a widerange of network systems, including financial systems and supplychains under risk and uncertainty.
• It is applicable also to elastic demand networks (Qiang andNagurney, Optimization Letters (2008)).
• It is applicable to dynamic networks, including the Internet(Nagurney and Qiang, Netnomics (2008)).Anna Nagurney Building Resilience into Fragile Transportation Networks

Some Applications of the N-Q Measure
Anna Nagurney Building Resilience into Fragile Transportation Networks

The Sioux Falls Network
Figure 1: The Sioux Falls network with 24 nodes, 76 links, and 528 O/Dpairs of nodes.
Anna Nagurney Building Resilience into Fragile Transportation Networks

Importance of Links in the Sioux Falls Network
The computed network efficiency measure E for the Sioux Fallsnetwork is E = 47.6092. Links 56, 60, 36, and 37 are the mostimportant links, and hence special attention should be paid toprotect these links accordingly, while the removal of links 10, 31, 4,and 14 would cause the least efficiency loss.
Figure 2: The Sioux Falls network link importance rankingsAnna Nagurney Building Resilience into Fragile Transportation Networks

According to the European Environment Agency (2004), since1990, the annual number of extreme weather and climate relatedevents has doubled, in comparison to the previous decade. Theseevents account for approximately 80% of all economic lossescaused by catastrophic events. In the course of climate change,catastrophic events are projected to occur more frequently (seeSchulz (2007)).
Schulz (2007) applied N-Q network efficiency measure to aGerman highway system in order to identify the critical roadelements and found that this measure provided more reasonableresults than the measure of Taylor and DEste (2007).
The N-Q measure can also be used to assess which links should beadded to improve efficiency. This measure was used for theevaluation of the proposed North Dublin (Ireland) Metro system(October 2009 Issue of ERCIM News).
Anna Nagurney Building Resilience into Fragile Transportation Networks

Figure 3: Comparative Importance of the links for the Baden -Wurttemberg Network – Modelling and analysis of transportationnetworks in earthquake prone areas via the N-Q measure, Tyagunov et al.
Anna Nagurney Building Resilience into Fragile Transportation Networks
What About Transportation Network Robustness?
Anna Nagurney Building Resilience into Fragile Transportation Networks

The concept of system robustness has been studied in engineeringand computer science. IEEE (1990) defined robustness as “thedegree to which a system or component can function correctly inthe presence of invalid inputs or stressful environmentalconditions.”
Gribble (2001) defined system robustness as “the ability of asystem to continue to operate correctly across a wide range ofoperational conditions, and to fail gracefully outside of thatrange.”
Ali et al. (2003) considered an allocation mapping to be robust ifit “guarantees the maintenance of certain desired systemcharacteristics despite fluctuations in the behavior of itscomponent parts or its environment.”
Schillo et al. (2001) argued that robustness has to be studied “inrelation to some definition of performance measure.”
Holmgren (2007) stated: “Robustness signifies that the system willretain its system structure (function) intact (remain unchanged ornearly unchanged) when exposed to perturbations.”
Anna Nagurney Building Resilience into Fragile Transportation Networks

Definition: Network Robustness Measure UnderUser-Optimizing Decision-Making BehaviorThe robustness measure Rγ for a network G with the vector ofuser link cost functions c, the vector of link capacities u, thevector of demands d (either fixed or elastic) is defined as therelative performance retained under a given uniform capacityretention ratio γ with γ ∈ (0, 1] so that the new capacities aregiven by γu. Its mathematical definition is
Rγ = R(G, c , γ, u) =Eγ
E× 100%
where E and Eγ are the network performance measures with theoriginal capacities and the remaining capacities, respectively.
For example, if γ = .8, this means that the user link cost functionsnow have the link capacities given by .8ua for all links a ∈ L; ifγ = .4, then the link capacities become .4ua for all links a ∈ L,and so on.
Anna Nagurney Building Resilience into Fragile Transportation Networks

According to this Definition, a network under a given level ofcapacity retention or deterioration is considered to be robust if thenetwork performance stays close to the original level.
We can also study network robustness from the perspective ofnetwork capacity enhancement.
Such an analysis provides insights into link investments. In thiscase γ ≥ 1 and, for definiteness (and as suggested in Nagurney andQiang (2009)), we refer to the network robustness measure in thiscontext as the “capacity increment ration.”
Anna Nagurney Building Resilience into Fragile Transportation Networks

An Application to the Anaheim Network
Each link of the Anaheim network has a link travel cost functionalform of the BPR form. There are 461 nodes, 914 links, and 1, 406O/D pairs in the Anaheim network.
Figure 4: The Anaheim network
Anna Nagurney Building Resilience into Fragile Transportation Networks

Figure 5: Robustness vs. Capacity Retention Ratio for the AnaheimNetwork
Anna Nagurney Building Resilience into Fragile Transportation Networks

Figure 6: Robustness vs. Capacity Increment Ratio for the AnaheimNetwork
Anna Nagurney Building Resilience into Fragile Transportation Networks

Different Perspectives on Transportation NetworkRobustness
Anna Nagurney Building Resilience into Fragile Transportation Networks

Relative Total Cost Indices
The definition of the index under the user-optimizing flow pattern,denoted by Iγ
U−O :
IγU−O = IU−O(G, c , d , γ, u) =
TCγU−O − TCU−O
TCU−O× 100%,
where TCU−O and TCγU−O are the total network costs evaluated
under the U-O flow pattern with the original capacities and theremaining capacities (i.e., γu), respectively.
The definition of the index under the system-optimizing flowpattern is:
IγS−O = IS−O(G, c , d , γ, u) =
TCγS−O − TCS−O
TCS−O× 100%,
where TCS−O and TCγS−O are the total network costs evaluated at
the S-O flow pattern with the capacities as above.Anna Nagurney Building Resilience into Fragile Transportation Networks

From these definitions, a network, under a given capacityretention/deterioration ratio γ (and either S-O or U-O behavior) isconsidered to be robust if the index Iγ is low.
This means that the relative total cost does not change much;hence the network may be viewed as being more robust than if therelative total cost were large.
Anna Nagurney Building Resilience into Fragile Transportation Networks

We can also study the relative total cost improvement aftercapacity enhancement. In that case, because the relative total costsavings need to be computed, we reverse the order of subtractionin the previous expressions with γ ≥ 1. Furthermore, γ is definedas the “capacity increment ratio.”
Therefore, the larger the relative total cost index is, the greater theexpected total cost savings for a capacity enhancement plan for aspecific γ.
Anna Nagurney Building Resilience into Fragile Transportation Networks
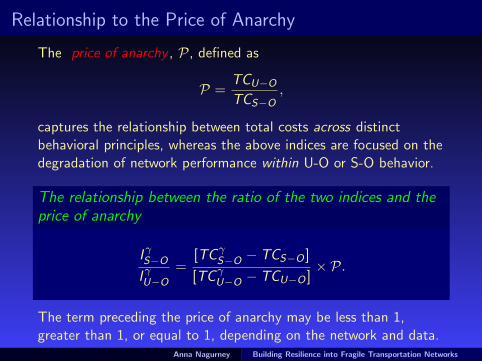
Relationship to the Price of Anarchy
The price of anarchy , P, defined as
P =TCU−O
TCS−O,
captures the relationship between total costs across distinctbehavioral principles, whereas the above indices are focused on thedegradation of network performance within U-O or S-O behavior.
The relationship between the ratio of the two indices and theprice of anarchy
I γS−O
I γU−O
=[TCγ
S−O − TCS−O ]
[TCγU−O − TCU−O ]
× P.
The term preceding the price of anarchy may be less than 1,greater than 1, or equal to 1, depending on the network and data.
Anna Nagurney Building Resilience into Fragile Transportation Networks

Figure 7: Example: The Sioux Falls network
This network is always more robust under U-O behavior exceptwhen β is equal to 2 (where β is the power to which the link flowis raised to into the BPR function) and γ ∈ [0.5, 0.9].
Anna Nagurney Building Resilience into Fragile Transportation Networks

Figure 8: Example: The Anaheim network
This network is more robust under the S-O solution when thecapacity retention ratio γ is above .3.
Anna Nagurney Building Resilience into Fragile Transportation Networks
Which Nodes and Links Matter Environmentally?
Anna Nagurney Building Resilience into Fragile Transportation Networks

Figure 9: Global Annual Mean Temperature Trend 1950–1999
Anna Nagurney Building Resilience into Fragile Transportation Networks

Figure 10: Impacts of climate change on transportation infrastructure
Anna Nagurney Building Resilience into Fragile Transportation Networks

We have also extended our measures to constructenvironmental impact assessment indices andenvironmental link importance identifiers undereither U-O or S-O behaviors.
Anna Nagurney Building Resilience into Fragile Transportation Networks

What About Transportation’s Role in Disaster Relief?
Anna Nagurney Building Resilience into Fragile Transportation Networks

A General Supply Chain
Anna Nagurney Building Resilience into Fragile Transportation Networks

Haiti Earthquake in 2010
Delivering the humanitarian relief supplies (water, food, medicines,etc.) to the victims was a major logistical challenge.
Anna Nagurney Building Resilience into Fragile Transportation Networks
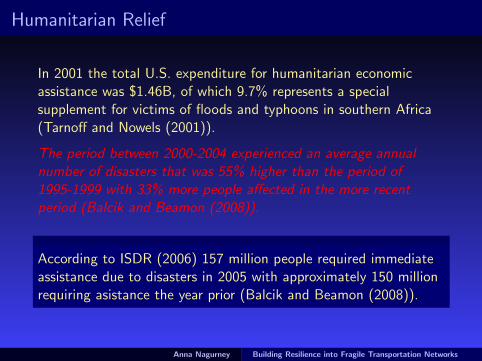
Humanitarian Relief
In 2001 the total U.S. expenditure for humanitarian economicassistance was $1.46B, of which 9.7% represents a specialsupplement for victims of floods and typhoons in southern Africa(Tarnoff and Nowels (2001)).
The period between 2000-2004 experienced an average annualnumber of disasters that was 55% higher than the period of1995-1999 with 33% more people affected in the more recentperiod (Balcik and Beamon (2008)).
According to ISDR (2006) 157 million people required immediateassistance due to disasters in 2005 with approximately 150 millionrequiring asistance the year prior (Balcik and Beamon (2008)).
Anna Nagurney Building Resilience into Fragile Transportation Networks

Humanitarian Supply Chains
The supply chain is a critical component not only of corporationsbut also of humanitarian organizations and their logisticaloperations.
At least 50 cents of each dollars worth of food aid is spent ontransport, storage and administrative costs (Dugger (2005)).
Anna Nagurney Building Resilience into Fragile Transportation Networks

Vulnerability of Humanitarian Supply Chains
Extremely poor logistic infrastructures: Modes of transportationinclude trucks, barges, donkeys in Afghanistan, and elephants inCambodia (Shister (2004)).
To ship the humanitarian goods to the affected area in the first 72hours after disasters is crucial. The successful execution is not justa question of money but a difference between life and death (VanWassenhove (2006)).
Corporations expertise with logistics could help public responseefforts for nonprofit organizations (Sheffi (2002), Samii etal.(2002)).
In the humanitarian sector, organizations are 15 to 20 yearsbehind, as compared to the commercial arena, regarding supplychain network development (Van Wassenhove (2006)).
Anna Nagurney Building Resilience into Fragile Transportation Networks
It is clear that better-designed supply chain networks in whichtransportation plays a pivotal role would have facilitated andenhanced various emergency preparedness and relief efforts andwould have resulted in less suffering and lives lost.
Anna Nagurney Building Resilience into Fragile Transportation Networks

Critical Needs Products
Critical needs products are those that are essential to the survivalof the population, and can include, for example, vaccines, medicine,food, water, etc., depending upon the particular application.
The demand for the product should be met as nearly as possiblesince otherwise there may be additional loss of life.
In times of crises, a system-optimization approach is mandatedsince the demands for critical supplies should be met (as nearly aspossible) at minimal total cost.
Anna Nagurney Building Resilience into Fragile Transportation Networks

We have now developed a framework for the optimal design ofcritical needs product supply chains:
“Supply Chain Network Design for Critical Needs withOutsourcing,”
A. Nagurney, M. Yu, and Q. Qiang, Papers in Regional Science, inpress,
where additional background as well as references can be found.
Anna Nagurney Building Resilience into Fragile Transportation Networks

Supply Chain Network Topology with Outsourcing
fThe Organization1
��
�� ?
QQs
U �
Manufacturing at the Plants
M1 M2 MnMf f · · · f?
@@
@@R
aaaaaaaaaa?
��
��
QQs?
��
��
��+
!!!!!!!!!!
Shipping
D1,1 D2,1 DnD ,1f f · · · f? ? ?
D1,2 D2,2 DnD ,2
Distribution Center Storage
Shipping
f f · · · f�
��������
��
��
AAAAU
������������)
��
��
��+
��
���
AAAAU
HHH
HHH
HHj
��
���
AAAAU
QQs
PPPPPPPPPPPPqf f f · · · fR1 R2 R3 RnR
Demand PointsAnna Nagurney Building Resilience into Fragile Transportation Networks

Our recent research includes aspects of design for robustness andresiliency.
I “Modeling of Supply Chain Risk Under Disruptions withPerformance Measurement and Robustness Analysis,” Q.Qiang, A. Nagurney, and J. Dong (2009), in Managing SupplyChain Risk and Vulnerability: Tools and Methods for SupplyChain Decision Makers, T. Wu and J. Blackhurst, Editors,Springer, London, England, 91-111.
I “A Bi-Criteria Measure to Assess Supply Chain NetworkPerformance for Critical Needs Under Capacity and DemandDisruptions,” Q. Qiang and A. Nagurney (2010).
Anna Nagurney Building Resilience into Fragile Transportation Networks

THANK YOU!
For more information, see: http://supernet.som.umass.edu
Anna Nagurney Building Resilience into Fragile Transportation Networks