Building Networks of AutoGCs and Monitoring Performance › site_docs › siteDocs ›...
12
Building Networks of AutoGCs and Monitoring Performance Hourly Photochemical Assessment Monitoring Station Monitoring of Non‑Methane Hydrocarbons by AutoGC
Transcript of Building Networks of AutoGCs and Monitoring Performance › site_docs › siteDocs ›...
Building Networks of AutoGCs and Monitoring Performance
Hourly Photochemical Assessment Monitoring Station Monitoring of Non‑Methane Hydrocarbons by AutoGC

Orsat, LLC1416 Southmore AvePasadena, TX 77502www.orsat.com877‑477‑0171
Product specifications and descriptions in this document subject to change without notice.
© Orsat, LLC.
Published 05/05/17 5385‑EN
877-477-0171 WORKING PAPER | June 2016 | 1
Building Networks of AutoGCs and Monitoring Performance
EFFECTS OF NEW NAAQS RULING ON PAMS VOC MONITORING
The analysis of ozone precursors has been a feature of the EPA air quality surveillance regulations since 1992 with the establishment of Photochemi‑cal Assessment Monitoring Stations (PAMS) as part of State Implementation Plans (SIP) for ozone non‑attainment areas classified as serious, severe or extreme. At that time, guidance documentation allowed for the measurements of VOC precursors either by canister sampling or by continuous measure‑ment using a GC–FID with a thermal desorber collecting hourly samples. Only a few agencies chose to do continuous sampling and since that time a lot has been learned about the issues associated with the continuous field measurement of VOCs.
In 2011 the EPA initiated an effort to re‑evaluate the PAMS requirements and the technology being used for continuous field measurements in conjunc‑tion with upcoming changes to the National Ambient Air Quality Standards (NAAQS) for ozone. With guidance from Clean Air Science Advisory Committee Air Monitoring Methods Subcommittee (CASAC AMMS) and National Associa‑tion of Clean Air Agencies (NACAA) Monitoring Steering Committee (MSC) the EPA has promulgated revisions to the network design and is evaluating newer technology for continuous measurements. Since the primary use of this data is for photochemical modeling the new EPA ruling has recommended a redistribution of PAMS sites in an effort to increase the spatial coverage
Originally presented by Amy Plum-mer on August 11–12, 2016, as a poster at the National Environmental Monitoring Conference (NEMC) at Hyatt Regency, Orange County, CA, August 8–12, 2016.

2 | Orsat, LLC www.orsat.com
of this data for modeling performance evaluations. More agencies may find themselves responsible for implementing continuous hourly volatile organic carbon (VOC) monitoring in conjunction with the existing NCORE network. While this type of hourly AutoGC monitoring represents a significant increase in complexity in both implementation and data management, systems have been developed and deployed to fully automate and streamline data col‑lection and management.
AUTOGC SYSTEMS FOR PAMS MONITORINGFigure 1 shows the basic system used for continuous field measurement of PAMS non‑methane hydrocarbons (NMHCs). These systems generally require the concentration of 600–1000 mL of ambient air collected over a 40 minute period. The sample is collected on a dual phase trap which must be cryogenically cooled to trap the light C2 gases.
These chromatographic systems are most often configured with flame ion‑ization detectors (FID) because of their stability, linearity, robustness and carbon‑response. Calibration can be achieved utilizing certified standards of only propane and benzene making the cost of standards significantly lower than those used for other detectors.
While there are a number of systems capable of this analysis, continuous air monitoring requires a degree of automation to facilitate the routine analysis of quality control checks to enable continuous review of performance. In addition, data systems used ideally must provide output of the data which allows users to rapidly explore and review their data as well as facilitate submission to the EPA Air Quality System (AQS).
Figure 1. Basic system for the separa-tion of NMHCs from ambient air.

877-477-0171 WORKING PAPER | June 2016 | 3
Building Networks of AutoGCs and Monitoring Performance
QUALITY CONTROLS TO MAINTAIN NETWORK DATA QUALITY OBJECTIVES
Simplification of the quality control strategies as well as calibration re‑quirements will play a key role in the success of any monitoring plan. The identification and quantitation of up to 56 NMHC species hourly requires a quality control strategy which is easy to implement and maintain. While a number of commercially available systems are currently being evaluated for use in PAMS monitoring activities, the PerkinElmer Ozone Precursor system has been used in Texas for the Texas Commission on Environmental Quality (TCEQ) since 1992 and there are now currently 35 of these AutoGCs
Quality Control Check Composition Purpose Frequency Acceptance Criteria
Retention Time Standard (RTS)
Mixture containing all target compounds ideally between 1‑5 ppbC
To help assess retention time shifts and optimize processing methods
Twice a month or
weekly
100% of the compounds are identified correctly in the multicomponent RTS
Calibration Verification Standard (CVS)
Mixture of 15 reference compounds including propane and benzene used for calibration
To assess the instrument drift and ensure continued instrument calibration
Daily 1. Propane and benzene % recoveries within 75% – 125% and all other calibrants within 55 – 145%
2. Data must be bracketed by valid CVS
Method (Analytical) Blank
Humidified, clean air To assess system contribution to the measurement
Daily 1. All target compounds < 2.0 ppbC2. TNMHC < 20 ppbC3. Data must be bracketed by valid
blanks
Precision Check Mixture used for CVS To assess analytical precision
Weekly Propane and benzene %RPD < 20% in two consecutive CVS runs
Laboratory Calibration Standard (LCS)
Mixture of 15 reference compounds including propane and benzene used for calibration
Second source standard, statically blended 5 ppbv
Twice a month or
weekly
Propane and benzene % recoveries within 70 – 130%
AUTOMATION FOR CONTINUOUS UNATTENDED OPERATION
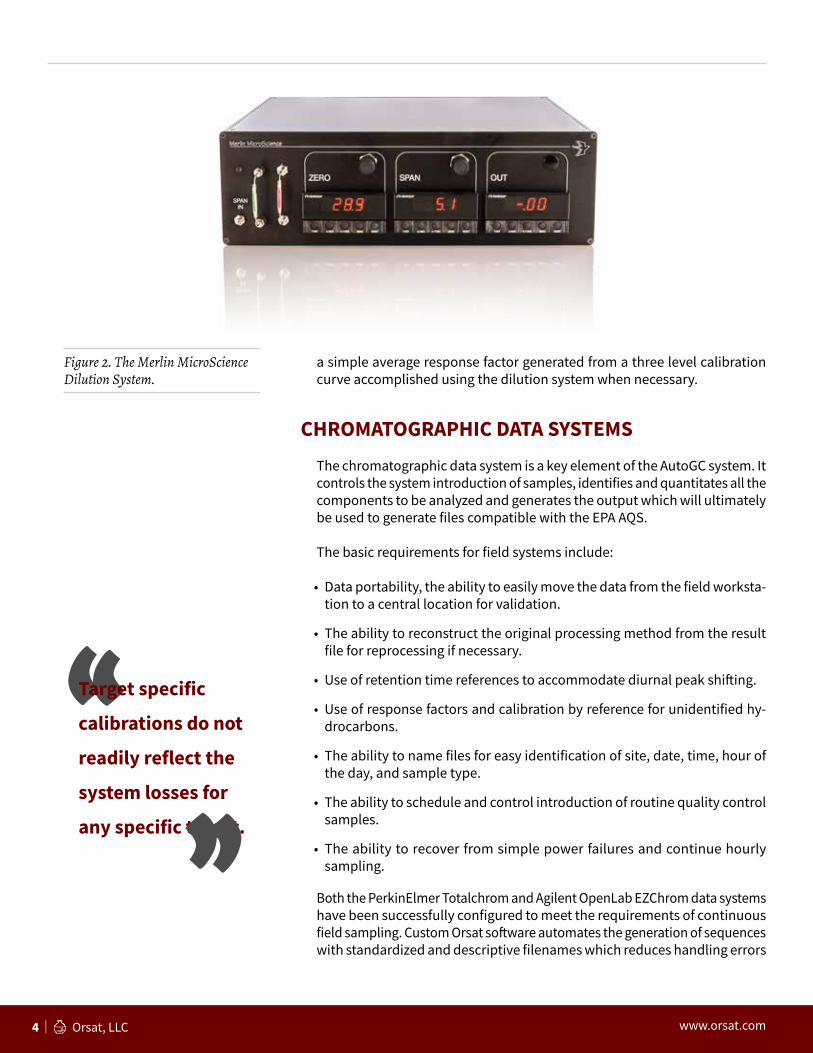
Orsat has over 20 years of experience automating PerkinElmer Ozone Precur‑sor Systems for the Texas Commission on Environmental Quality. In addition, the Agilent PAMS system which includes an Agilent gas chromatograph and the Markes Unity 2 Thermal Desorber has been automated as well. Automation includes the Merlin MicroScience Dilution System (MMDS) shown in Figure 2 for generating daily check standards and system blanks daily as well as pro‑viding multiple levels for calibration. Additional valves are used to automate additional quality control checks including a second source canister statically diluted to confirm the dynamic dilution system as well as a retention time standard to confirm that the system is identifying all targets correctly and consistently. Because of the limited range of concentrations seen in ambient air and the FID carbon based response, calibration is accomplished by using
Table 1. Quality controls for PAMS AutoGC network.
4 | Orsat, LLC www.orsat.com
“Target specific
calibrations do not
readily reflect the
system losses for
any specific target.
”
a simple average response factor generated from a three level calibration curve accomplished using the dilution system when necessary.
CHROMATOGRAPHIC DATA SYSTEMSThe chromatographic data system is a key element of the AutoGC system. It controls the system introduction of samples, identifies and quantitates all the components to be analyzed and generates the output which will ultimately be used to generate files compatible with the EPA AQS.
The basic requirements for field systems include:
• Data portability, the ability to easily move the data from the field worksta‑tion to a central location for validation.
• The ability to reconstruct the original processing method from the result file for reprocessing if necessary.
• Use of retention time references to accommodate diurnal peak shifting.
• Use of response factors and calibration by reference for unidentified hy‑drocarbons.
• The ability to name files for easy identification of site, date, time, hour of the day, and sample type.
• The ability to schedule and control introduction of routine quality control samples.
• The ability to recover from simple power failures and continue hourly sampling.
Both the PerkinElmer Totalchrom and Agilent OpenLab EZChrom data systems have been successfully configured to meet the requirements of continuous field sampling. Custom Orsat software automates the generation of sequences with standardized and descriptive filenames which reduces handling errors
Figure 2. The Merlin MicroScience Dilution System.

877-477-0171 WORKING PAPER | June 2016 | 5
Building Networks of AutoGCs and Monitoring Performance
associated with the large quantity of files as well as increasing efficiency in archiving and automated data polling.
CALIBRATION BY CARBON RESPONSEBecause the FID response is proportional to the carbon content of most if not all the PAMS target components, the system can be calibrated based on a carbon response factor. Thus the values reported are generally reported as ppbC instead of ppbv. This type of calibration is easier than target specific linear regressions which are generally used in laboratories using GC–MS, a technique which does not have a proportional response for all analytes.
It eliminates the necessity of expensive certified standards containing all targets. Generally only propane and benzene are used as calibrants to gen‑erate response factors for each FID. A multipoint calibration is done using the dynamic dilution system and an average carbon response factor is used for all targets.
Using the relative carbon response method of calibration assumes 100% recovery for all species and will reflect systematic losses as lower recover‑ies. Target specific calibrations do not readily reflect the system losses for any specific target. Figure 3 shows the typical daily recoveries seen for 56 PAMS targets using a carbon response factor over a period of two and a half months. This reflects losses to the analytical system caused by inadequate humidification, adsorption on steel surfaces and in the adsorbent trap itself. Monitoring these losses is a key element in the quality control process that allows users to maintain consistent recoveries across multiple instruments. Some common recovery issues include higher than normal recovery for targets which can accumulate in the Nafion drier such as propylene in par‑ticular, as well as lower than expected recoveries for targets such as acety‑lene and heavier hydrocarbons which are often lost to steel surfaces due to inadequate humidification of canister samples. Some losses such as higher than expected recoveries of hexane are not a function of sampling but rather is due to poorly integrated peaks. Hexane is the first peak to elute after the effluent of the boiling point column is switched and thus integration of the peak can be affected by any upset caused by this flow change.
Although the quality control samples show lower recovery for some NMHCs, previous comparisons of data from a system calibrated using compound specific calibrations versus carbon response factors did not show significant differences in the measurements of ambient air.1 This suggests that the losses in recovery shown here are more closely related to the generation of humidified standards and may not accurately reflect the actual recoveries in ambient air samples.
1 Meyer, C. 2016. The Analysis of Ozone Precursors by AutoGC: The Role of Calibration and Qual-ity Control Strategies in Data Management for Fully Automated TD–GC–FID Systems. Presented at Air and Waste Management Association Air Quality Measurement Methods and Technology Conference, Chapel Hill, NC, March 15–17, 2016.
56
components

6 | Orsat, LLC www.orsat.com
Figure 4. Distribution of reported results from 12 TCEQ AutoGC sites on 2014 Fall PE Audit.
Etha
neEt
hyle
nePr
opan
ePr
opyl
ene
Isob
utan
en-
Buta
neAc
etyl
ene
tran
s-2-
Bute
ne1-
Bute
neci
s-2-
Bute
neCy
clop
enta
neIs
open
tane
n-Pe
ntan
e1,
3-Bu
tadi
ene
tran
s-2-
Pent
ene
1-Pe
nten
eci
s-2-
Pent
ene
2,2-
Dim
ethy
lbut
ane
2-M
ethy
lpen
tane
Isop
rene
n-H
exan
eM
ethy
lcyc
lope
ntan
e2,
4-Di
met
hylp
enta
neBe
nzen
eCy
cloh
exan
e2-
Met
hylh
exan
e2,
3-Di
met
hylp
enta
ne3-
Met
hylh
exan
e2,
2,4-
Trim
ethy
lpen
tane
n-H
epta
neM
ethy
lcyc
lohe
xane
2,3,
4-Tr
imet
hylp
enta
neTo
luen
e3-
Met
hylh
epta
ne2-
Met
hylh
epta
nen-
Oct
ane
Ethy
lben
zene
m/p
-Xyl
ene
Styr
ene
o-Xy
lene
n-N
onan
eIs
opro
pylb
enze
nen-
Prop
ylbe
nzen
e1,
3,5-
Trim
ethy
lben
zene
1,2,
4-Tr
imet
hylb
enze
ne
n-De
cane
1,2,
3-Tr
imet
hylb
enze
ne
PLOT Column BP Column
0
20
40
60
80
100
120
140
ppbC
0
20
40
60
80
100
120
140
160
180
200
Perc
enta
ge
Etha
neEt
hyle
nePr
opan
ePr
opyl
ene
Isob
utan
en-
Buta
neAc
etyl
ene
tran
s-2-
Bute
ne1-
Bute
neci
s-2-
Bute
neCy
clop
enta
neIs
open
tane
n-Pe
ntan
etr
ans-
2-Pe
nten
e1-
Pent
ene
cis-
2-Pe
nten
e2,
2-Di
met
hylb
utan
e2,
3-Di
met
hylb
utan
e2-
Met
hylp
enta
ne3-
Met
hylp
enta
neIs
opre
ne1-
Hex
ane
n-H
exan
eM
ethy
lcyc
lope
ntan
e2,
4-Di
met
hylp
enta
neBe
nzen
eCy
cloh
exan
e2-
Met
hylh
exan
e2,
3-Di
met
hylp
enta
ne3-
Met
hylh
exan
e2,
2,4-
Trim
ethy
lpen
tane
n-H
epta
neM
ethy
lcyc
lohe
xane
2,3,
4-Tr
imet
hylp
enta
neTo
luen
e2-
Met
hylh
epta
ne3-
Met
hylh
epta
nen-
Oct
ane
Ethy
lben
zene
m/p
-Xyl
ene
Styr
ene
o-Xy
lene
n-N
onan
eIs
opro
pylb
enze
nen-
Prop
ylbe
nzen
em
-Eth
ylto
luen
ep-
Ethy
ltolu
ene
1,3,
5-Tr
imet
hylb
enze
neo-
Ethy
ltolu
ene
1,2,
4-Tr
imet
hylb
enze
nen-
Deca
ne1,
2,3-
Trim
ethy
lben
zene
m-D
ieth
ylbe
nzen
ep-
Diet
hylb
enze
nen-
Und
ecan
en-
Dode
cane
PLOT Column BP Column
Figure 3. Distribution of check standard percent recovery.

877-477-0171 WORKING PAPER | June 2016 | 7
Building Networks of AutoGCs and Monitoring Performance
QUALITY CONTROL FOR UNIFORM NETWORK PERFORMANCE
stablishing a strong quality control strategy enhances data quality and data return by insuring consistency across multiple instruments. The TCEQ has a network of over 30 AutoGCs collecting hourly data year round which uses au‑tomation configured by Orsat and utilizes the quality controls listed in Table 1. In addition Orsat provides technical assistance for instrumental failures as well as an annual maintenance program designed to keep all instrumentation performing based on standardized testing and configuration criteria. This insures that all instrumentation is configured for the same performance and tested each year after maintenance to insure each instrument is returned to the same performance level. At least annually a single performance evalu‑ation should be done to challenge all systems in the network with a single test sample designed to evaluate the network performance.
A challenge sample containing all targets is manufactured at nominally 5 ppbv concentration in a canister and this sample is run at all sites. In the case of TCEQ, several canisters are required to test all the systems in their network. Figure 4 shows the distribution of reported results of the 2014 per‑formance evaluation (PE) audit of 12 TCEQ sites (additional sites from other networks which report to the TCEQ system have independent performance audits). Theoretical concentrations as well as analytical results are reported and include pre and post distribution analysis. The pre and post distribu‑tion analytical results as well as theoretical concentrations based on the gravimetric production are averaged across the two separate canisters which were manufactured for testing. The relative percent difference between pre and post distribution results were less than 20% (frequently less than 10%) with the exception of acetylene which deteriorated significantly across the 4‑month period from pre to post testing. These results verify that these 12 monitors are performing similarly and generally agree with the laboratory GC–MS results when operated using a carbon based calibration scheme.
SUMMARYThe new NAAQS requirements for continuous PAMS VOC monitoring will require accurate hourly collection and analysis of up to 56 NMHCs using equipment which is technically more sophisticated than other air monitoring activities generally required of most state air monitoring agencies. Establish‑ing a sound quality control strategy along with sufficient automation will enable the successful operation of systems such as the PerkinElmer Ozone Precursor System and the Agilent PAMS Monitoring System. Challenges for the successful implementation of PAMS monitoring include not only the implementation and operation of the equipment to collect and analyze ambient air but also the organization necessary to generate the required quality control samples and review and validate the resulting data.
“Establishing a
sound quality
control strategy
along with sufficient
automation will
enable successful
operation...
”

8 | Orsat, LLC www.orsat.com
Amy Plummer is the Field Operations Manager at Orsat, LLC in Pasadena, Texas. She is an integral part of the Orsat monitoring team and has over 10 years’ experience with Photochemical Assessment Monitor-ing (PAMS) stations. She has in-depth knowledge of AutoGC field services and all aspects from deployment to auditing and supervises our field service activities across a network of over 30 AutoGCs. Her experience includes criteria measurements as well as specialized monitoring activities and she has been instrumental in our data validation activities for PAMS VOC measure-ments. Amy has been instrumental in the development
of automated quality control systems for AutoGC field activities and automated systems for polling and data handling.
Carol Meyer has been actively involved with PAMS monitoring since the initial 1993 Coastal Ozone Assess-ment for Southeastern Texas (COAST) study. Orsat, LLC has provided ambient monitoring services to both state and industry, and currently operates 25 PAMS AutoGC monitoring sites in Texas for the TCEQ, UT CEER and AECOM. Using both the PerkinElmer Ozone Precur-sor system and the Agilent GC System with a Markes Unity 2 thermal desorber, Orsat has developed a fully automated application for the continuous monitoring of 56 NMHCs hourly.
20years


Orsat, LLC1416 Southmore AvePasadena, TX 77502www.orsat.com877‑477‑0171
Product specifications and descriptions in this document subject to change without notice.
© Orsat, LLC.
Published 05/05/17 5385‑EN
Fully Automated, Round-the-Clock, Photochemical Assessment Monitoring Stations (PAMS)Orsat has customized the installation of hardware and software to produce a robust application for the measurement of VOCs in the ambient air known as the AutoGC. Orsat has been involved with continuous unattended ambient air VOC monitoring since its earliest implementation in the State of Texas Coastal Oxidant Assessment for Southeast Texas (COAST) program in 1994. Today, Orsat’s services encompass all aspects of site operation from deployment to operator training and application assistance in topics ranging from Microsoft Windows operation to gas chromatographic theory. Over the past three decades, Orsat has deployed over 40 sites and currently maintains over 35 sites in the state of Texas for both public and private industry. In particular, Orsat has worked closely with the Texas Commission on Environmental Quality (TCEQ) to monitor air quality in the Barnett and Eagle Ford Shale Formations.