Building Healthy Communities in the 2211 sstt Century ... · Building Healthy Communities in the...
49
Building Healthy Communities in the Building Healthy Communities in the 21 21 st st Century: Drop the Fads and Lose Century: Drop the Fads and Lose the Rearview Mirror the Rearview Mirror Presented at Rural Matters! Canadian Rural Conference Edmonton, AB 1 Edmonton, AB July 6, 2008 ___________ Mark Partridge Swank Professor in Rural-Urban Policy The Ohio State University Thanks to Infrastructure Canada & CRRF for partial support.
Transcript of Building Healthy Communities in the 2211 sstt Century ... · Building Healthy Communities in the...

Building Healthy Communities in the Building Healthy Communities in the 2121stst Century: Drop the Fads and Lose Century: Drop the Fads and Lose
the Rearview Mirrorthe Rearview MirrorPresented at
Rural Matters! Canadian Rural ConferenceEdmonton, AB
1
Edmonton, AB
July 6, 2008___________
Mark PartridgeSwank Professor in Rural-Urban Policy
The Ohio State UniversityThanks to Infrastructure Canada & CRRF for partial support.

Outline: Why are we here?1. Need to understand why places prosper if we
want to help them prosper: Compete or Retreat!
• Regions compete nationally and internationally• Not just Edmonton vs. Calgary, but also Edmonton vs Beijing
• Regions that don’t rise to this competition in terms of being a good place for business and a quality place to live will decline.
2
good place for business and a quality place to live will decline.
• People, entrepreneurs, and investment will flow elsewhere.
• This matters for rural areas—maybe more than urban areas
• Moral will be get the basics right, be patient and don’t be fancy for fancy sake.

Motivation--continued
2. Too many communities skip the basics.
• We ‘want’ a quick fix!
• Gut hunches are used rather than economics—or hire a consultant for the latest trendy fad.
• Color graphics & facilitation replace economic reality
• Would you go to a consultant for medical care?
3. Jump on the latest fad w/o even knowing if the previous fad even worked.
• Alternative energy, ethanol, immigrants, creative class, clusters, tax incentives.
3

Motivation--continued
4. Rearview mirror: ‘Regain a historical legacy.’ In Ohio, it’s manufacturing, in NFLD, fishing, in BC, timber, in Sask, farming, etc.
• These are great legacies, but winners in the 21st• These are great legacies, but winners in the 21Century will differ from 19th Century winners.
• Rural Myth—Grandpa’s 1950 rural Canada is today’s rural Canada—mining, fishing, farming, and each town lived in isolation, etc
4

Let’s first beat up bad policy• Bad Idea 1: Ignore economic fundamentals
and rely on gut hunches w/o foundation.
– Consultants make money by being trendy—faddy.
• Economics doesn’t have all the solutions, but neither does your local doctor for medical care.does your local doctor for medical care.
• Bad Idea 2: We need a quick fix.• If it was easy, wouldn’t someone have already done it?
• Truth is that it takes time to attract new knowledge workers, entrepreneurs, & physical capital. 5 years is realistic for tangible effects.
5

Losing Bad ideas
• Bad idea 3: Jump on the latest fads
– Good ideas may not affect overall econ. activity.
• Fad 1: Alternative Energy—wind turbines.
– Over the last 20 years, it now seems like cell – Over the last 20 years, it now seems like cell phone towers are everywhere
• How many permanent jobs did they create?
• The problem is that wind turbines/cell towers are capital intensive and require few permanent workers
• Don’t confuse energy policy with rural policy!
6

Losing Bad ideas
• Fad 2: Ethanol (bio fuels).
– The direct impact: ethanol plant hires workers instead of shipping the product elsewhere.
– But, as of late 2007, there are only 3,100 direct – But, as of late 2007, there are only 3,100 direct jobs in U.S., or 0.01% of rural U.S. employment.
– A 100 million gallon plant has $46m-$51m in tax credits—or $1million+ per job each year.
• If jobs are a central goal, there are much less expensive ways to create about 45 jobs at a big plant.
7

8

9

Losing Bad ideas• Fad 3: Firm Clusters or synergies
– Michael Porter from Harvard created a cluster buzz.• Economists had routinely discussed since the 19th Century
• Firms like to be near similar industries to take advantage of similar needs and workforceadvantage of similar needs and workforce
• Sounds cool and consultants + politicians love it
• But—the actual evidence is shaky if not outright totally negative. Diversified communities do better—Jane Jacobs.
10

Losing Bad Ideas:Why do cluster strategies typically fail?
– The logic is weak. It is true that similar firms buy inputs from one another, but so what?
• Successful cluster strategy requires private firms to be too foolish to realize a place has great potential, but community leaders w/o any direct industry knowledge community leaders w/o any direct industry knowledge know better and ‘educate’ ignorant businesses about their
own industry. Not realistic.– Rather, scarce tax dollars are diverted to support the cluster.
– Gov’ts should facilitate a cluster, not try to direct it at the expense of other viable industries and quality of life projects.
• The point is, if a location was such a great place for business, private firms would move there on their own.
11

Losing Bad ideas
• Bad idea 4: Rearview mirror-backward-looking
• Keep doing the same thing over and over, long after it makes sense.
– Could result from a legacy industry becoming so – Could result from a legacy industry becoming so productive, fewer workers are hired
– E.g., Ohio manufacturing or Canadian farming.
12

Rural Myth: It is still 1950!
• Rural Myth—rural Canada’s prosperity solely relies on natural resource sector.
– This is a common media story—Globe and Mail,
New York Times—confuse the bucolic landscape with what the people do.landscape with what the people do.
– Too often, federal and provincial policy is aimed at making this imaginary place ‘healthy’ by supporting resource sectors
– Confuse sector prosperity with place prosperity.
13

% Employment in Agriculture
1931
1931
20
25
30
35
% o
f T
ota
l E
mp
loy
me
nt
14
19711971
2004 2004
0
5
10
15
Ontario Canada
% o
f T
ota
l E
mp
loy
me
nt
Source: 1931 Census, 1971 Census, Statistics Canada. 1931, 1971 Industries classified by SIC. codes. 2004 Industries classified by NAICS codes.

% Employment in Other Primary Industries
1931
1931
1971
1971
20042
3
4
% o
f T
ota
l E
mp
loy
me
nt
15
1971
2004
0
1
Ontario Canada
% o
f T
ota
l E
mp
loy
me
nt
Source: 1931 Census, 1971 Census, Statistics Canada. 1931, 1971 Industries classified by SIC. codes. 2004 Industries classified by NAICS codes.

1616

Alberta Rural & Small Town--non CA/CMA,
2005
6
8
10
12
Pe
rce
nt
of
To
tal E
mp
loy
me
nt
17
0
2
4
6
% Agriculture % Other Primary % Manufacturing
Pe
rce
nt
of
To
tal E
mp
loy
me
nt

Surely, this means the nonfarm rural population is disappearing• Answer, no!
• The nonfarm rural population as a share of the overall population has been constant since the 19th Century.since the 19th Century.
18

50%
60%
70%
80%
90%
100%
% Canadian Urban, Rural Farm and Rural Nonfarm Population 1881-2001
19
0%
10%
20%
30%
40%
50%
1881 1891 1901 1911 1921 1931 1941 1951 1961 1971 1981 1991 2001
Year
Rural Non-Farm Rural Farm Rural Urban

Moral!
• The 1950s Rural Canada no longer exists.
• Rural development is far more complex than (say) farm policy or fishery policy.
– Note the contradiction in (say) farm policy, farm – Note the contradiction in (say) farm policy, farm competitiveness is producing more food with fewer workers—this is not community prosperity!
• Sector-policy often conflicts with place policy.
20

What is the real of Rural Canada?• Policy should be based on reality—not myth.
• The reality is that there are 3 rural North Americas:
1)Amenity/recreation rich near mountains, lakes, oceans
• Ex: Since the 1960s, Cottage Country remarkably transformed to an amenity driven economy: was mining, transformed to an amenity driven economy: was mining, timber, farming (Okanagan, Banff, Jasper, parts of NFLD)
• Less of a pattern in Canada than US, though increasing
2)Metro adjacent with commuting—big and growing
3)Remote rural that is dependent on natural resource sectors—small and shrinking in size since the 1930s.
21

Western Canada’s Engines of Growth2001-2006 Population Growth
2222
An Engine of Growth is defined as a metropolitan area with at least 500,000 population. Sastoon is one “contender” Engine of Growth.
An Engine of Growth is defined as a metropolitan area with at least 500,000 population. Saskatoon is one “contender” Engine of Growth.
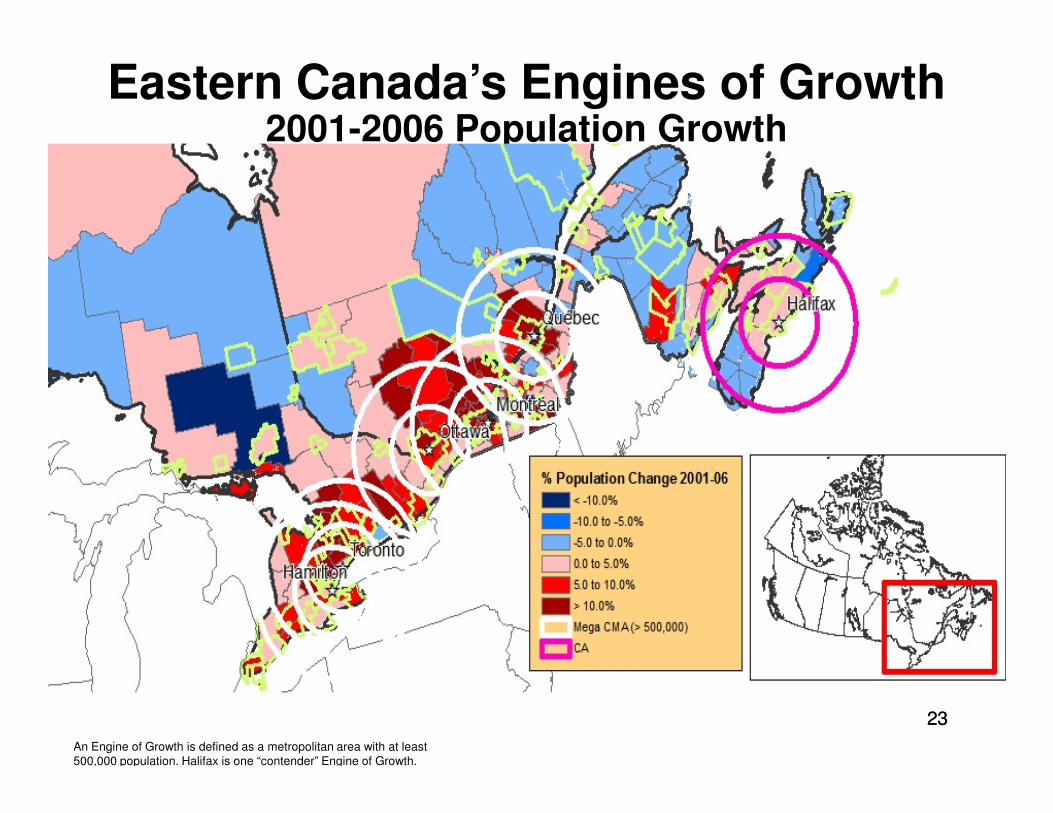
Eastern Canada’s Engines of Growth2001-2006 Population Growth
2323
An Engine of Growth is defined as a metropolitan area with at least 500,000 population. Halifax is one “contender” Engine of Growth.

Percent of Local Labour Force Commuting to Brandon CA—CCS Level Data
2424
Source: See notes to the slide

Percent of Local Labour Force Commuting to Montreal
CMA—CCS Level Data
2525

Rural Depends on Urban for:
Urban Depends on Rural for:
Employment Labor Force
Private and Public Services Market for Private and Public Goods and Services
Urban Amenities Market for Urban Amenities
2626
Market for recreation activities
Recreation
Market for agriculture products
Food Safety and Security
Demand for Environmental Stewardship
Natural Environmental
Property taxes/land market Land for Residential and Industrial Expansion

What is good strategy?• You don’t have to pick the next hot industry,
just be sure they want to be in your community. e.g.,Seattle 1978 and Microsoft
1.Recognize rural-urban interdependencies
• In 1950, communities detached from neighbors• In 1950, communities detached from neighbors
• 21st Century communities are linked in webs– Growth spreads out hundreds of kms from a city as small as 10,000
• If someone can commute, they shop, utilize health care, participate in service organizations, etc.
• Such regions share common interests and the gains should be exploited regionally. 27

Rural-Urban Shared Fates--cont• Economists contend that gov’t jurisdictions
should reflect common interests & spillovers.
– Gov’ts may or may not need to overlap
– Spillovers need to be minimized with a regional authority. Avoid pushing costs onto other places.authority. Avoid pushing costs onto other places.
• Tax sharing of common economic gain to share costs
• Environmental costs and sprawl
• Infrastructure is inherently regional
28

• This can be a formal consolidation of gov’ts or it could be REAL collaboration. Need a consensus!
– Why rely on borders drawn for the needs of the 19th century? I flew to Edmonton rather than on horseback, why govern that way?
• Regions that realize they are linked will have a competitive advantage in the global economy.competitive advantage in the global economy.
– Lower taxes, better infrastructure, better public services, stronger economic development
– Just being a little more competitive will shift capital from around the world at the click of a mouse.
• Regionalism is the real sleeping giant for rural communities for sustainability.
29

Example of Action
• Indiana realizes it has too much local gov’t for its own sake and proposes the elimination of 1,000+ units.
– Source: Wall Street Journal, Sept. 5, 2007, p. A1 and Indiana Commission on Gov’t Reform, (2007).
– “Despite the enormous economic, social, and technological changes that have occurred…, technological changes that have occurred…, Indiana’s system of local government would still be very recognizable to Hoosiers from the Civil War era…”
– Indiana Commission on Gov’t Reform, p. 42.
30

Regionalism—continued • Regionalism stops the “city” from keeping all
of the gains while ‘remote’ communities lose– Currently, (say) Edmonton keeps all of its tax
revenues from the region’s shoppers. Regional approach would disperse some back to the country for regional projects.
3131
country for regional projects.• Weakness of Conference Board of Canada (Globe and
Mail) cities approach. What’s in it for the rest of Canada?
• Does not consider smaller cities and does not require cities to share their prosperity with rural residents.

Good Strategies—cont.2. 21th Century will belong to places that use
their knowledge to leverage their assets.• Rural communities should be attractive to
knowledge workers
• Quality of life, pleasant environment, sustainable development—this is good economics!development—this is good economics!
• Rural US counties with greater shares of knowledge workers grow faster than metro areas (even metros with knowledge workers) and they grow about twice the rate of rural counties with low shares. • Source: see the appendix for a supporting chart
32

Good Strategies--cont3. Business retention and attraction makes
much more sense than tax incentives for outside investment.
• Treat all businesses alike.
• If you build a good climate for investment, your • If you build a good climate for investment, your own businesses will thrive and STAY.
• Innovation comes from small firms. It is better products and lower costs. Not necessarily the next bio-tech invention.
• Business Retention and Expansion Programs
33

Conclusions:What have we learned?
• Drop the silly fads and focus on the real fundamentals that make your community attractive to firms and workers.
• Lose that rearview mirror and focus on the • Lose that rearview mirror and focus on the 21st Century.
34

Conclusions• Focus on realities such as emerging regions
that the people have self formed—the politicians lag what the people are doing.
• Adopt good strategies that don’t require perfect foresight. perfect foresight.
– You just need to make it such that the best firms want to be where you are.
• Education & entrepreneurship are keys.
35

Thank you
Presentation will be posted at The Ohio State University, AED Economics, Swank Program website:
http://aede.osu.edu/programs/Swank/
(under presentations)
3636
(under presentations)
• For commuting maps for all Canadian urban areas & details of Infrastructure Canada project:
• Canada Rural Economy Research Lab (CRERL) Mapping the Rural Urban Interface Project. http://www.crerl.usask.ca/infra.php

Appendix Slides
37

Great diversity in rural America:
3838

1990/91-2006 North American Population Growth
3939

1996-2001 Population in Manitoba and Saskatchewan at the CCS level: With 100 km rings around CAs and CMAs
4040
Source: Statistics Canada—1996 CCS Boundaries

In Saskatchewan, population growth only in the CMAs of
Regina and Saskatoon in the 1986 to 2001 period
-5
0
5
10
15
20
Percent change in total population
1986 to 1991 1991 to 19961996 to 2001 2001 to 2006
Figure F8
41
-15
-10
All LUCs CMAs CAs All RST areas Strong MIZ Moderate MIZ Weak MIZ No MIZ
Source: Statistics Canada, Census of Population, 1986 - 2006. Data are tabulated within constant boundaries.Census Metropolitan Areas (CMAs) have 100,000 or more in the urban core and includes all neighbouring towns and municipalities where 50 percent or more of the workforce commutes to the urban core. Census Agglomerations (CAs) have 10,000 to 99,999 in the urban core and includes all neighbouring towns and municipalities where 50 percent or more of the workforce commutes to the urban core.Metropolitan Influenced Zones (MIZ) are assigned on the basis of the share of the workforce that commutes to any CMA or CA (Strong MIZ: 30 to 49 percent; Moderate MIZ: 5 to 29 percent; Weak MIZ: 1 to 5 percent; No MIZ: no commuters).
Larger urban centres (LUCs) Rural and small town (RST) areas

Context for Firm
Strategy and Rivalry
Demand Factor
Conceptualizations of Competitiveness
42
Demand Conditions
Related and Supporting Industries
Factor Conditions
The Porter Diamond Framework (Porter, 1998)

NCC Competitiveness Pyramid
43Source: National Competitiveness Council
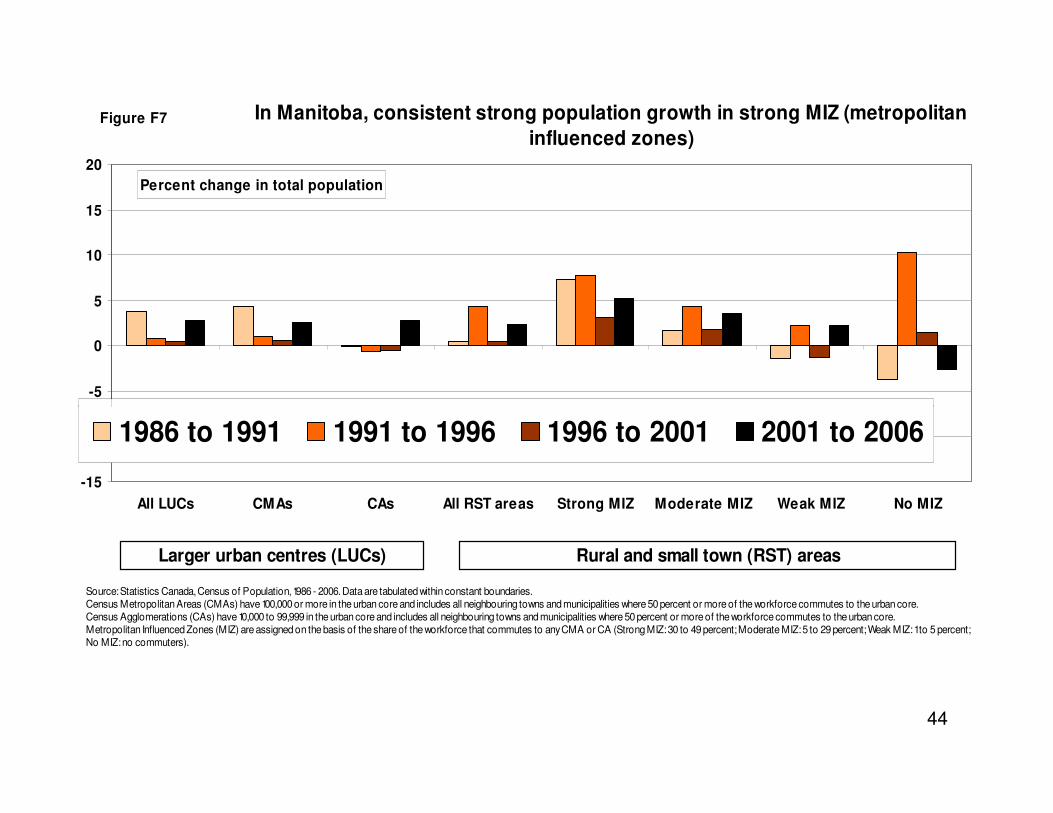
In Manitoba, consistent strong population growth in strong MIZ (metropolitan
influenced zones)
-5
0
5
10
15
20
Percent change in total population
Figure F7
44
-15
-10
All LUCs CMAs CAs All RST areas Strong MIZ Moderate MIZ Weak MIZ No MIZ
1986 to 1991 1991 to 1996 1996 to 2001 2001 to 2006
Source: Statistics Canada, Census of Population, 1986 - 2006. Data are tabulated within constant boundaries.Census Metropolitan Areas (CMAs) have 100,000 or more in the urban core and includes all neighbouring towns and municipalities where 50 percent or more of the workforce commutes to the urban core. Census Agglomerations (CAs) have 10,000 to 99,999 in the urban core and includes all neighbouring towns and municipalities where 50 percent or more of the workforce commutes to the urban core.Metropolitan Influenced Zones (MIZ) are assigned on the basis of the share of the workforce that commutes to any CMA or CA (Strong MIZ: 30 to 49 percent; Moderate MIZ: 5 to 29 percent; Weak MIZ: 1 to 5 percent; No MIZ: no commuters).
Larger urban centres (LUCs) Rural and small town (RST) areas

In Ontario, 2001 to 2006 strong population growth in the larger cities (CMAs)
and in No MIZ (metropolitan influenced zones)
-5
0
5
10
15
20
Percent change in total population
Figure F6
25%
45
-15
-10
All LUCs CMAs CAs All RST areas Strong MIZ Moderate MIZ Weak MIZ No MIZ
1986 to 1991 1991 to 1996 1996 to 2001 2001 to 2006
Source: Statistics Canada, Census of Population, 1986 - 2006. Data are tabulated within constant boundaries.Census Metropolitan Areas (CMAs) have 100,000 or more in the urban core and includes all neighbouring towns and municipalities where 50 percent or more of the workforce commutes to the urban core. Census Agglomerations (CAs) have 10,000 to 99,999 in the urban core and includes all neighbouring towns and municipalities where 50 percent or more of the workforce commutes to the urban core.Metropolitan Influenced Zones (MIZ) are assigned on the basis of the share of the workforce that commutes to any CMA or CA (Strong MIZ: 30 to 49 percent; Moderate MIZ: 5 to 29 percent; Weak MIZ: 1 to 5 percent; No MIZ: no commuters).
Larger urban centres (LUCs) Rural and small town (RST) areas

In each period, strong MIZ grew faster than moderate MIZ which, in
turn, grew faster Weak MIZ, Canada
0
5
10
15
20Percent change in total population
Figure 10
46
-15
-10
-5
All LUCs CMAs CAs All RST
areas
Strong MIZ Moderate
MIZ
Weak MIZ No MIZ RST
Territories
1986 to 1991 1991 to 1996 1996 to 2001 2001 to 2006
Source: Statistics Canada, Census of Population, 1986 - 2006. Data are tabulated within constant boundaries.Census Metropolitan Areas (CMAs) have 100,000 or more in the urban core and includes all neighbouring towns and municipalities where 50 percent or more of the workforce commutes to the urban core. Census Agglomerations (CAs) have 10,000 to 99,999 in the urban core and includes all neighbouring towns and municipalities where 50 percent or more of the workforce commutes to the urban core.Metropolitan Influenced Zones (MIZ) are assigned on the basis of the share of the workforce that commutes to any CMA or CA (Strong MIZ: 30 to 49 percent; Moderate MIZ: 5 to 29 percent; Weak MIZ: 1 to 5 percent; No MIZ: no commuters).
Larger urban centres (LUCs) Rural and small town (RST) areas

Wyoming: Alberta on Steroids!
7.13%
39.6%
AB 1981 mining share
AB 1981-2004 population growth
WY’s greater natural resource intensity did
47
14.43%
3%
0% 5% 10% 15% 20% 25% 30% 35% 40% 45%
WY 1981 mining share
WY 1981-2004 population growth
WY’s greater natural resource intensity did not produce faster growth

48

49