Building growth & portfolio optimization
38
Q2 ‘21 RESULTS TIM GROUP Building growth & portfolio optimization 28 July 2021
Transcript of Building growth & portfolio optimization

Q2 ‘21 RESULTS
TIM GROUP
Building growth & portfolio optimization
28 July 2021

2Q2 ‘21 RESULTS
Disclaimer
This presentation contains statements that constitute forward looking statements regarding the intent, belief or current expectations of future growth in the differentbusiness lines and the global business, financial results and other aspects of the activities and situation relating to the TIM Group. Such forward looking statementsare not guarantees of future performance and involve risks and uncertainties, and actual results may differ materially from those projected or implied in the forwardlooking statements as a result of various factors.
The financial results of the TIM Group are prepared in accordance with International Financial Reporting Standards issued by the International Accounting StandardsBoard and endorsed by the EU (designated as “IFRS”).The accounting policies and consolidation principles adopted in the preparation of the financial results for Q2’21 and H1’21 of the TIM Group are the same as thoseadopted in the TIM Group Annual Audited Consolidated Financial Statements as of 31 December 2020, to which reference can be made, except for the amendmentsto the standards issued by IASB and adopted starting from 1 January, 2021.Please note that the limited review by the external auditors (E&Y) on the TIM Group Half-year Condensed Consolidated Financial Statements at 30 June 2021 has notyet been completed.
Alternative Performance MeasuresThe TIM Group, in addition to the conventional financial performance measures established by IFRS, uses certain alternative performance measures for the purposesof enabling a better understanding of the performance of operations and the financial position of the TIM Group. In particular, such alternative performancemeasures include: EBITDA, EBIT, Organic change and impact of non-recurring items on revenue, EBITDA and EBIT; EBITDA margin and EBIT margin; net financialdebt (carrying and adjusted amount) and Equity Free Cash Flow. Moreover, following the adoption of IFRS 16, the TIM Group uses the following additional alternativeperformance indicators:* EBITDA adjusted After Lease ("EBITDA-AL"), calculated by adjusting the Organic EBITDA, net of non-recurring items, of the amounts related to the accountingtreatment of lease contracts according to IFRS 16;* Adjusted Net Financial Debt After Lease, calculated by excluding from the adjusted net financial debt the net liabilities related to the accounting treatment oflease contracts according to IFRS 16;* Equity Free Cash Flow After Lease, calculated by excluding from the Equity Free Cash Flow the amounts related to lease payments.
Such alternative performance measures are unaudited.

OPERATIONS UPDATE

4Q2 ‘21 RESULTS
“Beyond connectivity” plan updateTIM Group
What happened in Q2 KPIs
ESG
▪ CSI mobile improved further (1)
▪ Increased target for renewable energy and indirect emissions
▪ Leaner organization, with pre-retirements
CSI mobile +0.1% QoQ, after +0.5% in Q1
100% renewable by 2025 (from 51%)
~1k exits in H1; more planned in H2
Domestic
▪ Fixed lines stable, UBB net adds strong, churn lower QoQSerie A + Champions League from July
▪ Best mobile coverage and fastest 5G network in Italy (2)
Mobile churn lower QoQ (best in 14 years)
▪ ICT growth remains strong thanks to Group’s factories
Retail UBB net adds +231k (0.5m H1)
Churn 3.4% in fixed, 3.7% in mobile
ICT revenues +28.5% YoY
Group ▪ Revenues back to growth first time since Q3 2018
▪ Extraordinary investments to set foundation for growth
▪ Net debt AL -€ 3.7bn YoY, on track for ‘23 2.6x leverage target
BrazilService revenues +8.7% YoY, +5.4pp QoQ
ARPU +10.3% YoY
EBITDA (3) +6.4% YoY, +1.6pp QoQ
▪ Strong acceleration in revenues growth
▪ ARPU growth in all segments
▪ EBITDA growth higher QoQ
Revenues change YoY
(1) Customer Satisfaction Index Q2 ‘21 vs. Q1 ’21(2) TIM awarded by Ookla for the best mobile coverage in Q1-Q2 2021 and top position for 5G speed, with a median download speed of 283 Mbps(3) Net non-recurring items
0,2%
-10,1%
1,0%
Q3 Q4 Q1 Q2 Q3 Q4 Q1 Q2 Q3 Q4 Q1 Q2
2018 2019 2020 2021

5Q2 ‘21 RESULTS
4 key growth drivers described in Q1 are materializingTIM Domestic
Q1 ResultsFiber to the
Footbal(FTTF)
TIM became the “home of the football”
Mobile only returning to
fixed BB
Italian market fixed lines grew +450k YoY in Q1
BB +700k (1)
Beyond connectivity
TIM factories: the growth engineRevenues from digital services on track
to more than double in 3-years
Public Funds
Italy’s Recovery and Resilience Plan approved by EU
1
2
3
4
(1) Source AGCOM

6Q2 ‘21 RESULTS
TIMVISION (6)
Full (DAZN)
Full (DAZN)
104 out of 137 matches(Mediaset Infinity+) (6)
€29.99(€19.99 till July 28th) (3)
TIM Domestic
TIMVISION “Football and Sports” launched in July, including in a single package the most complete content offering
DAZN Mediaset Infinity+Amazon Prime
VideoMediaset SKY
Serie A TIM Full3 out of 10 matches
per matchday
UEFA Europa League
Full Full
UEFA Champions League
104 out f 137 matches 16 out of 137 matches17 out of 137 matches
(including the final)121 out of 137 matches
(including the final)
Current price (€/month)
€29.99(€19.99 till July 28th) (4) €7.99
(included in the Prime subscription)
Free-to-air€35,90
(€30,90 till Sep. 30th) (5)
€29.99/month (€19.99 till July 28th) (3)
€34.99/month(€24.99 till July 28th) (3)
€39.99/month(€29.99 till July 28th) (3)
€44.99/month(€34.99 till July 28th) (3)
Serie A TIM and main
UEFA competitions:
offering matrix
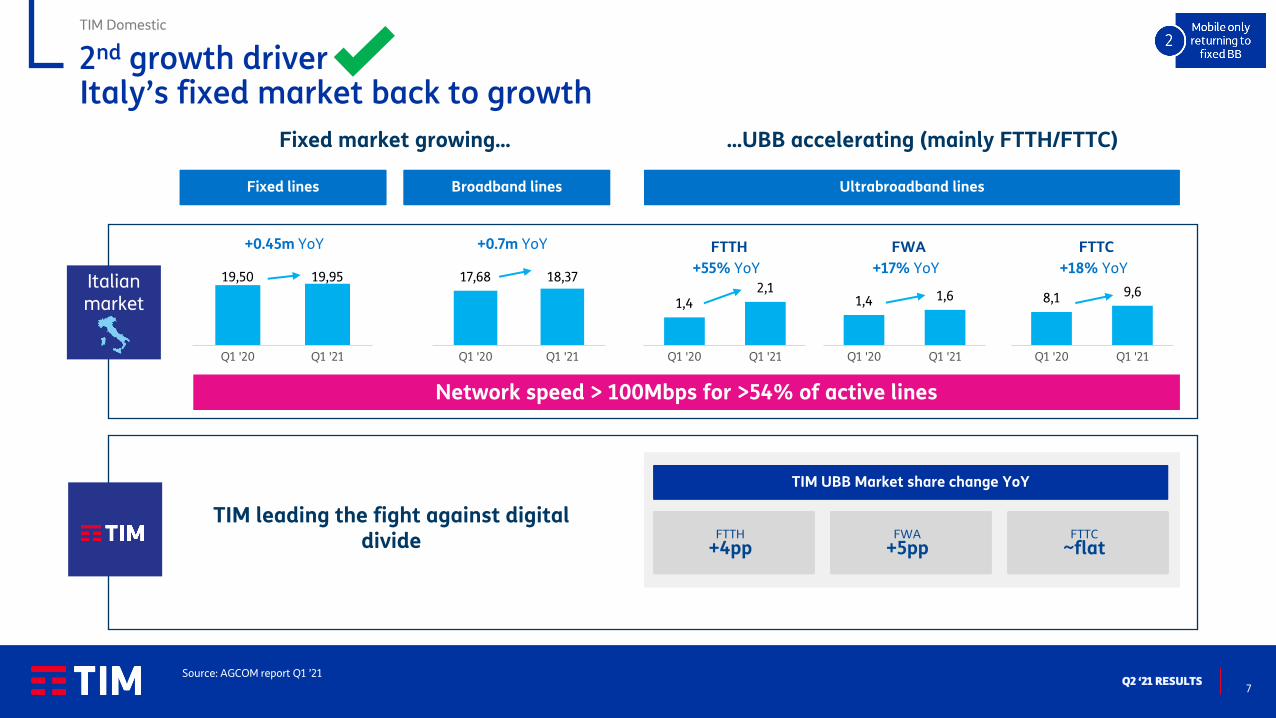
1st growth driver - TIM becomes the “home of football” for a c. 5mmarket expected to move from satellite to fibre or from piracy to paying
▪ DAZN with full Serie A TIM, full UEFA Europa League and the best of UEFA Conference League
▪ Mediaset Infinity+ with UEFA Champions League (104 out of 137 matches per season)
▪ Full Tokyo 2020 Olympics with Eurosport Player, including the channel Eurosport 4K in exclusive on TIMVISION (1)
▪ Many other sports competitions on DAZN, Eurosport Player and TIMVISION (2)
▪ TIMVISION, discovery+ and Mediaset Infinity+ entertainment catalogue: movies, TV series, shows, documentaries, cartoons and original productions
▪ TIMVISION Box to easily access all this contents and more (i.e. Mediaset Free-to-air DTT channels and Prime Video App* with the remaining UEFA Champions League Matches)
* Prime subscription required (not included in TIMVISION “Football and Sports” package).
(1) Eurosport Player included for 12 months with TIMVISION (2) Among others on DAZN, Eurosport Player and TIMVISION: Serie B, La Liga, English FA Cup, MotoGP, cycling events (3 Grand Tours, with exclusive Vuelta and the Classics), tennis (3 Grand Slam), basketball (Serie A), golf (with exclusive PGA Tour and European Tour), all winter sports, motors (24 Hours of Le Mans agreement renewed), UEFA Women’s Champions League, Women’s Football Serie A (3) 12 months promotional price for subscriptions until July 28th. Activation cost €9.99, TIM Vision Box included on loan for free use; Infinity+ included for 12months (4) 12 months promotional price for subscriptions until July 28th (5) Sky Smart offer via Internet with 18 months commitment required. Includes the mandatory Sky Tv entertainment pack and other sports contents (i.e. full Serie B, UEFA Conference League, Formula1). Activation cost € 9,00 (6) The remaining UEFA Champions League matches (on Amazon Prime Video App* and Mediaset Free-to-air channels) available on the TIMVISION Box
7Q2 ‘21 RESULTS
TIM Domestic
19,50 19,95
Q1 '20 Q1 '21
1,42,1
Q1 '20 Q1 '21
+0.45m YoY
Fixed lines
+55% YoY
FTTH+0.7m YoY
Broadband lines
17,68 18,37
Q1 '20 Q1 '21
1,4 1,6
Q1 '20 Q1 '21
+17% YoY
FWA
8,1 9,6
Q1 '20 Q1 '21
+18% YoY
FTTC
TIM UBB Market share change YoY
FTTH
+4ppFWA
+5ppFTTC
~flat
Ultrabroadband lines
Network speed > 100Mbps for >54% of active lines
Fixed market growing... ...UBB accelerating (mainly FTTH/FTTC)
TIM leading the fight against digital divide
Italianmarket
Source: AGCOM report Q1 ’21
2nd growth driver Italy’s fixed market back to growth

8Q2 ‘21 RESULTS
5,5% 5,3%
4,0%
5,2%
4,2%3,8% 3,7%
4,9% 4,7%
3,0%4,0% 4,0%
3,6% 3,4%
Q4 '19 Q1 '20 Q2 Q3 Q4 Q1 '21 Q2
Churn mobile Churn fixed
256
TIM Op 1 Op 2 Op 3
Market growth helping TIM’s “Fix the fixed” to deliver results even in challenging environments. FSR growth expected for H2
higher UBB penetration
Source: AGCOM
FTTC
FTTH
lower churn
UBB coverage
direct payments
85% 87%
Q4 '20 Q2 '21
>93% of active linesFTTx
technical units
Q1 '20 Q2 Q3 Q4 Q1 '21 Q2
TIM Unica customers+26%
digital and convergencefor consumer
Q2 '20 Q2 '21 Q2 '20 Q2 '21
+5pp+8pp
% on fixed CB % on mobile CB (1)
(1) Data only lines excluded
TIM Domestic
Cloud business revenues+20% YoY
Q2 '20 Q2 '21
digitalfor business
ICT revenues
+29%
Q1 ‘21: TIM leading FTTx net addsk lines
-10,4%
Q4'19
Q1'20
Q2 Q3 Q4 Q1'21
Q2 Q3 Q4
Organic – YoY change %
Fixed Service Revenues towards growth
Football to further stimulate UBB penetration and bring top line growth
Q1'20
Q2 Q3 Q4 Q1'21
Q2 Q3 Q4
Organic – YoY change %
Mobile Service Revenuestowards stabilization
One-offs affecting Q1 and Q2 to fade away in coming quarters
COVID lockdown

9Q2 ‘21 RESULTS
TIM Domestic
Incremental revenuestreams:
▪ Subscriptions & set-up fees
▪ Modem sales
▪ Connectivity (additional customers, lower churn)
Football ups stickiness
2020 2023
2020 2023
TIM factories respond to clients’ needs increasing satisfaction
2.2x
International services
2020 2023
+>20%
Digital services International wholesale
Cloud and data centers
IoT Cyber security
Revenues2020-‘23
3rd growth driver “beyond connectivity” engine of growth, creating value and optionality
▪ Increasing customers’ demand of digital services
▪ Strong cross-synergies among factories and with TIM’s core business
▪ Much higher market multiples than TIM and the telco sector: 10-20+x EV/EBITDA

10Q2 ‘21 RESULTS
Telsy and Olivetti re-engineered as startups to ride IoT and cybersecurity growth prospects
Market shareambition
2024
Addressablemarket
Margin
Cybersecurity Crypto
~1.9 bn€ in 2024
7% CAGR
~€20m in 2024
20% CAGR
12% 60-80%
B2B managed security services offering including specialized consulting and high growth/ margin products
B2G innovative systems capable of securing and encrypting communications
~€40-50%25-30%
Merchant Services IoT Smart Services
5%
~5 bn€ in 2024
4-5% CAGR
~4.5 bn€ in 2024
10% CAGR
5%
Electronic cash registers and POS, business management software and digital payments
Industrial IoT: IoT services and sensors for prioritized verticals
Urban IOT: city control platforms
25-30% 10-15%
TIM Domestic

11Q2 ‘21 RESULTS
Noovle and Sparkle on track to reach their ambitious targets
Q2 ‘21 revenues
+20% YoY
Leading Italian cloud and infrastructure provider
Wholesale market: consolidate leadership
Enterprise market: implementing a new model
Growth strategy: targeting new segments and geographies
▪ New infrastructures in high growing geographies
▪ Development of major Hub areas
▪ New Enterprise Model. Started to increase international enterprise customers base thanks to new approach and portfolio
▪ Sparkle becoming a core connectivity and E2E enterprise partner with new integrated portfolio of Security, IoT and Cloud services in collaboration with TIM Factories
Panama Digital Gateway 4,800 sqm5MW
Q2 ‘21 service revenues
+13% YoY
Target 2023
double-digit EBITDA CAGR
▪ Q2 performance confirms guidance with revenues +20% YoY
▪ In 6 months Noovle has signed more than 1,100 contracts
▪ Delivering data center spaces for Google regions in line with plan
▪ Noovle is now a “Società Benefit” (for profit and sustainability)
Targets 2024 (1)
Revenues: €1bn, EBITDA: €0.4bn
TIM Domestic
(1) Target provided before Recovery Plan

12Q2 ‘21 RESULTS
15,6
19,8
30,9
25,4
59,5
40,3
20,2
29,8
33,8
31,5
70,0
49,8
Health
Social
Education
Infrastructure
Green Revolution
Digitalization
RRF React EU + Compl. Fund
191,544,5
4th growth driver: EU approved Italy’s Recovery and Resilience Plan and unlocked €24.9bn
TIM Domestic
235.1€ bn
1,6
13,5
25,9
35,641,6
37,8
30,8
'20 '21 '22 '23 '24 '25 '26
Italian Recovery and Resilience plan (€ 235.1bn)
by funding by mission RRF investments by year(€ 186.8bn investments, RFF)
o/w € 186.8bn for investments (~26% digital)
€, bn €, bn
Schedule of investments
"Italia a 1 Giga" plan
Schools
Vouchers
€1.1bn → €3.9bn Consultation ongoing, tender in Q1 2022
€0.4bn 68% already assigned in public tender
€0.2bn (phase 1)
€0.9bn (phase 2)
Ongoing, >55% still available as of June 30th
Delayed after the summer
"Italia 5G" plan €2.0bn Consultation ongoing, tender in Q1 2022
€ 15.1bn
Recovery & Resiliency Plan
expected impact on Italy’s GDP 16pp growthin 2021-’26 (2)
-8,9%
5,1%
2020 2021
New projection for Italy’s GDP growth (1)
(1) Source: Banca d’Italia (“Macroeconomic projections for the Italian economy - July 2021”) (2) Source: Ministry of Economy and Finance

13Q2 ‘21 RESULTS
Guidance embodies TIM-DAZN agreement & market impact of voucher plan delay Expected benefits from Recovery Plan and Oi mobile acquisition not included yet
IFRS 16/After Lease – Group figures @ average exchange-rate actual 5,9 REAIS/€(1) Guidance based on IFRS 16 for Brazil’s EBITDA(2) Excluding Oi’s mobile acquisition(3) Based on Organic EBITDA AL; 2.7x based on Reported EBITDA AL
TIM Group
Organic Service revenues
Low to mid single digit growth
CAPEX
Eq FCF AL Cumulated ~€ 4.0 bn
Adjusted Net Debt AL
YoY growth rates,IFRS 16 / After Lease
2021
Group Domestic Brazil (1)
2022-‘23 2021 2022-‘23 2021 2022-‘23
Organic EBITDA AL
Mid single digit growth
Mid single digit growth
Dividendordinary: floor of € 1 cent per share, aim to distribute 20-25% of yearly Equity FCF subject to deleverage execution
savings: €2.75 cents per share throughout 2021-23
~€ 16.8 bnexcluding Oi (2)
Stable to Low single digit growth
Stable Mid single digit growth
Mid single digit growth
~R$ 13.0 bn~R$ 13.5 bn with Oi
Net of ~€0.7bn tax realignment cost
Mid single digit growthHigh single digit growth(CAGR ‘20-’23) with Oi
Mid single digit growthDouble digit growth
(CAGR ‘20-’23) with Oi
Low to mid single digit growth
Mid single digit decrease
2.6x Net Debt AL / EBITDA AL (3)
by 2023
~€ 2.9 bn per year
Low to mid single digit decrease
~€ 3.0-3.1 bnaccording to football
take-up

Q2 ‘21 FINANCIAL & OPERATING RESULTS

15Q2 ‘21 RESULTS
Group revenues back to growth first time since Q3 ’18; services 0.8pp better QoQ
(1) Excluding exchange rate fluctuations, non-recurring items and change in consolidation area
Organic data (1), IFRS 16, € m
TIM Group
Domestic EBITDA AL like for like -2.5% YoY:
▪ c. 5pp drags from labour cost discontinuities, e.g.: 1) 5 solidarity days vs. 12 in 2020, 2) mandatory holidays in 2020, 3) indirect cost of labour. These drags are not expected to be repeated in H2
▪ > 2pp drags from football launch and factories’ start up costs
EBITDAafter lease
1.185
1.433
Domestic
Brazil
Margin 37.6%
-7.4%
-9.5%
+4.9%
Q2 ‘21
D% YoY
c. -2.5% YoYLike for like
Servicerevenues
Domestic
Brazil
2.798
3.459
Q2 '21Q2 ‘21
D% YoY D% YoY
-1.7%
+8.7%
-4.0%2.753
3.387
Q1 '21
-2.5%
+3.3%
-3.9%
Q1 ‘21
Q2 total revenues +1.0pp QoQ (domestic -1%)
Service revenues +0.8pp QoQ (domestic flat)
0,2%-1,3%
-2,9%-3,9%-6,1%-6,6%
-8,4%-10,1%
-5,0%-2,1%
0,0%1,0%
Q3 Q4 Q1 Q2 Q3 Q4 Q1 Q2 Q3 Q4 Q1 Q2
Totalrevenues
YoY trend
2018 2019 2020 2021

16Q2 ‘21 RESULTS
21.095
16.591
17.415
Q2 '20
Q1 '21
Q2 '21
Substitute tax
Spectrum pre-payment
Regulatory fines & one-offs
Dividends
+231
+240
+148
+312
Q2 cash generation and debt affected by one-off payments 3-year €4bn Equity FCF guidance reiterated
(1) Mainly litigations already accounted for in guidance(2) Adjusted Net Debt
TIM Group
Q2 ‘21 EFCF AL € 161m net of:
▪ 231m substitute tax for goodwill realignment (leading to € 5.9bn tax asset, i.e. no tax payments for 18 years)
▪ € 148m payments of regulatory fines & one-offs (mainly Cassiopea) accrued and provided for in previous years, already embodied in 3-year guidance
YoY comparison is affected by :
▪ Q2 2020 CAPEX lower than average due to COVID (€ 222m YoY swing)
▪ Q2 2020 benefiting from the shift to H2 of Fistel payment (€ 81m YoY swing)
▪ Benefit from TimFin kick off in 2020
Net debt after lease (2)
+824 QoQ
Net Debt AL -€ 3.7bn YoY vs. -€ 1.7bn in Q2 ’20
QoQ increase related to:
▪ spectrum pre-payment (€ 240m for 35Mhz usable for 5G), allowing to save € 40m financial charges
On top of:
▪ dividends payment (€ 312m including TIM Brazil minorities)
Equity free cash flow after lease
EFCF AL Comparable EFCF AL
EFCF AL EFCF ALnet of
one-offs
Q2 ‘20 Q2 ‘21
Substitutetax
One-offpayments (1)
TimFin+ Fistel
shift
-3,680 YoY
Net debt guidance FY ‘21: €16.8bn

17Q2 ‘21 RESULTS
TIM Domestic
UBB coverage and take up increase QoQ
81% 82%85% 86% 87%
40% 41% 42% 43% 45%
Q2 '20 Q3 Q4 Q1 '21 Q2
UBB POPcoverage
UBBtake upretail & wholesale
UBB coverage and take up (1)
(2)
Retail net adds better QoQ and YoY
Line lossesk lines
-59
-159
6
-16 -9
Q2 '20 Q3 Q4 Q1 '21 Q2
Churn reduced further QoQ
Churn rate%
0.5m retail ultrabroadband net adds in H1, highest level since H1 ’18 (156k new BB lines(3))
UBB take up accelerating
Vouchers: >55% of first €200m tranche for low-income families still available. TIM getting c. 80% market share
Churn benefiting from convergence and increased direct payments (+7.3pp YoY)
TIM fixed lines remain stable for third consecutive quarter; churn falls further
(1) UBB take up calculated on technical HHs covered by UBB(2) Equivalent to >93% of families with a fixed line(3) New lines excluding customer base transformations
3,0%4,0% 4,0% 3,6% 3,4%
Q2 '20 Q3 Q4 Q1 '21 Q2
CSI/NPS increased in H1
CSI
FY '20 Q2 '21
+1.5%
FY '20 Q2 '21
+2
NPS
Retail UBB net adds keep growing fast
4.381 4.516
4.695 4.926
9.076 9.442
Q1 '21 Q2 '21
Wholesale Retail
+20% YoY
+135
+231+219 in Q2 ’20
UBB Customer Basek lines
+5% YoY

18Q2 ‘21 RESULTS
Fixed revenues stable helped by the business segmentTIM Domestic
Fixed RevenuesOrganic data€ m
219 248
568 542
1.422 1.362
152 207
Q2 '20 Q2 '21
2,360
Intern. Wholesale+13.2%
2,157
National Wholesale (1)
-4.7%
Retail (2)
-4.2%
Service -2.3%
Total +0.2%
2,208
2,364
Equipment
+36.2%
Total Fixed Revenues +0.2% YoY in Q2 (after +3.0% in Q1)
Fixed Service Revenues -2.3% YoY (-0.5% in Q1)
▪ International Wholesale +13.2% vs. +1.4% in Q1 thanks to improved voice and data services volumes
▪ National Wholesale (1) -4.7% YoY impacted by comparison with very strong non-regulated revenues in Q2 ‘20
▪ Retail (2) YoY trend -4.2% vs. -4.3% in Q1 benefiting from:
– Customer base stabilization –2.9pp YoY, 0.8pp better QoQ
– ICT revenues growing +28.5% YoY
Convergence grew with larger adoption of TIM Unica
Direct payments increased, with benefits on churn
converged customer base% on BB customer base
Direct payments% on consumer fixed customer base
Q2 '20 Q2 '21
+5.7pp(+1.4pp QoQ)
Q2 '20 Q2 '21
+7.3pp(+0.4pp QoQ)
(1) Including FiberCop revenues(2) Including ICT revenues generated by TIM Factories
Consumer ARPU affected by activations’ dynamic, with business offsetting thanks to the push on digital services
30,3 33,0
Q2 '20 Q2 '21
+8.6%ARPU Retail(BB&ICT)€/month
Equipment +36.2% vs. +58.5% in Q1

19Q2 ‘21 RESULTS
-103
Mobile churn keeps improving (new low of last 14 years)Calling human lines progressively stabilizing
TIM Domestic
k lines
Churn improvedboth QoQ and YoY
Calling human net addsfurther reduced QoQ
Human Calling net adds QoQk lines
Market MNP down YoY, TIM still the best among MNOs
Market MNPmillion lines
2,3
Q2 Q3 Q4 Q1 '21 Q2
Op.1
Op.2
Op.3
TIM
Q2 ‘21
87
-112-165 -145 -110
Q2 '20 Q3 Q4 Q1 '21 Q2
4,0%5,2%
4,2% 3,8% 3,7%
Q2 '20 Q3 Q4 Q1 '21 Q2
Churn rate%
-9% 2%-19% -18%
-2%
Mobile Customer Base
Impact on MSR from CB reduction +1.4pp better QoQ (after ~ +1pp in Q1)
Churn 0.1pp better QoQ, +0.3pp YoY
CSI +0.1% QoQ in Q2, after +0.5% in Q1
19.554 19.306
10.669 11.011
30.222 30.317
Q1 '21 Q2 '21
YoY
+95k+52k in Q1
Human
Not human

20Q2 ‘21 RESULTS
MSR trend improving QoQ for better customer base trend and lower dragsTIM Domestic
Total Mobile Revenues -3.3% YoY vs -8.6% in Q1
MSR trend YoY (-7.1% vs -11.3% in Q1), is mainly explained by:Mobile Revenues
Organic data € m
90 97
752685
97 126
Q2 '20 Q2 '21
909
Wholesale& Other+7.6%
783Service-7.1%
Retail-8.9%
843
940
Equipment+29.8%
Total-3.3%
▪ Customer base trend <1pp (vs. ~ -2pp in Q1)
▪ Price dynamics +0.7pp (vs. ~ -0.5pp in Q1)
MTR price reduction explains -0.9pp drag
Handset sales grew 29.8% YoY (vs. +10.4% in Q1)
(1) Including roaming, CSP cleaning, COVID related retail & wholesale out-of-bundle(2) Accounting impact of Q2 ‘20 COVID-related Giga free monetized in Q2 ’20 organic revenues
▪ -3.2pp of one-off drags (1) < -1pp expectedin H2
▪ -2.1pp accounting impact (2)
affecting organic revenues, notreported
No impact from Q3
▪ -0.8pp related to lapping ofpast price moves
< -0.5pp dragin H2

21Q2 ‘21 RESULTS
Addressable cost base reduction decelerated to -3.1% YoY due to discontinuities on labor cost
(1) Net of capitalized costs(2) Includes other costs/provision and other income
TIM Domestic
▪ Labour +2.1% YoY, would have been -11% YoY net of drags from:
- lower solidarity days vs. Q2 ‘20 that benefited from anticipation
of H2 solidarity: 12 days vs. 5 days in 2021 (8.5pp drag)
- lower holidays vs Q2 ’20 (4.3pp drag)
FTE 1.9k reduction YoY
▪ G&A & IT +35% mainly for higher indirect personnel costs
▪ Industrial: energy cost down -3% YoY thanks to lower consumption
and better prices
▪ Commercial: -17% mainly for lower commissioning and bad debt
▪ CoGS increase related to ICT revenue growth
▪ Equipment costs growth lower than sales growth
▪ Interconnection increase for higher traffic volumes in international
wholesale (data & voice bundles)
493
115
244
255
187
234
292
Interconnection
Equipment
CoGS
Commercial
Industrial
G&A & IT
Labour
Other
OPEXOrganic data, IFRS 16, € m
1,817
Q2 ‘21
+5.1% (+89)
(1)
(2)
YoY change
-17%
-4%
+35%
+2%
+14%
+22%
+33%
Addressable costs-3.1% YoY
(-8.9% in Q1)

22Q2 ‘21 RESULTS
Two thirds of CAPEX dedicated to transformation and growthTIM Group
Organic data, € m
CAPEX focused on growth
Group CAPEX up YoY due to:
▪ Q2 ‘20 CAPEX affected by COVID
▪ In Q2 ‘21 push on transformation CAPEX (2.5x YoY) for FTTH roll out (+15% FTTH premises in 6 months), football and Noovle’s data centers
▪ Reduction in maintenance CAPEX
Group Operating Working Capital outflow worsening -€ 161m YoY
-€ 109m YoY worsening excluding YoY swing in non-recurring items
▪ Domestic -€ 65m YoY mainly related to litigation settlements
▪ Brazil -€ 49m mainly related to the Fistel payment shifted to H2 in ‘20
Group Operating Working Capital
Q2 ’20 Q2 ’21
(251)(412)
(98)(46)(349)
(458)
Group
-109net non-
recurring items
Net Working CapitalIFRS 16, € m
D YoY
Operating WC Non-recurring items
-161659 549
735
215
106
142
874
655
877
Q2 '19 Q2 '20 Q2 '21
Domestic
Brazil
COVID impact

23Q2 ‘21 RESULTS
TIM Brasil accelerates growth rates thanks to successful value strategyTIM Brasil
(1) Excluding M2M
Mobile TIM Live
3.926 4.267+8.7%
+11.5%
+8.5%
ARPU +10.3% YoYto 25.8 R$/month
Prepaid ARPU +11.2% YoYPostpaid ARPU +5.6% YoY (1)
Revenues +21.1% YoY
CB +10.0% YoY to 666k
ARPU +8.2% YoY to 90.8 R$
Revenues accelerating growth trend, with positive contribution from both postpaid and prepaid on services
Q2 ‘20 Q2 ‘21
Services +8.7% YoY, +5.3pp QoQ
MSR +8.5% YoY (vs. +2.8% in Q1) Postpaid +8.9% (vs. +3.9% in Q1) Prepaid back to growth, +5.4% YoY
FSR +11.5% YoY driven by TIM Live
~R$ 11m in Q1 ‘21
Mobile ARPU growing for 22 consecutive quarters
Consistent sequential revenues improvement
FTTH coverage +38% YoY3.8m HHs covered
Mobile access network4G: 4.3k cities covered, +22% YoY
4.5G: 1.5k cities covered, +20% YoY
Massive MIMO+285 sites QoQ
Network Sharing Agreementcoverage expansion in >350 cities each
EBITDA growth thanks to revenues performance
1.9672.092+6.4%
+4.8% in Q1
Q2 ‘20 Q2 ‘21
20th quarter of positive EBITDA growth
Infrastructure Development
>2m invoices paid
Special Projects
Fiber Co
CADE approval on June 16th
Next steps▪ Anatel’s prior consent▪ Closing expected for September-
October▪ Higher secondary considering
additional HPs vs deal’s original scope
▪ Smooth transition with a TSA contract
▪ Additional FTTSite contract to be signed at closing
New Customer Platform Partnership
TIM + Ampli (Cogna Group)Participating in the fast-growing distance learning segment
Financial services
TIM+C6: R$20m revenues in Q2 ‘21
ESG
R$ 1.6bn sustainability-linked debenture issued
30 new active biosites to >1.7k +102 sky sites to 224
+15 renewable power plants
Tot. revenues +10.5% YoY, +7.5pp QoQ EBITDA net non-recurring items, R$mReported, R$m
Serviceso/w Fixed
o/w Mobile
24Q2 ‘21 RESULTS
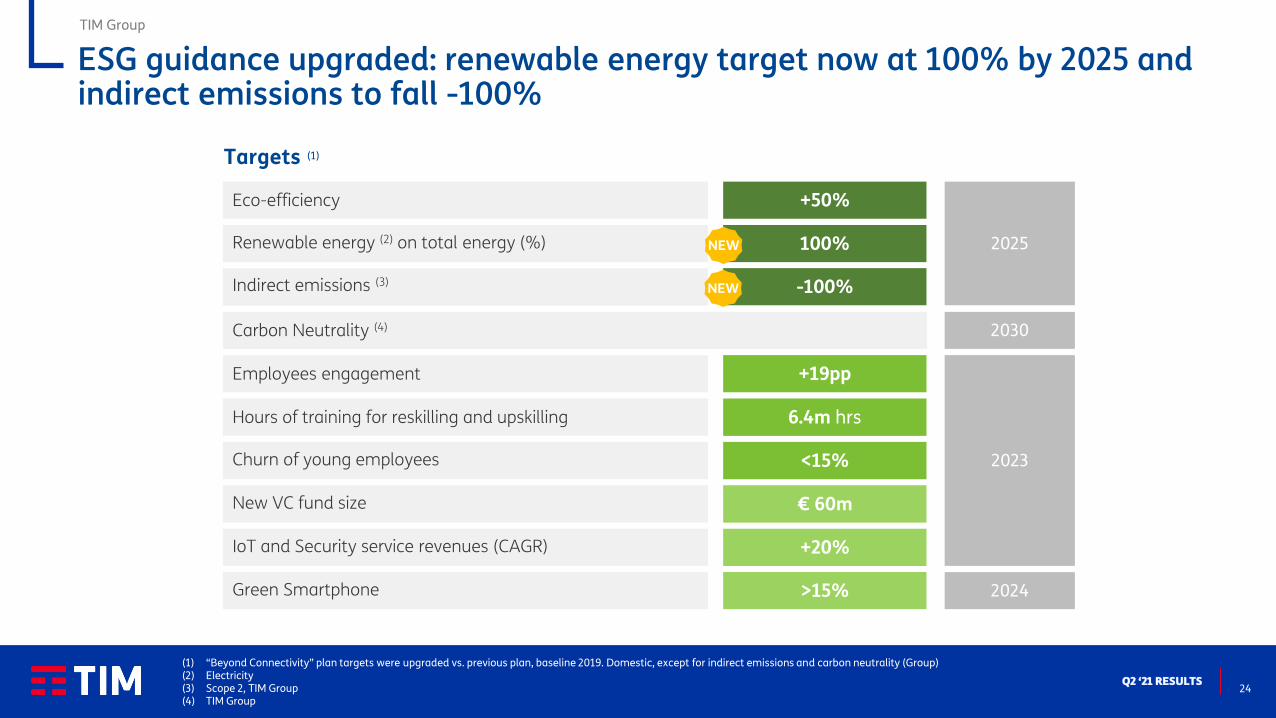
(1) “Beyond Connectivity” plan targets were upgraded vs. previous plan, baseline 2019. Domestic, except for indirect emissions and carbon neutrality (Group)(2) Electricity(3) Scope 2, TIM Group(4) TIM Group
2023
Targets (1)
Employees engagement
Hours of training for reskilling and upskilling
Churn of young employees
+19pp
6.4m hrs
<15%
2024
New VC fund size
Green Smartphone
IoT and Security service revenues (CAGR)
€ 60m
+20%
>15%
2030
2025
Carbon Neutrality (4)
Indirect emissions (3)
Eco-efficiency +50%
Renewable energy (2) on total energy (%) 100%
-100%
TIM Group
NEW
NEW
ESG guidance upgraded: renewable energy target now at 100% by 2025 and indirect emissions to fall -100%

STRATEGIC INITIATIVES UPDATE

26Q2 ‘21 RESULTS
Strategic initiatives update: moving forward in portfolio optimisationTIM Group
TIM Group ownership
EV/EBITDA multiple
Primarynetwork
TIM core growingrevenues and EBITDA
through “beyond connectivity”and efficiencies
100%
100%
100%
100%
100%
67%
58%
30%(1)
TIM Brazil acquisition of Oi mobile assets with
Vivo and Claro (2)
>8x
Secondary part of access network (FiberCop) @ >8x
with €1.8bn proceeds
~25x
Towers (INWIT) partial monetization @ ~25x
EBITDA with €2.3bn proceeds
Additional portfolio optimization on the way to capture synergies and crystalize market’s sector multiples
(1) 15% economic interest: 30.2% stake in the share capital of INWIT owned by Daphne 3, a holding company controlled by TIM with 51%(2) Pending approval

CLOSING REMARKS

28Q2 ‘21 RESULTS
Closing remarks
Stabilizing connectivity revenues in Italy and accelerating in Brazil
▪ Group revenues growing YoY for the first time since Q3 2018
▪ Domestic fixed lines stable for third quarter in a row, UBB growing fast
▪ Convergence bringing mobile churn at lowest level in 14 years
Investing in “beyond connectivity” to achieve growth and further portfolio optimization
▪ Football, cloud, cybersecurity, IoT are growth engines and provide optionality
▪ TIM is the sum of the core and all of these initiatives
Macro forecasts improved
Expected benefits from the Recovery Plan and the acquisition with Vivo and Claro of Oi mobile assets not yet embodied in guidance
TIM Group

Q&A

ANNEX

31Q2 ‘21 RESULTS
TIM Group
▪ Decree-Law 104/2020 allows for realignment of intangible asset tax value to the book value
▪ 3% substitute tax to be paid on the amount redeemed
▪ Future income taxes will benefit from intangible asset tax amortization
Realignment of the tax value
▪ Overall tax benefit: € 5.9bn (28.5% of tax basis) net of substitute tax
▪ Benefit will occur over 18 years
TIM SpA intangible assets redeemed
▪ To be paid in 3 annual instalments (€ 0.2bn per year), from June 2021 Substitute tax (3%): € 0.7bn
Realignment of intangible asset tax value

32Q2 ‘21 RESULTS
Liquidity margin - After Lease viewCost of debt ~3.2%, -0.1p.p. QoQ, -0.2p.p. YoY
TIM Group
0,8
0,6
0,8
0,7
0,1
0,1
3,84,03,1
2,4
3,3
2,0
1,8
7,5
20,1
6,3
10,3
0,6
3,9
3,0
4,1
2,71,9
7,6 23,9
Liquidity margin Within 2021 FY 2022 FY 2023 FY 2024 FY 2025 FY 2026 Beyond 2026 Total M/L TermDebt
(1)
Liquidity Margin Debt Maturities
Bonds LoansUndrawn portions of committed bank linesCash & cash equivalent
Covered until 2023
(1) € 23,915m is the nominal amount of outstanding medium-long term debt. By adding the balance of IAS adjustments and reverse fair value valuations (€ 400m) and current financial liabilities (€ 314m), the gross debt figure of € 24,629m is reached

33Q2 ‘21 RESULTS
* Including cost of all leases
Cost of debt ~3.6%*, flat QoQ, -0.2p.p. YoY
TIM Group
Bonds LoansUndrawn portions of committed bank linesCash & cash equivalent Finance Leases
0,3 0,6
0,6
0,5
0,4
0,4
1,8
4,7 0,6 0,8
0,6
0,8
0,7
0,1
3,8
4,0 3,1
2,4
3,3
2,0
1,8
7,5
20,1
6,3
10,3
1,0
4,5
3,6
4,7
3,1 2,3
9,5 28,7
Liquidity margin Within 2021 FY 2022 FY 2023 FY 2024 FY 2025 FY 2026 Beyond 2026 Total M/L TermDebt
(1)
Liquidity Margin Debt Maturities
(1) € 28,654m is the nominal amount of outstanding medium-long term debt. By adding the balance of IAS adjustments and reverse fair value valuations (€ 427m) and current financial liabilities (€ 314m), the gross debt figure of € 29,395m is reached
Covered until 2023
Liquidity margin - IFRS 16 view

34Q2 ‘21 RESULTS
Well diversified and hedged debtTIM Group
Average m/l term maturity: 6.9 years (bond 6.6 years only)
Fixed rate portion on medium-long term debt ~71%
Around 25% of outstanding bonds (nominal amount) denominated in USD and GBP and fully hedged
Banks & EIB13,1%
Bonds68,9%
Other1,8%
Op. leases and long rent
16,2%
Gross Debt
(1) Refers to positive MTM derivatives (accrued interests and exchange rate) for € 658m, financial receivables for lease for € 109m and other credits for € 276m
NFP
adjusted
Fair
value
NFP
accounting
GROSS DEBT
Bonds 20,258 248 20,506
Banks & EIB 3,847 - 3,847
Derivatives 221 1,417 1,638
Op. leases and long rent 4,766 - 4,766
Other 303 - 303
TOTAL 29,395 1,665 31,060
FINANCIAL ASSETS
Liquidity position 6,280 - 6,280
Other (1)
1,043 1,410 2,453
TOTAL 7,323 1,410 8,733
NET FINANCIAL DEBT 22,072 255 22,327

35Q2 ‘21 RESULTS
Deleverage: € 1.3bn debt cut in H1 (-€ 1.2bn After Lease view)TIM Group
€ m; (-) = Cash generated, (+) = Cash absorbed, excluding call-outs
Dividends& Changein Equity
FY ’20Net Debt AL
Operating FCF
FinancialExpenses
Cash Taxes& Other
FY ’20Net Debt
Leaseimpact
Leaseimpact
EBITDACAPEXΔWC & Others
1,177(691)
269Op.FCF ex. Licence 755
Q1 ‘21Net Debt
H1 ’21Net Debt AL
(1) Including FiberCop, financial investments, cash taxes & other(2) Including financial investments, licence, cash taxes & other(3) Includes Inwit deconsolidation
-€ 1,182m
H1 ‘20FY ’19 -1,697
21,893 5,775 27,668 (788) 295 (470)(3) 40 26,745 (757) 309
33 (7) (1,258) (16) (5,590)(4,342) (10)453(1,043)(3,299)
FY ’19 H1 ‘20-798
-€ 1,254m
Δ vs. 2020
2020
H1 ’21Net Debt
Dividends& Changein Equity
Operating FCF ex. licence
FinancialExpenses
Cash Taxes& Other
(634)(1) 308
51,243
25,971 (4,876)
219(3,899)
21,095
(3,680)
EBITDACAPEX ex.licenceΔWC & Others
1,593(877)(412)
Op.FCF ex. Licence 304
Net debt QoQ increase due to:▪ Substitute tax▪ Licence▪ Regulatory fines & one-offs▪ Dividends
+231+240+148+312
(1)
(2)

36Q2 ‘21 RESULTS
Reported data, € m, Rounded numbers
Net Interest & Net Income/ Equity/ Disc. Operations
EBIT Group Net Result
excl. NRI
Taxes GroupNet Result
MinoritiesEBITDAReported
Depreciation & Amortization
& Other
H1 ‘20 1042 (153) (166) 723 (45) 6783,398 (2,356)
Δ vs. H1 ‘20 87 (541) (395)(1) 168 (768) (47) (815)(628)
H1 ‘21
TIM Group
Net financial expenses (582)Income equity invested 34
Net Income
Net Resultafter
Minorities
Non-RecurringItems (NRI)(2)
(342) 336
686 (129)
COVID impact 18Personnel and other 429Taxes (103)
(1) Of which Inwit gain on disposal 448m in H1 ’20(2) Non-recurring items include personnel provisions (2021-26 layoffs ex art.4 Fornero Law), legal and COVID related costs
o/w NRI on Personnel H1 ‘21 €335m
Q1 (216)Q2 +79

37Q2 ‘21 RESULTS
EBITDA to evolve to FTTH in time…
FiberCop value to grow over time thanks to switch in the mix from copper towards fiber
Revenues2021 € 1.2 – 1.3bn
EBITDA 2021 ~€ 0.9bn
Net Debt / EBITDA2021 3.4x
FiberCop Financials
EBITDA - CAPEX Positive from
2025
CAPEX / Sales at regime <10%
14%
57%
82%
2021 2022 2023 2024 2025 2026 2027 2028 2029 2030
Revenues from Fiber EBITDA from Fiber Fiber Lines
FiberCop Financials in a nutshell(1)
(1) More details in August 31st 2020 presentation
TIM Domestic

38Q2 ‘21 RESULTS
For further questions please contact the IR team
(+39) 06 3688 1 // (+39) 02 8595 1
www.gruppotim.it
www.twitter.com/TIMNewsroom
www.slideshare.net/telecomitaliacorporate