Building for the future - nordea.com · 116 154 166 166 166 64 64 64 163 82 115 82 239 178 137 ......
26
Sanford C. Bernstein Pan-European Strategic Decisions Conference 18 September 2014 Christian Clausen, President and Group CEO Building for the future
Transcript of Building for the future - nordea.com · 116 154 166 166 166 64 64 64 163 82 115 82 239 178 137 ......

Sanford C. Bernstein Pan-European Strategic Decisions Conference
18 September 2014
Christian Clausen, President and Group CEO
Building for the future

Headline lower line
Sub-head line
Single medium chart axis
Right content border
Slide bottom border
Left border Right border Left content border
Comment text box top
Content and chart border
Small chart axis
Sub-head line
Small chart top
Small chart axis
Left and right small lower comments top border
Single medium chart toptop
Heading
Primary chart colours
Sub-head
Content lines (Non-Nordea)
Small chart top
76 116 154
166 166 166
64 64 64
163 82
115
239 178 137
119 154 188
175 80 70
233 170
0
217 217 217
Page numbers 166 166 166
Secondary chart/diagram colours (Non-Nordea)
185 205 229
217 217 217
Other chart and ornamental colours
239 241 204
211 157 155
204 102
0
127 127 127
82 82 82
217 217 217
Comments 76 116 154
166 166 166
This presentation contains forward-looking statements that reflect management’s current
views with respect to certain future events and potential financial performance. Although
Nordea believes that the expectations reflected in such forward-looking statements are
reasonable, no assurance can be given that such expectations will prove to have been
correct. Accordingly, results could differ materially from those set out in the forward-looking
statements as a result of various factors.
Important factors that may cause such a difference for Nordea include, but are not limited
to: (i) the macroeconomic development, (ii) change in the competitive climate, (iii) change
in the regulatory environment and other government actions and (iv) change in interest rate
and foreign exchange rate levels.
This presentation does not imply that Nordea has undertaken to revise these forward-
looking statements, beyond what is required by applicable law or applicable stock
exchange regulations if and when circumstances arise that will lead to changes compared
to the date when these statements were provided.
Disclaimer
2 •

0
96
161
225
106
3
1
144
163
163
153
111
175
80
70
127
127
127
233
170
0
163
82
115
103
172
206
239
178
137
117
204
208
204
199
178
211
157
155
182
185
186
242
206
134
206
159
182
Primary Colours Extra Colours
76
116
154
Chart Colours 119
154
188
166
166
166
191
191
191
127
127
127
204
102
0
0
96
161
Nordea was created with the vision that the Nordic
region was one market and to establish a pan-Nordic
platform
Nordic ideas
3 •
Nordea has established a pan-Nordic platform… … and is the largest financial services group in the region
Today, Nordea is the largest financial services group in
the Nordic and Baltic Sea region
11 million customers
Distribution power through 800 locations and
over 7 million Netbank customers
Financially strong with a CET1 capital ratio of
15.2%
AA credit rating
EUR ̴ 41bn in market cap and a top-10 European
retail bank

The relationship bank business model
has delivered 14

0
96
161
225
106
3
1
144
163
163
153
111
175
80
70
127
127
127
233
170
0
163
82
115
103
172
206
239
178
137
117
204
208
204
199
178
211
157
155
182
185
186
242
206
134
206
159
182
Primary Colours Extra Colours
5 76
116
154
Chart Colours 166
166
166
191
191
191
127
127
127
204
102
0
0
96
161
119
154
188
Nordea has a unique position in the Nordics…
Note: Illustration excludes, Baltic's (406,700 total customers) and Russia (67,000 total customers)
1: Ranking in Nordic region
Sweden
Norway
Finland
Denmark
Relationships
(m)
Market
position
Superior customer franchise Global capabilities on par with
international peers1
Relationships
(‘000s)
52 #1-2
Total
Nordea 10.5 #1 540 #1
Capital Markets
Asset
Management
Life &
Pension
Private Banking
#1
#1
#1
#1
Retail Customers Corporates & Institutions
4.1 #2-3
1.0 #2
3.2 #1-2
1.8 #2
238 #1-2
88 #2
125 #1
Market
position

…with a resiliant relationship bank business model
Nordea is the most
diversified Nordic bank…
…with low-volatility
earnings growth…
…and low funding costs
Nordea Peer 1 Peer 2 Peer 3 Peer 4 Peer 5
Largest market contribution1
Nordea Peer 1 Peer 2 Peer 3 Peer 4 Peer 5
Earnings volatility2 Funding cost3
Nordea Peer 1-18
Notes:
1) Credit portfolio by geographical area
2) Net income volatility 2008-2013. Compared to Nordic peers
3) Five year Senior CDS spread. Compared to European peers
6 •
2015 plan update 14

Headline lower line
Sub-head line
Single medium chart axis
Right content border
Slide bottom border
Left border Right border Left content border
Comment text box top
Content and chart border
Small chart axis
Sub-head line
Small chart top
Small chart axis
Left and right small lower comments top border
Single medium chart toptop
Heading
Primary chart colours
Sub-head
Content lines (Non-Nordea)
Small chart top
76 116 154
166 166 166
64 64 64
163 82
115
239 178 137
119 154 188
175 80 70
233 170
0
217 217 217
Page numbers 166 166 166
Secondary chart/diagram colours (Non-Nordea)
185 205 229
217 217 217
Other chart and ornamental colours
239 241 204
211 157 155
204 102
0
127 127 127
82 82 82
217 217 217
Comments 76 116 154
166 166 166
The 2015 plan – an update
Nordea market commitments Key initiatives and levers
Strong capital generation and
increased payout ratio in 2014 and 2015
while maintaining a strong capital base
To reach a ROE of 13% at the required
CET1 ratio taking prevailing low interest
rates into account
Delivering low-volatility results
based on a well diversified and resilient
business model
Capital initiative to improve the CET1 ratio
Initiatives for income generation
Efficiency initiatives of ~EUR 900m
5% lower cost base 2015 vs. 2013
Low-risk profile and low volatility
8 •

Headline lower line
Sub-head line
Single medium chart axis
Right content border
Slide bottom border
Left border Right border Left content border
Comment text box top
Content and chart border
Small chart axis
Sub-head line
Small chart top
Small chart axis
Left and right small lower comments top border
Single medium chart toptop
Heading
Primary chart colours
Sub-head
Content lines (Non-Nordea)
Small chart top
76 116 154
166 166 166
64 64 64
163 82
115
239 178 137
119 154 188
175 80 70
233 170
0
217 217 217
Page numbers 166 166 166
Secondary chart/diagram colours (Non-Nordea)
185 205 229
217 217 217
Other chart and ornamental colours
239 241 204
211 157 155
204 102
0
127 127 127
82 82 82
217 217 217
Comments 76 116 154
166 166 166
11 689 12 821
14 313
17 766 19 103
20 677 21 961
23 112 23 172
2006 2007 2008 2009 2010 2011 2012 2013 H1/14
1 882 3 715
5 868 7 180 8 675
10 261 12 017 13 399 14 066
1 271
2 568
3 087 4 093
5 261
6 309
7 679
9 413 10 263
3 153
6 283
8 955
11 273
13 936
16 570
19 696
22 812 24 329
2006 2007 2008 2009 2010 2011 2012 2013 H1/14
Strong capability to generate capital
COMMON EQUITY TIER 1 CAPITAL*, EURm
CAPITAL GENERATION**, EURm
• Doubled the capital base in 7 years
• Increased CET 1 ratio from 6.8% to
15.2%
COMMENTS
Acc. retained equity
Acc. Dividend incl. accrued dividend , EUR 850m***, for H1/14
Dividend payout (accrued dividend for H1/14)
CET 1 capital
* Basel 2.5 until FY 2013. Basel 3 from 2014
** Dividend included in the year profit was generated. Excluding rights issue
(EUR 2 495m in 2009).
*** Assumes a 56% payout ratio 9 •

Headline lower line
Sub-head line
Single medium chart axis
Right content border
Slide bottom border
Left border Right border Left content border
Comment text box top
Content and chart border
Small chart axis
Sub-head line
Small chart top
Small chart axis
Left and right small lower comments top border
Single medium chart toptop
Heading
Primary chart colours
Sub-head
Content lines (Non-Nordea)
Small chart top
76 116 154
166 166 166
64 64 64
163 82
115
239 178 137
119 154 188
175 80 70
233 170
0
217 217 217
Page numbers 166 166 166
Secondary chart/diagram colours (Non-Nordea)
185 205 229
217 217 217
Other chart and ornamental colours
239 241 204
211 157 155
204 102
0
127 127 127
82 82 82
217 217 217
Comments 76 116 154
166 166 166
2,860 3,240
Income holding up
• Lending margins up 7 bps
YoY (RB)
• Lending margins up 16 bps
YoY (WB)
• Continued strong inflow of
household customers
~ 45,600 new (externally
recruited) Gold and
Premium customers (RB)
• Further strengthened
customer service model
with enhanced focus on
business potential, cross-
selling and ancillary income
(WB)
• Strengthened capital
markets position
• Strong performance in
Equities, with increasing
market shares
• Participated in three IPOs
and a number of capital
raisings
• Continued growth in AuM,
up 14% YoY
Re-pricing New customers Ancillary income
538
708
10 •
NCI DEVELOPMENT, EURm
CAGR +7%
Q2/10 Q2/14
LENDING RE-PRICING DEVELOPMENT PB AND GOLD CUSTOMERS, thousands
Q2/10 Q2/14 Q2/10 Q2/14
29 bps
CAGR +3%

Reductions in Nordea Life & Pension
Other
Increased Offshoring
Capital Markets savings
Reduced external spend
Insourcing of IT services
Branch closures and reduced cash handling
Moderated expansion plans in Wealth area
HQ programme
Streamlining & automation
11 •
Efficiency iniatives are in place to achieve the
5% cost reduction by end-2015
25%
17%
15%
10%
10%
6%
6%
4%
4%
3%
% of total cost
efficiency iniatives

Headline lower line
Sub-head line
Single medium chart axis
Right content border
Slide bottom border
Left border Right border Left content border
Comment text box top
Content and chart border
Small chart axis
Sub-head line
Small chart top
Small chart axis
Left and right small lower comments top border
Single medium chart toptop
Heading
Primary chart colours
Sub-head
Content lines (Non-Nordea)
Small chart top
76 116 154
166 166 166
64 64 64
163 82
115
239 178 137
119 154 188
175 80 70
233 170
0
217 217 217
Page numbers 166 166 166
Secondary chart/diagram colours (Non-Nordea)
185 205 229
217 217 217
Other chart and ornamental colours
239 241 204
211 157 155
204 102
0
127 127 127
82 82 82
217 217 217
Comments 76 116 154
166 166 166
Improved credit quality
TOTAL NET LOAN LOSSES, bps
• Ten year average of 16 bps
reached for first time since Q3/11
• Continued improvement in
Denmark
• Net reversals in Shipping
• Stable credit quality in other
areas
COMMENTS
12 •
-70.0
-60.0
-50.0
-40.0
-30.0
-20.0
-10.0
0.0
10.0
20.0
30.0
2002 2003 2004 2005 2006 2007 2008 2009 2010 2011 2012 2013 Q2/14
16 bps

Headline lower line
Sub-head line
Single medium chart axis
Right content border
Slide bottom border
Left border Right border Left content border
Comment text box top
Content and chart border
Small chart axis
Sub-head line
Small chart top
Small chart axis
Left and right small lower comments top border
Single medium chart toptop
Heading
Primary chart colours
Sub-head
Content lines (Non-Nordea)
Small chart top
76 116 154
166 166 166
64 64 64
163 82
115
239 178 137
119 154 188
175 80 70
233 170
0
217 217 217
Page numbers 166 166 166
Secondary chart/diagram colours (Non-Nordea)
185 205 229
217 217 217
Other chart and ornamental colours
239 241 204
211 157 155
204 102
0
127 127 127
82 82 82
217 217 217
Comments 76 116 154
166 166 166
13 •
Lower costs
RoE – strong underlying business performance
Excluding restructuring charge in Q2/14
Business
performance
External
factors Q2 2014 Q2 2013
11.6%
13.0%
12.0%
+1.4% -1.0%
Re-pricing
Ancillary
income
Lower
loan losses
Capital
increase
Other Volumes
Interest
rates
Headline lower line
Sub-head line
Single medium chart axis
Right content border
Slide bottom border
Left border Right border Left content border
Comment text box top
Content and chart border
Small chart axis
Sub-head line
Small chart top
Small chart axis
Left and right small lower comments top border
Single medium chart toptop
Heading
Primary chart colours
Sub-head
Content lines (Non-Nordea)
Small chart top
76 116 154
166 166 166
64 64 64
163 82
115
239 178 137
119 154 188
175 80 70
233 170
0
217 217 217
Page numbers 166 166 166
Secondary chart/diagram colours (Non-Nordea)
185 205 229
217 217 217
Other chart and ornamental colours
239 241 204
211 157 155
204 102
0
127 127 127
82 82 82
217 217 217
Comments 76 116 154
166 166 166
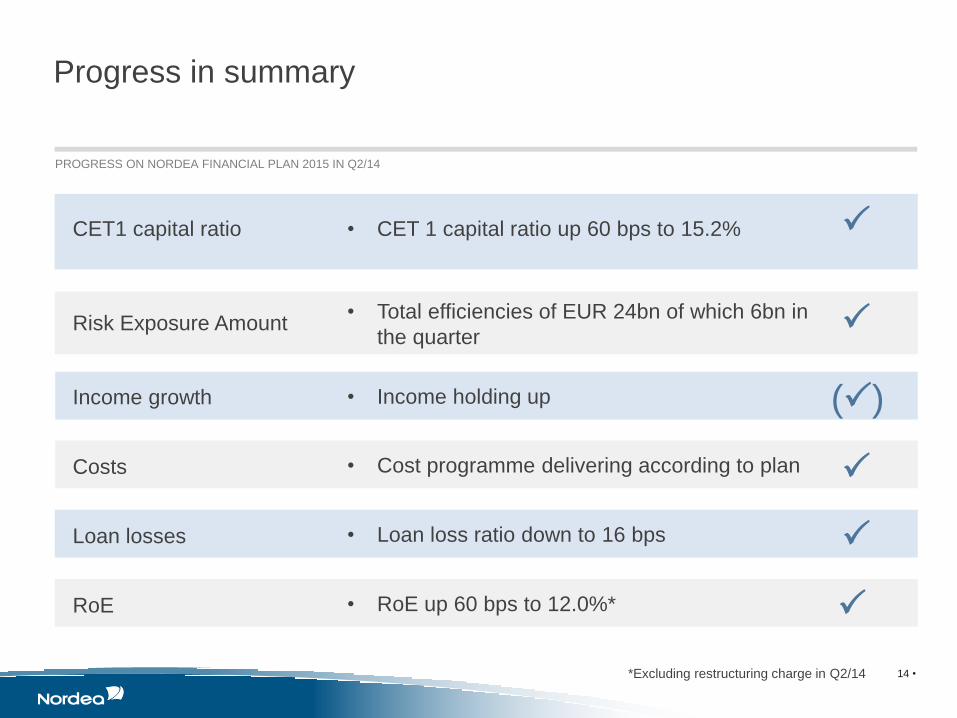
Progress in summary
• CET 1 capital ratio up 60 bps to 15.2%
PROGRESS ON NORDEA FINANCIAL PLAN 2015 IN Q2/14
CET1 capital ratio
Risk Exposure Amount
Income growth
Costs
Loan losses
RoE
P
• Total efficiencies of EUR 24bn of which 6bn in
the quarter
• Income holding up
• Cost programme delivering according to plan
• Loan loss ratio down to 16 bps
• RoE up 60 bps to 12.0%* P
P
P
P
(P)
14 • *Excluding restructuring charge in Q2/14

Banking Russia and Finland 14

16 •
Banking Russia operations
COMMENTS
• Limited share of Group operations
• 3% of income
• 2% of credit exposure
• Majority of lending is towards large
Russian corporates
• 600 Nordic customers
• Largest sector exposure
towards materials, real estate,
utilities, energy and
construction
• Largest currency exposure
towards USD (66%)
• RUB exposure funded locally via
deposits, USD and EUR exposure
funded via the Group
• Maturity of USD and EUR
funding has been prolonged
BANKING RUSSIA OPERATIONS
Nordea Bank
Russia Total
% of
Group Total
Total income 260 2.6
Operating profit 161 3.9
Nordea Bank
Russia Total
% of
Group Total
Lending corporates 5.6 3.0
Lending households 0.5 0.3
Total lending 6.1 1.8
Impaired loans gross 0.023 0.3
FY 2013, EUR MILLION
Q2 2014, EUR BILLION

Nordea actions regarding sanctions
17 •
• Task force in place since March 2014
• We monitor the development closely
• As of mid July, sanctions were extended from individuals and entities to specific
sectors – adding complexity
• Nordea follows OFAC (US), EU sanctions and Sectoral sanctions in all entities
• For non-sanction entities, business continues with existing customers
• No intention to increase business or market share
• Nordea is fully compliant with all regulatory requirements that apply to our operations

18 •
COMMENTS
• Finnish economy in undergoing the
longest downturn in 150 years
• Central and local government deficits
are large challenges
• Decline in the exports to Russia might
prolong the downturn, as Russia is
one of the largest export partners
(10% of exports)
• There are however some positive
trends which could have a positive
impact on exports
Macroeconomic view in Finland
Longest downturn in 150 years
Positive trends emerging
Index 2007=100

19 •
Finnish credit portfolio remains stable
PD development COMMENTS
Loan losses, Banking Finland, EURm
-5
0
5
10
15
20
25
30
0.000.200.400.600.801.001.201.401.601.80
20
11
Q1
20
11
Q2
20
11
Q3
20
11
Q4
20
12
Q1
20
12
Q2
20
12
Q3
20
12
Q4
20
13
Q1
20
13
Q2
20
13
Q3
20
13
Q4
20
14
Q1
20
14
Q2
Corporate
Household
• 22% of Nordea's total loan portfolio
• Average Corporate PD has gone down
as new lending is increasingly to better
rating classes
• Household average PD has increased
slightly over the last two years
• Loan losses are not showing an
increased trend despite the
macroeconomic situation
• The direct effect of Russian sanctions
and counter sanctions are hitting only
a few industries whose share of
Nordea’s lending book is very limited.
The expected direct impact on the
loan portfolio is minor

Banking business model undergoing change 14

0
96
161
225
106
3
1
144
163
163
153
111
175
80
70
127
127
127
233
170
0
163
82
115
103
172
206
239
178
137
117
204
208
204
199
178
211
157
155
182
185
186
242
206
134
206
159
182
Primary Colours Extra Colours
0
96
161
225
106
3
1
144
163
163
153
111
175
80
70
127
127
127
233
170
0
163
82
115
Primary Colours
76
116
154
Chart Colours 166
166
166
191
191
191
127
127
127
204
102
0
0
96
161
119
154
188
103
172
206
239
178
137
117
204
208
204
199
178
211
157
155
182
185
186
242
206
134
206
159
182
Extra Colours
21
SEPA End-date
Securities Law
Directive
FTT
Recovery & Resolution
for FMIs
Liikanen
Structural Reform
Shadow Banking
MiFID II / MiFIR
EMIR
Short Selling
CSD regulation
PRIPs
Investor Compensation
schemes
Dodd-Frank Act
Living
Wills
Banking Union
Basel III
CRD IV / CRR
Leverage Ratio
AIFMD UCITS V
Fundamental
Review of the
Trading Book
Banking
Recovery & Resolution
Directive
Long-term
Financing
Transparency
Directive
NSFR
Corporate
Governance
Data Protection Deposit
Guarantee
Schemes
Payments package
(PSD II) Volcker Rule
FATCA
Prospectus
Directive
Coherence of
legislation
“EU FATCA”
Solvency II
4th AML
Directive Bank Account
Mortgage
Directive
Remuneration
MAD
& OUR CUSTOMERS
ELTIF
MMFs
Benchmarks
Regulation
IMD 2
IORP II
Credit Rating
Agencies
Regulation
Insurance
Guarantee
Scheme
UCITS VI
The banking sector is currently affected by 48 new regulations

Technology-driven development of banking business
Transactions at branches, million
38
30
19
2009 2011 2013
Transactions in the mobile bank, million
0
6
17
2009 2011 2013
22 •

0
96
161
225
106
3
1
144
163
163
153
111
175
80
70
127
127
127
233
170
0
163
82
115
103
172
206
239
178
137
117
204
208
204
199
178
211
157
155
182
185
186
242
206
134
206
159
182
Primary Colours Extra Colours
23 76
116
154
Chart Colours 166
166
166
191
191
191
127
127
127
204
102
0
0
96
161
119
154
188
We change everything we do...
Balance sheet
Products and services
Production
Customer contacts
• More capital
• More liquidity
• Longer funding
• Online 24/7
• More digital, less
physical
• Capital-light products
• Customer data for
tailored services
• Mobile bank
• More efficient
• More flexible
• Adapted to regulations
and stable

0
96
161
225
106
3
1
144
163
163
153
111
175
80
70
127
127
127
233
170
0
163
82
115
103
172
206
239
178
137
117
204
208
204
199
178
211
157
155
182
185
186
242
206
134
206
159
182
Primary Colours Extra Colours
24 76
116
154
Chart Colours 166
166
166
191
191
191
127
127
127
204
102
0
0
96
161
119
154
188
...to shape the future relationship bank
Future relationship bank
A sustainable business model in the framework of the
new regulations
ROE clearly above cost of capital
Fully loaded balance sheet
2015 plan
Relationship strategy Values & leadership
Convincing
message to the capital
market
Strong brand with clear
customer
commitments

Customer
centricity
GREAT CUSTOMER
EXPERIENCES
Agility Scale
Simplification Key enabler for Nordea enhancing our strengths
More value to customers Easier to deal with, more competent, more relevant, more innovative ...
25 •
Simplification also enhances our strengths and supports great
customer experiences
Sanford C. Bernstein Pan-European Strategic Decisions Conference
18 September 2014
Christian Clausen, President and Group CEO
Building for the future