Building Financial Projections April 8, 2003 Charlie Tillett SM ‘91 508 358-7861...
51
-
Upload
lee-howard -
Category
Documents
-
view
217 -
download
0
Transcript of Building Financial Projections April 8, 2003 Charlie Tillett SM ‘91 508 358-7861...

Agenda
• Part 1• The Business Model
• Part 2• Building Your Financial Projections

Background
1991 MIT Sloan School of Management
Spring 1990 Third Place $10K Contest
Summer 1990 Intern - Boston Capital Ventures
‘91 to ‘00 CFO of NetScout Systems (NTCT)- VC financings of $6MM and
$45MM- IPO in August 1999
’00 to present Consulting CFO- Dot Com – Magazine
Subscriptions- Enterprise Software- Bomb Detection for checked
baggage
Dividing EquityAmong Founders & Investors
Initial Initial
Name Title # Shares % Shares % Shares % Shares % Shares % Shares %
Founders
Susan CEO 2,000,000 50.0% 2,000,000 42.6% 2,000,000 29.8% 2,000,000 26.8% 2,000,000 13.4% 2,000,000 8.9%
Joe CTO 1,000,000 25.0% 1,000,000 21.3% 1,000,000 14.9% 1,000,000 13.4% 1,000,000 6.7% 1,000,000 4.5%
Rakesh VP Sales 1,000,000 25.0% 1,000,000 21.3% 1,000,000 14.9% 1,000,000 13.4% 1,000,000 6.7% 1,000,000 4.5%
Total 4,000,000 100.0% 4,000,000 85.1% 4,000,000 59.7% 4,000,000 53.7% 4,000,000 26.8% 4,000,000 17.9%
Key Early Employees
Jack VP R&D 500,000 10.6% 500,000 7.5% 500,000 6.7% 500,000 3.4% 500,000 2.2%
Sam Manager 1 100,000 2.1% 100,000 1.5% 100,000 1.3% 100,000 0.7% 100,000 0.4%
Julie Manager 2 100,000 2.1% 100,000 1.5% 100,000 1.3% 100,000 0.7% 100,000 0.4%
Total - 0.0% 700,000 14.9% 700,000 10.4% 700,000 9.4% 700,000 4.7% 700,000 3.1%
Advisors Per Person # PP
Board Members 50,000 2 100,000 1.5% 100,000 1.3% 100,000 0.7% 100,000 0.4% 0.22%
Advisory Board 25,000 3 75,000 1.1% 75,000 1.0% 75,000 0.5% 75,000 0.3% 0.11%
Total - 0.0% - 0.0% 175,000 2.6% 175,000 2.3% 175,000 1.2% 175,000 0.8%
Option Plan Per Person # PP
VP Sales & CFO 300,000 2 600,000 8.9% 600,000 8.1% 600,000 4.0% 600,000 2.7% 1.34%
Director 50,000 5 250,000 3.7% 250,000 3.4% 250,000 1.7% 250,000 1.1% 0.22%
Sr. Eng 30,000 15 450,000 6.7% 450,000 6.0% 450,000 3.0% 450,000 2.0% 0.13%
Jr. Eng 20,000 10 200,000 3.0% 200,000 2.7% 200,000 1.3% 200,000 0.9% 0.09%
Mktg/sales/Finance 25,000 10 250,000 3.7% 250,000 3.4% 250,000 1.7% 250,000 1.1% 0.11%
Admin 2,000 5 80,000 1.2% 80,000 1.1% 80,000 0.5% 80,000 0.4%
Total - 0.0% - 0.0% 1,830,000 27.3% 1,830,000 24.6% 1,830,000 12.3% 1,830,000 8.2%
Investors
Angels ($500K at $4.5MM) 745,000 10.0% 745,000 5.0% 745,000 3.3%
VC Round ($10MM at $10MM) 7,450,000 50.0% 7,450,000 33.3%
VC Round ($10MM at $20MM) 0.0% 7,450,000 33.3%
Total - 0.0% - 0.0% - 0.0% 745,000 10.0% 8,195,000 55.0% 15,645,000 70.0%
Grand Total 4,000,000 100.0% 4,700,000 100.0% 6,705,000 100.0% 7,450,000 90.0% 14,900,000 45.0% 22,350,000 30.0%

Disclaimer - Charlie’s Rules-of-Thumb
• Focused on making attractive to investors
• Most relevant for technology-based companies
• May not apply to your industry or business model
• Most Common Business Plan Errors:• Revenue too high in year 4• Profit too high in year 4
What is a Business Model?
Boston Globe - January 9, 2003
• StorageNetworks replaced the CEO and eliminated 50% of its workforce as it struggles to find a new business model.
• Tried to build a national network of data-storage infrastructure available for lease but was hurt by customer reluctance to let outsiders handle their most sensitive data.
• Their new business model is focused on storage management software.

The Business Model
• A Profit & Loss Statement that details your financial performance in percentage terms
• Assumes you reach critical mass
• Explains WHY your business will MAKE MONEY
• The complete business plan shows HOW!
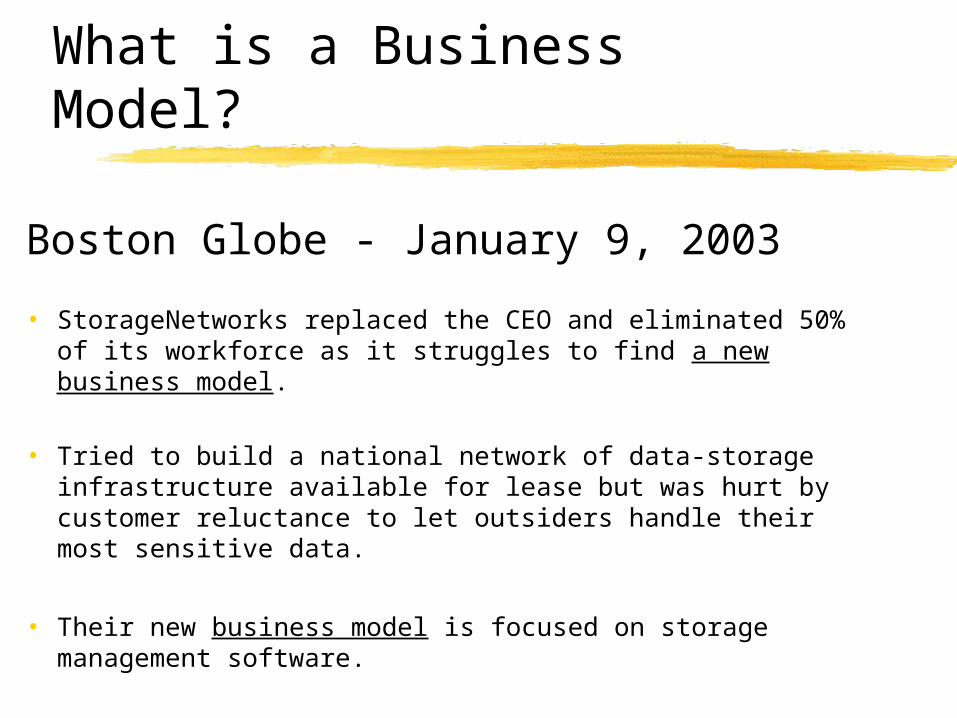
Profit & Loss (P&L) StatementAlso called Income Statement
• Revenue (after discounts)• Cost of Goods Sold (COGS)
• Direct product cost• Mfg but NOT R&D
• Gross Margin or Gross Profit
• Departmental Expenses
• Operating Profit – Operating Loss• Profit before taxes (PBT)• EBITDA (Earnings before
interest, taxes, depreciation, amortization)
Revenue 50.0$ 100%
Cost of Goods Sold 20.0$ 40%
Gross Margin 30.0$ 60%
Sales & Marketing 15.0$ 30%
R&D 5.0$ 10%
G&A 2.5$ 5%
Total Expenses 22.5$ 45%
Operating Profit 7.5$ 15%
Sample

Business Model Example“Typical” Data Communications Company
Sales 100%
Cost of Goods Sold (20% to 50%) 40%
Gross Margin 60%
Sales & Marketing (20% to 35%) 30%
R&D (10% to 15%) 10%
G&A (4% to 6%) 5%
Total Expenses 45%
Operating Profit (15%-25%) 15%

Actual Business ModelsQ3 ’98 and Q3 ’00
Cisco Cisco Sun Sun IBM IBM
Q3 '98 Q3 '00 Q3 '98 Q3 '00 Q3 '98 Q3 '00
Revenue 100% 100% 100% 100% 100% 100%
Cost of Goods Sold 35% 36% 50% 52% 60% 64%
Gross Margin 65% 64% 50% 48% 40% 36%
Sales & Marketing 19% 21% 22% 20% 17% 14%
R&D 12% 14% 10% 10% 7% 6%
G&A 3% 3% 6% 4% 4% 3%
Total Expenses 34% 38% 38% 34% 28% 23%
Operating Profit 31% 26% 12% 14% 12% 13%
Annual Revenue/Emp. 600,000$ 675,000$ 520,000$ 315,000$

Actual Business Models Q3 ’98 and Q3 ’00
Tech Data Tech Data Yahoo Yahoo Amazon Amazon
Q3 '98 Q3 '00 Q3 '98 Q3 '00 Q3 '98 Q3 '00
Revenue 100% 100% 100% 100% 100% 100%
Cost of Goods Sold 93% 95% 11% 13% 78% 74%
Gross Margin 7% 5% 89% 87% 22% 26%
Sales & Marketing 4% 3% 53% 36% 23% 22%
R&D 0% 0% 15% 9% 8% 11%
G&A 1% 1% 7% 6% 3% 4%
Total Expenses 5% 4% 75% 51% 34% 37%
Operating Profit 2% 1% 14% 36% -12% -11%
Annual Revenue/Emp. 2,000,000$ 250,000$ 400,000$ 400,000$ 300,000$

Case Study - CISCO Forecast – December 2002
FY '00 FY '01 FY '02 FY '03 FY '00 FY '01 FY '02 FY '03Actual Actual Forecast Forecast Actual Actual Forecast Forecast
Revenue 18.9$ 22.3$ 19.0$ 21.3$ 100% 100% 100% 100%
Cost of Goods Sold 6.7$ 9.2$ 7.7$ 7.8$ 35% 41% 41% 37%
Gross Margin 12.2$ 13.1$ 11.3$ 13.5$ 65% 59% 59% 63%
Sales & Marketing 3.9$ 5.3$ 4.3$ 4.4$ 21% 24% 23% 21%
R&D 2.7$ 3.8$ 3.3$ 3.4$ 14% 17% 17% 16%
G&A 0.7$ 0.7$ 0.6$ 0.7$ 4% 3% 3% 3%
Total Expenses 7.3$ 9.8$ 8.2$ 8.5$ 39% 44% 43% 40%
Operating Profit 4.9$ 3.3$ 3.1$ 5.0$ 26% 15% 16% 23%

Building YOUR Model
• Start with what you “know”• Your Cost of Goods Sold• R&D should end up at 10% to 20%• G&A should end up at 5% to 15%
• Target an operating profit of 15% to 20%
• Only remaining variable is Sales & Marketing

Building YOUR Model
• Verify your assumptions by looking at competitors or comparable companies
• You must be able to justify that:• You can meet a sales target of $X • With a Sales/Marketing budget of Y% of $X
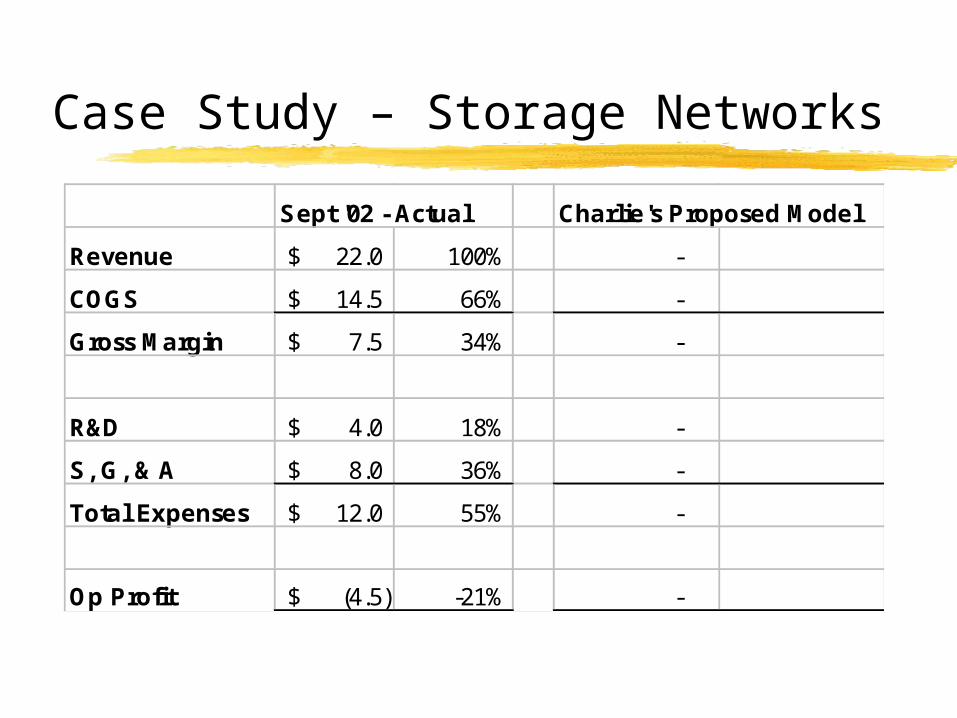
Case Study – Storage Networks
Sept '02 - Actual Charlie's Proposed Model
Revenue 22.0$ 100% -
COGS 14.5$ 66% -
Gross Margin 7.5$ 34% -
R&D 4.0$ 18% -
S, G, & A 8.0$ 36% -
Total Expenses 12.0$ 55% -
Op Profit (4.5)$ -21% -
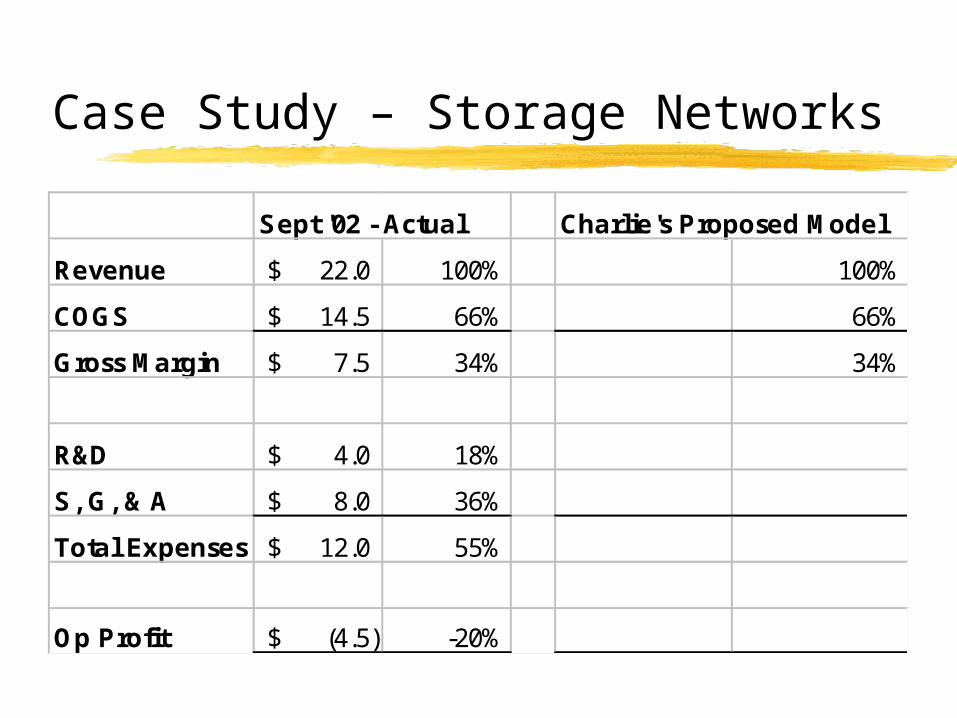
Case Study – Storage Networks
Sept '02 - Actual Charlie's Proposed Model
Revenue 22.0$ 100% 100%
COGS 14.5$ 66% 66%
Gross Margin 7.5$ 34% 34%
R&D 4.0$ 18%
S, G, & A 8.0$ 36%
Total Expenses 12.0$ 55%
Op Profit (4.5)$ -20%

Case Study – Storage Networks
Sept '02 - Actual Charlie's Proposed Model
Revenue 22.0$ 100% 100%
COGS 14.5$ 66% 66%
Gross Margin 7.5$ 34% 34%
R&D 4.0$ 18% 4.0$
S, G, & A 8.0$ 36%
Total Expenses 12.0$ 55%
Op Profit (4.5)$ -20%
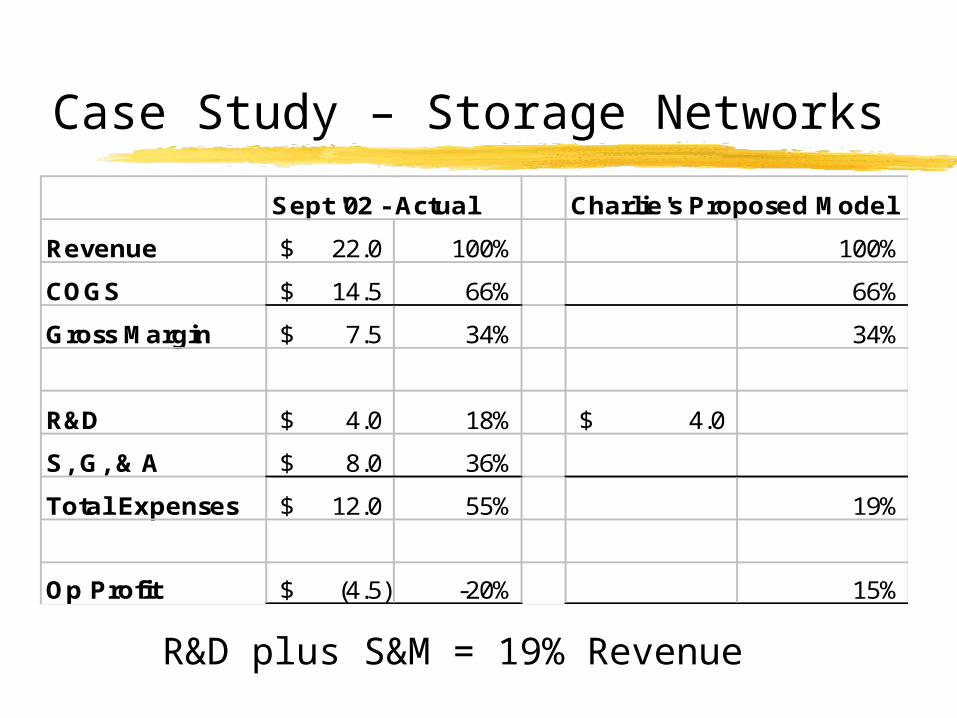
Case Study – Storage Networks
Sept '02 - Actual Charlie's Proposed Model
Revenue 22.0$ 100% 100%
COGS 14.5$ 66% 66%
Gross Margin 7.5$ 34% 34%
R&D 4.0$ 18% 4.0$
S, G, & A 8.0$ 36%
Total Expenses 12.0$ 55% 19%
Op Profit (4.5)$ -20% 15%
R&D plus S&M = 19% Revenue

Case Study – Storage Networks
R&D plus S&M = 19% Revenue
If we assume R&D = $4MM
then
Revenue = ($4 + S&M) / .19
S&M Revenue
6$ 53$
8$ 63$
10$ 74$
12$ 84$
14$ 95$
16$ 105$

Case Study – Storage Networks
Sept '02 Charlie's Proposed Model
Revenue 22.0$ 100% 63.0$ 100%
COGS 14.5$ 66% 41.6$ 66%
Gross Margin 7.5$ 34% 21.4$ 34%
R&D 4.0$ 18% 4.0$ 6%
S, G, & A 8.0$ 36% 8.0$ 13%
Total Exp. 12.0$ 55% 12.0$ 19%
Op Profit (4.5)$ -20% 9.4$ 15%

Case Study – Storage Networks
Sept '02 Charlie's Proposed Model
Revenue 22.0$ 100% 105.0$ 100%
COGS 14.5$ 66% 69.3$ 66%
Gross Margin 7.5$ 34% 35.7$ 34%
R&D 4.0$ 18% 4.0$ 4%
S, G, & A 8.0$ 36% 16.0$ 15%
Total Exp. 12.0$ 55% 20.0$ 19%
Op Profit (4.5)$ -20% 15.7$ 15%
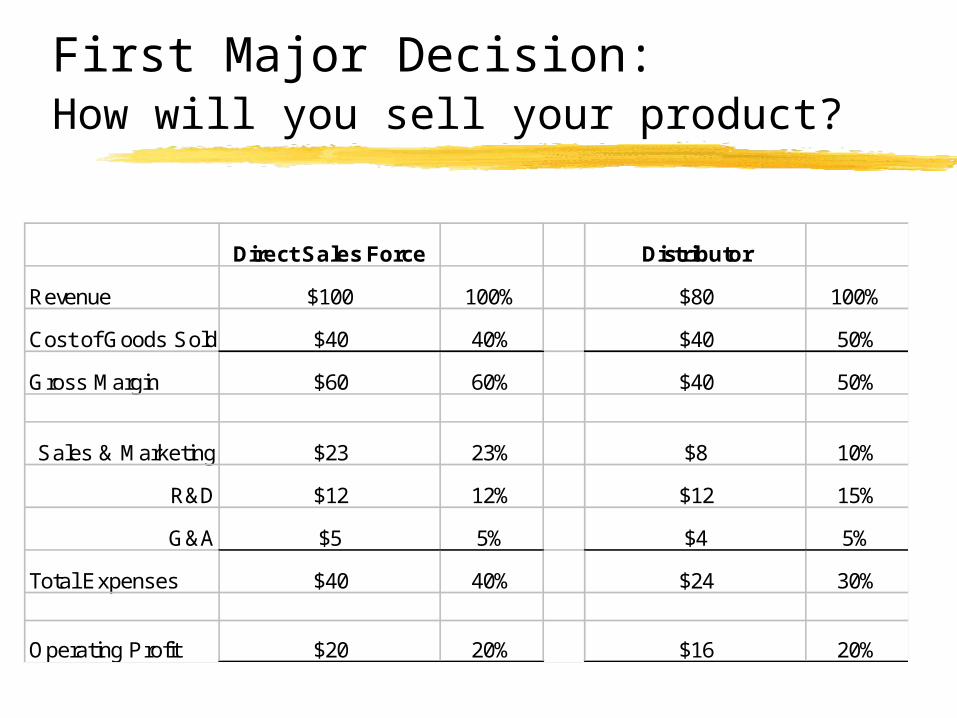
First Major Decision:How will you sell your product?
Direct Sales Force Distributor
Revenue $100 100% $80 100%
Cost of Goods Sold $40 40% $40 50%
Gross Margin $60 60% $40 50%
Sales & Marketing $23 23% $8 10%
R&D $12 12% $12 15%
G&A $5 5% $4 5%
Total Expenses $40 40% $24 30%
Operating Profit $20 20% $16 20%

Building Your Financial ProjectionsRules-of-Thumb for knowledge-based companies
• Average employee salary will be $70K to $80K
• Employee benefits will add 15%
• Initially, salaries will be 60% to 75% of non-COGS expense• Remainder will be rent, utilities, supplies, phones, travel
• UNLESS you have extraordinary marketing!!!• Will reduce to 50% to 55% over time
• If you know your staffing plan, you can make a good
estimate of each department’s expenses
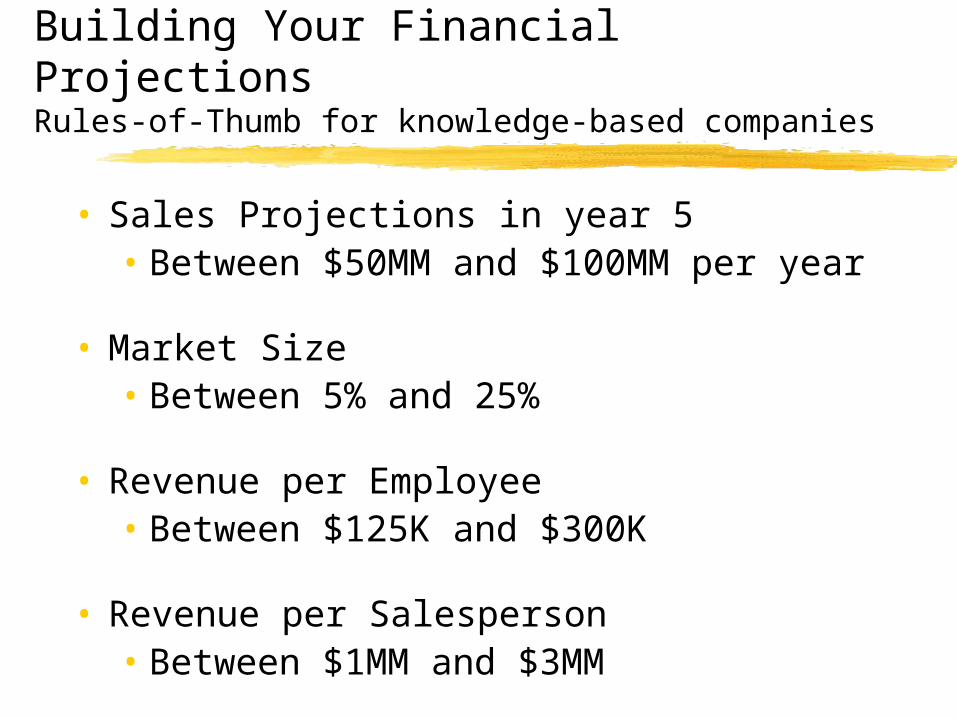
Building Your Financial ProjectionsRules-of-Thumb for knowledge-based companies
• Sales Projections in year 5• Between $50MM and $100MM per year
• Market Size• Between 5% and 25%
• Revenue per Employee• Between $125K and $300K
• Revenue per Salesperson• Between $1MM and $3MM

Cash Flow Projections Happiness is a positive cash flow
• Burn Rate• Your monthly operating loss plus capital expenditures
• Cash Flow Projection• Cumulative operating losses excluding depreciation• Plus cumulative capital expenses
• To determine the total cash required • Generally you look at your cumulative operating losses
plus cumulative capital expenses as of the month that you reach breakeven

VC Observations
• VCs don’t expect you to spend you own money BUT they expect you to spend money as though it were your own
• VCs don’t want their entrepreneurs to starve BUT they want them to be hungry

Financial DataPresentation Suggestions
• Steady, consistent revenue growth• No hockey sticks
• Steady, consistent evolution of your model
• Show % next to quarterly & yearly columns
• Show pre-tax only
• Don’t allocate G&A expenses
• Show depreciation expenses on a separate line
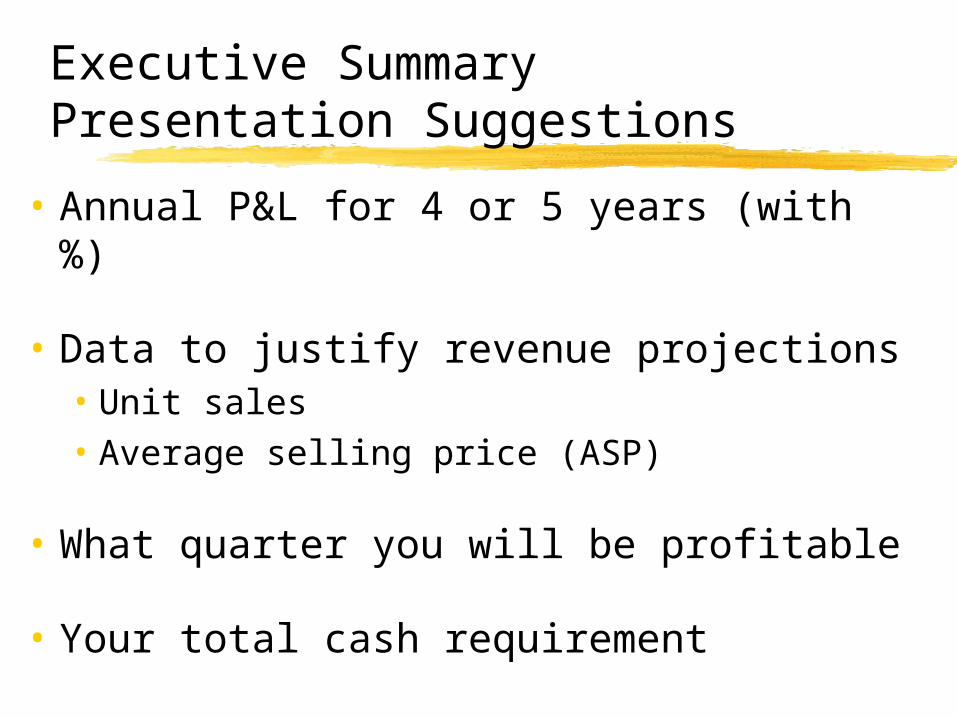
Executive SummaryPresentation Suggestions
• Annual P&L for 4 or 5 years (with %)
• Data to justify revenue projections• Unit sales• Average selling price (ASP)
• What quarter you will be profitable
• Your total cash requirement

Full Business PlanPresentation Suggestions
• Page 1: Annual P&L for 4 years
• Page 2 & 3: Quarterly P&L for all 4 years
• Page 4: Quarterly Staffing plan for 4 years
• Page 5: Quarterly cash flow for 4 years

End Result - Profit and Loss Statement
P & L by Year
Source Year 1 Year 2 Year 3 Year 4
Revenue
Model 1 P&L By Qtr 1,275,000$ 100% 10,500,000$ 88% 33,750,000$ 82% 37,500,000$ 50%
Model 2 P&L By Qtr -$ 0% 1,400,000$ 12% 5,250,000$ 13% 27,500,000$ 36%
Model 3 P&L By Qtr -$ 0% -$ 0% 2,400,000$ 6% 10,500,000$ 14%
Total Revenue 1,275,000$ 100% 11,900,000$ 100% 41,400,000$ 100% 75,500,000$ 100%
COGS P&L By Qtr 425,000$ 33% 3,920,000$ 33% 13,385,000$ 32% 23,200,000$ 31%
Gross Margin 850,000$ 67% 7,980,000$ 67% 28,015,000$ 68% 52,300,000$ 69%
Expenses
Engineering P&L By Qtr 1,326,625$ 104% 3,475,275$ 29% 7,212,188$ 17% 12,205,975$ 16%
Marketing P&L By Qtr 710,750$ 56% 1,810,750$ 15% 3,239,350$ 8% 5,300,000$ 7%
Sales P&L By Qtr 1,214,250$ 95% 3,466,500$ 29% 7,171,500$ 17% 12,393,500$ 16%
G&A P&L By Qtr 964,575$ 76% 1,817,750$ 15% 3,117,000$ 8% 5,308,500$ 7%
Operating Exp. 4,216,200$ 331% 10,570,275$ 89% 20,740,038$ 50% 35,207,975$ 47%
Operating Profit (3,366,200)$ -264% (2,590,275)$ -22% 7,274,963$ 18% 17,092,025$ 23%
Depreciation P&L By Qtr 144,833$ 427,333$ 593,000$ 608,167$
EBIT (3,511,033)$ (3,017,608)$ 6,681,963$ 16,483,858$
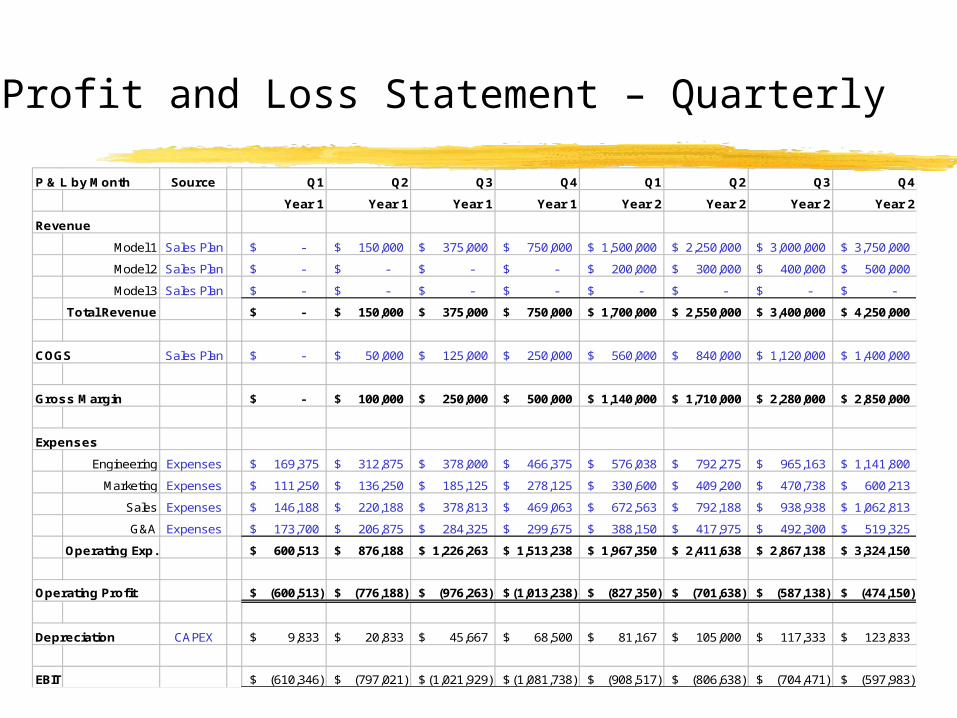
Profit and Loss Statement – Quarterly
P & L by Month Source Q1 Q2 Q3 Q4 Q1 Q2 Q3 Q4
Year 1 Year 1 Year 1 Year 1 Year 2 Year 2 Year 2 Year 2
Revenue
Model 1 Sales Plan -$ 150,000$ 375,000$ 750,000$ 1,500,000$ 2,250,000$ 3,000,000$ 3,750,000$
Model 2 Sales Plan -$ -$ -$ -$ 200,000$ 300,000$ 400,000$ 500,000$
Model 3 Sales Plan -$ -$ -$ -$ -$ -$ -$ -$
Total Revenue -$ 150,000$ 375,000$ 750,000$ 1,700,000$ 2,550,000$ 3,400,000$ 4,250,000$
COGS Sales Plan -$ 50,000$ 125,000$ 250,000$ 560,000$ 840,000$ 1,120,000$ 1,400,000$
Gross Margin -$ 100,000$ 250,000$ 500,000$ 1,140,000$ 1,710,000$ 2,280,000$ 2,850,000$
Expenses
Engineering Expenses 169,375$ 312,875$ 378,000$ 466,375$ 576,038$ 792,275$ 965,163$ 1,141,800$
Marketing Expenses 111,250$ 136,250$ 185,125$ 278,125$ 330,600$ 409,200$ 470,738$ 600,213$
Sales Expenses 146,188$ 220,188$ 378,813$ 469,063$ 672,563$ 792,188$ 938,938$ 1,062,813$
G&A Expenses 173,700$ 206,875$ 284,325$ 299,675$ 388,150$ 417,975$ 492,300$ 519,325$
Operating Exp. 600,513$ 876,188$ 1,226,263$ 1,513,238$ 1,967,350$ 2,411,638$ 2,867,138$ 3,324,150$
Operating Profit (600,513)$ (776,188)$ (976,263)$ (1,013,238)$ (827,350)$ (701,638)$ (587,138)$ (474,150)$
Depreciation CAPEX 9,833$ 20,833$ 45,667$ 68,500$ 81,167$ 105,000$ 117,333$ 123,833$
EBIT (610,346)$ (797,021)$ (1,021,929)$ (1,081,738)$ (908,517)$ (806,638)$ (704,471)$ (597,983)$

Sales and COGS Forecast
Sales Plan Source Q1 Q2 Q3 Q4 Q1 Q2 Q3 Q4
Year 1 Year 1 Year 1 Year 1 Year 2 Year 2 Year 2 Year 2
Unit Sales
Model 1 Input - 20 50 100 200 300 400 500
Model 2 Input - - - - 20 30 40 50
Model 3 Input - - - - - - - -
Total Units - 20 50 100 220 330 440 550
Revenue
Model 1 7,500$ -$ 150,000$ 375,000$ 750,000$ 1,500,000$ 2,250,000$ 3,000,000$ 3,750,000$
Model 2 10,000$ -$ -$ -$ -$ 200,000$ 300,000$ 400,000$ 500,000$
Model 3 15,000$ -$ -$ -$ -$ -$ -$ -$ -$
Total Revenue -$ 150,000$ 375,000$ 750,000$ 1,700,000$ 2,550,000$ 3,400,000$ 4,250,000$
Cost of Goods Sold
Model 1 2,500$ -$ 50,000$ 125,000$ 250,000$ 500,000$ 750,000$ 1,000,000$ 1,250,000$
Model 2 3,000$ -$ -$ -$ -$ 60,000$ 90,000$ 120,000$ 150,000$
Model 3 3,500$ -$ -$ -$ -$ -$ -$ -$ -$
Total COGS To P&L -$ 50,000$ 125,000$ 250,000$ 560,000$ 840,000$ 1,120,000$ 1,400,000$

Staffing Plan
Staffing Plan Staffing Staffing Staffing Staffing Staffing Staffing Staffing Staffing
Q1 Q2 Q3 Q4 Q1 Q2 Q3 Q4
Year 1 Year 1 Year 1 Year 1 Year 2 Year 2 Year 2 Year 2
Engineering
CTO Input 1 1 1 1 1 1 1 1
Programmer Input 4 8 10 12 15 20 25 30
Tech Writer Input - 1 1 2 2 4 4 4
Other Input - - - - - - - -
Total Eng 5 10 12 15 18 25 30 35
Marketing
VP Marketing Input 1 1 1 1 1 1 1 1
Product Manager Input 1 1 2 2 3 3 4 4
Mar-Com Input - - 1 1 2 2 2 2
Other Input 1 1 1 2 2 2 3 3
Total Mktg 3 3 5 6 8 8 10 10

Salary Expenses
Staffing Plan Annual Expense Expense Expense Expense Expense Expense Expense Expense
Salary Q1 Q2 Q3 Q4 Q1 Q2 Q3 Q4
Year 1 Year 1 Year 1 Year 1 Year 2 Year 2 Year 2 Year 2
Benefits/COLA -> 115% 115% 115% 115% 117% 119% 121% 123%
Engineering
CTO Input 150,000$ 43,125$ 43,125$ 43,125$ 43,125$ 43,875$ 44,625$ 45,375$ 46,125$
Programmer Input 75,000$ 86,250$ 172,500$ 215,625$ 258,750$ 329,063$ 446,250$ 567,188$ 691,875$
Tech Writer Input 60,000$ -$ 17,250$ 17,250$ 34,500$ 35,100$ 71,400$ 72,600$ 73,800$
Other Input 80,000$ -$ -$ -$ -$ -$ -$ -$ -$
Total Eng To Dept Exp 129,375$ 232,875$ 276,000$ 336,375$ 408,038$ 562,275$ 685,163$ 811,800$
Marketing
VP Marketing Input 125,000$ 35,938$ 35,938$ 35,938$ 35,938$ 36,563$ 37,188$ 37,813$ 38,438$
Product Manager Input 95,000$ 27,313$ 27,313$ 54,625$ 54,625$ 83,363$ 84,788$ 114,950$ 116,850$
Mar-Com Input 75,000$ -$ -$ 21,563$ 21,563$ 43,875$ 44,625$ 45,375$ 46,125$
Other Input 80,000$ 23,000$ 23,000$ 23,000$ 46,000$ 46,800$ 47,600$ 72,600$ 73,800$
Total Mktg To Dept Exp 86,250$ 86,250$ 135,125$ 158,125$ 210,600$ 214,200$ 270,738$ 275,213$
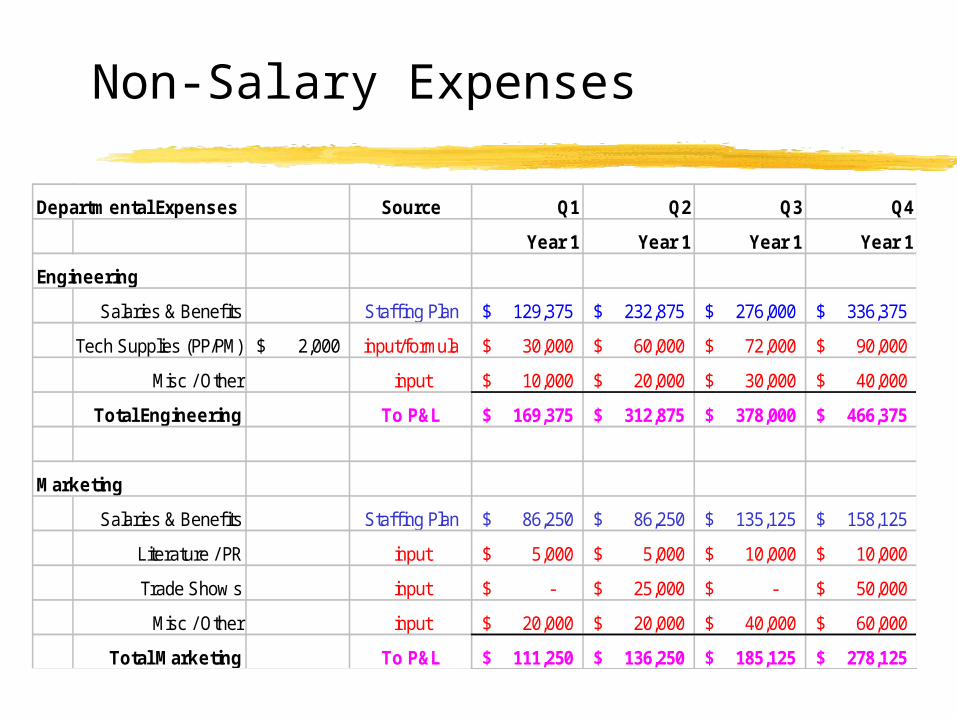
Non-Salary Expenses
Departmental Expenses Source Q1 Q2 Q3 Q4
Year 1 Year 1 Year 1 Year 1
Engineering
Salaries & Benefits Staff ing Plan 129,375$ 232,875$ 276,000$ 336,375$
Tech Supplies (PP/PM) 2,000$ input/formula 30,000$ 60,000$ 72,000$ 90,000$
Misc / Other input 10,000$ 20,000$ 30,000$ 40,000$
Total Engineering To P&L 169,375$ 312,875$ 378,000$ 466,375$
Marketing
Salaries & Benefits Staff ing Plan 86,250$ 86,250$ 135,125$ 158,125$
Literature / PR input 5,000$ 5,000$ 10,000$ 10,000$
Trade Show s input -$ 25,000$ -$ 50,000$
Misc / Other input 20,000$ 20,000$ 40,000$ 60,000$
Total Marketing To P&L 111,250$ 136,250$ 185,125$ 278,125$
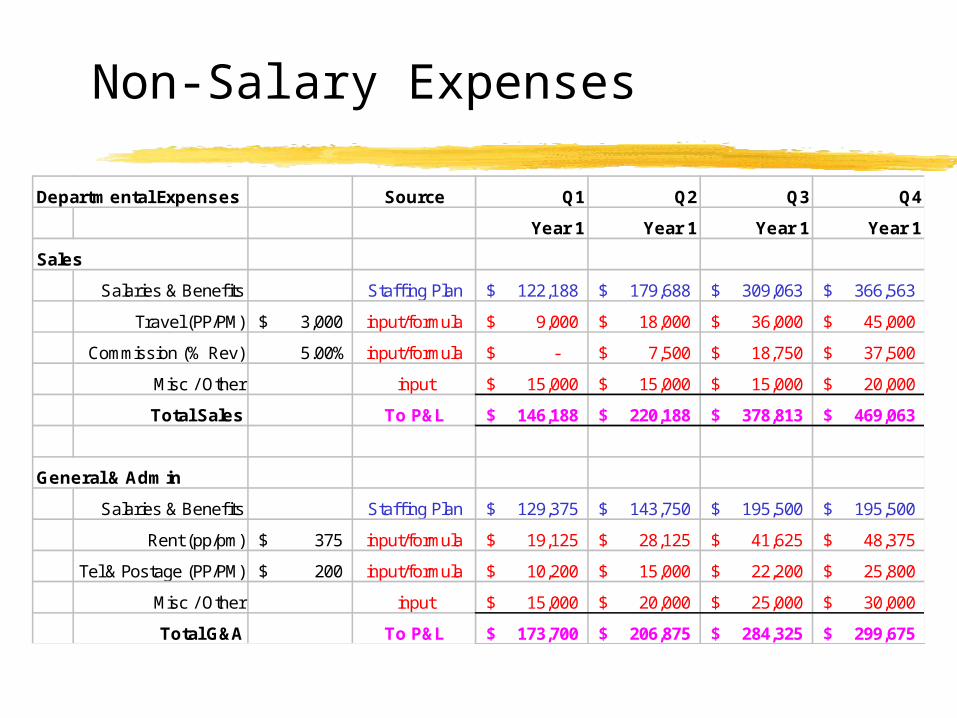
Non-Salary Expenses
Departmental Expenses Source Q1 Q2 Q3 Q4
Year 1 Year 1 Year 1 Year 1
Sales
Salaries & Benefits Staff ing Plan 122,188$ 179,688$ 309,063$ 366,563$
Travel (PP/PM) 3,000$ input/formula 9,000$ 18,000$ 36,000$ 45,000$
Commission (% Rev) 5.00% input/formula -$ 7,500$ 18,750$ 37,500$
Misc / Other input 15,000$ 15,000$ 15,000$ 20,000$
Total Sales To P&L 146,188$ 220,188$ 378,813$ 469,063$
General & Admin
Salaries & Benefits Staff ing Plan 129,375$ 143,750$ 195,500$ 195,500$
Rent (pp/pm) 375$ input/formula 19,125$ 28,125$ 41,625$ 48,375$
Tel & Postage (PP/PM) 200$ input/formula 10,200$ 15,000$ 22,200$ 25,800$
Misc / Other input 15,000$ 20,000$ 25,000$ 30,000$
Total G&A To P&L 173,700$ 206,875$ 284,325$ 299,675$

Profit and Loss Statement - Quarterly
P & L by Month Source Q1 Q2 Q3 Q4 Q1 Q2 Q3 Q4
Year 1 Year 1 Year 1 Year 1 Year 2 Year 2 Year 2 Year 2
Revenue
Model 1 Sales Plan -$ 150,000$ 375,000$ 750,000$ 1,500,000$ 2,250,000$ 3,000,000$ 3,750,000$
Model 2 Sales Plan -$ -$ -$ -$ 200,000$ 300,000$ 400,000$ 500,000$
Model 3 Sales Plan -$ -$ -$ -$ -$ -$ -$ -$
Total Revenue -$ 150,000$ 375,000$ 750,000$ 1,700,000$ 2,550,000$ 3,400,000$ 4,250,000$
COGS Sales Plan -$ 50,000$ 125,000$ 250,000$ 560,000$ 840,000$ 1,120,000$ 1,400,000$
Gross Margin -$ 100,000$ 250,000$ 500,000$ 1,140,000$ 1,710,000$ 2,280,000$ 2,850,000$
Expenses
Engineering Expenses 169,375$ 312,875$ 378,000$ 466,375$ 576,038$ 792,275$ 965,163$ 1,141,800$
Marketing Expenses 111,250$ 136,250$ 185,125$ 278,125$ 330,600$ 409,200$ 470,738$ 600,213$
Sales Expenses 146,188$ 220,188$ 378,813$ 469,063$ 672,563$ 792,188$ 938,938$ 1,062,813$
G&A Expenses 173,700$ 206,875$ 284,325$ 299,675$ 388,150$ 417,975$ 492,300$ 519,325$
Operating Exp. 600,513$ 876,188$ 1,226,263$ 1,513,238$ 1,967,350$ 2,411,638$ 2,867,138$ 3,324,150$
Operating Profit (600,513)$ (776,188)$ (976,263)$ (1,013,238)$ (827,350)$ (701,638)$ (587,138)$ (474,150)$
Depreciation CAPEX 9,833$ 20,833$ 45,667$ 68,500$ 81,167$ 105,000$ 117,333$ 123,833$
EBIT (610,346)$ (797,021)$ (1,021,929)$ (1,081,738)$ (908,517)$ (806,638)$ (704,471)$ (597,983)$

CAPEX & Cash Flow Projection
Cash Flow Source Q1 Q2 Q3 Q4
Year 1 Year 1 Year 1 Year 1
Beginning Cash Input (Beginning only) -$ 4,281,488$ 3,273,300$ 1,849,038$
Gross Margin From P&L Quarterly -$ -$ 100,000$ 250,000$
Expenses From P&L Quarterly (600,513)$ (876,188)$ (1,226,263)$ (1,513,238)$
Investment Input 5,000,000$ -$ -$ -$
Capital Expense From P&L CAPEX (118,000)$ (132,000)$ (298,000)$ (274,000)$
Change in Cash 4,281,488$ (1,008,188)$ (1,424,263)$ (1,537,238)$
Ending Balance 4,281,488$ 3,273,300$ 1,849,038$ 311,800$
Capital Expenses Q1 Q2 Q3 Q4
Year 1 Year 1 Year 1 Year 1
Employee Workstations (PP) 4,000$ 68,000$ 32,000$ 48,000$ 24,000$
Prototype Expenses Input 50,000$ 100,000$ 250,000$ 250,000$
118,000$ 132,000$ 298,000$ 274,000$
Cumulative CAPEX 118,000$ 250,000$ 548,000$ 822,000$
Depreciation
Depreciation Charge 9,833$ 20,833$ 45,667$ 68,500$

Real World Expenses
• See $50K Web Site for more detail

PART 2 - Dividing the Pie
• Address two fundamental questions:How much of my company should the VCs get?How much of my company should employees
get?
• “The Formula”• Conceptual Framework for Stock Ownership• Some Real-World Examples & Advice

Valuation – “The Formula”VC % = VC$ / (pre-money + VC$)
VC Ownership % assumes only 1 round of financing
Example 1 Example 2 Example 3 Example 4
Pre-Money ($MM) 10$ 10$ 15$ 15$ plus Investment ($MM) 5$ 10$ 5$ 10$
equals Post-Money ($MM) 15$ 20$ 20$ 25$
Investment ($MM) 5$ 10$ 5$ 10$
divided by Post-Money ($MM) 15$ 20$ 20$ 25$
equals VC Ownership (see note below) 33% 50% 25% 40%
Founder's Shares in MM 1.00 1.00 1.00 1.00 Newly Issued VC Shares in MM 0.50 1.00 0.33 0.67
Total Shares in MM 1.50 2.00 1.33 1.67

YourCompany.COM
Let’s assume a pre-money value of $10MM
Stage 1 - Before any funding (pre-money)
Founder
VC
Employees

YourCompany.COM
Stage 2 – Assume $10MM raised at a $10MM pre-money valuation would yield a post-money valuation of $20MM)
The WRONG* way to look at it:
Founder
VC
Employees
* WRONG because the post-money pie is shown as the same size as the pre-money pie

YourCompany.COM
Stage 2 – Same example
The RIGHT way to look at it
Founder
VC
Employees
Founder
VC
Employees
Original Company ($10MM Pre-Money) $10MM Cash in Bank (Money)

YourCompany.COM
Pie represents both “original company” and new cash
Founder
VC
Employees
Stage 2 – Same exampleCombine the two and the “post-money” pie is twice as large

YourCompany.COM
Think of issuing stock to employees in the same way
Stage 2 – Another way to look at the same example.Your holdings are the same but the company is twice as large
VC
Founder
Employees

Raising money in stages
All at once Round 1 Round 2
Pre-Money 5 5 16plus Investment 5 3 4
equals Post-Money 10 8 20
Investment 5 3 4divided by Post-Money 10 8 20
equals Dilution 50% 38% 20%
Your Shares 100 50% 100 63% 100 50%VC Shares - Round 1 100 50% 60 38% 60 30%VC Shares - Round 2 40 20%
Total Shares 200 100% 160 100% 200 100%
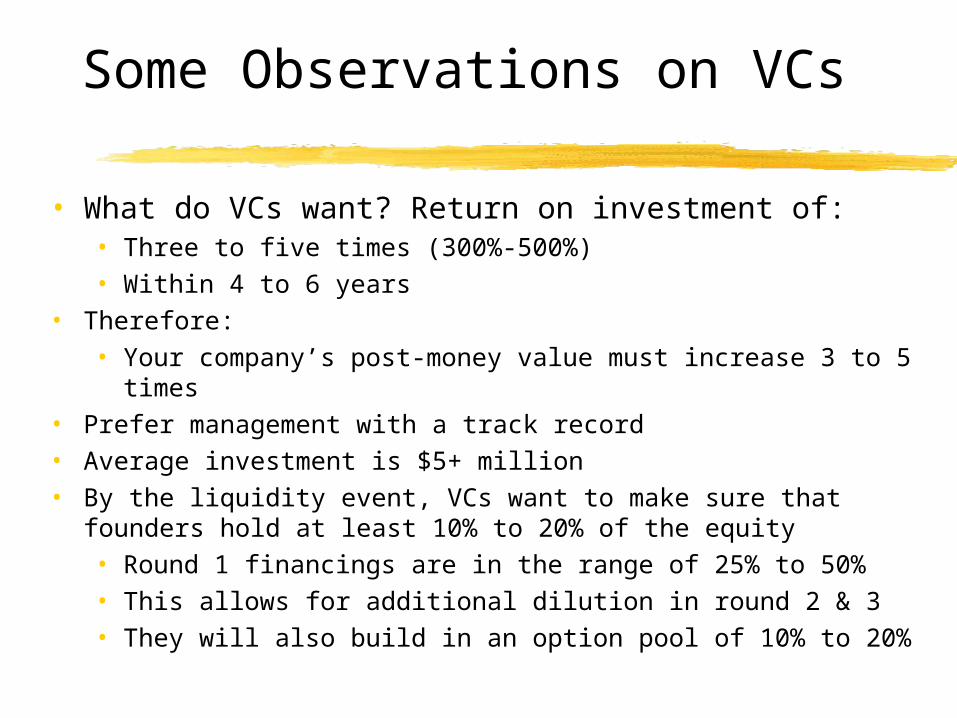
Some Observations on VCs
• What do VCs want? Return on investment of:• Three to five times (300%-500%)• Within 4 to 6 years
• Therefore: • Your company’s post-money value must increase 3 to 5
times• Prefer management with a track record• Average investment is $5+ million• By the liquidity event, VCs want to make sure that founders
hold at least 10% to 20% of the equity• Round 1 financings are in the range of 25% to 50% • This allows for additional dilution in round 2 & 3• They will also build in an option pool of 10% to 20%

Employee Equity – Real World Examples
• Create the right number of shares – 10MM to 20MM• Equity by Position – very general guidelines
CEO – 5% to 10%Other VPs – 1% to 2.5%First Level Managers - .2% to .3%Scale down other levels of employees from hereSlight premium for technical hires
• Early stage companies may have to exceed these guidelines
• 4 year vesting, 25% after 1 year then 6.25% per quarter

VC Funding Recommendations
• Create more VC interest to increase the valuation• Research VC Firms. Approach one appropriate
for:• Your business stage• Your business size• Your industry
• There’s more than valuation: • Advice & council• How will they react when things go bad?

Random Advice
• Build a GREAT team• Technology, Marketing. Sales, Finance
• Get a good lawyer before you:• Negotiate with VCs• Grant stock or options
• A Big-5 accountant adds to your credibility• Write this down – Section 83(b) of IRS tax code• Build relationships with investment community (VCs
& investment bankers) BEFORE you need them