
Building Energy Demand Based on Urban Morphology Analysis ...
7
HAL Id: hal-02157255 https://hal.insa-toulouse.fr/hal-02157255 Submitted on 15 Jun 2019 HAL is a multi-disciplinary open access archive for the deposit and dissemination of sci- entific research documents, whether they are pub- lished or not. The documents may come from teaching and research institutions in France or abroad, or from public or private research centers. L’archive ouverte pluridisciplinaire HAL, est destinée au dépôt et à la diffusion de documents scientifiques de niveau recherche, publiés ou non, émanant des établissements d’enseignement et de recherche français ou étrangers, des laboratoires publics ou privés. Building Energy Demand Based on Urban Morphology Analysis: Case Study in Maceió, Brazil Tathiane Martins, Luc Adolphe, Marion Bonhomme To cite this version: Tathiane Martins, Luc Adolphe, Marion Bonhomme. Building Energy Demand Based on Urban Morphology Analysis: Case Study in Maceió, Brazil. 29ème conférence PLEA (Passive Low Energy Architecture), Oct 2013, Munich, Germany. pp.10 - 12. hal-02157255
Transcript of Building Energy Demand Based on Urban Morphology Analysis ...

HAL Id: hal-02157255https://hal.insa-toulouse.fr/hal-02157255
Submitted on 15 Jun 2019
HAL is a multi-disciplinary open accessarchive for the deposit and dissemination of sci-entific research documents, whether they are pub-lished or not. The documents may come fromteaching and research institutions in France orabroad, or from public or private research centers.
L’archive ouverte pluridisciplinaire HAL, estdestinée au dépôt et à la diffusion de documentsscientifiques de niveau recherche, publiés ou non,émanant des établissements d’enseignement et derecherche français ou étrangers, des laboratoirespublics ou privés.
Building Energy Demand Based on Urban MorphologyAnalysis: Case Study in Maceió, BrazilTathiane Martins, Luc Adolphe, Marion Bonhomme
To cite this version:Tathiane Martins, Luc Adolphe, Marion Bonhomme. Building Energy Demand Based on UrbanMorphology Analysis: Case Study in Maceió, Brazil. 29ème conférence PLEA (Passive Low EnergyArchitecture), Oct 2013, Munich, Germany. pp.10 - 12. �hal-02157255�

PLEA2013 - 29th Conference, Sustainable Architecture for a Renewable Future, Munich, Germany 10-12 September 2013
Building Energy Demand Based on Urban Morphology
Analysis: Case Study in Maceió, Brazil
TATHIANE MARTINS1,2, LUC ADOLPHE
1, MARION BONHOMME
1
1LRA, Ecole Nationale Superieure d’Architecture, Toulouse, France
2FAU/PROARQ, Universidade Federal do Rio de Janeiro, Rio de Janeiro, Brazil
ABSTRACT: This study presents a morphological study to assist in the prediction of energy demand of buildings in the
context of a Brazilian city. Different parameters have been applied in the analysis of urban geometry in order to
realize a cartography of morphologically homogeneous areas, each one presenting a different influence on the energy
demand of buildings. As a first methodological step, the morphological parameters were automated and calculated in
a Geographical Information System software, ArcMAP/ArcGIS®. The morphological results obtained for a case study
in Maceió, Brazil, were analysed using Principal Components Analysis (PCA), from which it was possible to identify
the significance of the parameters to the urban context. Through a Clustering Analysis, different typological
configurations were grouped, classified and, then, submitted to computational simulations for energy demand
analysis. Six morphological indicators were retained and five representative typological classes of the urban fabric
for the Brazilian city were highlighted. A major impact of three main morphological parameters was verified: total
built density, verticality, compactness and the mean aspect.
Keywords: urban form, morphological indicators, buildings energy efficiency
INTRODUCTION
The dynamic process of urbanization affects the natural
and built systems in several scales, source of important
changes in local climate and, consequently, in the
energy demand of buildings. In Brazil, the rapid process
of urbanization did not follow an effective planning. The
lack of public policies that works towards the regulation
and control of land use and urban construction, has led
cities to reproduce low-quality environmental urban
models. However, in recent times, local efforts have
been employed towards the elaboration of a set of
environmental criteria to regulate energy efficiency
applied to buildings [1]. Nevertheless, these energy
policies have been mostly devoted to the individual
building scale, since the potential of action in this scale
seems more feasible. The urban scale approach toward
the integration of energy in the local urban planning and
design has not yet been largely studied nor effectively
applied. The difficulty may be found in several aspects.
Among others: (a) the lack of more detailed quantitative
studies about the impact of urban morphology on local
climate, as well as the effects of microclimate on the
energy demand of urban buildings; (b) the absence of
more accurate mathematical models that address the
complex physical phenomena in multiple scales in
tropical climate; and (c) the lack of prospective studies
on the evolution of local urban form. One possible
approach for this problematic could be the development
of simplified tools based on relatively complex energy
studies towards the regulation of urban land. Tools
based on urban indicators/parameters that could
characterize appropriately each particular context
towards the qualification of environmental quality of
urban built spaces.
In the past two decades, significant progress has
been made on an attempt to measure and analyse spatial
patterns that could support characterizing the urban
form. Although the implementation of several spatial
metrics may present itself as one of the main potential
methodologies on the characterization of urban form,
only recently these indicators have been used more
systematically towards the energy problematic [2, 3, 4].
Each set of metrics or indicators may vary depending on
the objective(s) and the scale of study. At first, these
spatial metrics system would allow allocating different
existing urban fabrics and highlighting common traits
between them, establishing typologies based on a
particular objective. It can also perform as a set of
decision support tools that may be very useful for
planners, since they are often intuitive and easy-to-use
[4]. In addition, empirical studies have demonstrated the
use of remote sensing and spatial metrics in the urban
environment as a priority in the research of cities [5, 6].
This paper presents an urban morphological study to
assist in the prediction and discussion of energy demand
of buildings in the context of a Brazilian city.
METHOD
Three main methodological steps were applied:

a. Analysis of urban vector GIS data of the case study
city and calculation of urban morphology
indicators carried out with ArcMAP/ArcGIS®;
b. Statistical data treatment through Principal
Components and Clustering Analysis for
identification, classification and mapping of local
urban archetypal structures;
c. Building energy prediction of the classified urban
structures.
GIS, urban scale and morphological indicators
For application of the proposed method a case study was
conducted in the city of Maceió, Alagoas, in the tropical
climate context of Brazil.
In this first methodological step, GIS urban vector
data of the city of Maceió - provided by the Urban
Planning Department of the State of Alagoas
(SEPLANDE) – were treated through the GIS, ArcGIS®
where calculation routines were also created applying
many of its geoprocessing tools and techniques that
allowed automating the calculation of the energy-related
morphological indicators for any urban vector dataset.
In order to perform the characterization of urban
homogeneous areas, two different calculation mesh
resolutions were initially considered (500 m x 500 m
and 250 m x 250 m). As the scaling of a mesh involves
cutting urban objects (streets, buildings), this crop can
be critical, depending on the characteristics of the urban
fabric. The cells of the mesh should not be too small, not
to represent just a reduced fragment less representative
of the urban fabric, and also not way too large,
comprising too many different structures. To define the
most appropriate mesh resolution for the case of Maceió,
statistical studies were performed to analyse the
predominance of the elements inside the two spatial
resolutions considered. The results obtained led us
choosing the 500m meshes, which holds 694 evaluation
cells. The standard deviation and the resulting averages
for some of the selected parameters (for this preliminary
assessment) indicated better matching for the larger
spatial resolution.
For the definition of the morphological parameters,
we applied the methodology developed by Adolphe [2].
The author's proposal came from a simplified spatial
modelling of the urban morphology, resulting in the
definition of a set of environmental performance
indicators for the urban fabric, among others: roughness,
porosity, compactness, contiguity, mean aspect. In
addition to those, we also considered in this study the
well known: Plot Ratio (PR), Floor Area Ratio (FAR)
and Built Density. The absolute roughness factor is the
mean height of urban canopy given by the product of the
height of buildings by their area, and divided by the total
(built and non built) area [2].
The porosity factor is characterised by the ratio of the
useful open volume to the total volume of the urban
fabric. The compactness factor is defined by the ratio of
the non-contiguous building envelope by their built
volume, over an urban fabric. And the contiguity of an
ensemble of urban buildings is characterized by the ratio
of their total vertical surface adjacent with other
building envelopes by the total envelope surface that is
exposed to the outside environment. The climatic and
morphological hypotheses, methodological procedures
of development of this system of indicators as well as
their full description can be found in Adolphe et al. [7].
Statistical treatment
Initially, the wide range of morphological parameters
selected was thrown in the calculation routines in order
to complete a Principal Component Analysis (PCA).
PCA is a statistical analysis that can be used to evaluate
the interrelationships among a large number of
variables, in order to compile the information that is
represented by them on a smaller set of statistical
variables, with minimal loss of information. The use of
this technique of multivariate analysis aims to minimize
redundancies that may exist, enabling greater variability
of the data capture in a few components, making it
easier for the mapping of information [8]. Secondly, a
clustering analysis was also performed. This non-
parametric statistical method aims to identify and group
objects by similarity, regarding a set of particular
attributes and allowing the identification of behaviour
pattern. The k-means clustering algorithm, chosen as the
most appropriate technique for this application, consists
of choosing an initial partition of the data, and then
modifying the members of classes in order to obtain a
new partition which presents best the natural structure of
the initial data. The mean K point (average of each
attribute) elements are then assigned to the class whose
centre is the nearest [9].
It should be noted that the typological classes used in
this work are purely morphological and independent of
their uses.
Urban buildings energy simulation
Dynamic simulation of the energy performance of the
built urban environment was performed using the
CitySim code, developed by the laboratory LESO-PB
from the Federal Polytechnic School of Lausanne-
Switzerland. CitySim proposes coupled models for
dynamic simulation of the energy balance of buildings
and optimization of urban resource flow [10]. The code
comprises a simplified thermal model that consists of
refined version of the model of analogy to electric
circuit due to Nielsen [11], more specifically based on
resistor-capacitor network [10]. For prediction of
radiation balance in the urban context as well as indoor
and outdoors daylight, the code integrates a Simplified

Radiosity Algorithm (SRA) of Robinson and Stone [12].
Further detailed description of the whole model can be
found in Robinson [10]. CitySim input variables can be
added as climatic, geometric and thermophysical
specifications. To the climatic parameters, it was defined
a geographic location and generated a complete local
climatic year in hourly time step for Maceió. For the
geometry, it was considered a set of buildings in 3D, for
which it was sign up the complexity of the built form
(different heights, distances and orientations of the
buildings). The model also allows for the definition of
far field obstructions due to the topography of the urban
site. The glazing ratio, in the urban scale considered, is
introduced by assigning an opening fraction by facade.
For the thermophysical specifications (solar factor,
windows and walls U-value, shortwave reflectance,
etc.), the buildings features for each typological class of
Maceió were assigned by field-based survey. The
calculation performed for the energy balance of
buildings is based on the demand for air conditioning
and artificial lighting of the buildings indoor.
RESULTS
The results of the morphological analysis in ArcGIS®
were treated with XLStat application in Excel.
Initially it was analysed the correlation matrix between
the resulting morphological parameters, calculated for
the 694 mesh urban cells (Table 1). It can be seen that
the correlations are often quite strong between certain
variables, as highlighted in the light grey colour in the
table below. In order to avoid redundancy in the
information obtained, it was decided to keep only one of
the parameters of each pair where the correlation is
significant.
Table 1: correlation matrix with the initial parameters.
These high correlation values characterize the variables
dependency between each other, such as the weighted
average height and built volume (r = 0.51). Other
variables are complementary such as the built area and
porosity (r =-0.85).
The first PCA
The 14 initial parameters were analysed between them,
demonstrating, as shown in the charts below, the number
of indicators to be considered, corresponding to the first
turning point found on the curve [13] and the percentage
of accumulated variability, represented by the axes of
the factors, respectively (Fig. 1). This percentage, to be
valid in this approach, should be raised to the
relationship between the first two factors. And, as it can
be seen in this first PCA, due to the large number of
overlapping information, this percentage is relatively
low.
Figure 1: first PCA.
The Fig.1 above allows observing that some of the
studied variables are quite close to each other, in
particular: built density, average height, ratio (FAR), for
example. This way, one can simplify the PCA, keeping
at each time only one parameter, without significant loss
of information.
The second PCA
The parameters considered in the second PCA were:
porosity, roughness, average height, floor area ratio
(FAR), compactness and contiguity (Fig. 3).
Figure 2: second PCA.
The Fig. 3 allows seeing that the parameters do not
present themselves as close as before, allowing more
relevant observations. In addition, some of the
parameters may even vary perpendicularly and
conversely, which may guarantee the relevance of these
observations in the application. Analysing them by
pairs, that would be the case of the relationship between
contiguity and compactness and between the floor area
ratio and the porosity. This analysis served two main
objectives. On the one hand, it allowed understanding

the relationship of morphological parameters between
them and, on the other hand, making it possible to
extract from a large mass of information, the most
relevant data (without redundancies) for analysis and
classification of the morphological typologies of the
urban fabric of Maceió. For the clustering analysis of
the same data, five iterations with ten repetitions were
performed, converging to an intraclass and interclass
variance of 20.55 and 2.13 (Determinant=0.006),
respectively (Table 2).
Table 2- Summary of iteration performed clustering analysis. Class 1 2 3 4 5
Nb. objects 260 59 223 17 135
Variance intraclasse 0,712 1,023 4,110 16,266 4,236
Min. Distance to centroid 0,097 0,168 0,327 0,678 0,342
Avg. distance to centroid 0,775 0,897 1,308 3,554 1,822
Max. distance to centroid 1,649 2,746 17,612 7,867 4,344
The method allowed highlighting five main classes,
which can be easily identified by current urban
morphology descriptive terms (Table 3). These classes
will be briefly described and discussed in the following
section.
Table 3: Five morphological urban archetypal classes
according to seven principal components.
Classes
Average
weighted
height
Compac
tn
ess
Contiguity
Roughness
Floor area
ratio
(FAR)
Plot ratio
(PR)
Porosity
1 Sparsely built 4,22 4,75 0,07 0,10 0,08 0,08 0,97
2 Open-set mid-rise 9,11 5,18 0,02 0,25 0,88 0,22 0,96
3 Colonial compact centre 6,29 3,87 0,38 2,73 2,38 0,74 0,66
4 Modern high-rise 17,0 4,94 0,22 1,57 4,15 0,49 0,90
5 Densely built low-rise 5,15 3,66 0,03 1,71 0,75 0,56 0,70
Urban form cartography of Maceió
The map below represents the mapping of the
typological urban form classes of Maceió, obtained from
the analysis of the above-mentioned indicators (Fig. 10).
Figure 3:urban form cartography for Maceió-Brazil.
Class 1 – Sparsely built
Class 1 includes mainly the neighbourhoods on the
outskirts of the city, characterized predominantly by be
low-rise individual and scattered residential buildings.
This class represents 37% of the urban fabric of Maceió
and has a reduced floor area ratio (0.08). Its low-rise
buildings have an average height of 4.22m, and high
compactness (4.74).
Figure 4: Urban typology class 1 in Maceió (Author, 2012).
Class 2 – Open-set mid-rise
This morphological class covers 9% of the urban fabric
of the city. It presents, among others, the vertical
collective housing of up to 4 floors. This typology has
increasingly expanded in urban areas of Brazilian cities,
for medium and low-income population. The archetypal
found in this context consists mainly of vertical
buildings shaped like regular prisms, presenting mean
compactness of 5.18. These buildings may find
themselves trapped in the fabric and surrounded by
individual dwellings (more or less compact),
characterizing certain heterogeneity (Fig. 5). The
buildings have their average heights of 9.11m and the
distance between buildings more regular and smaller
compared to the previous class.
Figure 5: Urban typology class 2 in Maceió (Author, 2012).
Class 3 – Colonial compact centre
This urban morphological class represents 32% of the
urban area of Maceió and is mainly composed by
commercial buildings in the colonial downtown core
(Fig. 6). These areas are composed of buildings ranging
from 1 to 4 stories with average height of 6.30m. It
presents the smallest average of compactness (3.86)
amongst the other 4 typological classes. This means they
present great built volumes with very little envelope
areas exposed to the exterior. This way, they present
values for contiguity a lot more expressive. Most of its
buildings are set on the alignment of public streets and
presents its sidewalls straight on the limits of the
building plot without any setbacks. Consequently the
urban fabric found in this region presents low value of
porosity, which may affect negatively outdoors and
indoors air quality and as well as users thermal comfort.
Both the plot ratio and the floor area ratio are
expressively high (2.38 and 0.74, respectively).
Figure 6: Urban typology class 3 in Maceió (Author, 2012).
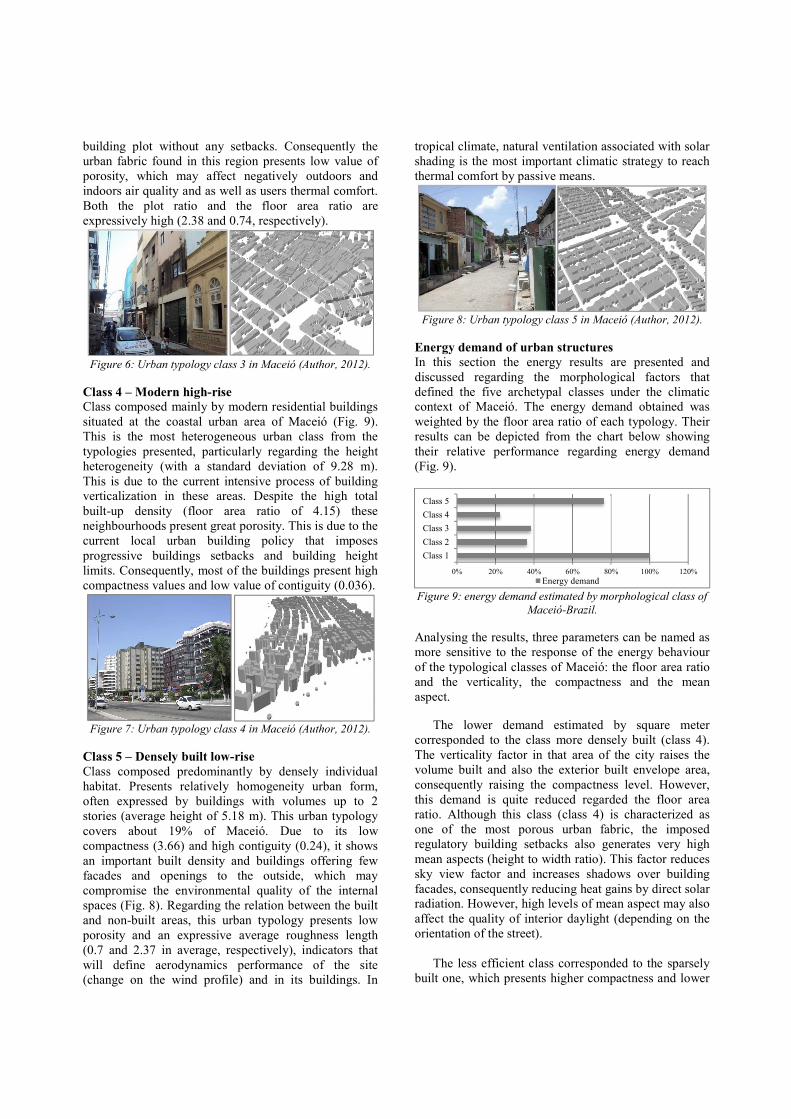
Class 4 – Modern high-rise
Class composed mainly by modern residential buildings
situated at the coastal urban area of Maceió (Fig. 9).
This is the most heterogeneous urban class from the
typologies presented, particularly regarding the height
heterogeneity (with a standard deviation of 9.28 m).
This is due to the current intensive process of building
verticalization in these areas. Despite the high total
built-up density (floor area ratio of 4.15) these
neighbourhoods present great porosity. This is due to the
current local urban building policy that imposes
progressive buildings setbacks and building height
limits. Consequently, most of the buildings present high
compactness values and low value of contiguity (0.036).
Figure 7: Urban typology class 4 in Maceió (Author, 2012).
Class 5 – Densely built low-rise
Class composed predominantly by densely individual
habitat. Presents relatively homogeneity urban form,
often expressed by buildings with volumes up to 2
stories (average height of 5.18 m). This urban typology
covers about 19% of Maceió. Due to its low
compactness (3.66) and high contiguity (0.24), it shows
an important built density and buildings offering few
facades and openings to the outside, which may
compromise the environmental quality of the internal
spaces (Fig. 8). Regarding the relation between the built
and non-built areas, this urban typology presents low
porosity and an expressive average roughness length
(0.7 and 2.37 in average, respectively), indicators that
will define aerodynamics performance of the site
(change on the wind profile) and in its buildings. In
tropical climate, natural ventilation associated with solar
shading is the most important climatic strategy to reach
thermal comfort by passive means.
Figure 8: Urban typology class 5 in Maceió (Author, 2012).
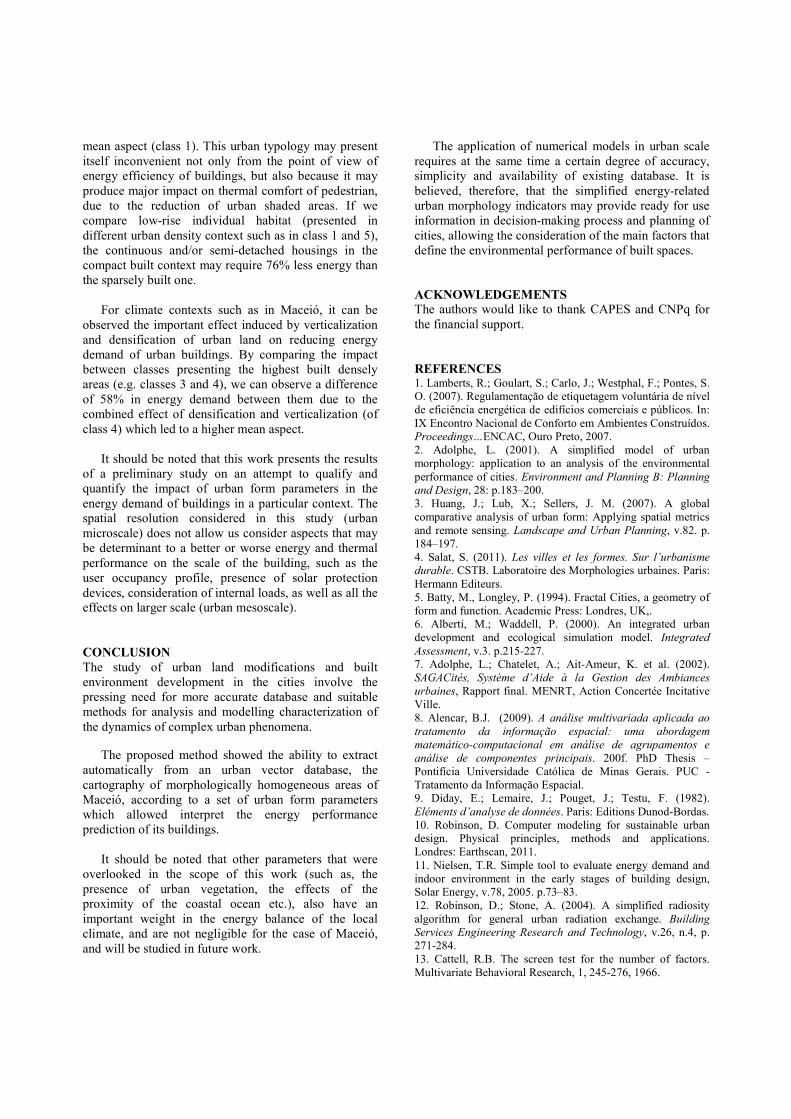
Energy demand of urban structures
In this section the energy results are presented and
discussed regarding the morphological factors that
defined the five archetypal classes under the climatic
context of Maceió. The energy demand obtained was
weighted by the floor area ratio of each typology. Their
results can be depicted from the chart below showing
their relative performance regarding energy demand
(Fig. 9).
Figure 9: energy demand estimated by morphological class of
Maceió-Brazil.
Analysing the results, three parameters can be named as
more sensitive to the response of the energy behaviour
of the typological classes of Maceió: the floor area ratio
and the verticality, the compactness and the mean
aspect.
The lower demand estimated by square meter
corresponded to the class more densely built (class 4).
The verticality factor in that area of the city raises the
volume built and also the exterior built envelope area,
consequently raising the compactness level. However,
this demand is quite reduced regarded the floor area
ratio. Although this class (class 4) is characterized as
one of the most porous urban fabric, the imposed
regulatory building setbacks also generates very high
mean aspects (height to width ratio). This factor reduces
sky view factor and increases shadows over building
facades, consequently reducing heat gains by direct solar
radiation. However, high levels of mean aspect may also
affect the quality of interior daylight (depending on the
orientation of the street).
The less efficient class corresponded to the sparsely
built one, which presents higher compactness and lower
0% 20% 40% 60% 80% 100% 120%
Class 1
Class 2
Class 3
Class 4
Class 5
Energy demand
mean aspect (class 1). This urban typology may present
itself inconvenient not only from the point of view of
energy efficiency of buildings, but also because it may
produce major impact on thermal comfort of pedestrian,
due to the reduction of urban shaded areas. If we
compare low-rise individual habitat (presented in
different urban density context such as in class 1 and 5),
the continuous and/or semi-detached housings in the
compact built context may require 76% less energy than
the sparsely built one.
For climate contexts such as in Maceió, it can be
observed the important effect induced by verticalization
and densification of urban land on reducing energy
demand of urban buildings. By comparing the impact
between classes presenting the highest built densely
areas (e.g. classes 3 and 4), we can observe a difference
of 58% in energy demand between them due to the
combined effect of densification and verticalization (of
class 4) which led to a higher mean aspect.
It should be noted that this work presents the results
of a preliminary study on an attempt to qualify and
quantify the impact of urban form parameters in the
energy demand of buildings in a particular context. The
spatial resolution considered in this study (urban
microscale) does not allow us consider aspects that may
be determinant to a better or worse energy and thermal
performance on the scale of the building, such as the
user occupancy profile, presence of solar protection
devices, consideration of internal loads, as well as all the
effects on larger scale (urban mesoscale).
CONCLUSION
The study of urban land modifications and built
environment development in the cities involve the
pressing need for more accurate database and suitable
methods for analysis and modelling characterization of
the dynamics of complex urban phenomena.
The proposed method showed the ability to extract
automatically from an urban vector database, the
cartography of morphologically homogeneous areas of
Maceió, according to a set of urban form parameters
which allowed interpret the energy performance
prediction of its buildings.
It should be noted that other parameters that were
overlooked in the scope of this work (such as, the
presence of urban vegetation, the effects of the
proximity of the coastal ocean etc.), also have an
important weight in the energy balance of the local
climate, and are not negligible for the case of Maceió,
and will be studied in future work.
The application of numerical models in urban scale
requires at the same time a certain degree of accuracy,
simplicity and availability of existing database. It is
believed, therefore, that the simplified energy-related
urban morphology indicators may provide ready for use
information in decision-making process and planning of
cities, allowing the consideration of the main factors that
define the environmental performance of built spaces.
ACKNOWLEDGEMENTS
The authors would like to thank CAPES and CNPq for
the financial support.
REFERENCES 1. Lamberts, R.; Goulart, S.; Carlo, J.; Westphal, F.; Pontes, S.
O. (2007). Regulamentação de etiquetagem voluntária de nível
de eficiência energética de edifícios comerciais e públicos. In:
IX Encontro Nacional de Conforto em Ambientes Construídos.
Proceedings…ENCAC, Ouro Preto, 2007.
2. Adolphe, L. (2001). A simplified model of urban
morphology: application to an analysis of the environmental
performance of cities. Environment and Planning B: Planning
and Design, 28: p.183–200.
3. Huang, J.; Lub, X.; Sellers, J. M. (2007). A global
comparative analysis of urban form: Applying spatial metrics
and remote sensing. Landscape and Urban Planning, v.82. p.
184–197.
4. Salat, S. (2011). Les villes et les formes. Sur l’urbanisme
durable. CSTB. Laboratoire des Morphologies urbaines. Paris:
Hermann Editeurs.
5. Batty, M., Longley, P. (1994). Fractal Cities, a geometry of
form and function. Academic Press: Londres, UK,.
6. Alberti, M.; Waddell, P. (2000). An integrated urban
development and ecological simulation model. Integrated
Assessment, v.3. p.215-227.
7. Adolphe, L.; Chatelet, A.; Ait-Ameur, K. et al. (2002).
SAGACités, Système d’Aide à la Gestion des Ambiances
urbaines, Rapport final. MENRT, Action Concertée Incitative
Ville.
8. Alencar, B.J. (2009). A análise multivariada aplicada ao
tratamento da informação espacial: uma abordagem
matemático-computacional em análise de agrupamentos e
análise de componentes principais. 200f. PhD Thesis –
Pontifícia Universidade Católica de Minas Gerais. PUC -
Tratamento da Informação Espacial.
9. Diday, E.; Lemaire, J.; Pouget, J.; Testu, F. (1982).
Eléments d’analyse de données. Paris: Editions Dunod-Bordas.
10. Robinson, D. Computer modeling for sustainable urban
design. Physical principles, methods and applications.
Londres: Earthscan, 2011.
11. Nielsen, T.R. Simple tool to evaluate energy demand and
indoor environment in the early stages of building design,
Solar Energy, v.78, 2005. p.73–83.
12. Robinson, D.; Stone, A. (2004). A simplified radiosity
algorithm for general urban radiation exchange. Building
Services Engineering Research and Technology, v.26, n.4, p.
271-284.
13. Cattell, R.B. The screen test for the number of factors.
Multivariate Behavioral Research, 1, 245-276, 1966.


