Building Cost and Performance Metrics: Data Collection ... · Building Cost and Performance...
120
PNNL-15217 Building Cost and Performance Metrics: Data Collection Protocol Revision 1.1 K.M. Fowler A.E. Solana K.L. Spees September 2005 Completed by the Pacific Northwest National Laboratory, operated for the U.S. Department of Energy by Battelle. Completed for the Federal Energy Management Program, U.S. Department of Energy under Contract DE-AC05-76RL061830.
Transcript of Building Cost and Performance Metrics: Data Collection ... · Building Cost and Performance...

PNNL-15217
Building Cost and Performance Metrics: Data Collection Protocol Revision 1.1 K.M. Fowler A.E. Solana K.L. Spees September 2005 Completed by the Pacific Northwest National Laboratory, operated for the U.S. Department of Energy by Battelle. Completed for the Federal Energy Management Program, U.S. Department of Energy under Contract DE-AC05-76RL061830.

PNNL-15217
ii
DISCLAIMER This report was prepared as an account of work sponsored by an agency of the United States Government. Neither the United States Government nor any agency thereof, not Battelle Memorial Institute, nor any of their employees, makes any warranty, expressed or implied, or assumes any legal liability or responsibility for the accuracy, completeness, or usefulness of any information, apparatus, product, or process disclosed, or represents that its use would not infringe privately owned rights. Reference herein to any specific commercial product, process, or service by trade name, trademark, manufacturer, or otherwise does not necessarily constitute or imply its endorsement, recommendation, or favoring by the United States Government or any agency thereof, or Battelle Memorial Institute. The views and opinions of authors expressed herein do not necessarily state or reflect those of the United States Government or any agency thereof.
PACIFIC NORTHWEST NATIONAL LABORATORY operated by BATTELLE
for the UNITED STATES DEPARTMENT OF ENERGY
under Contract DE-AEC05-76RL01830

PNNL-15217
iii
ACKNOWLEDGEMENTS This project was conducted under the direction of Beverly Dyer of the U.S. Department of Energy’s Federal Energy Management Program. Kim M. Fowler of the Pacific Northwest National Laboratory (PNNL) was the principal investigator of the project and primary author of the report. PNNL staff member, Amy Solana, and PNNL intern, Kathleen Spees, were significant contributors to the project and content of this report. Additional PNNL staff that contributed to the project include Peter Armstrong, Brad Atencio, Marc Berman, Jim Dirks, Richard Fowler, Don Hadley, Judi Johannesen, Kate McMordie-Stoughton, Ken McMullen, John Schmelzer, Jr., Steve Shankle, and Greg Sullivan. Michael Deru of the National Renewable Energy Laboratory and Rick Diamond of the Lawrence Berkeley National Laboratory provided technical input throughout the project as well. The success of the project, however, was due to the contributions made by the project’s Technical Advisory Group (TAG). Current and former members of the TAG include:
Lucia Athens, Seattle Public Utilities Sustainable Buildings Program (former) Cathy Berlow, U.S. Environmental Protection Agency James Carelock, Jr., General Service Administration Anne Crawley, U.S. Department of Energy Robert Fallis, Environmental Protection Agency (former) Steve Glover, Department of the Army Don Horn, General Services Administration Charles Howell, Washington State University (former) Arun Jhaveri, U.S. Department of Energy Mary Ann Lazarus, Hellmuth, Obata + Kassabaum (HOK) Chris Long, Environmental Protection Agency (former) Megan Moser, Green Building Alliance Tom Paladino, Paladino & Company, Inc. Dennis Talton, Department of the Navy Joel Todd, Environmental Consultant Andy Walker, National Renewable Energy Laboratory James White, Environmental Protection Agency (former)
The contributions of the volunteers for the metrics pilot test were also key to the completion of this project. They included Fort Lewis, Tacoma Washington personnel, Pacific Northwest National Laboratory staff, Social Security and General Services Administration personnel associated with the Woodlawn facility (Nancy Belt, Bette Hoffman, John McKewan, Debbie Paul, and John Shryock), and HOK building managers and consultants. The Center for the Built Environment has been a significant contributor to this project as well. They provided the primary tool selected for addressing indoor environmental quality and transportation issues (Sahar Abbaszadeh and Leah Zagreus).

PNNL-15217
iv
Page left blank intentionally.
PNNL-15217
v
EXECUTIVE SUMMARY
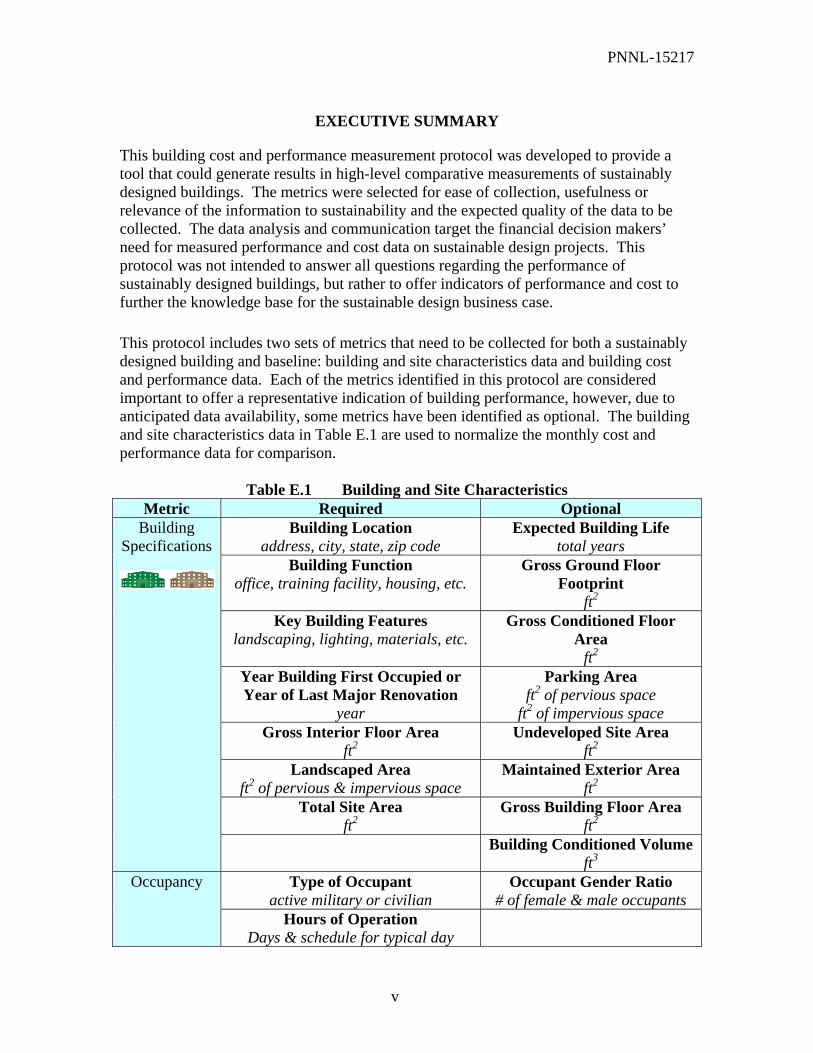
This building cost and performance measurement protocol was developed to provide a tool that could generate results in high-level comparative measurements of sustainably designed buildings. The metrics were selected for ease of collection, usefulness or relevance of the information to sustainability and the expected quality of the data to be collected. The data analysis and communication target the financial decision makers’ need for measured performance and cost data on sustainable design projects. This protocol was not intended to answer all questions regarding the performance of sustainably designed buildings, but rather to offer indicators of performance and cost to further the knowledge base for the sustainable design business case. This protocol includes two sets of metrics that need to be collected for both a sustainably designed building and baseline: building and site characteristics data and building cost and performance data. Each of the metrics identified in this protocol are considered important to offer a representative indication of building performance, however, due to anticipated data availability, some metrics have been identified as optional. The building and site characteristics data in Table E.1 are used to normalize the monthly cost and performance data for comparison.
Table E.1 Building and Site Characteristics Metric Required Optional
Building Location address, city, state, zip code
Expected Building Life total years
Building Function office, training facility, housing, etc.
Gross Ground Floor Footprint
ft2 Key Building Features
landscaping, lighting, materials, etc. Gross Conditioned Floor
Area ft2
Year Building First Occupied or Year of Last Major Renovation
year
Parking Area ft2 of pervious space
ft2 of impervious space Gross Interior Floor Area
ft2 Undeveloped Site Area
ft2 Landscaped Area
ft2 of pervious & impervious space Maintained Exterior Area
ft2 Total Site Area
ft2 Gross Building Floor Area
ft2
Building Specifications
Building Conditioned Volume ft3
Type of Occupant active military or civilian
Occupant Gender Ratio # of female & male occupants
Occupancy
Hours of Operation Days & schedule for typical day

PNNL-15217
vi
Metric Required Optional
weekhrs occupant hours/year
Total Number of Regular Occupants
total # of occupants
Key Policies (e.g., sick leave, transportation, purchasing, etc.)
Summary of key policies
Total Building Cost
$ 2
$ft
Note what was included in total cost
Design Cost
$ 2
$ft
Construction Cost
$ 2
$ft
First Costs
Unusual Cost Elements $/activity
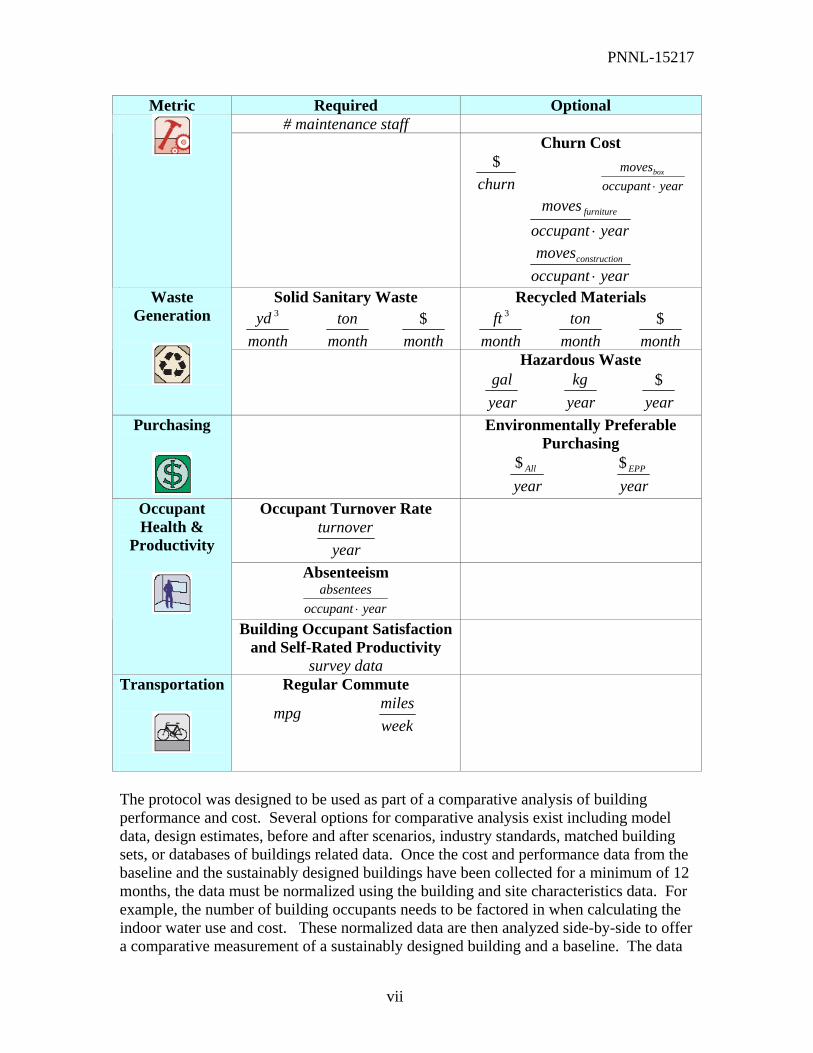
The building cost and performance metrics (Table E.2) are collected monthly and aggregated to provide annual values for comparative analysis. These metrics are the core of the protocol as they are the indicators of sustainably designed building performance.
Table E.2 Building Cost and Performance Metrics Metric Required Optional
Total Building Potable Water Use
monthgal
month$
Indoor Potable Water
monthgal
month$
Outdoor Water Use
monthgal
month$
Water
Storm Sewer
daygal
month$
Total Building Energy Use
monthkWhdelivered
month$
monthBtu
Source Energy
monthkWhsource
source
CO
kWhkg
2
Energy
Peak Electricity Demand kW
Maintenance & Operations
Building Maintenance $ hrs # requests by type
# preventative maintenance
Grounds Maintenance $ hrs
kg of hazardous chemicals used
PNNL-15217
vii
Metric Required Optional # maintenance staff
Churn Cost
churn$
yearoccupantmovesbox
⋅
yearoccupantmoves furniture
⋅
yearoccupantmoves onconstructi
⋅
Solid Sanitary Waste
monthyd 3
month
ton month
$
Recycled Materials
monthft 3
month
ton month
$
Waste Generation
Hazardous Waste
yeargal
yearkg
year$
Purchasing
Environmentally Preferable Purchasing
yearAll$
year
EPP$
Occupant Turnover Rate
yearturnover
Absenteeism
yearoccupantabsentees
⋅
Occupant Health &
Productivity
Building Occupant Satisfaction
and Self-Rated Productivity survey data
Transportation
Regular Commute
mpg weekmiles
The protocol was designed to be used as part of a comparative analysis of building performance and cost. Several options for comparative analysis exist including model data, design estimates, before and after scenarios, industry standards, matched building sets, or databases of buildings related data. Once the cost and performance data from the baseline and the sustainably designed buildings have been collected for a minimum of 12 months, the data must be normalized using the building and site characteristics data. For example, the number of building occupants needs to be factored in when calculating the indoor water use and cost. These normalized data are then analyzed side-by-side to offer a comparative measurement of a sustainably designed building and a baseline. The data
PNNL-15217
viii
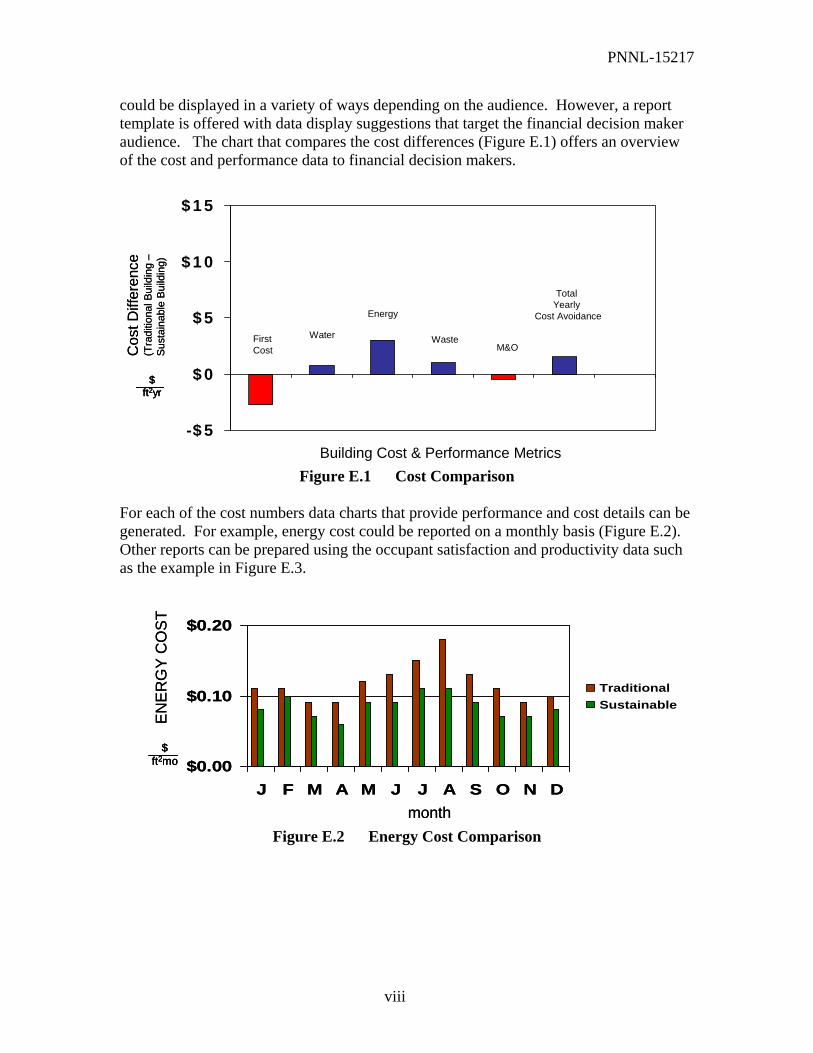
could be displayed in a variety of ways depending on the audience. However, a report template is offered with data display suggestions that target the financial decision maker audience. The chart that compares the cost differences (Figure E.1) offers an overview of the cost and performance data to financial decision makers.
Figure E.1 Cost Comparison For each of the cost numbers data charts that provide performance and cost details can be generated. For example, energy cost could be reported on a monthly basis (Figure E.2). Other reports can be prepared using the occupant satisfaction and productivity data such as the example in Figure E.3.
Figure E.2 Energy Cost Comparison
-$ 5
$ 0
$ 5
$ 1 0
$ 1 5
FirstCost
Water
Energy
M&O
Total Yearly
Cost Avoidance
Cos
t Diff
eren
ce
(Tra
ditio
nal B
uild
ing
–Su
stai
nabl
e Bu
ildin
g)
$ft2yr
Cos
t Diff
eren
ce
(Tra
ditio
nal B
uild
ing
–Su
stai
nabl
e Bu
ildin
g)
$ft2yr
$ft2yr
Waste
Building Cost & Performance Metrics
$0.00
$0.10
$0.20
J F M A M J J A S O N D
TraditionalSustainable
$ft2mo
month
ENE
RG
Y C
OS
T
$0.00
$0.10
$0.20
J F M A M J J A S O N D
TraditionalSustainable
$ft2mo
$ft2mo
month
ENE
RG
Y C
OS
T
PNNL-15217
ix
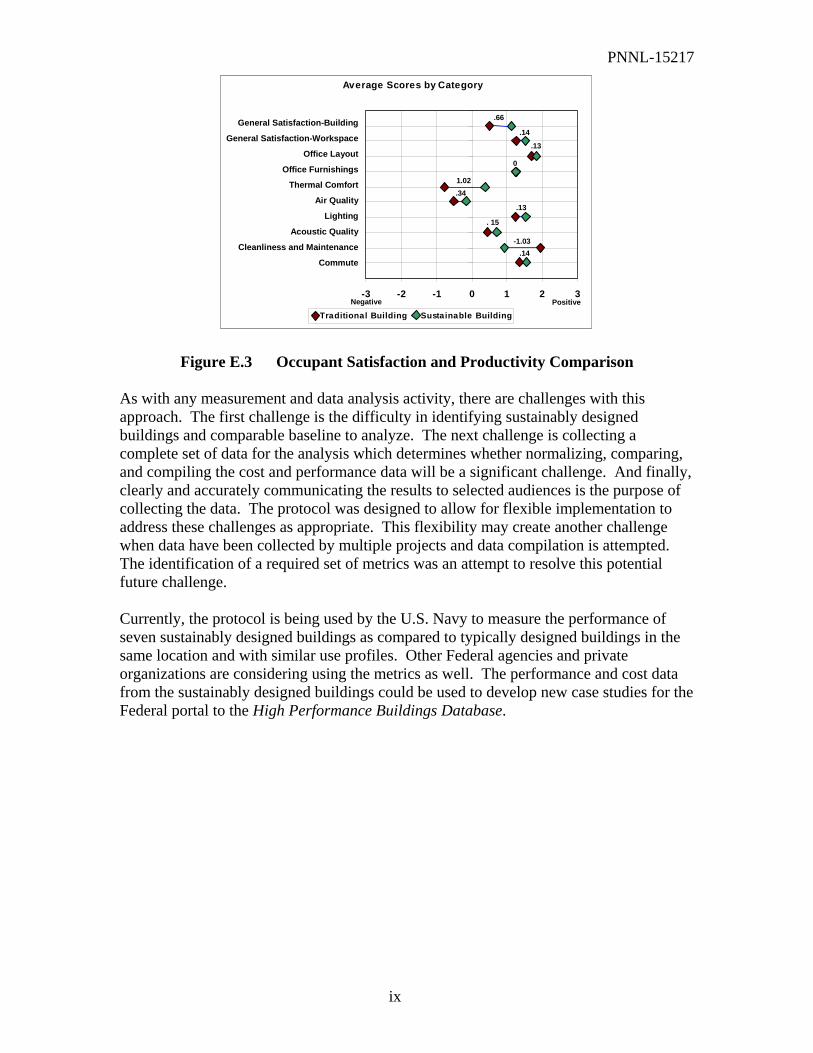
Figure E.3 Occupant Satisfaction and Productivity Comparison
As with any measurement and data analysis activity, there are challenges with this approach. The first challenge is the difficulty in identifying sustainably designed buildings and comparable baseline to analyze. The next challenge is collecting a complete set of data for the analysis which determines whether normalizing, comparing, and compiling the cost and performance data will be a significant challenge. And finally, clearly and accurately communicating the results to selected audiences is the purpose of collecting the data. The protocol was designed to allow for flexible implementation to address these challenges as appropriate. This flexibility may create another challenge when data have been collected by multiple projects and data compilation is attempted. The identification of a required set of metrics was an attempt to resolve this potential future challenge. Currently, the protocol is being used by the U.S. Navy to measure the performance of seven sustainably designed buildings as compared to typically designed buildings in the same location and with similar use profiles. Other Federal agencies and private organizations are considering using the metrics as well. The performance and cost data from the sustainably designed buildings could be used to develop new case studies for the Federal portal to the High Performance Buildings Database.
Average Scores by Category
-3 -2 -1 0 1 2 3
Traditional Building Sustainable Building
General Satisfaction-Building
General Satisfaction-Workspace
Office Layout
Office Furnishings
Thermal Comfort
Air Quality
Lighting
Acoustic Quality
Cleanliness and Maintenance
Commute
Negative Positive
.66
.14
.13
0
1.02.34
.13
. 15
-1.03.14

PNNL-15217
x
Page left blank intentionally.

PNNL-15217
xi
TABLE OF CONTENTS
Acknowledgements............................................................................................................ iii Executive Summary ............................................................................................................ v I. Project Overview ............................................................................................................. 1 Chapter 1: Project Background and Scope ..................................................................... 1 Chapter 2: Project Assumptions and Approach.............................................................. 3 2.1 Project Assumptions ........................................................................................ 3 2.2 Project Approach ............................................................................................ 4 II. Protocol Development.................................................................................................... 7 Chapter 3: Building Selection......................................................................................... 7 Chapter 4: Metric Development.................................................................................... 10 4.1 Metric Criteria............................................................................................... 10 4.2 Metrics Summary.......................................................................................... 12
4.2.1 Building and Site Characteristics........................................................... 13 4.2.2 Building Cost and Performance Metrics................................................ 14
III. Site Comparison Metrics............................................................................................. 15 Chapter 5: Building and Site Characteristics Data Collection........................................ 15 5.1 Building Specifications................................................................................. 15
5.1.1 Geometry Metrics .................................................................................. 16 5.1.2 Definitions and Discussion of Geometry Metrics.................................. 16 5.1.3 Data Collection ...................................................................................... 19
5.2 Occupancy..................................................................................................... 19 5.3 First Costs ..................................................................................................... 20 IV. Building Cost and Performance Metrics..................................................................... 23 Chapter 6: Water ........................................................................................................... 23 6.1 Metric Discussion ......................................................................................... 24 6.2 Data Collection and Calcuations................................................................... 26 6.3 Potential Issues and Lessons Learned........................................................... 27 Chapter 7: Energy ......................................................................................................... 28 7.1 Metric Discussion ......................................................................................... 29 7.2 Data Collection and Calcuations................................................................... 31 7.3 Potential Issues and Lessons Learned........................................................... 32 Chapter 8: Maintenance and Operations......................................................................... 33 8.1 Metric Discussion ......................................................................................... 34 8.2 Data Collection and Calcuations................................................................... 36
8.3 Potential Issues and Lessons Learned........................................................... 36 Chapter 9: Waste Generation .......................................................................................... 37 9.1 Metric Discussion ......................................................................................... 37 9.2 Data Collection and Calcuations................................................................... 39 9.3 Potential Issues and Lessons Learned........................................................... 39
PNNL-15217
xii
Chapter 10: Purchasing................................................................................................... 40 10.1 Metric Discussion ....................................................................................... 41
10.2 Data Collection and Calcuations................................................................. 42 10.3 Potential Issues and Lessons Learned......................................................... 42 Chapter 11: Indoor Environmental Quality .................................................................... 43 11.1 Metric Discussion ....................................................................................... 43 11.2 Data Collection and Calcuations................................................................. 45 11.3 Potential Issues and Lessons Learned......................................................... 46 Chapter 12: Transportation ............................................................................................. 47 12.1 Metric Discussion ....................................................................................... 47 12.2 Data Collection and Calcuations................................................................. 48 12.3 Potential Issues and Lessons Learned......................................................... 48 V. Project Results............................................................................................................. 49 Chapter 13: Data Analysis and Reporting ....................................................................... 49 Chapter 14: Project Summary.......................................................................................... 51
Appendices
Appendix A: Abbreviations and Acronyms.................................................................... 53 Appendix B: Summary List of Building and Site Characteristics .................................. 55 Appendix C: Summary of Cost and Performance Metrics ............................................. 56 Appendix D: Data Collection and Analysis Templates .................................................. 58 Appendix E: Indoor Environmental Quality and Transportation Surveys...................... 81 Appendix F: Sample Report............................................................................................ 96 Appendix G: References and Literature Review ........................................................... 100
PNNL-15217
1
I. Project Overview The purpose of this document is to provide a method and set of metrics (referred to as the “protocol”) for the measurement of building cost and performance, as well as, to explain the protocol development process. The compendium field guide offers a summary of the tools for guiding the collection and analysis of the performance data (Building Cost and Performance Metrics: Data Collection Field Guide). The metrics identified in this protocol are intended to be indicators of building performance. They are not intended to measure all aspects of sustainable building performance, but rather provide some basic information about a building’s comparative performance with respect to sustainable design. The project overview section includes project background and scope (Chapter 1) and project assumptions and approach (Chapter 2). The protocol development section includes guidance on the building selection process (Chapter 3) and an explanation of the metric selection criteria along with a summary list of the metrics (Chapter 4). The site comparison metrics section describes how to use the building and site characteristics data to normalize the collected indicator data for the comparative analysis (Chapter 5). The building cost and performance metrics section provides details on each of the metrics (Chapter 6-12). And the project results section offers sample reporting styles (Chapter 13) and a brief project summary (Chapter 14).
Chapter 1: Project Background and Scope Sustainable design professionals’ intuition has been telling them for years that sustainably designed buildings result in better buildings with lower operating costs, more productive occupants, and a smaller environmental footprint than typically designed buildings. Without formal operations data, there have been challenges gaining support from some Federal financial decision makers for sustainable design. At the same time, the number of sustainably designed buildings has been increasing, in part as a result of relatively easy to use industry standards such as the U.S. Green Building Council’s (USGBC) Leadership in Energy and Environmental Design (LEEDTM) rating system for new construction. Plus, in recent years, many quality studies addressing the business case for sustainable design have been performed. These studies have provided data to address the perception of increased costs for sustainable design by using design, manufacturer assumptions, and modeling to forecast the costs and benefits of sustainable design. Examples of these studies include:
• U.S. Department of Energy’s (DOE) Office of Energy Efficiency and Renewable Energy’s (EERE) Federal Energy Management Program (FEMP) in collaboration with the Interagency Sustainability Working Group prepared The Business Case for Sustainable Design in Federal Facilities. In this report two 20,000 square foot simulated office buildings were compared for life cycle costs, environmental impact, and societal impacts. [82]
• California’s Sustainable Building Task Force commissioned a study to evaluate the business case for sustainable design, which concluded life cycle benefits of sustainable design outweigh the initial first cost investment. This study used data from actual buildings and through personal communications. There were a

PNNL-15217
2
variety of baseline techniques used and costs were attributed to environmental and productivity impacts. [53]
• The General Services Administration performed a cost study on two building types to determine the first cost impacts of differing levels of the LEEDTM rating system. [37]
• Davis Langdon performed a study comparing the construction costs of sustainably designed buildings with buildings that have similar functions but did not establish sustainable design goals. The data for this analysis came from collected construction costs and design parameters for approximately 600 projects. [56, 57]
In addition to the sustainable design business case studies, there has been progress in the development of performance metrics for specific aspects or effects of a building, including energy [64] and productivity [54, 45]. These studies tend to gather detailed information in the targeted area and do not address other aspects of building performance. The detailed information is very useful, for optimizing a building’s operation in that area. The collection of sustainable design building case studies data has also been expanding. For example, FEMP has sponsored a Federal portal to the High Performance Buildings Database to increase the number of Federal projects included in this growing data set. These case studies provide quality anecdotal stories regarding the success of sustainable design practices and over time, will include a considerable set of building cost and performance data. [83] Most of the studies mentioned above used design assumptions, manufacturer assumptions, and/or modeling forecasts to estimate the cost and benefits of sustainable design. Although each of these studies offers useful information for sustainable design professionals, they do not demonstrate the measured impact of existing sustainably designed buildings. They offer evidence that investment in sustainable design is a cost effective, long-term strategy; however, the data could be more convincing with measured building cost and performance data [9, 10, 16, 29, 99]. The Building Cost and Performance Metrics project was initiated in fiscal year 2004 by FEMP to address the need for measured building performance data that captures the difference between sustainably designed and typically designed buildings. The scope was to develop a relatively simple method for measuring building cost and performance, which could be used to demonstrate the life cycle benefits of sustainable design to Federal decision makers. The primary product of the project is the data collection protocol described in this document. The protocol has a set of high-level metrics for comparing the cost and performance differences of sustainably designed and typically designed buildings.
PNNL-15217
3
Chapter 2: Project Assumptions and Approach The information available at the beginning of the project pointed to the need for measured building performance data that could be translated into a cost value used to further explain the life cycle benefits of sustainable design to financial decision makers. To be useful to the Federal stakeholders, the data needed to be:
• Measured, not modeled; • Relatively easy and inexpensive to collect; • Representative of sustainable design principles, not just individual design
strategies such as energy efficiency; and • Translatable into cost values that could be shared with the financial decision
makers to demonstrate performance in their language. The project assumptions and approach are documented below to demonstrate how these needs were translated into a comparative measurement protocol to address the stakeholder interests.
2.1 Project Assumptions There are several key project assumptions that helped define the project approach. One of the first was the target audience(s). It was determined the primary audience for the metrics and data collection protocol would be sustainable design professionals and building managers interested in measuring building performance within the Federal sector. The primary audience for the building performance and cost data (once it is collected and analyzed) would be financial personnel responsible for submitting or accepting budgets for design projects. Other key audiences include technical personnel responsible for designing new buildings and management responsible for approving design concepts and budgets. The financial personnel may include the Office of Management and Budget, Comptrollers, Asset Managers, Claimants, Chief Financial Officers, Third-Party Financiers and others with similar financial oversight roles. As trusted stewards of funding, these decision makers want to ensure that sustainable design offers a sound cost investment. The types of questions the metrics would need to address for this audience include:
• How does the first cost of sustainably designed buildings compare to the first cost of typically designed buildings?
• How do the performance-based operating costs compare between sustainably and typically designed buildings?
These questions are likely to satisfy the interests of other key audiences as well. It is recognized that even when performance and cost data are provided to financial decision makers, they may still run into known business practice challenges such as rules of thumb for the cost of design and “lowest first cost” decision-making.
PNNL-15217
4
2.2 Project Approach The project approach involved identifying external reviewers for the project, developing a set of metrics, testing the metrics, and finalizing a protocol that could be used to gather data. A metric is a measurable characteristic, which for this project includes both building performance and cost. The first and most important step of the Building Cost and Performance Metrics project was to establish a Technical Advisory Group (TAG) to help refine the project scope and provide technical oversight to the development of the metrics and data collection protocol. The TAG members were selected because of their expertise in sustainable development and design within the Federal sector and their previously known interest in building performance measurement. Over the life of the project there have been some changes to the TAG membership, which is noted in the following list of members (in alphabetical order):
Lucia Athens, Seattle Public Utilities Sustainable Buildings Program (former) Cathy Berlow, U.S. Environmental Protection Agency James Carelock, Jr., General Service Administration Anne Crawley, U.S. Department of Energy Beverly Dyer, U.S. Department of Energy (PROJECT OFFICER) Robert Fallis, Environmental Protection Agency (former) Steve Glover, Department of the Army Don Horn, General Services Administration Charles Howell, Washington State University (former) Arun Jhaveri, U.S. Department of Energy Mary Ann Lazarus, Hellmuth, Obata + Kassabaum (HOK) Chris Long, Environmental Protection Agency (former) Megan Moser, Green Building Alliance Tom Paladino, Paladino & Company, Inc. Dennis Talton, Department of the Navy Joel Todd, Environmental Consultant Andy Walker, National Renewable Energy Laboratory James White, Environmental Protection Agency (former)
Through email communication, teleconferences, and two face-to-face meetings, the TAG provided key insight into the needs of the Federal sector, assistance in identifying buildings for testing the metrics, technical review of the building metrics, and guidance on the process of building data collection within the Federal sector. The group reviewed over 40 relevant documents to identify existing guidance on sustainable design cost and performance metrics. Although the literature review did not identify a set of metrics that met the project goal, it did provide several quality resources that offered insight into what and how to measure building performance [e.g., 29, 39, 69, 70, 95]. From these sources a strawman set of building cost and performance metrics was developed and shared with the TAG. The reference materials reviewed to identify potential metrics can be found in Appendix G.

PNNL-15217
5
The strawman metrics were used to guide the discussion of the first TAG meeting, held at the Fort Lewis Army Installation in March 2004. The first order of business at the TAG meeting was to refine the audience and scope of the project. Then metric selection criteria were discussed and finalized (see Chapter 4). The majority of the meeting focused on development and final selection of the metrics. This was accomplished by having the TAG members add their top sustainable design metrics to the strawman metrics, and then evaluating the list against the selection criteria. Once the indicators were selected, the discussion focused on a pilot test of the metrics. The initial discussion focused on testing the metrics on a building set (pair of buildings, one sustainable and one typical) at Fort Lewis. However, during the course of the meeting, it was discovered that a delayed Fort Lewis building occupancy date and the deployment of building occupants to Iraq would impact the timeliness of pilot test data; plus there was interest in having more than one building set as part of the pilot test. Based on this guidance from the TAG members, each person was responsible for identifying potential building sets that could be used to test the metrics. During the months that followed the first TAG meeting, the project team and TAG members searched for alternative building sets to use as part of the pilot study. In the end, four different building sets were used to test the metrics:
• Fort Lewis facilities in Tacoma, Washington, • Social Security Administration facilities in Woodlawn, Maryland, • Pacific Northwest National Laboratory facilities in Richland, Washington, and • HOK designed facilities in various locations.
Fort Lewis, south of Seattle, Washington, offered to be the first pilot test location for the metrics. Over a 4-month period PNNL, tested the application of the metrics using two Fort Lewis Battalion Headquarters facilities to determine the ease of collection as well as to identify potential challenges with comparability, data accuracy, and data availability. These two buildings serve the same function (office building) for two different active military groups. The sizes of the buildings were very similar, and they were located within one-half mile of each other. One of the buildings was built in the 1990s with no intentional thought to sustainable design, while the second building was completed in 2004 and is expected to reach either “certified” or “silver” level using the U.S. Green Building Council Leadership in Energy and Environmental Design (LEEDTM) rating system. The Social Security Administration Woodlawn facilities near Baltimore, Maryland provided pilot test feedback on the metrics offering a different perspective from the experience of data collection at Fort Lewis. The Woodlawn facilities were larger, were owned and operated by two different entities, and the buildings had different fuel sources for heating energy. The Pacific Northwest National Laboratory facilities in southeastern Washington State offered the most complete set of data for the pilot test. Although the buildings in this set
PNNL-15217
6
were older and had only heating ventilation air conditioning (HVAC), lighting, and minor plumbing differences, there were noticeable differences in building cost and performance. The HOK facilities were not building sets but rather buildings HOK had designed and previously documented in case studies. This pilot test focused on the data solicitation response. HOK requested the entire set of metric data from their selected buildings, and the response rate and content of the information provided was noted. The information from the pilot test was used to clarify the metrics data collection protocol and to aid in addressing potential data collection challenges. Lessons learned that apply to the overall protocol use include:
• Identifying and collecting data on sustainably designed buildings and an appropriate baseline takes time and persistence.
• Collecting data on individual buildings located on campuses may require new tracking systems to be put in place;
• Buildings need to be fully functioning and occupied for a minimum of 6 months before performance and cost data are collected;
• Engage building managers early in the process and keep them as leaders throughout the measurement process;
• Consider forming a building team to assist in the data collection effort; • If buildings are not individually metered, assess whether the cost and effort to
meter the buildings fit within the budget and time constraints; • Hold teleconference(s) with each building team or point of contact to gather as
much information as possible prior to the site visit; • Bring a digital camera, measuring tape, and a trundle wheel on the site visit; • Outsourcing of building related services may complicate data collection and
interpretation efforts; and • Significant data collection gaps between the sustainably designed buildings and
baseline will need to be addressed. These lessons learned are being shared to assist with the future application of the protocol. Many of these challenges will been to be addressed on a case-by-case basis. Issues identified pertaining to a specific metric are discussed in the chapters providing details on that metric.

PNNL-15217
7
II. Protocol Development The protocol was designed to provide a high-level comparative analysis of sustainably designed buildings to a baseline. Several strategies for building comparison were considered for this project; building set comparison was chosen because of the volunteer set of buildings available to test the metrics. This section describes the options for building selection and provides an overview of how the metrics were developed.
Chapter 3: Building Selection To initiate the comparative analysis, a sustainably designed building must be identified. Sustainably designed buildings are buildings that have environmental, economic, and social equity impacts incorporated into the design, construction, and operation alongside life cycle cost considerations. Quality sustainably designed buildings have often used an integrated design strategy. For the purposes of this project, a sustainably designed building could be anything from a LEEDTM platinum certified building to a building claiming a considerable number of sustainable design features. The definition of sustainably designed buildings could also be restricted to the U.S. Green Building Council’s Leadership for Energy and Environmental Design New Construction (LEED-NCTM) certified projects. Although the number of LEED-NCTM Federal buildings is growing rapidly, it was determined this would unduly limit the number of Federal facilities available for comparative analysis given not all sustainably designed Federal buildings apply for LEED certification. [71] Once the sustainably designed building is identified, a baseline for comparison needs to be established. The baseline could be:
• a single typically designed building with a similar function, • a large data set of typically designed buildings, • modeled cost and performance data, • building industry standard data, or • a building previously occupied by the occupants currently residing in the
sustainably designed building. Typically designed buildings are buildings where no or minimal extra consideration was made to incorporate environmental or social equity impacts, and/or life cycle cost considerations into the design, construction, and operation of the building. Using a typically designed building for comparison will offer measured data for a side-by-side performance and cost analysis for the sustainably designed building. The most challenging aspect of this approach is the identification of buildings with similar functions and occupants to be used for comparative analysis. A large data set of 20 or more sustainably designed buildings and 20 or more typically designed buildings would provide the information needed for a statistically significant analysis of the building cost and performance metrics. However, this approach would also require significant financial resources, as well as the need to acquire the willingness of 40 or more building managers to provide the requested data, which at a minimum
PNNL-15217
8
would be a daunting task. Ideally, enough data will be collected through the building set approach to create a large data set over time. [28] Business case analysis based on modeled and estimated cost and performance has been performed for sustainable design projects [53, 82] and could be used to compare measured performance and cost data of buildings in operation. Modeled cost and performance data for a baseline building could be compared to measured performance and/or modeled performance of the sustainably designed building. This approach would offer a consistently prepared and documentable baseline. One challenge with this approach is that modeling data are not always understood by financial decision makers. Comparing sustainably designed buildings to industry standards would provide a comparison to what is considered “normal” within the buildings industry. However, explaining how one actual building compares to an ‘industry standard building’ would likely encounter similar challenges as that of modeling data when the results are explained to the primary audience, financial personnel. Ideally, the industry standards could be used along with other methods to offer an additional benchmark for comparison. [54] Evaluating the changes in costs and performance while following a set of building occupants from a typically designed building to a sustainably designed building may provide an easier comparison of occupants and productivity. However, the data on building operation would need to be collected for a minimum of two 12 month time periods in succession and then normalized for differences in weather and other events that may have impacted the building costs and performance over that 2-year period. The occupant data would need to consider how productivity measurements might be affected by any change to occupant surroundings (e.g., the Hawthorne Effect). The final set of data would only involve one to two buildings (as a result of the rare situation being evaluated) and therefore, would offer more of a case study rather than a data set with multiple buildings. [73] The building selection scenario chosen for the pilot test of this project was a side-by-side comparison of two buildings, one sustainably designed and one typically designed. This pairing of buildings is referred to as a “building set” throughout this document. The building set strategy was selected primarily because the Fort Lewis Army Installation offered buildings that could be used to test the metrics in a building set approach, but also because of the difficulties involved in using other methods, as described above. It was recognized that identifying building sets would not be easy, but it would be possible and this strategy would not inhibit the use of the metrics for use by different types of data sets. Basic building and site characteristics data (see Section 4.2.1) are collected for each building in a building set to provide a basis for normalizing the cost and performance metrics data (see Section 4.2.2) that will be collected over time. Before collecting data, identifying a suitable building set is critical to the success of the measurement. The buildings in the set need to:

PNNL-15217
9
• Be the same building type or function (e.g., office, courthouse, training center, etc.), to house similar occupant types and have similar water, energy, waste, and maintenance needs;
• Be located near each other, to minimize the impact of different weather considerations over the measurement period;
• House a similar occupant type (e.g., active military, government employees, contractors, etc.), to minimize differences in policies, procedures and work ethic; and
• Have been in operation for 6-months or longer, to eliminate the negative and positive impacts of being located in a new space.
If these basic building set selection criteria cannot be met, adjustments will need to be made to the metrics, collection data, and data analysis to produce a valid data set.
PNNL-15217
10
Chapter 4: Metric Development The metrics provided in this protocol, and summarized in this section, were finalized using the selection criteria defined below. The selection criteria were also used to determine whether or not the metrics should be considered required or optional. All of the metrics identified in this protocol are desired for a complete comparable analysis of building cost and performance, however, if it was determined that some may be more difficult than others to collect consistently, they were identified as optional.
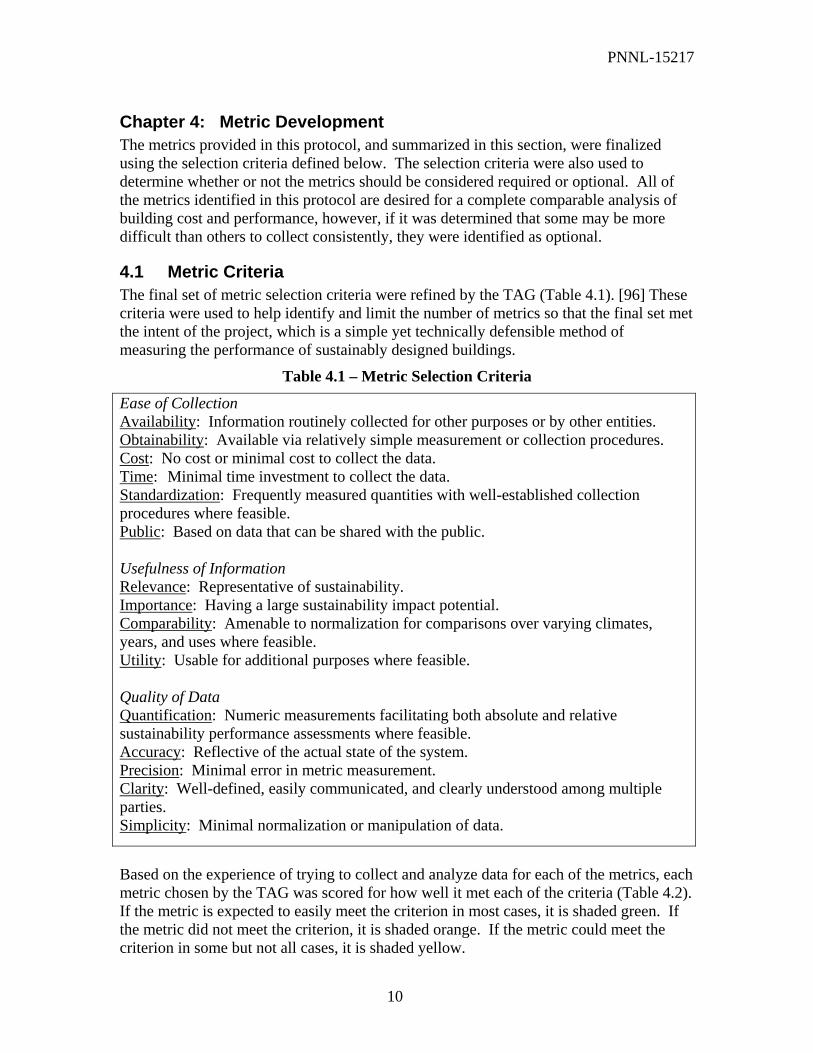
4.1 Metric Criteria The final set of metric selection criteria were refined by the TAG (Table 4.1). [96] These criteria were used to help identify and limit the number of metrics so that the final set met the intent of the project, which is a simple yet technically defensible method of measuring the performance of sustainably designed buildings.
Table 4.1 – Metric Selection Criteria
Ease of Collection Availability: Information routinely collected for other purposes or by other entities. Obtainability: Available via relatively simple measurement or collection procedures. Cost: No cost or minimal cost to collect the data. Time: Minimal time investment to collect the data. Standardization: Frequently measured quantities with well-established collection procedures where feasible. Public: Based on data that can be shared with the public. Usefulness of Information Relevance: Representative of sustainability. Importance: Having a large sustainability impact potential. Comparability: Amenable to normalization for comparisons over varying climates, years, and uses where feasible. Utility: Usable for additional purposes where feasible. Quality of Data Quantification: Numeric measurements facilitating both absolute and relative sustainability performance assessments where feasible. Accuracy: Reflective of the actual state of the system. Precision: Minimal error in metric measurement. Clarity: Well-defined, easily communicated, and clearly understood among multiple parties. Simplicity: Minimal normalization or manipulation of data.
Based on the experience of trying to collect and analyze data for each of the metrics, each metric chosen by the TAG was scored for how well it met each of the criteria (Table 4.2). If the metric is expected to easily meet the criterion in most cases, it is shaded green. If the metric did not meet the criterion, it is shaded orange. If the metric could meet the criterion in some but not all cases, it is shaded yellow.

PNNL-15217
11
Table 4.2 – Selection Criteria: Analysis by Metric Ease of Collection Usefulness of Information Quality of Data
Criteria
Avai
labi
lity
Obta
inab
ility
Cost
Tim
eSt
anda
rdiza
tion
Publ
icRe
leva
nce
Impo
rtanc
eCo
mpa
rabi
lity
Utili
tyQu
antif
icat
ion
Accu
racy
Prec
isio
nCl
arity
Sim
plic
ity
WaterTotal Building Potable Water UseIndoor Potable Water UseOutdoor Water UseTotal Storm Sewer OutputEnergyTotal Building Energy UseSource EnergyPeak Electricity DemandMaintenance and OperationsBuilding MaintenanceGrounds MaintenanceChurn CostWaste GenerationSolid Sanitary Waste Hazardous Waste Recycled MaterialsPurchasingEnvironmentally Preferable Purchasing (EPP)Indoor Environmental Quality (IEQ)Occupant Turnover RateAbsenteeismBuilding Occupant SatisfactionSelf-Rated ProductivityTransportationRegular Commute Key
Meets criterion majority of the timeMeets criterion with effort or depending on building location or existing building systemsDoes not obvioiusly meet criterion majority of the time
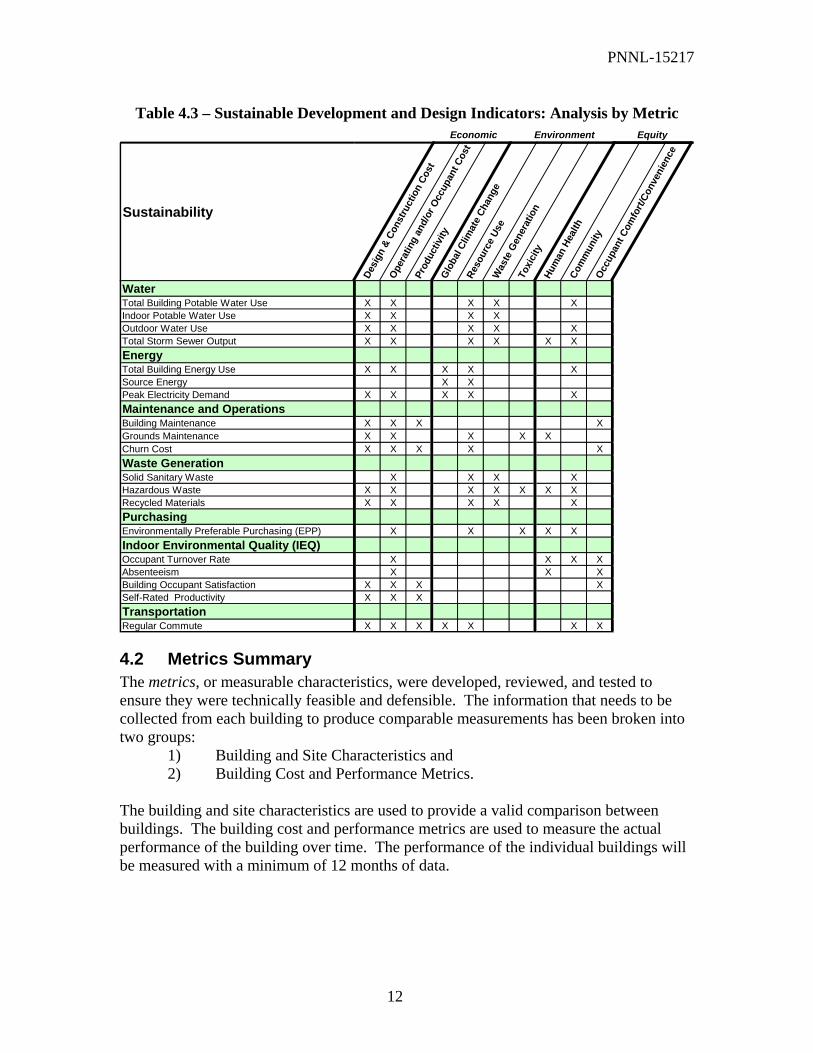
To ensure the metrics were dispersed across the principles of sustainable development and design, they were reviewed for their impact on economic, environmental, and social equity indicators. The economic indicators include design and construction cost, operating cost, occupant cost, and productivity. The environmental indicators include global climate change, resource use, waste generation, and toxicity. The social equity indicators include human health, occupant comfort and/or convenience, and community impact. Table 4.3 shows which of the sustainability indicators each of the building cost and performance metrics will be addressing.
PNNL-15217
12
Table 4.3 – Sustainable Development and Design Indicators: Analysis by Metric Economic Equity Environment
Sustainability
Desi
gn &
Con
stru
ctio
n Co
st
Oper
atin
g an
d/or
Occ
upan
t Cos
t
Prod
uctiv
ityGl
obal
Clim
ate
Chan
ge
Reso
urce
Use
Was
te G
ener
atio
nTo
xici
tyHu
man
Hea
lthCo
mm
unity
Occu
pant
Com
fort/
Conv
enie
nce
WaterTotal Building Potable Water Use X X X X XIndoor Potable Water Use X X X XOutdoor Water Use X X X X XTotal Storm Sewer Output X X X X X XEnergyTotal Building Energy Use X X X X XSource Energy X XPeak Electricity Demand X X X X XMaintenance and OperationsBuilding Maintenance X X X XGrounds Maintenance X X X X XChurn Cost X X X X XWaste GenerationSolid Sanitary Waste X X X XHazardous Waste X X X X X X XRecycled Materials X X X X XPurchasingEnvironmentally Preferable Purchasing (EPP) X X X X XIndoor Environmental Quality (IEQ)Occupant Turnover Rate X X X XAbsenteeism X X XBuilding Occupant Satisfaction X X X XSelf-Rated Productivity X X XTransportationRegular Commute X X X X X X X
4.2 Metrics Summary The metrics, or measurable characteristics, were developed, reviewed, and tested to ensure they were technically feasible and defensible. The information that needs to be collected from each building to produce comparable measurements has been broken into two groups:
1) Building and Site Characteristics and 2) Building Cost and Performance Metrics.
The building and site characteristics are used to provide a valid comparison between buildings. The building cost and performance metrics are used to measure the actual performance of the building over time. The performance of the individual buildings will be measured with a minimum of 12 months of data.
PNNL-15217
13
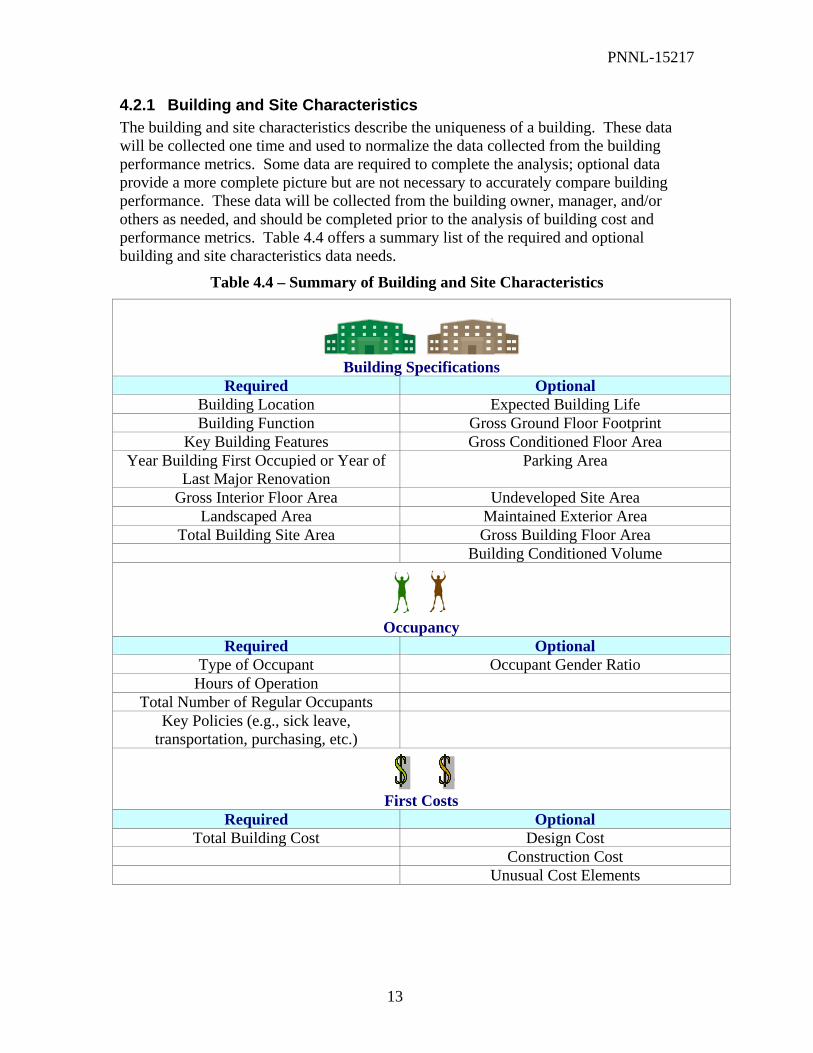
4.2.1 Building and Site Characteristics The building and site characteristics describe the uniqueness of a building. These data will be collected one time and used to normalize the data collected from the building performance metrics. Some data are required to complete the analysis; optional data provide a more complete picture but are not necessary to accurately compare building performance. These data will be collected from the building owner, manager, and/or others as needed, and should be completed prior to the analysis of building cost and performance metrics. Table 4.4 offers a summary list of the required and optional building and site characteristics data needs.
Table 4.4 – Summary of Building and Site Characteristics
Building Specifications
Required Optional Building Location Expected Building Life Building Function Gross Ground Floor Footprint
Key Building Features Gross Conditioned Floor Area Year Building First Occupied or Year of
Last Major Renovation Parking Area
Gross Interior Floor Area Undeveloped Site Area Landscaped Area Maintained Exterior Area
Total Building Site Area Gross Building Floor Area Building Conditioned Volume
Occupancy Required Optional
Type of Occupant Occupant Gender Ratio Hours of Operation
Total Number of Regular Occupants Key Policies (e.g., sick leave,
transportation, purchasing, etc.)
First Costs Required Optional
Total Building Cost Design Cost Construction Cost Unusual Cost Elements

PNNL-15217
14
4.2.2 Building Cost and Performance Metrics Building cost and performance metrics provide quantitative measures of building operations over a minimum of 12 months. Most of these data will be collected monthly and summarized into annual performance data. For each of the following categories of metrics, the specific data points that will be collected are described in Table 4.5. Water Energy Maintenance and Operations Waste Generation Purchasing Indoor Environmental Quality and Transportation.
Many of the metrics are required in order for the analysis of the building performance to be representative of sustainable development. However, some of the metrics, for example stormwater sewer output, are considered optional because they may be too difficult and/or costly to measure, but have the potential of significant environmental, social, and economic impact. It is left to the discretion of those performing the analysis to determine whether the effort to collect those data is feasible.
Table 4.5 – Summary of Building Cost and Performance Metrics
Regular CommuteTransportation
Self-Rated Productivity
Building Occupant Satisfaction
Absenteeism
Occupant Turnover Rate
Occupant Health & Productivity
Environmentally Preferable PurchasingPurchasing
Recycled MaterialsSolid Sanitary WasteWaste Generation
Churn Cost
Grounds MaintenanceBuilding Maintenance RequestsMaintenance &
Operations
Peak Electricity Demand
Source EnergyTotal Building Energy UseEnergy
Outdoor Water UseTotal Storm Sewer Output
Indoor Potable Water
Total Building Water UseWater
OptionalRequiredMetric
PNNL-15217
15
III. Site Comparison Metrics As mentioned previously, this protocol offers performance indicators of sustainably designed buildings using a comparative analysis. To be able to use the protocol, there must be the ability to collect the same data from both a baseline and a sustainably designed building in operation. The building and site characteristics data offer the basis for comparing the monthly and annual cost and performance data. Sample tools for data collection, compilation and analysis are provided in Appendix D.
Chapter 5: Building and Site Characteristics Data Collection The building and site characteristics include building specifications, occupancy, and first cost data. These data form the basis for normalization between a sustainably designed building and a baseline to compare the annual cost and performance data. A complete set of the building and site characteristics data can be found in Appendix B.
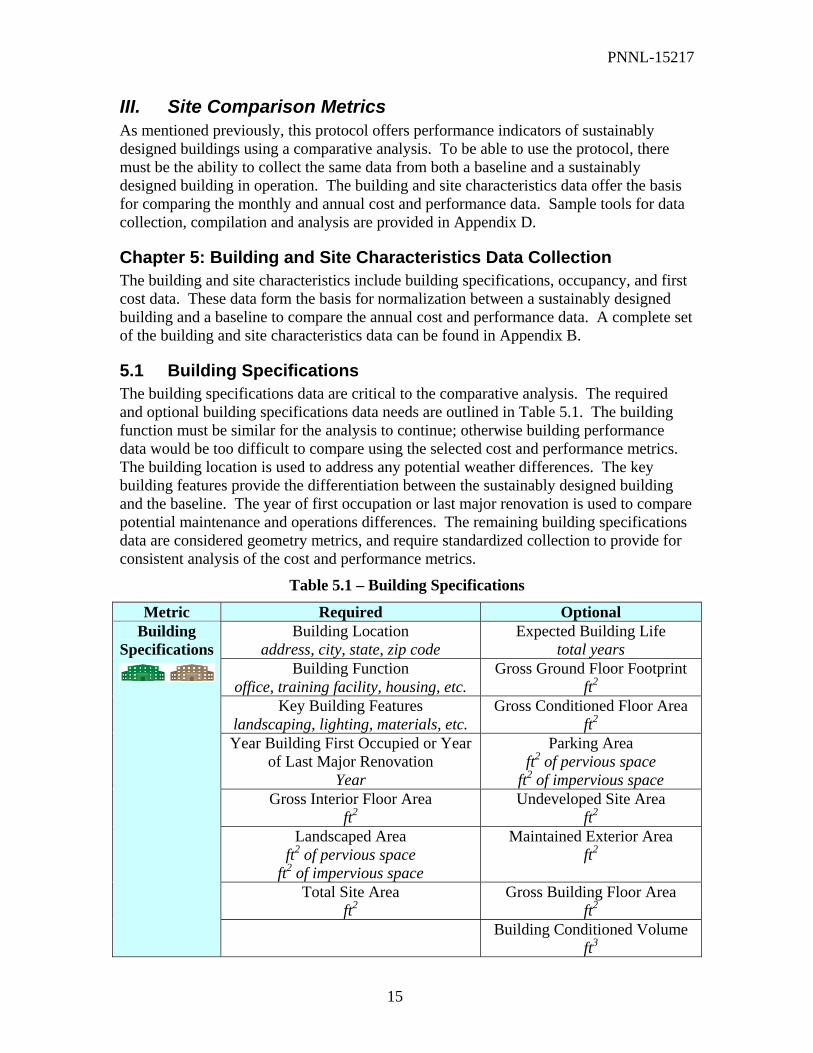
5.1 Building Specifications The building specifications data are critical to the comparative analysis. The required and optional building specifications data needs are outlined in Table 5.1. The building function must be similar for the analysis to continue; otherwise building performance data would be too difficult to compare using the selected cost and performance metrics. The building location is used to address any potential weather differences. The key building features provide the differentiation between the sustainably designed building and the baseline. The year of first occupation or last major renovation is used to compare potential maintenance and operations differences. The remaining building specifications data are considered geometry metrics, and require standardized collection to provide for consistent analysis of the cost and performance metrics.
Table 5.1 – Building Specifications
Metric Required Optional Building Location
address, city, state, zip code Expected Building Life
total years Building Function
office, training facility, housing, etc. Gross Ground Floor Footprint
ft2 Key Building Features
landscaping, lighting, materials, etc. Gross Conditioned Floor Area
ft2 Year Building First Occupied or Year
of Last Major Renovation Year
Parking Area ft2 of pervious space
ft2 of impervious space Gross Interior Floor Area
ft2 Undeveloped Site Area
ft2 Landscaped Area
ft2 of pervious space ft2 of impervious space
Maintained Exterior Area ft2
Total Site Area ft2
Gross Building Floor Area ft2
Building Specifications
Building Conditioned Volume ft3
PNNL-15217
16
The required metrics must be collected consistently for each building being used for the comparative analysis. Optional metrics may be considered essential given certain building characteristics; for example, if the building has interior parking, it would be essential to know the area of the interior lot. [92]
5.1.1 Geometry Metrics Building and site geometry metrics provide information about the resource efficiency of space and other resource use and are used to normalize water use, energy use, maintenance, purchasing, and waste cost and performance indicators. These cost and performance indicators are also normalized by occupancy and first cost. Geometry metrics specifically developed for use with energy analysis and measurements have been developed by the National Renewable Energy Laboratory (NREL) [26] and are largely referenced here. These are based in part on building geometry definitions set out in the American Society of Heating, Refrigerating and Air-Conditioning Engineers (ASHRAE) Standard 90.1 for energy requirements [3]. Floor area definitions developed by Building Owners and Managers Association (BOMA) [11] are American National Standards Institute (ANSI) approved for use in negotiating contracts of leasing, space use, and expense allocations. Geometry definitions for building management, space use planning, classification of functional space, and occupant requirements have been developed by the American Society for Testing and Materials (ASTM) [1].
5.1.2 Definitions and Discussion of Geometry Metrics Gross Interior Floor Area Definition Gross interior floor area is measured from the inside surface of the exterior walls on a floor-by-floor basis and consists of all enclosed spaces. [26] Relevance Resource use and cost values that are relevant to the building interior will be normalized according to gross interior floor area. Resource use quantities include materials purchasing, waste output, indoor water consumption, energy consumption, and maintenance costs. The performance and cost metrics will also be normalized to occupant density (occupants/square feet). Landscaped Area Definition Landscaping includes non-parking developed area associated with the building. Parking areas that require landscaping maintenance such as permeable vegetated surfaces and vegetated islands are included. Other non-parking development including patios, walkways, decorative fountains, and water treatment pools are included. Green roofing is not included in landscaping area unless it can be considered a garden for occupant use. Undeveloped site areas including conserved or restored wetland, prairie, or other habitat are not included.
PNNL-15217
17
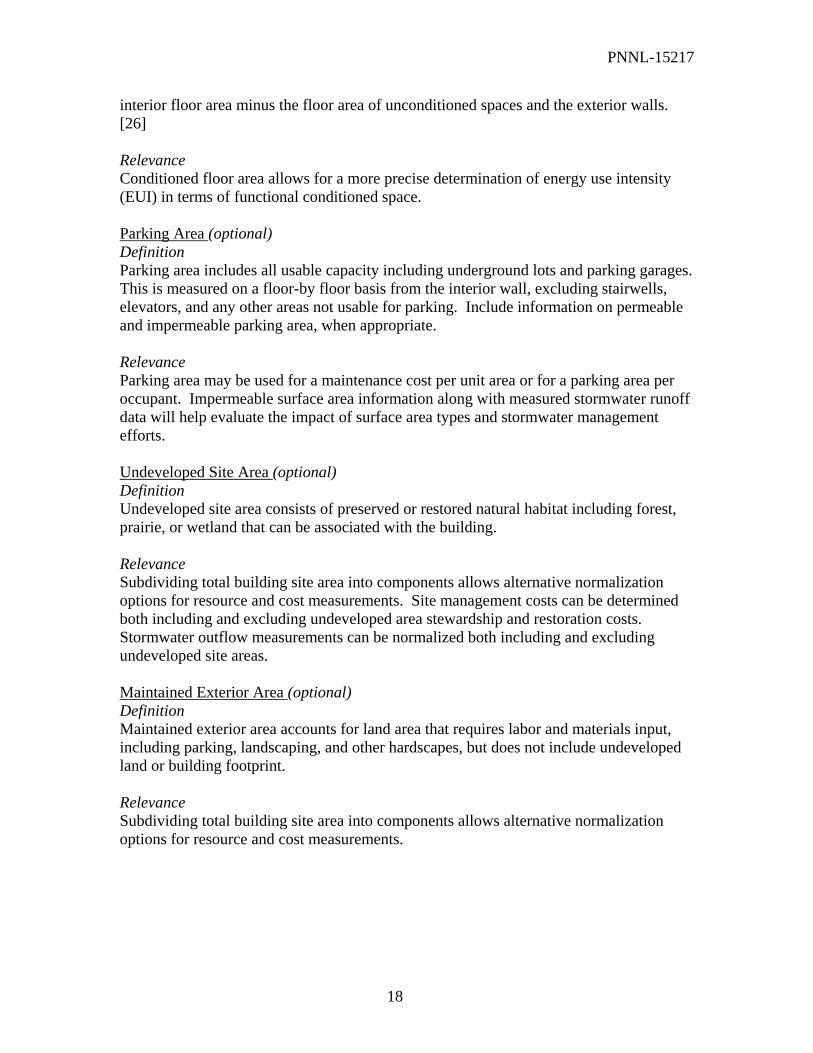
Relevance Landscaping area will be used to normalize exterior water use and grounds maintenance costs. The intent is to determine how sustainable landscaping strategies affect material costs, time spent, and water use. Total Site Area Definition Total site area includes areas for the building, landscaping, parking, and undeveloped land primarily associated with that building (Total Site Area = Building Footprint + Undeveloped Site Area + Landscaped Area). For stand-alone facilities, the site area is equal to the lot area. For campus buildings, exterior areas are assigned by on-site personnel. Clear space divisions such as streets, streams, hedges, and fences can be used to apportion grounds areas to the extent possible. Other considerations include what site area needs to be considered for collection of other metrics, such as grounds maintenance, water use, and stormwater outflow. Building exterior area includes all exterior landscaped area whose irrigation water use is considered part of the building. Inseparable stormwater outflow routes associated with the building can be included if stormwater is going to be measured. Parking areas serving more than one building are assigned proportionally according to building occupancy at peak time. Relevance Total site area will be used to provide overall site comparison for selected resource use metrics. It supports the analysis of the storm sewer metric for the calculation of site related runoff. Note that the storm sewer metric is optional. Additional geometry metrics would be useful for more in-depth understanding of building sets. Optional geometry metrics will be collected as they are available and/or needed for building set features. Gross Ground Floor Footprint (optional) Definition Gross ground floor footprint is the surface area covered by the building’s enclosed spaces at grade level, measured from the outside face of exterior walls. Relevance Subdividing total building site area into components allows alternative normalization options for resource and cost measurements. Gross Conditioned Floor Area (optional) Definition Gross conditioned floor area is all of the conditioned spaces measured from the inside surface of the exterior walls. A conditioned space is an enclosed space within the building that is cooled, heated or indirectly conditioned. This area is equal to the gross
PNNL-15217
18
interior floor area minus the floor area of unconditioned spaces and the exterior walls. [26] Relevance Conditioned floor area allows for a more precise determination of energy use intensity (EUI) in terms of functional conditioned space. Parking Area (optional) Definition Parking area includes all usable capacity including underground lots and parking garages. This is measured on a floor-by floor basis from the interior wall, excluding stairwells, elevators, and any other areas not usable for parking. Include information on permeable and impermeable parking area, when appropriate. Relevance Parking area may be used for a maintenance cost per unit area or for a parking area per occupant. Impermeable surface area information along with measured stormwater runoff data will help evaluate the impact of surface area types and stormwater management efforts. Undeveloped Site Area (optional) Definition Undeveloped site area consists of preserved or restored natural habitat including forest, prairie, or wetland that can be associated with the building. Relevance Subdividing total building site area into components allows alternative normalization options for resource and cost measurements. Site management costs can be determined both including and excluding undeveloped area stewardship and restoration costs. Stormwater outflow measurements can be normalized both including and excluding undeveloped site areas. Maintained Exterior Area (optional) Definition Maintained exterior area accounts for land area that requires labor and materials input, including parking, landscaping, and other hardscapes, but does not include undeveloped land or building footprint. Relevance Subdividing total building site area into components allows alternative normalization options for resource and cost measurements.

PNNL-15217
19
Gross Building Floor Area (optional) Definition Gross building floor area is the enclosed space measured from the outside face of exterior walls on a floor-by-floor basis and includes basements, mezzanines, penthouses, vertical penetrations (such as elevator shafts and stairwells), and interior parking. [26] Relevance Gross building floor area offers an alternative normalization from gross interior floor area for determining whether resource use metrics are accurately portraying building performance. Gross Conditioned Volume (optional) Definition Gross conditioned volume includes the gross interior floor space and height with specific room dimensions as needed. The interior height is measured from floor surface to the bottom of the floor surface in multi-story buildings or inside the surface of the roof. It is calculated on a floor by floor basis with unique spaces, such as atriums, being calculated separately. Relevance This metric allows for the normalization of energy consumption by volume rather than area, offering additional detail for conditioned space with high ceilings (e.g., atrium, auditorium, gymnasium, etc.).
5.1.3 Data Collection Building and site geometry metrics will be determined on an as-built basis with one of two methods.
1. Geometry metrics can be determined from as-built drawings with site walk-through inspection of questionable features.
2. Geometry metrics can be determined directly from measurements.
5.2 Occupancy Building occupants are the most significant factor in sustainable building operations. Occupants that choose to work in a sustainable manner regardless of their facility surroundings can greatly impact the performance and operating cost of a building. For example, a building that has occupants who take advantage of daylighting rather than turning on lights will be impacting the energy use, maintenance and waste generation metrics. Occupants committed to recycling will be impacting the waste generation metric through reduced waste disposal and increased recycling. And, occupants that chose to commute to work using mass transit, carpools, fuel efficiency vehicles or bicycles will be impacting the transportation metrics. The occupancy metrics will not address all the potential impacts occupants will have on building performance. However, they were selected to characterize the occupants in order to normalize the building cost and performance data for comparative analysis purposes. The required and optional occupancy-related data needs are outlined in Table 5.2.
PNNL-15217
20
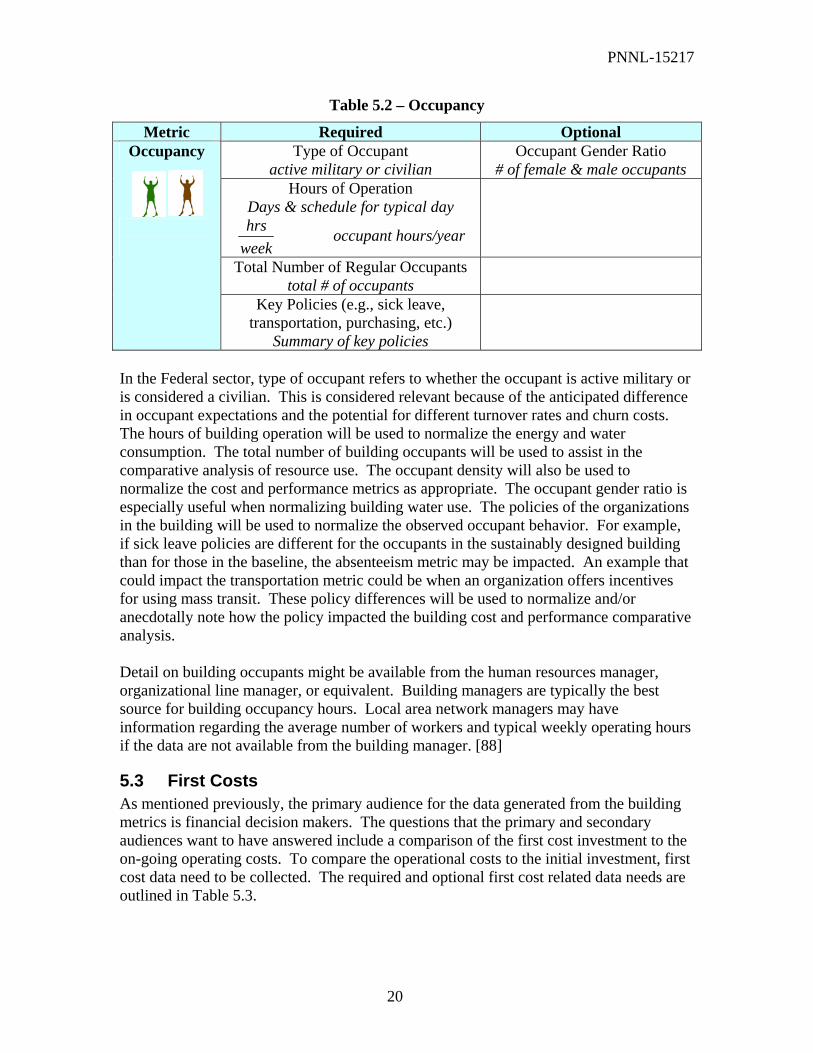
Table 5.2 – Occupancy
Metric Required Optional Type of Occupant
active military or civilian Occupant Gender Ratio
# of female & male occupants Hours of Operation
Days & schedule for typical day
weekhrs occupant hours/year
Total Number of Regular Occupants total # of occupants
Occupancy
Key Policies (e.g., sick leave, transportation, purchasing, etc.)
Summary of key policies
In the Federal sector, type of occupant refers to whether the occupant is active military or is considered a civilian. This is considered relevant because of the anticipated difference in occupant expectations and the potential for different turnover rates and churn costs. The hours of building operation will be used to normalize the energy and water consumption. The total number of building occupants will be used to assist in the comparative analysis of resource use. The occupant density will also be used to normalize the cost and performance metrics as appropriate. The occupant gender ratio is especially useful when normalizing building water use. The policies of the organizations in the building will be used to normalize the observed occupant behavior. For example, if sick leave policies are different for the occupants in the sustainably designed building than for those in the baseline, the absenteeism metric may be impacted. An example that could impact the transportation metric could be when an organization offers incentives for using mass transit. These policy differences will be used to normalize and/or anecdotally note how the policy impacted the building cost and performance comparative analysis. Detail on building occupants might be available from the human resources manager, organizational line manager, or equivalent. Building managers are typically the best source for building occupancy hours. Local area network managers may have information regarding the average number of workers and typical weekly operating hours if the data are not available from the building manager. [88]
5.3 First Costs As mentioned previously, the primary audience for the data generated from the building metrics is financial decision makers. The questions that the primary and secondary audiences want to have answered include a comparison of the first cost investment to the on-going operating costs. To compare the operational costs to the initial investment, first cost data need to be collected. The required and optional first cost related data needs are outlined in Table 5.3.

PNNL-15217
21
Table 5.3 – First Costs
Metric Required Optional Total Building Cost
$ 2
$ft
plus a notation of what is included in total cost
Design Cost
$ 2
$ft
Construction Cost
$ 2
$ft
First Costs
Unusual Cost Elements $/activity
The protocol uses the total building cost to compare the sustainably designed building to the baseline. For the comparison to be useful, both the sustainably designed building and the baseline need to include the same items in their total cost number. Ideally, design cost, construction cost, and any other relevant cost data would be collected to allow for a detailed comparison. A study by Davis Langdon demonstrated that the first cost of the sustainably designed buildings varied tremendously based on the clarity of design objectives and many other causes that weren’t always correlated with sustainable design. [56, 57] Notations on reasons for specific cost elements will be taken when available to assist in the building cost comparison.

PNNL-15217
22
Page left blank intentionally.

PNNL-15217
23
IV. Building Cost and Performance Metrics The building cost and performance metrics are the core of this protocol. Once buildings and comparison scenarios have been selected, these data are collected for both the sustainably designed building and baseline for a minimum of one year. These metrics are intended to be used as indicators of the comparative performance in order to provide additional data for the business case for sustainable design. The building cost and performance metrics are collected on a monthly basis, normalized using the building and site characteristics data, and then used to compare the performance of the sustainably designed building to the baseline. These metrics include water, energy, maintenance and operations, waste generation, purchasing, indoor environmental quality, and transportation. A complete listing of the building cost and performance metrics can be found in Appendix C. The metrics are designated as required or optional. The required metrics must be collected consistently for each building to allow for a valid comparison. The optional metrics are still considered important to the cost and performance comparison and should be collected whenever possible. Prior to initiating a comparative analysis, use the building and site characteristics to determine if comparable buildings exist. For the sustainably designed building and the baseline ensure you can collect monthly whole building water use and cost, whole building energy use and cost, building maintenance activity and cost, sanitary waste quantity and cost, and occupant turnover and absenteeism rates. This will require access to utility bills, metering equipment, and/or internal tracking systems. The chapters in this section provide definitions, suggested data collection and calculation strategies, and share potential issues and lessons learned for each of the building cost and performance metrics.
Chapter 6: Water Potable water consumption is the building utility cost that is second only to energy use. Therefore, there is a direct monetary incentive to track and decrease water consumption. Stormwater management is a water use topic gaining more attention as local or regional governments are confronted with infrastructure and environmental costs caused by stormwater outflow volumes and quality. Table 6.1 provides the summary of the required and optional potable water and stormwater metrics. This chapter offers an explanation of the water metric selection and relevance, guidance on how to collect and analyze data for each metric, and identification of potential issues and lessons learned that may be encountered with data collection or analysis.
PNNL-15217
24
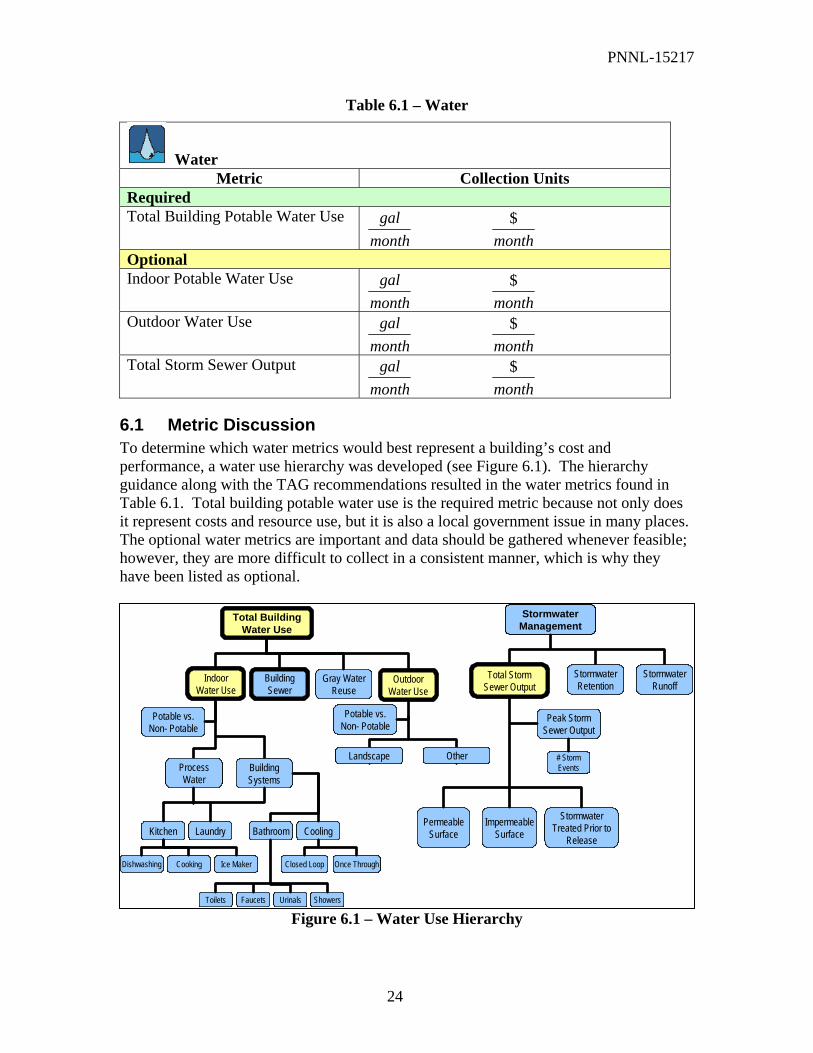
Table 6.1 – Water
Water Metric Collection Units
Required Total Building Potable Water Use
monthgal
month$
Optional Indoor Potable Water Use
monthgal
month$
Outdoor Water Use month
gal month
$
Total Storm Sewer Output month
gal month
$
6.1 Metric Discussion To determine which water metrics would best represent a building’s cost and performance, a water use hierarchy was developed (see Figure 6.1). The hierarchy guidance along with the TAG recommendations resulted in the water metrics found in Table 6.1. Total building potable water use is the required metric because not only does it represent costs and resource use, but it is also a local government issue in many places. The optional water metrics are important and data should be gathered whenever feasible; however, they are more difficult to collect in a consistent manner, which is why they have been listed as optional.
Figure 6.1 – Water Use Hierarchy
Dishwashing
Stormwater Management
OutdoorWater Use
IndoorWater Use
Landscape Other
Total Building Water Use
Potable vs.Non- Potable
BuildingSewer
Gray WaterReuse
Potable vs.Non- Potable
BuildingSystems
ProcessWater
Kitchen CoolingBathroomLaundry
Cooking
FaucetsToilets ShowersUrinals
Once ThroughClosed Loop
Total StormSewer Output
Peak Storm Sewer Output
# Storm Events
Permeable Surface
Stormwater Treated Prior to
Release
Impermeable Surface
StormwaterRunoff
StormwaterRetention
Ice MakerDishwashing
Stormwater Management
OutdoorWater Use
IndoorWater Use
Landscape Other
Total Building Water Use
Potable vs.Non- Potable
BuildingSewer
Gray WaterReuse
Potable vs.Non- Potable
BuildingSystems
ProcessWater
Kitchen CoolingBathroomLaundry
Cooking
FaucetsToilets ShowersUrinals
Once ThroughClosed Loop
Total StormSewer Output
Peak Storm Sewer Output
# Storm Events
Permeable Surface
Stormwater Treated Prior to
Release
Impermeable Surface
StormwaterRunoff
StormwaterRetention
Ice Maker

PNNL-15217
25
Total Building Potable Water Use Definition Building water use includes all indoor and outdoor water use taken from a well or centralized water distribution. The potable water use volume metric does not include captured stormwater or reused gray water. Potable water use cost can include costs assessed for sewage treatment as long as both buildings in a set are measured the same way. Varying regional price structuring and metering may alter what data are readily available via utility bills. Measurement and Verification Guidelines for Federal Energy Management Projects offer detailed concepts in quantifying water consumption and cost. [85] Relevance Water consumption allows for a building systems performance comparison; water use cost allows for an economic comparison. The total potable water use metric is likely not as instructive as values given when indoor and outdoor water use are separated, resulting in uncertainty regarding the reasons behind a more efficient water system. However, if separate metering is not available, this metric will be used, and individual uses may be calculated based on this total consumption. Indoor Potable Water Use (optional) Definition Building interior water consumption includes that portion of potable water use used in the building interior, including bathrooms, mechanical systems, laundries, and kitchens. Water used and discharged for cooling through once-through or cooling tower systems is included here. It does not include irrigation or other exterior water use that is routed through the interior building plumbing system. Relevance Building interior planning efficiency and fixture efficiency are represented by this metric. Comparisons of this indoor water use will likely be very meaningful because they are evaluated among buildings with similar functions on both per unit area and per occupant basis. Outdoor Water Use (optional) Definition Exterior water use includes potable and irrigation water use. Captured rainwater and reused gray water are not included in the volume metric, but estimated volumes should be included in the key building features metric. Relevance Comparison of area-normalized outdoor water use will allow an evaluation of the relative cost and performance efficiency of sustainable landscaping strategies.
PNNL-15217
26
Total Storm Sewer Output (optional) Definition Total storm sewer output is the metric being used to represent the volume of stormwater directed off the building site. Stormwater fees are generally assessed through taxes based on area, urban density, or impermeable surface area because outflow volumes are rarely metered. Relevance Total storm sewer output is an indicator of the effectiveness of site related stormwater management.
6.2 Data Collection and Calculations Water use data will be collected from utility bills and/or installed metering. Total Building Potable Water Use Total building potable water use will generally be collected from one water use utility bill that includes sewer costs. If outdoor, indoor, sewer, and storm sewer costs are itemized in billing, they can be used separately for the optional metrics as well as be combined for this metric. Indoor and Outdoor Water Use Ideally indoor, outdoor, and primary end uses would be metered separately and the information would be available in 1-hour increments. Advanced building management systems may have collected end use information including irrigation, cooling tower, or chilled water use, which can be used if individual utility metering is not available. If no detailed metering data are available, utility bills that provide the indoor, outdoor, and sewer measurements separately can be used. Not all utilities measure indoor use, outdoor use, and sewer output separately but rather use a seasonal variance method of determining water use. The seasonal variance method will generally assume that indoor water use remains constant during the course of the year, but cooling tower and irrigation water uses fluctuate with season. The accuracy of this method can be increased with specific building information on when these seasonal consumers actually operate. If neither measured nor seasonal variance data are available, outdoor potable water use may be calculated from timed irrigation data or regular scheduling, along with sprayhead flow rates. Sprayhead information may be available through the building manager, online, or by contacting the manufacturer. Time and flow information may also be used to calculate water consumption in once-through cooling, ice makers, cooling towers, or other end uses that need to be separately estimated. Water use volume and costs will sum to the total values determined in the previous metric.
PNNL-15217
27
Total Storm Sewer Output Stormwater costs will be determined for the site in the manner that they are assessed for taxation or otherwise. This metric measures the extent to which stormwater cost assessments represent actual site performance. Storm sewer output is generally not metered by any government or utility, even in regions where storm sewer volumes are of specific local concern. Therefore, these values must be determined through installed metering. Metering should begin by determining at how many points stormwater leaves the property, and whether the stormwater outflow can be meaningfully separated from neighboring properties. Metered information should be used if at all possible, but a small amount of proportional calculation may be used to separate the contribution of neighboring properties. Combined stormwater outflows will be assigned proportionally to calculated impervious areas from the contributing property regions. If site stormwater is managed such that no stormwater is directed off-site, or that the site is designed to approximate natural conditions with no evidence of erosion or sedimentation of local waterways during storm events, the storm sewer outflow may be estimated as zero.
6.3 Potential Issues and Lessons Learned Through the pilot test of the metrics and technical review by water management experts, the following potential data collection and analysis issues have been raised.
• The building set’s “Total Potable Water Use” needs to include the same uses, or additional uses must be factored out. For example, if only one of the two buildings has a chiller, that additional water use would need to be metered to remove it from the Total Potable Water Use metric.
• Occupancy gender may impact water use results, especially if water free urinals are in place.
• Many buildings on a government campus setting do not have individually metered water use. Installation of building-specific water meters would require additional time and resources.
• Utility bills may not include the same measurements and charges for each building (e.g., sewer, outdoor, chiller, taxes, fees, etc.).
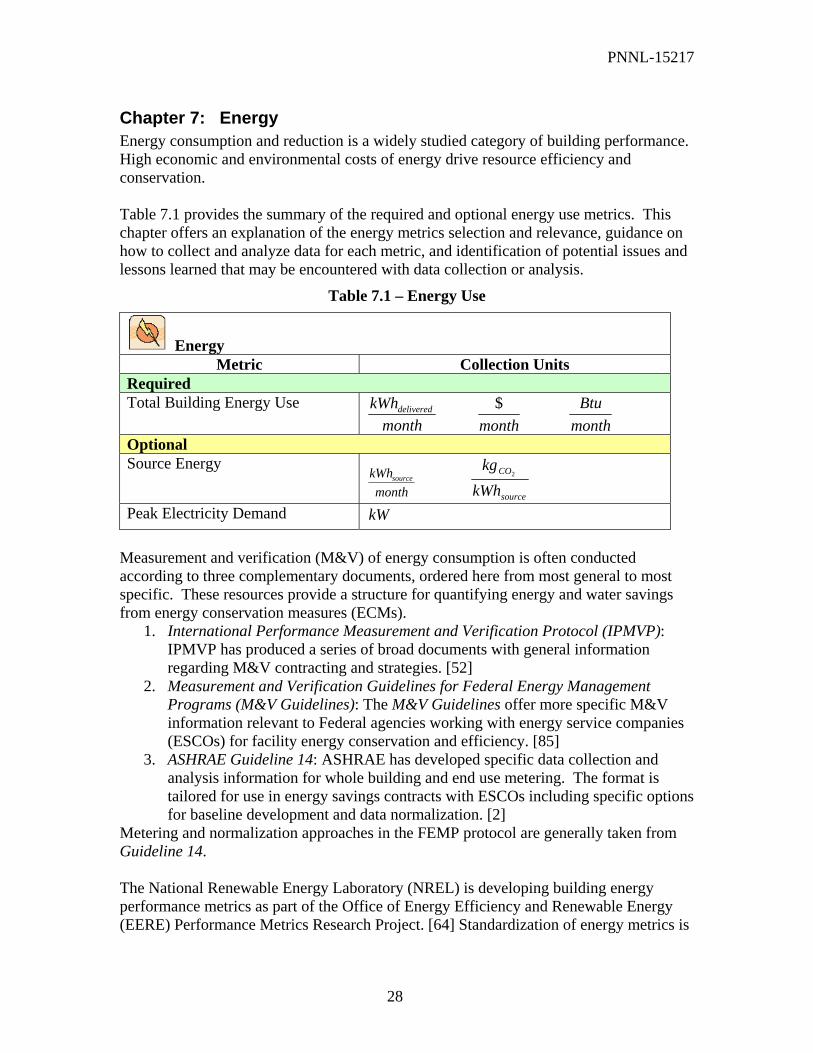
PNNL-15217
28
Chapter 7: Energy Energy consumption and reduction is a widely studied category of building performance. High economic and environmental costs of energy drive resource efficiency and conservation. Table 7.1 provides the summary of the required and optional energy use metrics. This chapter offers an explanation of the energy metrics selection and relevance, guidance on how to collect and analyze data for each metric, and identification of potential issues and lessons learned that may be encountered with data collection or analysis.
Table 7.1 – Energy Use
Energy Metric Collection Units
Required Total Building Energy Use
monthkWhdelivered
month$
monthBtu
Optional Source Energy
monthkWhsource
source
CO
kWhkg
2
Peak Electricity Demand kW Measurement and verification (M&V) of energy consumption is often conducted according to three complementary documents, ordered here from most general to most specific. These resources provide a structure for quantifying energy and water savings from energy conservation measures (ECMs).
1. International Performance Measurement and Verification Protocol (IPMVP): IPMVP has produced a series of broad documents with general information regarding M&V contracting and strategies. [52]
2. Measurement and Verification Guidelines for Federal Energy Management Programs (M&V Guidelines): The M&V Guidelines offer more specific M&V information relevant to Federal agencies working with energy service companies (ESCOs) for facility energy conservation and efficiency. [85]
3. ASHRAE Guideline 14: ASHRAE has developed specific data collection and analysis information for whole building and end use metering. The format is tailored for use in energy savings contracts with ESCOs including specific options for baseline development and data normalization. [2]
Metering and normalization approaches in the FEMP protocol are generally taken from Guideline 14. The National Renewable Energy Laboratory (NREL) is developing building energy performance metrics as part of the Office of Energy Efficiency and Renewable Energy (EERE) Performance Metrics Research Project. [64] Standardization of energy metrics is
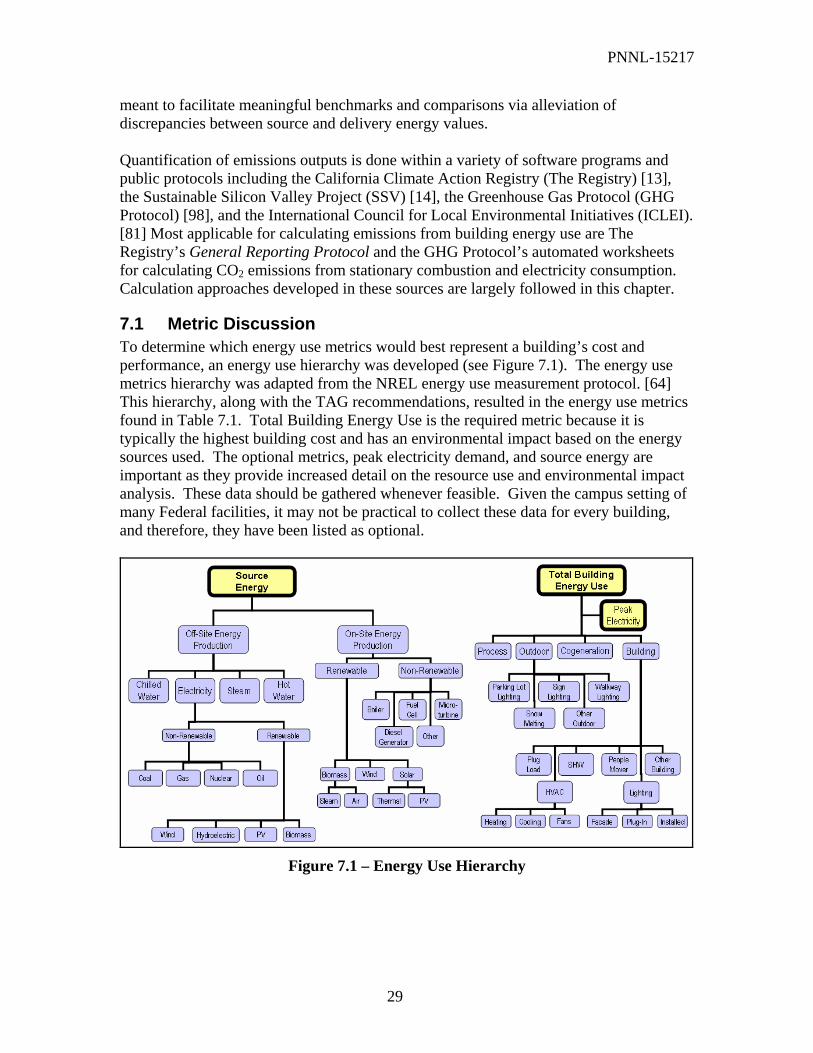
PNNL-15217
29
meant to facilitate meaningful benchmarks and comparisons via alleviation of discrepancies between source and delivery energy values. Quantification of emissions outputs is done within a variety of software programs and public protocols including the California Climate Action Registry (The Registry) [13], the Sustainable Silicon Valley Project (SSV) [14], the Greenhouse Gas Protocol (GHG Protocol) [98], and the International Council for Local Environmental Initiatives (ICLEI). [81] Most applicable for calculating emissions from building energy use are The Registry’s General Reporting Protocol and the GHG Protocol’s automated worksheets for calculating CO2 emissions from stationary combustion and electricity consumption. Calculation approaches developed in these sources are largely followed in this chapter.
7.1 Metric Discussion To determine which energy use metrics would best represent a building’s cost and performance, an energy use hierarchy was developed (see Figure 7.1). The energy use metrics hierarchy was adapted from the NREL energy use measurement protocol. [64] This hierarchy, along with the TAG recommendations, resulted in the energy use metrics found in Table 7.1. Total Building Energy Use is the required metric because it is typically the highest building cost and has an environmental impact based on the energy sources used. The optional metrics, peak electricity demand, and source energy are important as they provide increased detail on the resource use and environmental impact analysis. These data should be gathered whenever feasible. Given the campus setting of many Federal facilities, it may not be practical to collect these data for every building, and therefore, they have been listed as optional.
Figure 7.1 – Energy Use Hierarchy
PNNL-15217
30
Total Building Energy Use Definition Building energy use includes all energy consumed in the building. Building energy consumption includes any exterior building illumination, but does not include parking garage or parking lot lighting. Relevance Building energy use allows for building systems performance, cost, and resource use comparisons. Source Energy (optional) Definition Source energy is the energy directly consumed at the building and the energy consumed at the source or production point used to deliver the quantity of energy to the building site. Source energy includes site consumed energy, transmission and distribution losses, and conversion inefficiencies. Combusted fossil, biomass, and refuse-derived fuel (RDF) source energy is equivalent to stored chemical energy; nuclear source energy is calculated as the thermal energy released in the fission reaction; hydroelectric source energy is the potential or kinetic energy contained within dammed water. Source emissions will be calculated in terms of the mass of the seven primary pollutants as defined by the National Ambient Air Quality Standards (NAAQS) of the Clean Air Act (CAA): ozone (O3), particulate matter less than 10 µm in diameter (PM10), particulate matter less than 2.5 µm in diameter (PM2.5), carbon monoxide (CO), sulfur dioxide (SO2), nitrogen oxides (NOX), and lead (Pb). [21, 62] They will also be reported in terms of mass carbon dioxide (CO2) and rolled up into global warming potential (GWP) as carbon dioxide equivalent (CO2e), and acidification potential as sulfur dioxide equivalent (SO2e). Where electricity is generated by a nuclear utility, the mass of radioactive waste (kg U) associated with site energy consumption will be collected. Other emissions data will be collected as determined available and relevant upon contacting the power utility. Relevance Source energy is a more detailed means of determining building resource use efficiency performance than site energy because it accounts for the imbedded inefficiencies of transmission, distribution, and conversion. [89] Building designers and managers can change the impact of a building by installing on-site renewable energy and/or purchasing “green” energy from the utility. Source emissions offer an environmental impact indicator. Relative global warming, acidification, and radioactive waste impacts are estimated from the collected values. Peak Site Electricity Demand (optional) Definition Peak electricity demand is the maximum power demand and the associated cost premium assessed over a period of one calendar month. Typically, peak demand is measured in
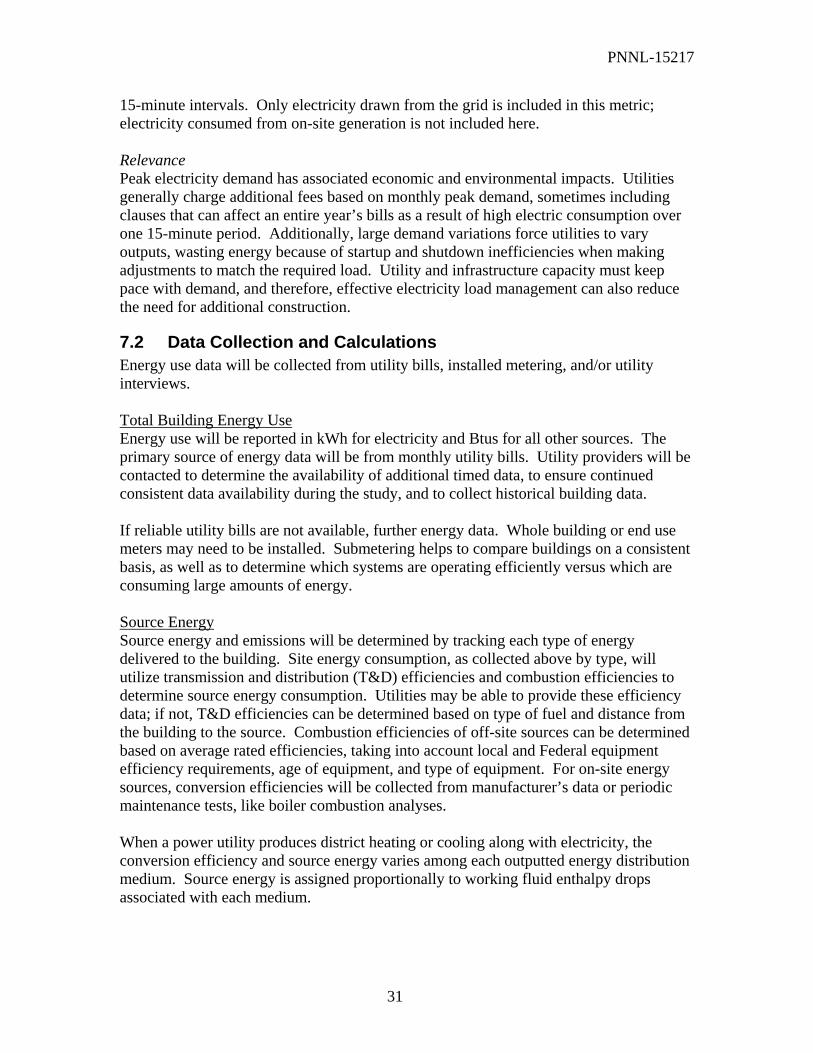
PNNL-15217
31
15-minute intervals. Only electricity drawn from the grid is included in this metric; electricity consumed from on-site generation is not included here. Relevance Peak electricity demand has associated economic and environmental impacts. Utilities generally charge additional fees based on monthly peak demand, sometimes including clauses that can affect an entire year’s bills as a result of high electric consumption over one 15-minute period. Additionally, large demand variations force utilities to vary outputs, wasting energy because of startup and shutdown inefficiencies when making adjustments to match the required load. Utility and infrastructure capacity must keep pace with demand, and therefore, effective electricity load management can also reduce the need for additional construction.
7.2 Data Collection and Calculations Energy use data will be collected from utility bills, installed metering, and/or utility interviews. Total Building Energy Use Energy use will be reported in kWh for electricity and Btus for all other sources. The primary source of energy data will be from monthly utility bills. Utility providers will be contacted to determine the availability of additional timed data, to ensure continued consistent data availability during the study, and to collect historical building data. If reliable utility bills are not available, further energy data. Whole building or end use meters may need to be installed. Submetering helps to compare buildings on a consistent basis, as well as to determine which systems are operating efficiently versus which are consuming large amounts of energy. Source Energy Source energy and emissions will be determined by tracking each type of energy delivered to the building. Site energy consumption, as collected above by type, will utilize transmission and distribution (T&D) efficiencies and combustion efficiencies to determine source energy consumption. Utilities may be able to provide these efficiency data; if not, T&D efficiencies can be determined based on type of fuel and distance from the building to the source. Combustion efficiencies of off-site sources can be determined based on average rated efficiencies, taking into account local and Federal equipment efficiency requirements, age of equipment, and type of equipment. For on-site energy sources, conversion efficiencies will be collected from manufacturer’s data or periodic maintenance tests, like boiler combustion analyses. When a power utility produces district heating or cooling along with electricity, the conversion efficiency and source energy varies among each outputted energy distribution medium. Source energy is assigned proportionally to working fluid enthalpy drops associated with each medium.

PNNL-15217
32
Emissions associated with each quantity of source energy, if not directly available from the utility, can be determined using tools found online, such as the GHG Protocol’s tool to calculate CO2 emissions from stationary combustion. [86, 98] Peak Site Electricity Demand Peak site electricity demand will be collected from monthly electric utility bills in kW as measured by the electricity provider. Because the metric is defined in terms of 15-minute fixed window intervals, varying utility methods1 of determining peak electricity demand may alter the precise meaning of the quantity and reduce the value of the comparison. Metered data can be used to determine peak electricity demand, if peak demand is not provided on the utility bill or tracked by the utility. The same equipment used to meter or submeter electrical consumption can also record demand values. When possible, measurements should be made in 15-minute fixed window intervals.
7.3 Potential Issues and Lessons Learned Through the pilot test of the metrics and technical review by energy management experts, the following potential data collection and analysis issues have been raised.
• To measure “Total Building Energy Use” functional meters and/or detailed utility bills must be available for both the sustainable and baseline building.
• Peak demand on Federal campuses tends to be measured at a site level rather than a building level, which is why this metric is considered optional. Ideally peak demand would be measured for every building because it is an important metric with cost and performance implications as they contribute to the site total.
• Source energy offers the environmental impact of the energy use; however, it is likely to be the same for each building in a building set unless there is on-site generation or a building-specific purchase of green power.
• Energy end use metering with data collected electronically every 15 minutes is preferred to assess and optimize the building performance in addition to measuring it.
1 Utilities measure peak demand in a variety of ways, and some do not track the quantity. The 15-minute interval is the most common measure, but there are many variations in how peak is determined: fixed window, sliding window, or instantaneous; 1, 3, 5, 15, or 30-minute intervals. [2]

PNNL-15217
33
Chapter 8: Maintenance and Operations A primary aim of high-performance or sustainable design is occupant comfort and productivity. Achieving high performance might equate to monitoring water, energy, ventilation, and conditioning equipment and increasing preventative maintenance to avoid potential future problems, thus shifting operations and maintenance (O&M) expenditures from reparative to preventative activities. Table 8.1 provides the summary of the required and optional O&M metrics. This chapter offers an explanation of the selected O&M metrics and their relevance, guidance on how to collect and analyze data for each metric, and identification of potential issues and lessons learned that may be encountered with data collection or analysis. Performance metrics for operations maintenance were initially identified from the DOE FEMP O&M Best Practices: A Guide to Achieving Operational Efficiency and then adapted based on TAG input. [78]
Table 8.1 – Maintenance and Operations
Maintenance and Operations Metric Collection Units Required Building Maintenance $
hrs # requests by type # preventative maintenance # maintenance staff
Optional Grounds Maintenance $
hrs kg of hazardous chemicals used
Churn Cost churn
$ yearoccupant
movesbox
⋅
yearoccupantmoves furniture
⋅
yearoccupantmoves onconstructi
⋅
Some studies have documented reduced O&M costs for sustainably designed buildings [53], while others claim O&M costs increase but are offset by other savings such as worker productivity [55]. Interdependence in building systems means that a cost effective and highly-performing O&M program may cost more in training, monitoring, and preventative maintenance, but reduces the costs of occupant satisfaction and productivity, energy, water, and materials costs, and repair costs. The metrics for occupant satisfaction and productivity are discussed in Chapter 11: Indoor Environmental Quality. A holistic measurement of

PNNL-15217
34
building performance and costs, such as this protocol, will provide indicators of the impact of sustainable O&M practices.
8.1 Metric Discussion To determine which O&M metrics would best represent a building’s cost and performance, an O&M hierarchy was developed (see Figure 8.1). The result of this analysis along with the TAG recommendations resulted in the metrics found in Table 8.1. Building maintenance costs and service requests are required metrics because they represent building costs and impact occupant productivity. The optional metrics include grounds maintenance and churn costs. Grounds maintenance is considered optional because of the difficulty to measure data consistently across building sites. Multiple years of churn cost data are preferred for an accurate picture of the impact of moves.
Figure 8.1 – Operations and Maintenance Hierarchy Building Maintenance Definition Building maintenance includes in-house and contracted resources expended for building monitoring, repair, preventative maintenance, training, and response to service requests. It does not include grounds work or major renovations. Costs do not include O&M staff overhead. The number of maintenance personnel will also be used as a reference point. The requests include service requests as well as complaints. They are the building occupant requests to building personnel that require some action. Examples include temperature complaints and repair requests.
Maintenance & Operations
OperationsMaintenance
Building Maintenance
Grounds Maintenance EquipmentBuilding
Liability Costs Employee
SafetyRecord
Environmental Record
ChurnRate
Capacity Factor
Insurance# of Lawsuits
BoxMoves
ConstructionMoves
Occupant Satisfaction
FurnitureMoves
Work OrdersGenerated
Inventory Control
Janitorial services
PreventativeMaintenance
Overtime Worked
Time to Close
Backlog
Occupant Satisfaction
Hazardous Materials
OtherMaterials
Occupant Satisfaction
Hazardous Materials
Special Assignments
Inventory Control
PreventativeMaintenance
Overtime Worked
Time to Close
Backlog
Occupant Satisfaction
Hazardous Materials
OtherMaterials
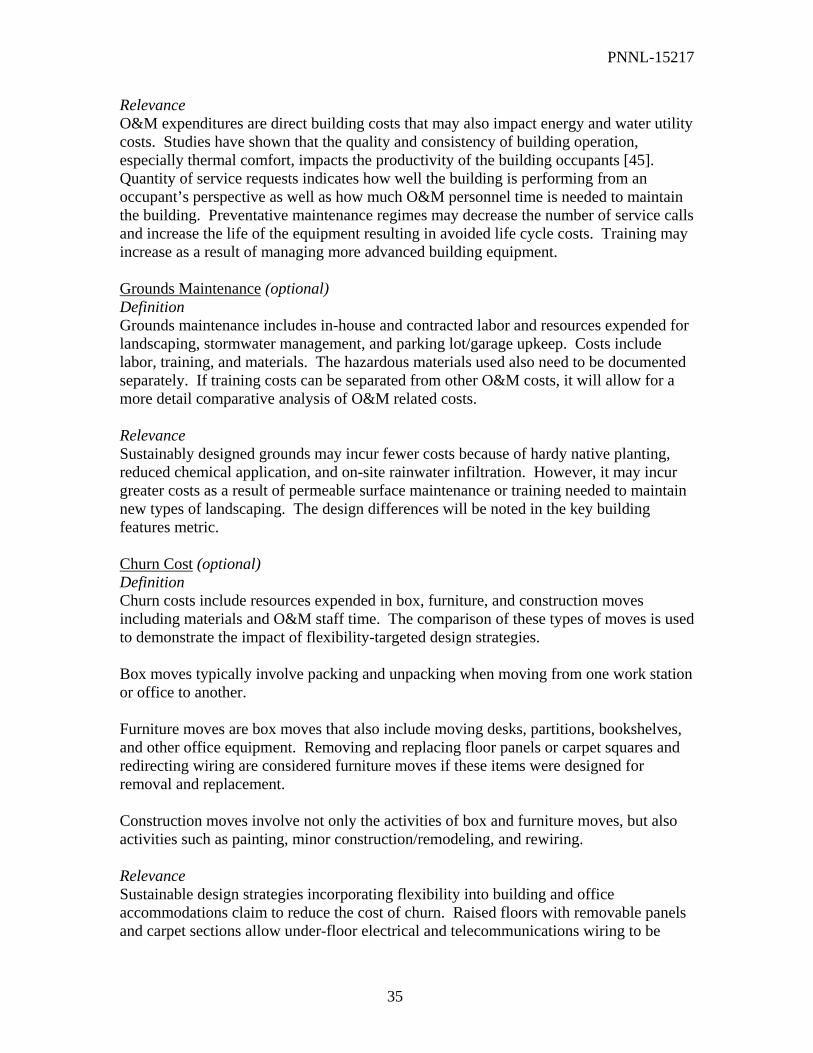
PNNL-15217
35
Relevance O&M expenditures are direct building costs that may also impact energy and water utility costs. Studies have shown that the quality and consistency of building operation, especially thermal comfort, impacts the productivity of the building occupants [45]. Quantity of service requests indicates how well the building is performing from an occupant’s perspective as well as how much O&M personnel time is needed to maintain the building. Preventative maintenance regimes may decrease the number of service calls and increase the life of the equipment resulting in avoided life cycle costs. Training may increase as a result of managing more advanced building equipment. Grounds Maintenance (optional) Definition Grounds maintenance includes in-house and contracted labor and resources expended for landscaping, stormwater management, and parking lot/garage upkeep. Costs include labor, training, and materials. The hazardous materials used also need to be documented separately. If training costs can be separated from other O&M costs, it will allow for a more detail comparative analysis of O&M related costs. Relevance Sustainably designed grounds may incur fewer costs because of hardy native planting, reduced chemical application, and on-site rainwater infiltration. However, it may incur greater costs as a result of permeable surface maintenance or training needed to maintain new types of landscaping. The design differences will be noted in the key building features metric. Churn Cost (optional) Definition Churn costs include resources expended in box, furniture, and construction moves including materials and O&M staff time. The comparison of these types of moves is used to demonstrate the impact of flexibility-targeted design strategies. Box moves typically involve packing and unpacking when moving from one work station or office to another. Furniture moves are box moves that also include moving desks, partitions, bookshelves, and other office equipment. Removing and replacing floor panels or carpet squares and redirecting wiring are considered furniture moves if these items were designed for removal and replacement. Construction moves involve not only the activities of box and furniture moves, but also activities such as painting, minor construction/remodeling, and rewiring. Relevance Sustainable design strategies incorporating flexibility into building and office accommodations claim to reduce the cost of churn. Raised floors with removable panels and carpet sections allow under-floor electrical and telecommunications wiring to be

PNNL-15217
36
moved without construction work and movable partitions can replace constructed walls for ease in altering spaces. Quantifying churn costs will provide a relative measure for evaluating strategy effectiveness.
8.2 Data Collection and Calculations Building managers will be interviewed to determine the best information sources such as work orders, service requests, or a computerized maintenance management system. Every effort should be made to assess incurred costs as opposed to budgeted costs, which may not directly reflect the O&M costs of a building. Note that churn cost values are better determined over a period of several years; therefore the meaningfulness and comparability of gathered data will be evaluated on a case by case basis. If the sustainably design building and the baseline have identical O&M policies, such as landscaping, pest control, cleaning, or monitoring practices, it may be difficult to demonstrate a difference in O&M costs with these metrics.
8.3 Potential Issues and Lessons Learned Through the pilot test of the metrics and technical review by operations and maintenance experts, the following potential data collection and analysis issues have been raised.
• Outsourced building maintenance may make it difficult to collect information. • Comparing sustainably and typically designed buildings may be difficult when
they are maintained in different ways. • Adjustments made to a new facility may or may not be included consistently in
the service request tracking system. It is important for the building management to explain what types of information is being tracked consistently.
• Grounds maintenance for shared landscaping areas may need to be addressed. • 1-year of churn cost data may not be representative of the building performance,
as moves occur for various reasons.

PNNL-15217
37
Chapter 9: Waste Generation Waste disposal is a utility cost incurred by buildings that is an indicator of resource use by the building occupants. Table 9.1 provides the summary of the required and optional waste generation metrics. This chapter offers an explanation of the selected waste generation metrics and their relevance, guidance on how to collect and analyze data for each metric, and identification of potential issues and lessons learned that may be encountered with data collection or analysis.
Table 9.1 – Waste Generation
Waste Generation Metric Collection Units Required Solid Sanitary Waste
monthyd 3
month
ton month
$
Optional Hazardous Waste
yeargal
yearkg
year$
Recycled Materials month
ft 3
month
ton month
$
Most waste data collection methodologies have been developed for the purposes of targeting effective waste reduction strategies rather than for collecting standardized data sets for multiple buildings [90]. Utilities or municipalities often set waste rates based on the volume of compacted waste, number of pickups, or dumpster size, but landfill tipping costs are on a unit mass basis. Because regional costs of recycling and waste disposal vary widely, volume, mass, and cost values are collected and analyzed for this metric.
9.1 Metric Discussion To determine which waste generation metrics would best represent a building’s cost and performance, a hierarchy was developed (see Figure 9.1). The result of this analysis along with the TAG recommendations resulted in the waste generation metrics found in Table 9.1. Solid sanitary waste is the required metric because it is the easiest to collect of the metrics in this category and it represents costs and resource use within the building. The optional recycling and hazardous waste metrics offer useful information about the performance and cost of the building, however were determined to be more difficult to collect.

PNNL-15217
38
Figure 9.1 – Waste Generation Hierarchy Solid Sanitary Waste Definition The sanitary waste metric measures non-hazardous waste, also known as garbage, generated by building occupants and disposed of in a dumpster for pickup and delivery to a landfill or incinerator. Solid sanitary waste output will be reported in volume, mass, and dollars. Values will be normalized both on an occupant basis and on a gross building interior area basis. Relevance Low amounts of sanitary waste disposal may represent greater access to recycling containers, occupant values, or policies of reducing material use, reusing materials, or aggressive recycling within the building. Hazardous Waste (optional) Definition Building-specific hazardous materials may include cleaning, pest management, and landscaping chemicals. The purchase of these materials will be tracked in the environmentally preferable purchasing metric, but disposal of the materials, typically because of cleanout or overstock of supplies, would be included here. Hazardous waste output will be reported in volume, mass, and dollars. Values will be normalized both on an occupant basis, and on a gross building interior area basis. Relevance Most building functions can be maintained at a high level of quality with non-hazardous materials. Having hazardous materials at a building site increases human health risks, disposal costs, and chemical maintenance costs.
Waste Output
Hazardous WasteSolid Sanitary Waste
Landfill Diverted
Composted ReusedRecycled
Paper SpecialGlass Metal
Recycled Incinerated
Hazard Level
Aluminum Tin
Office Mixed Batteries Electronics Light Bulbs
Brown Green Clear
Waste Output
Hazardous WasteSolid Sanitary Waste
Landfill Diverted
Composted ReusedRecycled
Paper SpecialGlass Metal
Recycled Incinerated
Hazard Level
Aluminum Tin
Office Mixed Batteries Electronics Light Bulbs
Brown Green Clear
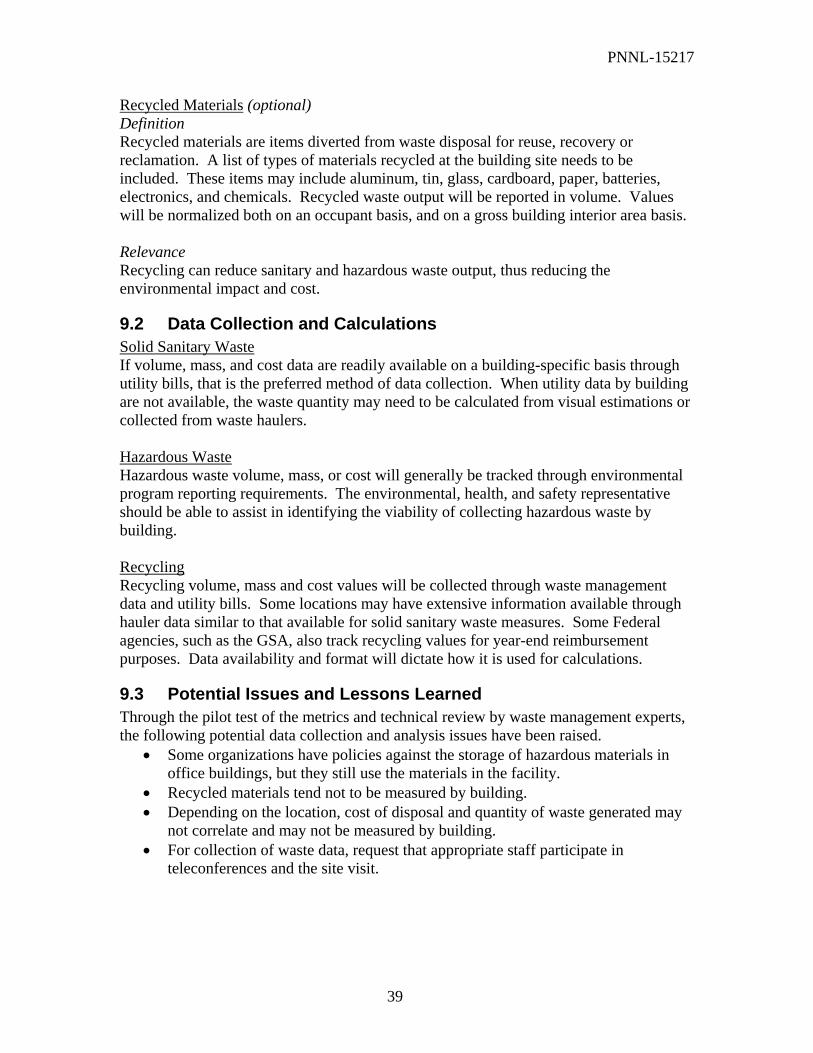
PNNL-15217
39
Recycled Materials (optional) Definition Recycled materials are items diverted from waste disposal for reuse, recovery or reclamation. A list of types of materials recycled at the building site needs to be included. These items may include aluminum, tin, glass, cardboard, paper, batteries, electronics, and chemicals. Recycled waste output will be reported in volume. Values will be normalized both on an occupant basis, and on a gross building interior area basis. Relevance Recycling can reduce sanitary and hazardous waste output, thus reducing the environmental impact and cost.
9.2 Data Collection and Calculations Solid Sanitary Waste If volume, mass, and cost data are readily available on a building-specific basis through utility bills, that is the preferred method of data collection. When utility data by building are not available, the waste quantity may need to be calculated from visual estimations or collected from waste haulers. Hazardous Waste Hazardous waste volume, mass, or cost will generally be tracked through environmental program reporting requirements. The environmental, health, and safety representative should be able to assist in identifying the viability of collecting hazardous waste by building. Recycling Recycling volume, mass and cost values will be collected through waste management data and utility bills. Some locations may have extensive information available through hauler data similar to that available for solid sanitary waste measures. Some Federal agencies, such as the GSA, also track recycling values for year-end reimbursement purposes. Data availability and format will dictate how it is used for calculations.
9.3 Potential Issues and Lessons Learned Through the pilot test of the metrics and technical review by waste management experts, the following potential data collection and analysis issues have been raised.
• Some organizations have policies against the storage of hazardous materials in office buildings, but they still use the materials in the facility.
• Recycled materials tend not to be measured by building. • Depending on the location, cost of disposal and quantity of waste generated may
not correlate and may not be measured by building. • For collection of waste data, request that appropriate staff participate in
teleconferences and the site visit.

PNNL-15217
40
Chapter 10: Purchasing Environmentally preferable purchasing (EPP) of building related supplies represents a commitment by the building management team to reduce the environmental impact of the building and to minimize the operational risks to human health. According to the Resource Conservation and Recovery Act (RCRA), Federal agencies and their contractors must give preference in their purchasing programs to products and practices that conserve and protect natural resources and the environment. [75] The Farm Security and Rural Investment Act stated that Federal agencies must give preference in their purchasing programs to biobased products. [33] Executive Orders (EO) have been the implementation tool for environmentally preferable purchasing. EO 13101 emphasizes purchasing products with recycled content. EO 13123 emphasizes energy and water efficient equipment and practices. EO 13143 emphasizes purchasing biobased products. Table 10.1 provides the summary of the environmentally preferable purchasing metrics, which are considered optional. This chapter offers an explanation of the EPP metric selection and relevance, guidance on how to collect and analyze data for each metric, and identification of potential issues and lessons learned that may be encountered with data collection or analysis. The EPP metric is optional because it is expected these data will be difficult to collect on a building-by-building basis.
Table 10.1 Purchasing
Purchasing Metric Collection Units Optional Environmentally Preferable Purchasing (EPP) year
All$
yearEPP$
10.1 Metric Discussion To determine which EPP metrics would best represent a building’s cost and performance, a hierarchy of building related purchase was developed (see Figure 10.1). The result of this analysis along with the TAG recommendations resulted in the metrics found in Table 10.1. Although these metrics are optional, they are important and data should be gathered whenever feasible, however they are likely to be difficult to collect in a consistent manner.
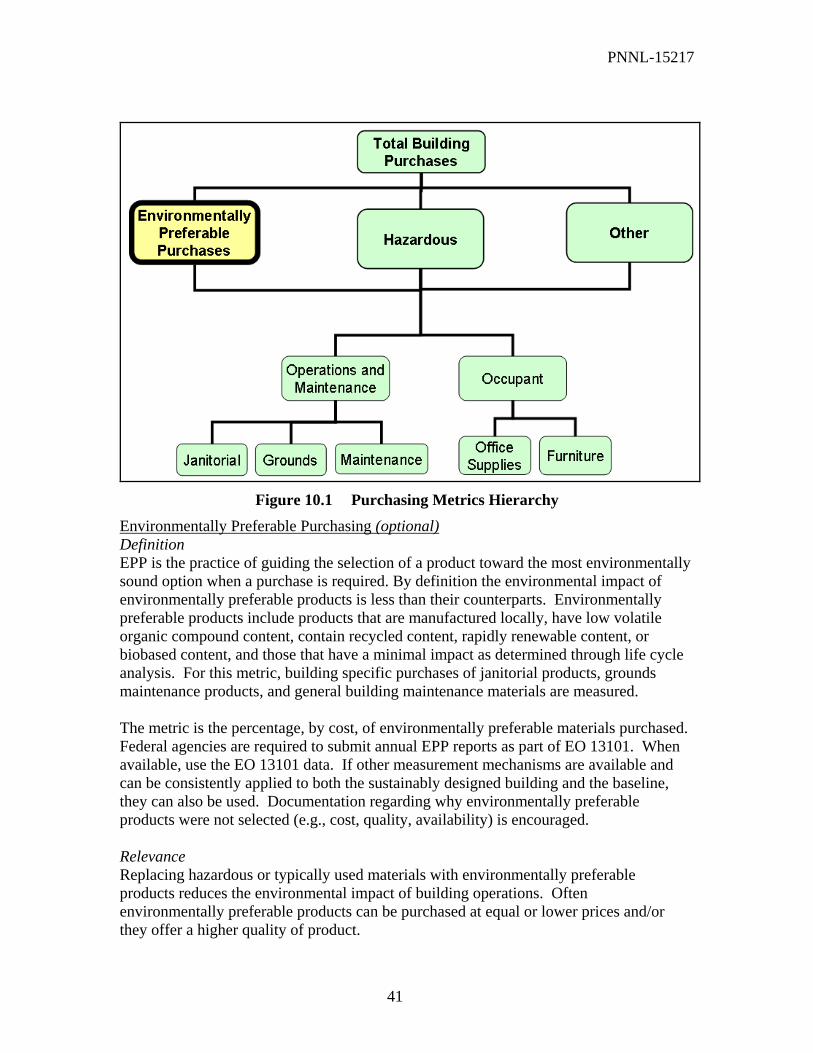
PNNL-15217
41
Figure 10.1 Purchasing Metrics Hierarchy
Environmentally Preferable Purchasing (optional) Definition EPP is the practice of guiding the selection of a product toward the most environmentally sound option when a purchase is required. By definition the environmental impact of environmentally preferable products is less than their counterparts. Environmentally preferable products include products that are manufactured locally, have low volatile organic compound content, contain recycled content, rapidly renewable content, or biobased content, and those that have a minimal impact as determined through life cycle analysis. For this metric, building specific purchases of janitorial products, grounds maintenance products, and general building maintenance materials are measured. The metric is the percentage, by cost, of environmentally preferable materials purchased. Federal agencies are required to submit annual EPP reports as part of EO 13101. When available, use the EO 13101 data. If other measurement mechanisms are available and can be consistently applied to both the sustainably designed building and the baseline, they can also be used. Documentation regarding why environmentally preferable products were not selected (e.g., cost, quality, availability) is encouraged. Relevance Replacing hazardous or typically used materials with environmentally preferable products reduces the environmental impact of building operations. Often environmentally preferable products can be purchased at equal or lower prices and/or they offer a higher quality of product.

PNNL-15217
42
10.2 Data Collection and Calculations Purchasing values will be gathered using the quarterly or annual report data for environmentally preferable purchasing, as directed by EO 13101. Environmentally Preferable Purchasing Data regarding EPP and the comparison to the total number of building related purchases may be available from the building manager, purchasing and contract personnel, or environmental safety and health personnel. It may be helpful to know what organization prepares the EO 13101 annual report. For purposes of the building performance measurement, it is recommended that only janitorial supplies and building equipment be included in these metrics. The same categories of items must be measured for the baseline and sustainably designed buildings to provide for a valid comparison (e.g., janitorial products data would need to be collected for both building data sets).
10.3 Potential Issues and Lessons Learned Through the pilot test of the metrics and technical review by EPP experts, the following potential data collection and analysis issues have been raised:
• Availability of the EO 13101 information by individual building is unlikely. • Need to measure same types of purchases between buildings. • Need to measure only those purchases that are relevant to building operations
(e.g., not copy paper purchases). • For collection of purchasing data, request that appropriate staff participate in
teleconferences and the site visit.

PNNL-15217
43
Chapter 11: Indoor Environmental Quality Indoor environmental quality (IEQ) of a workplace reflects the interaction of air, lighting, and surroundings with occupants in a holistic sense. Effects include occupant health, productivity, and satisfaction. Table 11.1 provides the summary of the IEQ metrics. This chapter offers an explanation of the IEQ metric selection and relevance, guidance on how to collect and analyze data for each metric, and identification of potential issues and lessons learned that may be encountered with data collection or analysis.
Table 11.1 Indoor Environmental Quality
Indoor Environmental Quality (IEQ) Metric Collection Units Required Occupant Turnover Rate
year
turnover
Absenteeism yearoccupant
absentees⋅
Building Occupant Satisfaction and Self-Rated Productivity
11.1 Metric Discussion A variety IEQ methods and measures have been developed for building evaluations and case studies. The National Australian Built Environment Rating System (NABERS) [7] specifies a set of IAQ metrics as part of their scoring. The Post Occupancy Review of Buildings and their Engineering (PROBE) [30] has employed occupant satisfaction benchmarking along with indoor air pollutant levels. A LEEDTM building evaluation being conducted for The City of Seattle by Paladino & Co, Inc. [70] is simultaneously evaluating productivity-related metrics from human resources records, daylighting study results, and survey responses. American Society of Heating, Refrigeration, and Air Conditioning Engineers (ASHRAE) Standards 62 and 55 [4] have defined building performance characteristics for indoor air quality (IAQ) and thermal comfort, respectively. Optimal lighting levels are indicated the by the Illuminance Selection Procedure of the Illuminating Engineering Society of North America’s (IESNA) Lighting Handbook [51]. IEQ conditions outlined in these standards are largely followed in building industry practice. IEQ metrics can include continuous or spot measures of conditions such as temperature, relative humidity, and luminescence and levels of indoor air pollutants such as carbon dioxide, carbon monoxide, ozone, formaldehyde, total or individual volatile organic compounds (VOC), airborne viable bacteria, fungi, mold, and respirable dust. Occupant surveys, maintenance data, and human resource records can give additional information about the occupant response to the working environment.
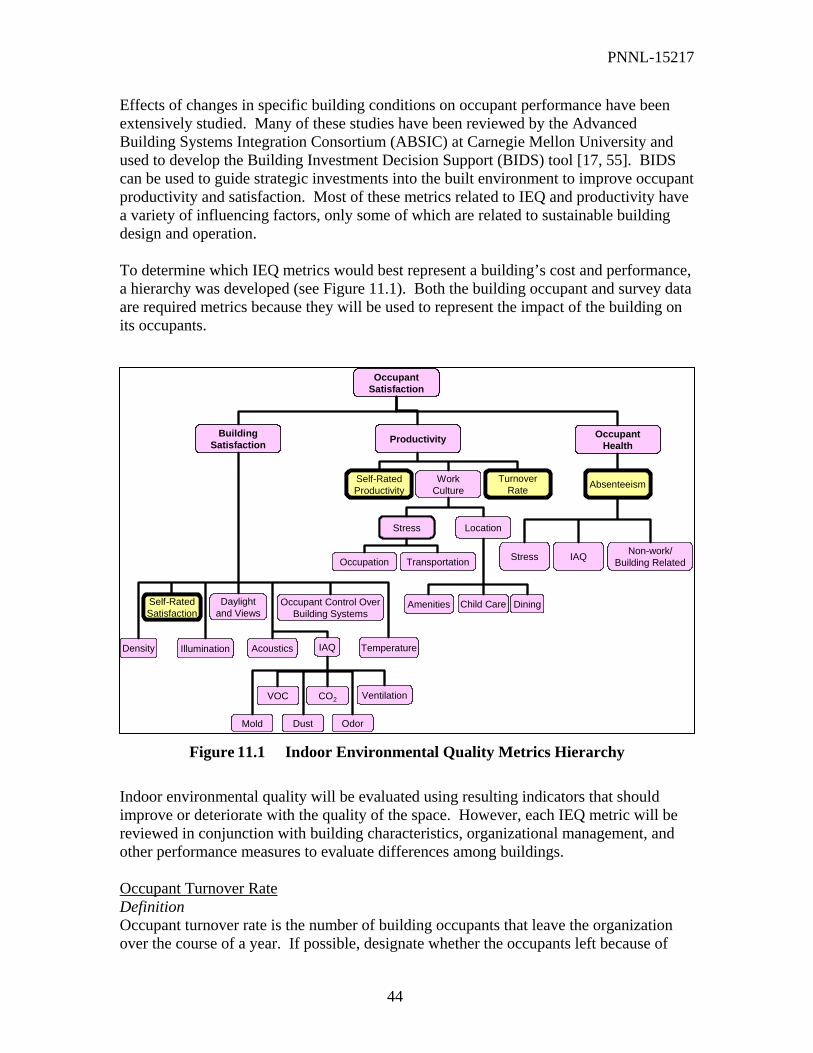
PNNL-15217
44
Effects of changes in specific building conditions on occupant performance have been extensively studied. Many of these studies have been reviewed by the Advanced Building Systems Integration Consortium (ABSIC) at Carnegie Mellon University and used to develop the Building Investment Decision Support (BIDS) tool [17, 55]. BIDS can be used to guide strategic investments into the built environment to improve occupant productivity and satisfaction. Most of these metrics related to IEQ and productivity have a variety of influencing factors, only some of which are related to sustainable building design and operation. To determine which IEQ metrics would best represent a building’s cost and performance, a hierarchy was developed (see Figure 11.1). Both the building occupant and survey data are required metrics because they will be used to represent the impact of the building on its occupants.
Figure 11.1 Indoor Environmental Quality Metrics Hierarchy
Indoor environmental quality will be evaluated using resulting indicators that should improve or deteriorate with the quality of the space. However, each IEQ metric will be reviewed in conjunction with building characteristics, organizational management, and other performance measures to evaluate differences among buildings. Occupant Turnover Rate Definition Occupant turnover rate is the number of building occupants that leave the organization over the course of a year. If possible, designate whether the occupants left because of
Occupant Satisfaction
ProductivityBuilding Satisfaction
AcousticsIllumination IAQ
Occupant Control Over Building Systems
Density Temperature
TurnoverRate
Daylight and Views
Self-Rated Satisfaction
WorkCulture
Self-Rated Productivity
Mold OdorDust
VOC CO2 Ventilation
Stress Location
DiningAmenities Child Care
Occupation Transportation
OccupantHealth
Absenteeism
Non-work/Building RelatedStress IAQ
PNNL-15217
45
resignation, termination, or retirement and provide further detail on reasons for resignation. The ratio of turnover to total number of occupants is a retention indicator that will be used as part of the comparative building analysis. Relevance Employee turnover costs time and money. Increased costs associated with training, churn, recruitment, severance, and downtime are impacts of turnover. The occupant satisfaction survey, the turnover rate, and absenteeism will be used to indicate the cost and performance impact of IEQ. Absenteeism Definition Absenteeism is the number of days that an occupant is away from work for health reasons. Relevance A healthy, satisfying, and productive work environment may be reflected in low absenteeism rates. Occupant absenteeism is an indicator of productivity. Absenteeism information along with occupant pay information can be used to determine a cost for work days lost. Building Occupant Satisfaction Definition Building occupant satisfaction is a relative measure of comfort, environment, and indoor air quality as determined with a survey. Ratings range from low to high satisfaction. Relevance A satisfying work environment has been correlated with staff retention and increased productivity. Self-Rated Productivity Definition Self-rated productivity is a relative measure of an occupant’s productivity. Ratings range from low to high productivity. Relevance Employee costs are the largest organizational costs over time. Occupant perception on how a building’s IEQ affects productivity and the quality of work offers an indicator of potential building-related organizational costs.
11.2 Data Collection and Calculations Occupant Turnover Rate Turnover rates for the occupants of the building will be gathered on a monthly basis from management records. Details regarding specific building occupants must be kept confidential.

PNNL-15217
46
Absenteeism Absenteeism rates for the occupants of the building will be gathered on a monthly basis from management records. Details regarding specific building occupants must be kept confidential. Building Occupant Satisfaction Satisfaction and other occupant-reported IEQ values can be gathered using surveys of building occupants. Core IEQ survey questions are related to office layout, office furnishings, thermal comfort, air quality, lighting, acoustics, cleanliness and maintenance. The rule of thumb for a reliable survey response rate is 60% for meaningful results. However, reasonable data can be gathered with as low as 20% response from very large building populations on the scale of 1000 occupants or necessitate 100% response from very small populations. During the pilot text of the protocol, these data were collected using an online survey conducted by the Center for the Built Environment (CBE) at the University of California Berkeley [18]. CBE compiled the survey data with an existing reporting tool and provided a summary data report. CBE survey setup information can be found in Appendix D and a copy of the survey questions can be found in Appendix E. Self-Rated Productivity Self-rated productivity and other occupant-reported IEQ values can also be gathered using data surveys of building occupants.
11.3 Potential Issues and Lessons Learned Through the pilot test of the metrics and technical review by IEQ experts, the following potential data collection and analysis issues have been raised.
• Organizational policies and procedures may impact the differences between buildings.
• Attributing a cost savings to the building satisfaction and productivity may be difficult for audiences to understand.
• Survey return rate needs to be high enough to provide statistically relevant results. • For collection of indoor environmental quality data, recognize that there may be a
need to address union officials, security, management, and/or senior organization officials.
• If the CBE survey is not used, compilation of survey data will be difficult if the questions and data collection methods vary greatly.

PNNL-15217
47
Chapter 12: Transportation Transportation to a building reflects the impact of siting and the building occupant environmental ethic. Table 12.1 provides the summary of the required and optional transportation metrics. This chapter offers an explanation of the transportation metric selection and relevance, guidance on how to collect and analyze data for each metric, and identification of potential issues and lessons learned that may be encountered with data collection or analysis.
Table 12.1 Transportation
Transportation Metric Collection Units Required Regular Commute mpg
weekmiles
12.1 Metric Discussion Transportation metrics have been investigated primarily to estimate carbon emissions associated with building occupant choices. The National Australian Building Environmental Rating System (NABERS) has an approach for determining transportation mileage and associated emissions [7]. The NABERS approach uses paper surveys distributed to occupants to determine weekly number of trips, mode of transportation, and distance of trips. From standard fuel economy values for each transportation type, carbon emissions per occupant are calculated. Other methods for determining emissions from travel are employed by the California Climate Action Registry, Greenhouse Gas Reporting Protocol, International Council for Local Environmental Initiatives (ICLEA), and the Sustainable Silicon Valley. [13, 14, 81, 98] Some of these efforts are related to calculating emissions from company fleets, from work-related travel, or from whole-community sources. These employ available documentation such as logged miles and purchased fuel for a company or Department of Motor Vehicles (DMV) traffic estimates and local fuel sales for a community. For determining CO2 emissions, the most relevant information is the quantity of fuel consumed; for determining CH4 or N2O, the most relevant data are vehicle specifications and distance traveled. Fuel economy and GHG emissions information can be found for most passenger vehicles. [91] To determine which transportation metrics would best represent a building’s cost and performance, a hierarchy was developed (see Figure 12.1). The result of this analysis along with the TAG recommendations resulted in the metrics found in Table 12.1. The transportation metric is required because of the ease of data collection and also because it will offer another occupant perspective.
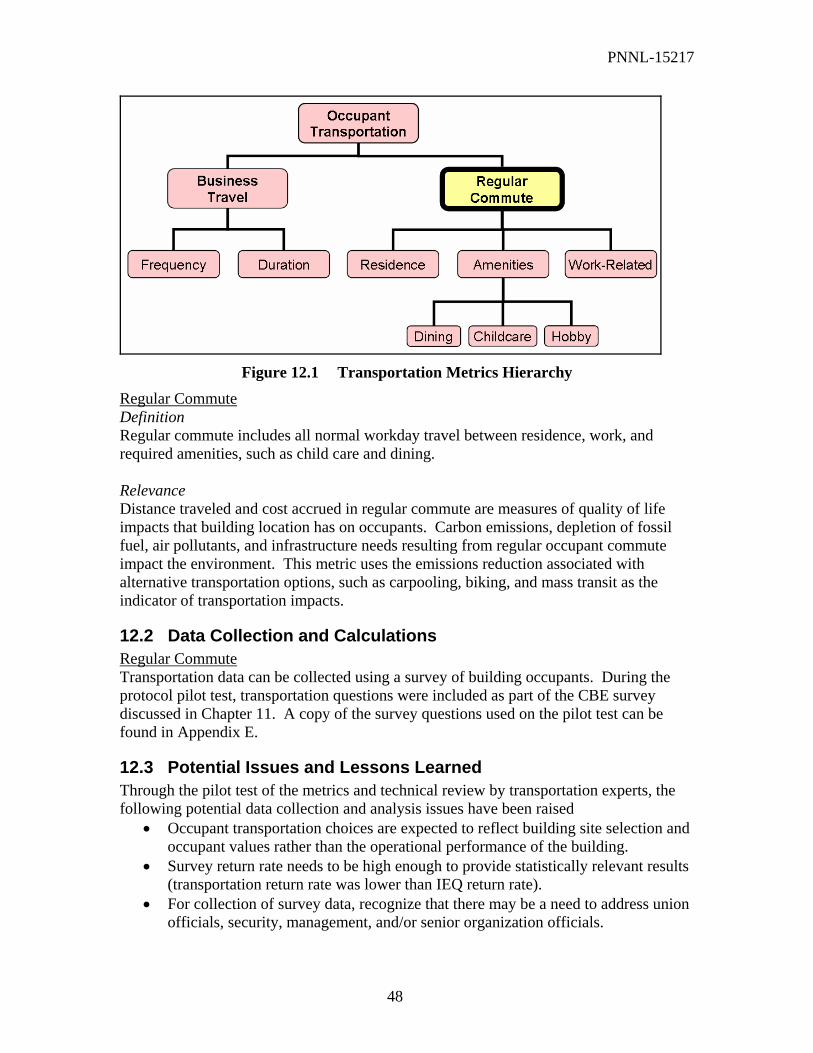
PNNL-15217
48
Figure 12.1 Transportation Metrics Hierarchy
Regular Commute Definition Regular commute includes all normal workday travel between residence, work, and required amenities, such as child care and dining. Relevance Distance traveled and cost accrued in regular commute are measures of quality of life impacts that building location has on occupants. Carbon emissions, depletion of fossil fuel, air pollutants, and infrastructure needs resulting from regular occupant commute impact the environment. This metric uses the emissions reduction associated with alternative transportation options, such as carpooling, biking, and mass transit as the indicator of transportation impacts.
12.2 Data Collection and Calculations Regular Commute Transportation data can be collected using a survey of building occupants. During the protocol pilot test, transportation questions were included as part of the CBE survey discussed in Chapter 11. A copy of the survey questions used on the pilot test can be found in Appendix E.
12.3 Potential Issues and Lessons Learned Through the pilot test of the metrics and technical review by transportation experts, the following potential data collection and analysis issues have been raised
• Occupant transportation choices are expected to reflect building site selection and occupant values rather than the operational performance of the building.
• Survey return rate needs to be high enough to provide statistically relevant results (transportation return rate was lower than IEQ return rate).
• For collection of survey data, recognize that there may be a need to address union officials, security, management, and/or senior organization officials.
PNNL-15217
49
V. Project Results This section offers examples of the reporting options for the building cost and performance data and a brief status report on the protocol development project. The metrics were selected, in part, for their versatility in reporting ability. The collected data can be manipulated in variety ways to express the results in a format that meets the audience’s needs.
Chapter 13: Data Analysis and Reporting Throughout the collection of data, it is recommended the data be reviewed and compared to ensure it will be usable. Samples of tools for data collection, compilation and analysis can be found in Appendix D. Sorting the building and site characteristics data as well as the monthly building cost and performance data in one table is recommended for facilitate data analysis. Once a minimum of 12 months of data have been collected for the building set, the building performance and cost data can be compared. First summarize the metric data for each of the buildings. Next, compare the data between the sustainably designed building and baseline side-by-side to identify the key findings. Depending on the target audience for the key findings, the data could be shared in a variety of ways. An existing communication tool for the sustainably designed building performance data is the U.S. Department of Energy’s Federal Energy Management Program’s Federal portal to the High Performance Buildings Database. [83] It is recommended that case studies be included in the High Performance Buildings Database and shared with the FEMP Interagency Sustainability Working Group. For the purposes of the protocol development project, the selected the primary audience of the findings was Federal financial decision makers. A report format with some sample data was prepared to address the following communication needs:
• Focus on measurable costs; • Provide background, more detailed cost data to support summary costs; • Share building related performance, environmental impact, and productivity data
for further explanation of the findings; and • Share as much information as possible in a small, easy to understand fashion.
Figure 13.1 offers a snapshot of the four-page sample report (full-sized version in Appendix F). The report was kept intentionally brief and cost focused in order to capture the attention of the financial decision maker audience. The chart considered key to the communications with the financial decision maker is the cost avoidance summary chart on page one of the sample report (Figure 13.2). Additional information could be prepared from the collected data to address different audience needs or to supplement and explain the building performance comparisons. Data representation possibilities not shown in the sample report include:
• water use data (monthly or annual), • storm sewer data (monthly or annual), • source energy impact,
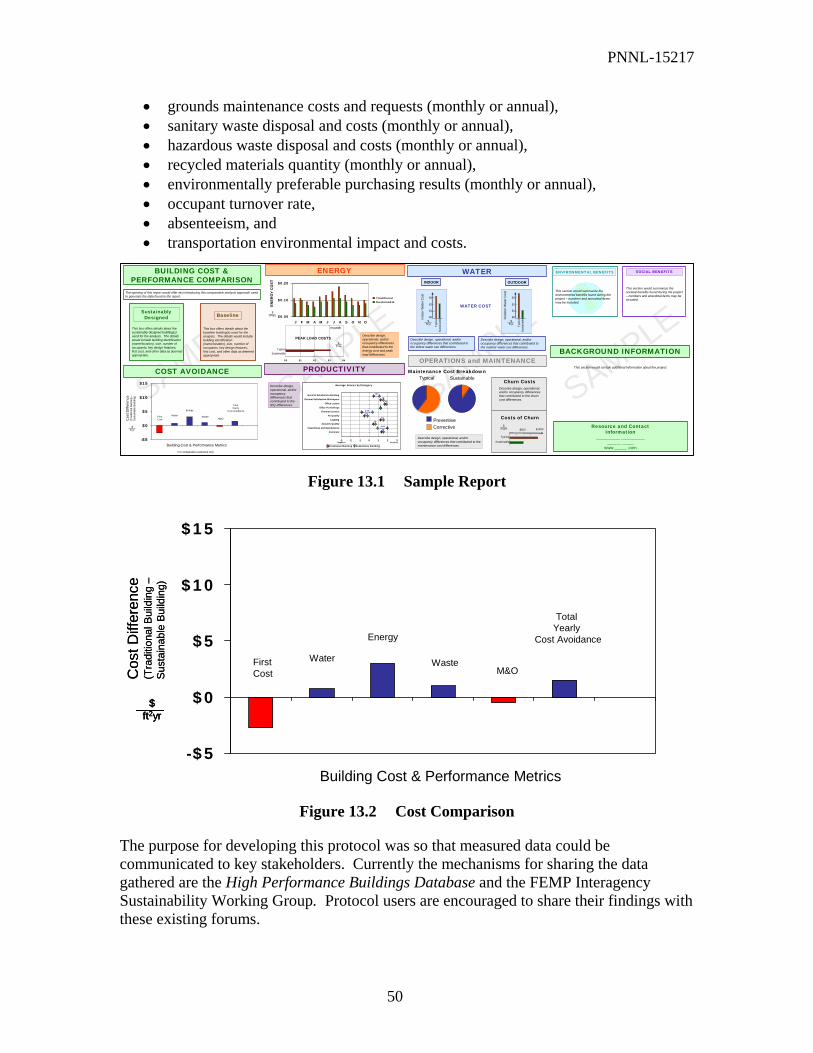
PNNL-15217
50
• grounds maintenance costs and requests (monthly or annual), • sanitary waste disposal and costs (monthly or annual), • hazardous waste disposal and costs (monthly or annual), • recycled materials quantity (monthly or annual), • environmentally preferable purchasing results (monthly or annual), • occupant turnover rate, • absenteeism, and • transportation environmental impact and costs.
Figure 13.1 Sample Report
Figure 13.2 Cost Comparison
The purpose for developing this protocol was so that measured data could be communicated to key stakeholders. Currently the mechanisms for sharing the data gathered are the High Performance Buildings Database and the FEMP Interagency Sustainability Working Group. Protocol users are encouraged to share their findings with these existing forums.
SAMPLE
BUILDING COST & PERFORMANCE COMPARISON
The opening of this report would offer text introducing this comparative analysis approach used to generate the data found in the report.
For comparative purposes only.
COST AVOIDANCE
-$ 5
$ 0
$ 5
$1 0
$1 5
FirstCost
Water
Energy
M&O
Total Yearly
Cost Avoidance
Cos
t Diff
eren
ce
(Tra
ditio
nal B
uild
ing
–Su
stai
nabl
e Bu
ildin
g)
$ft2yr
Waste
Building Cost & Performance Metrics
This box offers details about the baseline building(s) used for the analysis. The details would include building identification (name/location), size, number of occupants, key design features, first cost, and other data as deemedappropriate.
This box offers details about the sustainably designed building(s)used for the analysis. The details would include building identification (name/location), size, number of occupants, key design features, first cost, and other data as deemedappropriate.
SustainablyDesigned Baseline
SAMPLE$0 .00
$0 .10
$0 .20
J F M A M J J A S O N D
Tra d itio n alS ustain ab le
$ft2mo
month
EN
ERG
Y C
OS
T
PRODUCTIVITY
Describe design, operational, and/or occupancy differences that contributed to the IEQ differences.
Describe design, operational, and/or occupancy differences that contributed to the energy cost and peak load differences.
ENERGY
PEAK LOAD COSTS
Sustainable
$0 $1 $2 $3 $4
Typical
$ft2mo
Average Scores by Category
-3 -2 -1 0 1 2 3
Tra ditional Building Susta inable Building
General Satisfaction-Building
General Satisfaction-Workspace
Office Layout
Office Furnishings
Thermal Comfort
Air Quality
Lighting
Acoustic Quality
Cleanliness and Maintenance
Commute
Negative Positive
.66
.14
.13
0
1.02.34
.13
. 15
-1.03.14
SAMPLE
WATER
OPERATIONS and MAINTENANCE
WATER COST
$0
$1
$2
$3
Typi
cal
Sust
aina
ble$
ft2yr
Indo
or W
ater
Cos
t
INDOOR
$0
$1
$2
$3
Typi
cal
Sus
tain
able$
ft2yr
Out
door
Wat
er C
ost
OUTDOOR
Describe design, operational, and/or occupancy differences that contributed to the indoor water use differences.
Describe design, operational, and/or occupancy differences that contributed to the outdoor water use differences.
Maintenance Cost Breakdown
Churn Costs
Costs of Churn
$500 $1000
Typical
Sustainable
$move
Describe design, operational, and/or occupancy differences that contributed to the churn cost differences.
Typical Sustainable
PreventiveCorrective
Describe design, operational, and/or occupancy differences that contributed to the maintenance cost differences.
SAMPLE
ENVIRONMENTAL BENEFITS
This section would summarize the environmental benefits found during the project – numbers and anecdotal items may be included.
SOCIAL BENEFITS
BACKGROUND INFORMATION
This section would contain additional information about the project.
Resource and ContactInformation
__________ ________________ _____
www._____ .com
This section would summarize the societal benefits found during the project – numbers and anecdotal items may be included.
-$ 5
$ 0
$ 5
$ 1 0
$ 1 5
FirstCost
Water
Energy
M&O
Total Yearly
Cost Avoidance
Cos
t Diff
eren
ce
(Tra
ditio
nal B
uild
ing
–Su
stai
nabl
e Bu
ildin
g)
$ft2yr
Cos
t Diff
eren
ce
(Tra
ditio
nal B
uild
ing
–Su
stai
nabl
e Bu
ildin
g)
$ft2yr
$ft2yr
Waste
Building Cost & Performance Metrics
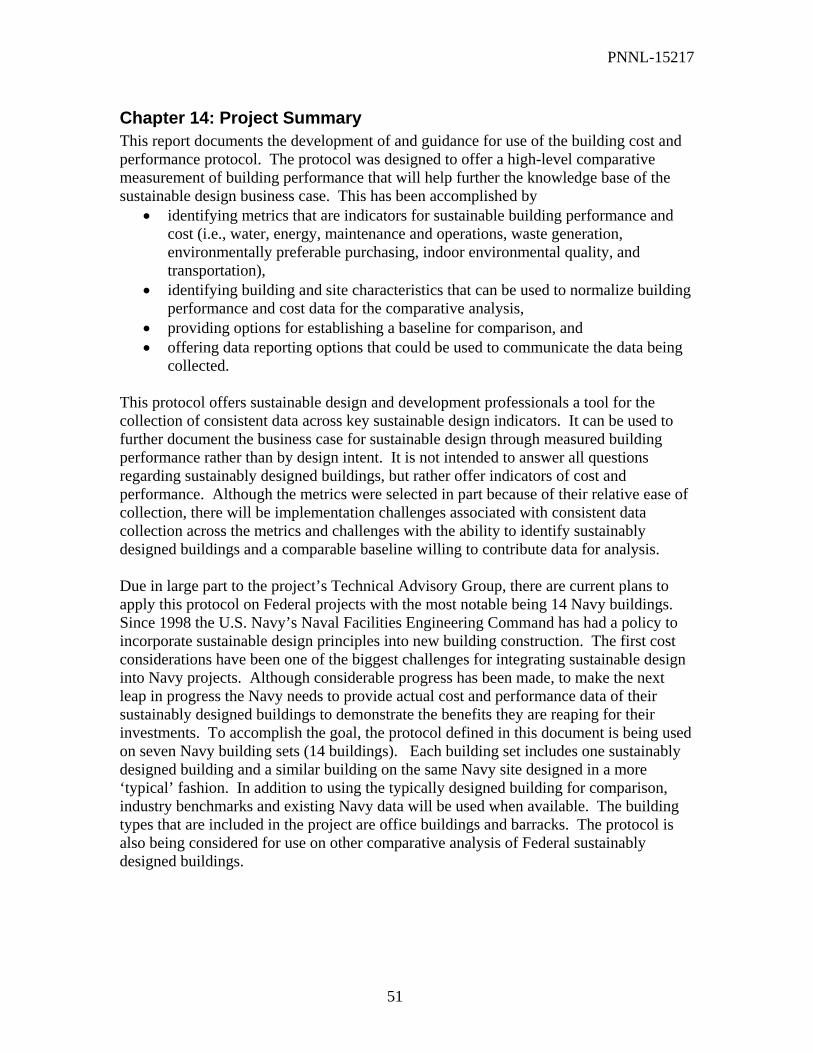
PNNL-15217
51
Chapter 14: Project Summary This report documents the development of and guidance for use of the building cost and performance protocol. The protocol was designed to offer a high-level comparative measurement of building performance that will help further the knowledge base of the sustainable design business case. This has been accomplished by
• identifying metrics that are indicators for sustainable building performance and cost (i.e., water, energy, maintenance and operations, waste generation, environmentally preferable purchasing, indoor environmental quality, and transportation),
• identifying building and site characteristics that can be used to normalize building performance and cost data for the comparative analysis,
• providing options for establishing a baseline for comparison, and • offering data reporting options that could be used to communicate the data being
collected. This protocol offers sustainable design and development professionals a tool for the collection of consistent data across key sustainable design indicators. It can be used to further document the business case for sustainable design through measured building performance rather than by design intent. It is not intended to answer all questions regarding sustainably designed buildings, but rather offer indicators of cost and performance. Although the metrics were selected in part because of their relative ease of collection, there will be implementation challenges associated with consistent data collection across the metrics and challenges with the ability to identify sustainably designed buildings and a comparable baseline willing to contribute data for analysis. Due in large part to the project’s Technical Advisory Group, there are current plans to apply this protocol on Federal projects with the most notable being 14 Navy buildings. Since 1998 the U.S. Navy’s Naval Facilities Engineering Command has had a policy to incorporate sustainable design principles into new building construction. The first cost considerations have been one of the biggest challenges for integrating sustainable design into Navy projects. Although considerable progress has been made, to make the next leap in progress the Navy needs to provide actual cost and performance data of their sustainably designed buildings to demonstrate the benefits they are reaping for their investments. To accomplish the goal, the protocol defined in this document is being used on seven Navy building sets (14 buildings). Each building set includes one sustainably designed building and a similar building on the same Navy site designed in a more ‘typical’ fashion. In addition to using the typically designed building for comparison, industry benchmarks and existing Navy data will be used when available. The building types that are included in the project are office buildings and barracks. The protocol is also being considered for use on other comparative analysis of Federal sustainably designed buildings.

PNNL-15217
52
Page left blank intentionally.

PNNL-15217
53
Appendices
Appendix A: Abbreviations and Acronyms ANSI American National Standards Institute ASHRAE American Society of Heating, Refrigerating and Air-Conditioning
Engineers ASTM American Society for Testing and Materials BEMS Building Energy Monitoring System BIDS Building Investment Decision Support BOMA Building Owners and Managers Association Btu British Thermal Units CAA Clean Air Act CDD cooling degree days CDD65 cooling degree days at base 65°F CO carbon monoxide CO2 carbon dioxide CO2e carbon dioxide equivalent DOE U.S. Department of Energy ECM energy conservation measure EEM energy efficiency measure EERE Office of Energy Efficiency and Renewable Energy EMS Environmental Management System EPP Environmentally Preferable Purchasing ESCO energy service company ESP energy service provider EUI energy use intensity FEMP Federal Energy Management Program GHG greenhouse gas GPS global positioning system GSA General Services Administration GWP global warming potential HDD heating degree days HDD65 heating degree days at base 65°F HVAC heating ventilation air conditioning IAQ indoor air quality ICLEI International Council for Local Environmental Initiatives IEQ Indoor environmental quality in. inches inH2Oe inches water equivalent inHg inches of mercury IPMVP International Performance Measurement and Verification Protocol ISO International Organization for Standardization kg kilograms kW kilowatts

PNNL-15217
54
kWh kilowatt-hours LEEDTM Leadership in Energy and Environmental Design M&V measurement and verification NAAQS National Ambient Air Quality Standards NOX nitrogen oxides NREL National Renewable Energy Laboratory O&M operations and maintenance O3 ozone Pb lead PM10 particulate matter less than 10 µm in diameter PM2.5 particulate matter less than 2.5 µm in diameter PNNL Pacific Northwest National Laboratory PV photovoltaic sf square feet SO2 sulfur dioxide SO2e sulfur dioxide equivalent SSV Sustainable Silicon Valley T&D transmission and distribution TMY typical meteorological year TSP total suspended particulate U uranium USGBC United States Green Building Council µm Micrometers
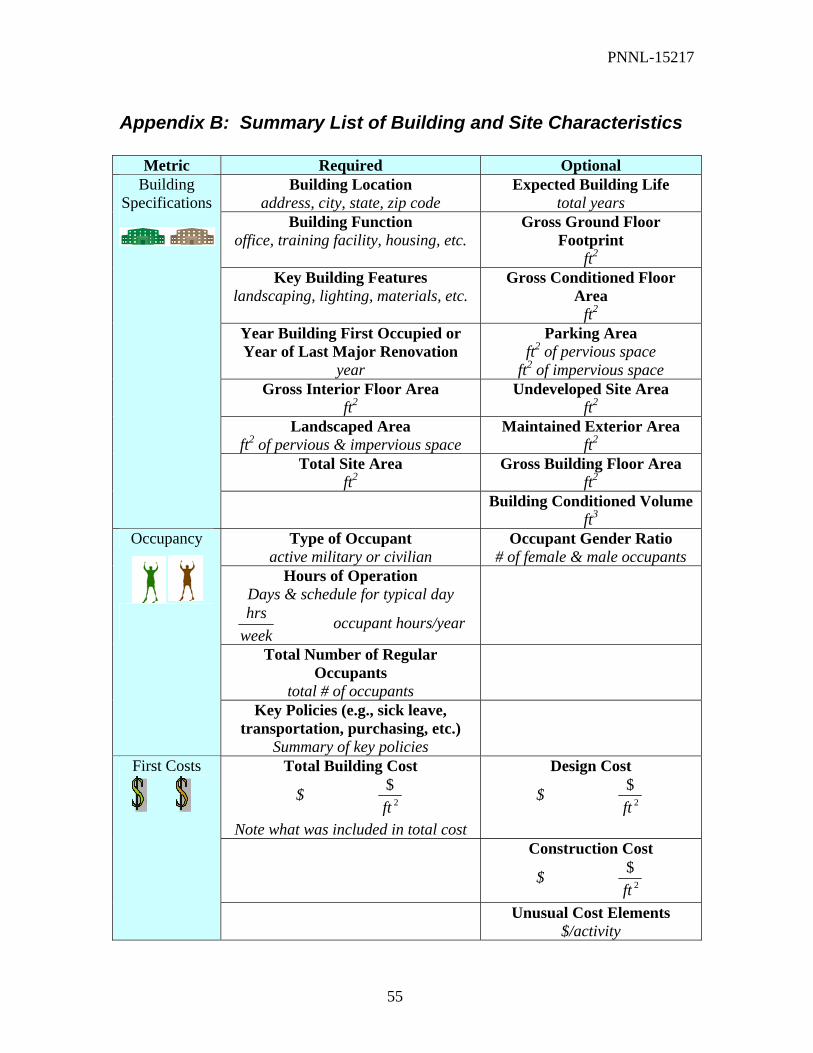
PNNL-15217
55
Appendix B: Summary List of Building and Site Characteristics
Metric Required Optional Building Location
address, city, state, zip code Expected Building Life
total years Building Function
office, training facility, housing, etc. Gross Ground Floor
Footprint ft2
Key Building Features landscaping, lighting, materials, etc.
Gross Conditioned Floor Area
ft2 Year Building First Occupied or Year of Last Major Renovation
year
Parking Area ft2 of pervious space
ft2 of impervious space Gross Interior Floor Area
ft2 Undeveloped Site Area
ft2 Landscaped Area
ft2 of pervious & impervious space Maintained Exterior Area
ft2 Total Site Area
ft2 Gross Building Floor Area
ft2
Building Specifications
Building Conditioned Volume ft3
Type of Occupant active military or civilian
Occupant Gender Ratio # of female & male occupants
Hours of Operation Days & schedule for typical day
weekhrs occupant hours/year
Total Number of Regular Occupants
total # of occupants
Occupancy
Key Policies (e.g., sick leave, transportation, purchasing, etc.)
Summary of key policies
Total Building Cost
$ 2
$ft
Note what was included in total cost
Design Cost
$ 2
$ft
Construction Cost
$ 2
$ft
First Costs
Unusual Cost Elements $/activity
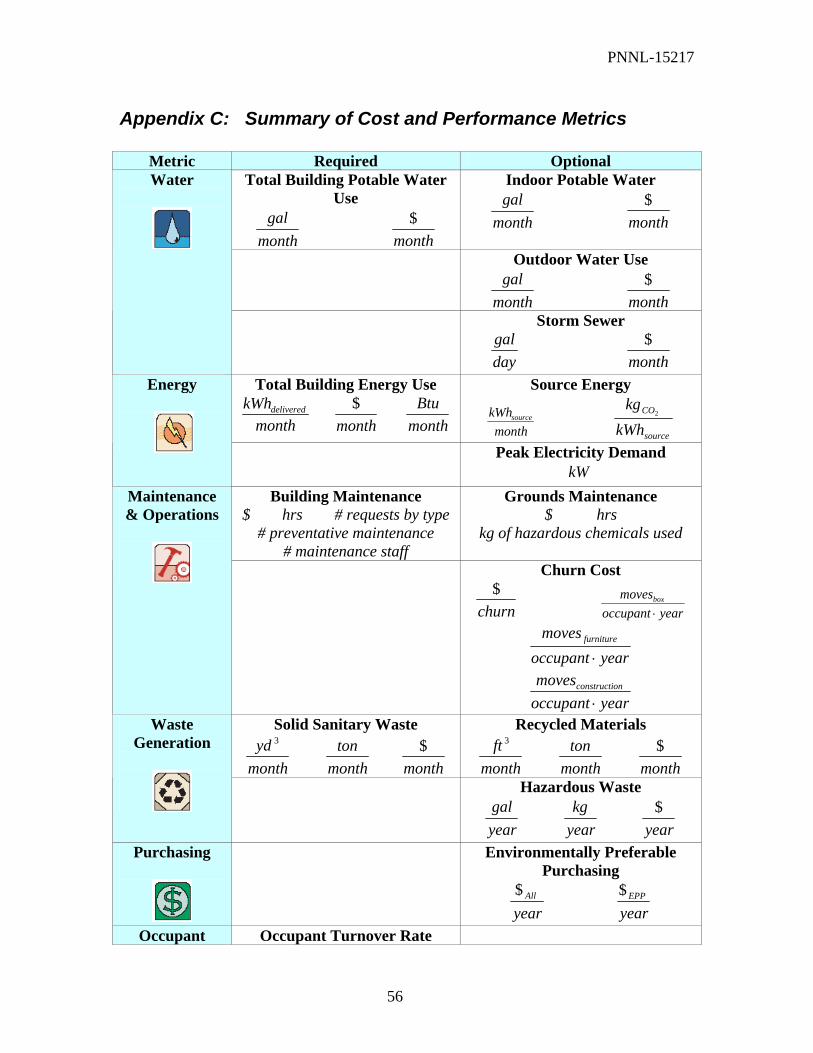
PNNL-15217
56
Appendix C: Summary of Cost and Performance Metrics
Metric Required Optional Total Building Potable Water
Use
monthgal
month$
Indoor Potable Water
monthgal
month$
Outdoor Water Use
monthgal
month$
Water
Storm Sewer
daygal
month$
Total Building Energy Use
monthkWhdelivered
month$
monthBtu
Source Energy
monthkWhsource
source
CO
kWhkg
2
Energy
Peak Electricity Demand kW
Building Maintenance $ hrs # requests by type
# preventative maintenance # maintenance staff
Grounds Maintenance $ hrs
kg of hazardous chemicals used
Maintenance & Operations
Churn Cost
churn$
yearoccupantmovesbox
⋅
yearoccupantmoves furniture
⋅
yearoccupantmoves onconstructi
⋅
Solid Sanitary Waste
monthyd 3
month
ton month
$
Recycled Materials
monthft 3
month
ton month
$
Waste Generation
Hazardous Waste
yeargal
yearkg
year$
Purchasing
Environmentally Preferable Purchasing
yearAll$
year
EPP$
Occupant Occupant Turnover Rate

PNNL-15217
57
Metric Required Optional
yearturnover
Absenteeism
yearoccupantabsentees
⋅
Health & Productivity
Building Occupant Satisfaction
and Self-Rated Productivity survey data
Transportation
Regular Commute
mpg weekmiles

PNNL-15217
58
Appendix D: Data Collection and Analysis Templates
D.1 Data Collection Tool Provide contact information for everyone that provided input. Enter response here Please identify sensitive information contained within this questionnaire or potentially usable for study purposes. Indicate whether the information is entirely proprietary or may be used only for study purposes. Enter response here Building and Site Characteristics Identifier Specify building name and other identification. Enter response here Ownership What company or organization owns the building? What company or organization(s) operate the building? Is the building leased or owner-operated? Does the building have multiple tenants? What is the building function, including major activities and businesses of each occupying party? Enter response here Address Specify building location or street address including a minimum of city, state, and zip code. Enter response here Location What are the location characteristics? Is the building location rural or densely urban? Is the area zoned commercial, residential, or industrial? What are the surrounding businesses, activities, or settings? Is the building surrounded by or near a river, lake, park, forest, farmland, or airport? Enter response here Weather What are the regional weather characteristics/concerns? Include any information about rain, humidity, temperatures, wind, flooding, earthquakes, hurricanes, etc. Enter response here Year When was the building built and first occupied? What major renovations has the building undergone? How extensive were the renovations? When did major renovations occur? Enter response here

PNNL-15217
59
Features What are the prominent building features and functional areas (e.g. central atrium, office space, high-bay)? Enter response here Design Goals In building design and construction, to what extent were sustainability features and goals adopted? When were these goals incorporated (e.g. concept, design, construction, post-occupancy stage)? Are there any design features that are likely to require more or less energy, water, or maintenance during the operation of the building (e.g., fountain, etc.) Please include information regarding design features that might impact performance focus areas. Enter response here Ratings and Awards What scoring has the building received from any formal rating systems (e.g. LEEDTM, EnergyStar, BREEAM, Green Globes, Green Building Challenge, etc.)? Has the building been the subject of any reviews, awards, or studies? Please include any related documentation, links, etc. Enter response here Campus Relationship Is the building part of a campus or industrial park? Does the building occupying party have a relationship to some parent organization? Enter response here Occupants What are the characteristics of the occupants (e.g. civilian, military)? How might occupant or organizational culture affect the behavior of occupants and the building’s operational performance? Are they particularly environmentally conscious? Enter response here Operational Hours What weekly hours is the building operational? How many business days in the year is the building operational? Please include any additional information about occupancy schedules including hours when the building is considered half occupied, open to staff but not to the public, etc. Are buildings systems managed differently during occupancy hours? Do occupants tend to keep long hours? Enter response here Conditioned Space Are any spaces managed differently from the whole building (e.g., cafeteria, computer room, etc.)? Enter response here
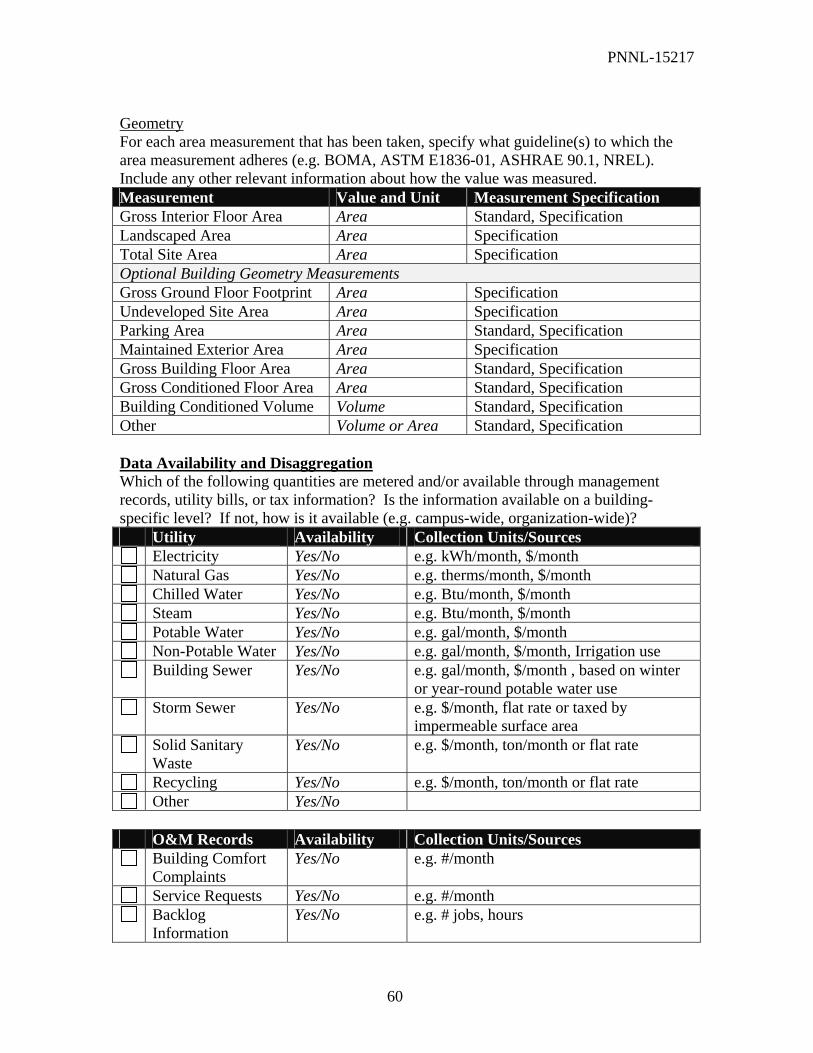
PNNL-15217
60
Geometry For each area measurement that has been taken, specify what guideline(s) to which the area measurement adheres (e.g. BOMA, ASTM E1836-01, ASHRAE 90.1, NREL). Include any other relevant information about how the value was measured. Measurement Value and Unit Measurement Specification Gross Interior Floor Area Area Standard, Specification Landscaped Area Area Specification Total Site Area Area Specification Optional Building Geometry Measurements Gross Ground Floor Footprint Area Specification Undeveloped Site Area Area Specification Parking Area Area Standard, Specification Maintained Exterior Area Area Specification Gross Building Floor Area Area Standard, Specification Gross Conditioned Floor Area Area Standard, Specification Building Conditioned Volume Volume Standard, Specification Other Volume or Area Standard, Specification Data Availability and Disaggregation Which of the following quantities are metered and/or available through management records, utility bills, or tax information? Is the information available on a building-specific level? If not, how is it available (e.g. campus-wide, organization-wide)? Utility Availability Collection Units/Sources
Electricity Yes/No e.g. kWh/month, $/month Natural Gas Yes/No e.g. therms/month, $/month Chilled Water Yes/No e.g. Btu/month, $/month Steam Yes/No e.g. Btu/month, $/month Potable Water Yes/No e.g. gal/month, $/month Non-Potable Water Yes/No e.g. gal/month, $/month, Irrigation use Building Sewer Yes/No e.g. gal/month, $/month , based on winter
or year-round potable water use Storm Sewer Yes/No e.g. $/month, flat rate or taxed by
impermeable surface area Solid Sanitary
Waste Yes/No e.g. $/month, ton/month or flat rate
Recycling Yes/No e.g. $/month, ton/month or flat rate Other Yes/No
O&M Records Availability Collection Units/Sources
Building Comfort Complaints
Yes/No e.g. #/month
Service Requests Yes/No e.g. #/month Backlog
Information Yes/No e.g. # jobs, hours

PNNL-15217
61
O&M Records Availability Collection Units/Sources Completed Repairs Yes/No
Hours Instances $Labor $Materials $Total
e.g. from budget or from historical O&M records
Preventative Maintenance
Yes/No Hours Instances $Labor $Materials $Total
e.g. from budget or from historical O&M records
O&M training Yes/No Hours $
e.g. timeframe of historical records, yearly magnitude of churn
Cleaning Chemical Use
Yes/No e.g. quantity/month, $/month, hazards identification
Pesticide Use Yes/No e.g. quantity/month, $/month, hazards identification
Fertilizer Use Yes/No e.g. quantity/month, $/month, hazards identification
Churn Yes/No Total Moves Box Moves Furniture
Moves Construction
Moves $/move
e.g. timeframe of historical records, yearly magnitude of churn
Turnover Yes/No Hires Terminations Resignations Years of
employment $Recruitment
e.g. #/year, yrs/employee, $/year
Occupant Days Off Yes/No Sick Personal Holiday Paid Vacation Unpaid Leave
e.g. days/employee/year
Occupant Average Salary
Yes/No e.g. $/year
Other Yes/No

PNNL-15217
62
Please specify for which metrics historical data are available. Enter response here Please specify any qualifying information regarding the availability of information, procedures, difficulty of obtaining the information, etc. Enter response here Water What are the building water sources? Enter response here What are the major water uses associated with the building?
Restrooms Showers Kitchenette Cafeteria Laundry Closed Loop Cooling Potable/Non Single Pass Cooling Potable/Non
Cooling Tower Potable/Non
Irrigation Potable/Non
Others or Specify: Enter response here Which of the following water management and efficiency options are employed at the building? Toilets: Landscaping:
Low Volume Native/Adapted Plants Dual Flush Drought Tolerant Landscape Composting Efficient Irrigation
Urinals: Stormwater Management: Waterless Retention Ponds Low Volume Permeable Surfaces
Fixtures: Stormwater Treatment Low Flow Shower Heads Stormwater Reuse Low Flow Faucets
Other: Gray Water Reuse Living Machine

PNNL-15217
63
For runoff calculations related to stormwater management and storm sewer estimates use the following table and equation, [95] which offers manufacturer’s specifications or best estimates for runoff coefficients2.
[ ]∑ ⋅= ficientRunoffCoefaSurfaceAreeAreaimpermeabl Surface Type
Runoff Coefficient
Surface Type
Runoff Coefficient
Asphalt Paving 0.95 Flat Turf, 0-1% Slope 0.25 Concrete Paving 0.95 Average Turf, 1-3% Slope 0.35 Brick Paving 0.85 Hilly Turf, 3-10% Slope 0.40 Gravel Paving 0.75 Steep Turf, >10% Slope 0.45 Conventional Roofing 0.95 Flat Vegetation, 0-1% Slope 0.10 Garden Roofing, <4 in 0.50 Average Vegetation, 1-3% Slope 0.20 Garden Roofing, 4-8 in 0.30 Hilly Vegetation, 3-10% Slope 0.25 Garden Roofing, 9-20 in 0.20 Steep Vegetation, >10% Slope 0.30 Garden Roofing, >20 in 0.10 Flow Speed Metering Calculations: For flows in full pipes or constant water level, ultrasonic flow meters may be used to determine outflow volume. Pipe area A, and speed v, will be used for volumetric flow rate VA and total volumetric flow V over time t.
dtAvV
AvVA
∫==
Flow Speed and Depth Metering: In channels, ditches, or partially-full pipes, the flow rate is a function of outflow geometry, depth, and speed. Ultrasonic flow meters are an option for speed measurements. A depth meter can be a pressure transducer, a bubble meter, a floating bob, or a single combined ultrasonic depth and flow meter. Energy What are the building energy sources?
Electricity Steam Microturbine Natural Gas Chilled Water On-Site PV Liquid Propane Solar Thermal On-Site Wind Biomass Diesel Generator
Others: Enter response here Is there whole building metering of the energy sources used? Please specify indicating measurement frequency and units. Enter response here
2 Permission to reproduce table granted from USGBC.

PNNL-15217
64
Is there sub-metering for any end uses? Please specify indicating measurement frequency and units. Enter response here Is there an Energy Management Control System? Please specify. Enter response here Energy Draws What major energy uses are associated with the building (e.g. people mover, process use, lighting, air conditioning, fans, pumps, electronics plug load)? Are major end uses routed separately so that specific end uses may be monitored, or are they grouped (e.g. task lighting routed through with other plug load)? Enter response here Energy Utilities Who are your electric utility or district heating and cooling providers? How may we contact your utilities? Please include information such as utility name, website, contact person, email, and phone number. Enter response here Questions for the Utility Is your utility a combined heat and power (CHP) generator? Does the utility output chilled water? Is the utility’s energy source coal, natural gas, nuclear, hydro, or other? Enter response here Green Tag Electricity Does your facility purchase “green” electricity? Please provide information about the green electricity purchase including power source and supplier contact information. Enter response here What energy conservation and efficiency strategies are included in the building?
Daylighting Window shadings Task lighting Operable windows Occupancy sensors Passive solar Dimmer switches Raised floors Efficient bulbs Task ventilation Variable frequency drives Personal environmental controls Dual speed pumps Other:
Maintenance and Operations Which of the following operations and maintenance policies or programs do you use in your building?

PNNL-15217
65
Policy or Program Extent Additional Information Environmental
Management System Building/Org/ Campus
Please Specify
Integrated Pest Management
Building/Org/Campus
Please Specify
Environmentally Preferable Purchasing
Building/Org/Campus
Please Specify
Rideshare Program Building/Org/Campus
Please Specify
Public Transit Incentives
Building/Org/Campus
Please Specify
Sustainable Landscaping
Building/Org/Campus
Please Specify
Green Cleaning Building/Org/Campus
Please Specify
Other Building/Org/Campus
Please Specify
Does the building use in-house personnel or contract out for the following services? Service In-House or Contract Out Janitorial In House/Contract Out/Other Carpet Cleaning In House/Contract Out/Other Grounds In House/Contract Out/Other Maintenance In House/Contract Out/Other Other In House/Contract Out/Other Which of the following are monitored? Quantity Measurement Frequency Units and Measured Areas
Illuminance e.g., 4 day-long measurements in one year, 15minute intervals
e.g. lux, ft-candles, areas
UV Level e.g., quarterly spot collection,one-hour average
e.g. mW/m3, areas
Temperature e.g., logged every 15 minutes e.g. F, areas Relative Humidity e.g., logged every 15 minutes e.g. %RH, areas Dew Point e.g., logged every 15 minutes e.g. F, areas Carbon Dioxide e.g., logged every 15 minutes e.g. ppm, areas Carbon Monoxide e.g., logged every 15 minutes e.g. ppm, areas Respirable Dust e.g., yearly spot collection
one-hour average e.g. mg/m3, areas
Airborne Viable Bacteria
e.g., yearly spot collection one-hour average
e.g. CFU/m3, areas
Airborne Viable Fungi and Mold
e.g., yearly spot collection one-hour average
e.g. CFU/m3, areas
Ozone e.g., yearly spot collection e.g. ppm, areas

PNNL-15217
66
Quantity Measurement Frequency Units and Measured Areas one-hour average
Formaldehyde e.g., yearly spot collection one-hour average
e.g. ppm, areas
Total volatile organic compounds
e.g., yearly spot collection one-hour average
e.g. µg/m3, areas
Individual volatile organic compounds
e.g., yearly spot collection one-hour average
e.g. µg/m3, areas
Other e.g., logged every 15 minutes Units and Measured Areas Does the facility use a computerized maintenance management system (e.g. Mars, Maximo) to help manage maintenance and operations costs, inventory, work orders, etc? Describe the tracking system. Enter response here How many maintenance personnel are responsible for this building? Enter response here Waste Generation Sanitary Waste How is sanitary waste managed? How is the organization billed for sanitary waste disposal? Enter response here Hazardous Waste What are the sources of hazardous waste associated with the building?
Pesticides Outdoor Pest Management Fertilizers Electronics Cleaning Products Batteries Indoor Pest Management Aerosols
Others: How is hazardous waste managed in this building? What building processes or practices produce these hazardous wastes? Enter response here To what extent are sanitary and hazardous waste streams tracked and documented? Enter response here Recycling and Reuse Are recycling services readily available in the region? What are the costs, paybacks, incentives, local initiatives, and liabilities associated with recycling? Enter response here
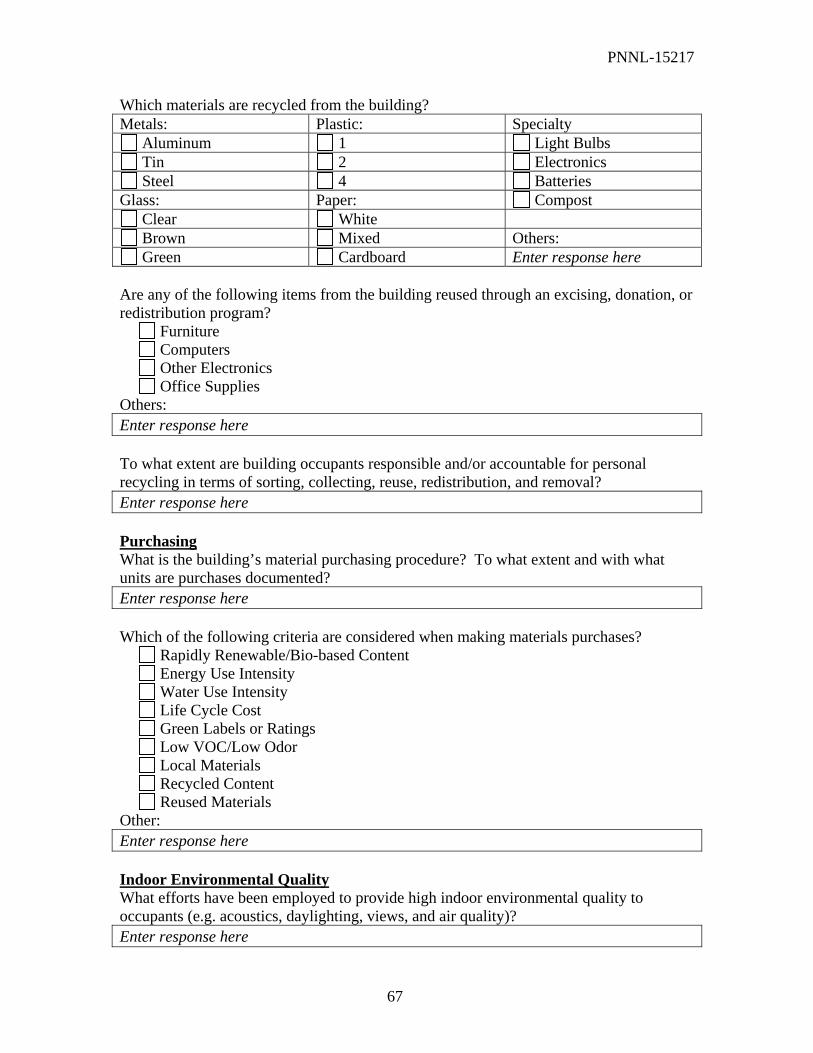
PNNL-15217
67
Which materials are recycled from the building? Metals: Plastic: Specialty
Aluminum 1 Light Bulbs Tin 2 Electronics Steel 4 Batteries
Glass: Paper: Compost Clear White Brown Mixed Others: Green Cardboard Enter response here
Are any of the following items from the building reused through an excising, donation, or redistribution program?
Furniture Computers Other Electronics Office Supplies
Others: Enter response here To what extent are building occupants responsible and/or accountable for personal recycling in terms of sorting, collecting, reuse, redistribution, and removal? Enter response here Purchasing What is the building’s material purchasing procedure? To what extent and with what units are purchases documented? Enter response here Which of the following criteria are considered when making materials purchases?
Rapidly Renewable/Bio-based Content Energy Use Intensity Water Use Intensity Life Cycle Cost Green Labels or Ratings Low VOC/Low Odor Local Materials Recycled Content Reused Materials
Other: Enter response here Indoor Environmental Quality What efforts have been employed to provide high indoor environmental quality to occupants (e.g. acoustics, daylighting, views, and air quality)? Enter response here

PNNL-15217
68
What efforts have been made to ensure building accessibility and convenience for occupants with special needs (e.g. wheelchair, visual impairment, deaf/hard of hearing)? Enter response here What steps need to be taken to distribute a survey to building occupants in order to gather productivity and transportation measurement data? Enter response here What questions would you like answered from an occupant survey for your own building management and administrative purposes? What information about building performance would be useful to you and how? Enter response here Transportation What building or company efforts do you employ to encourage sound transport options? Transport Option Distance Additional Information
Bike Path Distance Showers and Bike Racks Available? Bus Distance Number of Routes, Cost or Subsidy Train Distance Number of Routes Walking Distance Feasibility Driving Distance to Parking Cost or Subsidy, Lot or Garage Carpooling Distance to Parking Cost or Subsidy, Preferential
Parking? Tele-work Teleconference
Telecommute Home Office Support
Extent of Use, Incentives
Other Transport Distance Additional Information What traffic conditions affect occupant commute? Are employee arrival and departure times flexible, staggered, or uniform around rush hour? Are employee schedules flexible? Enter response here How might the location of each following amenities affect occupant commute? Amenity Distance Additional Information Dining Distance Childcare Distance Gym Distance Other Distance Other Please note any additional information, comments, suggestions, or complications that may be useful in this study. Enter response here
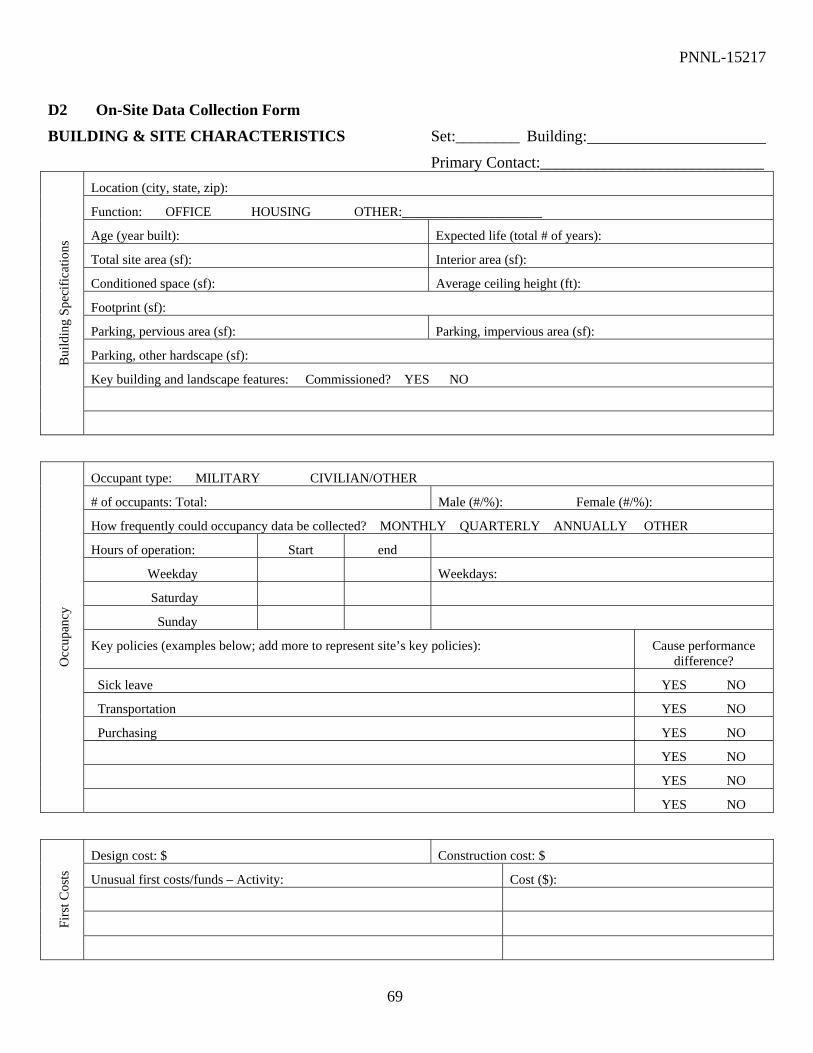
PNNL-15217
69
D2 On-Site Data Collection Form BUILDING & SITE CHARACTERISTICS Set:________ Building:
Primary Contact:____________________________ Location (city, state, zip):
Function: OFFICE HOUSING OTHER:_____________________
Age (year built): Expected life (total # of years):
Total site area (sf): Interior area (sf):
Conditioned space (sf): Average ceiling height (ft):
Footprint (sf):
Parking, pervious area (sf): Parking, impervious area (sf):
Parking, other hardscape (sf):
Key building and landscape features: Commissioned? YES NO
Bui
ldin
g Sp
ecifi
catio
ns
Occupant type: MILITARY CIVILIAN/OTHER
# of occupants: Total: Male (#/%): Female (#/%):
How frequently could occupancy data be collected? MONTHLY QUARTERLY ANNUALLY OTHER
Hours of operation: Start end
Weekday Weekdays:
Saturday
Sunday
Key policies (examples below; add more to represent site’s key policies): Cause performance difference?
Sick leave YES NO
Transportation YES NO
Purchasing YES NO
YES NO
YES NO
Occ
upan
cy
YES NO
Design cost: $ Construction cost: $
Unusual first costs/funds – Activity: Cost ($):
Firs
t Cos
ts
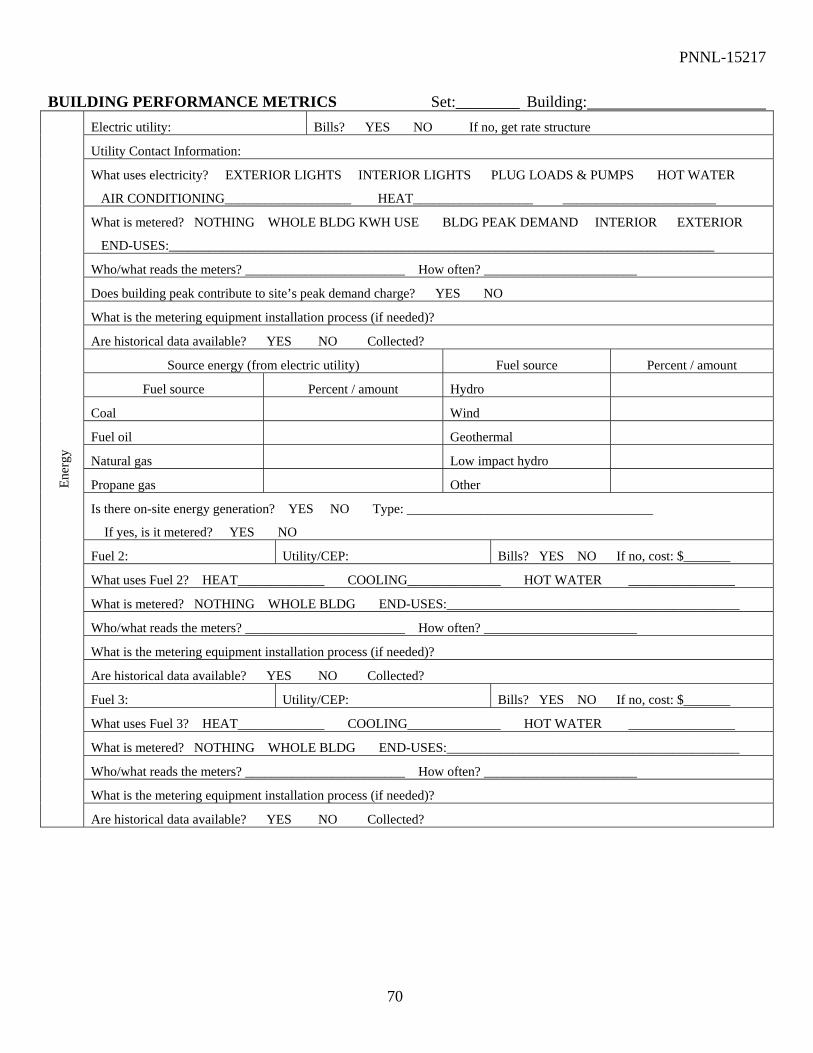
PNNL-15217
70
BUILDING PERFORMANCE METRICS Set:________ Building: Electric utility: Bills? YES NO If no, get rate structure
Utility Contact Information:
What uses electricity? EXTERIOR LIGHTS INTERIOR LIGHTS PLUG LOADS & PUMPS HOT WATER
AIR CONDITIONING___________________ HEAT__________________ _______________________
What is metered? NOTHING WHOLE BLDG KWH USE BLDG PEAK DEMAND INTERIOR EXTERIOR
END-USES:__________________________________________________________________________________
Who/what reads the meters? ________________________ How often? _______________________
Does building peak contribute to site’s peak demand charge? YES NO
What is the metering equipment installation process (if needed)?
Are historical data available? YES NO Collected?
Source energy (from electric utility) Fuel source Percent / amount
Fuel source Percent / amount Hydro
Coal Wind
Fuel oil Geothermal
Natural gas Low impact hydro
Propane gas Other
Is there on-site energy generation? YES NO Type: _____________________________________
If yes, is it metered? YES NO
Fuel 2: Utility/CEP: Bills? YES NO If no, cost: $_______
What uses Fuel 2? HEAT_____________ COOLING______________ HOT WATER ________________
What is metered? NOTHING WHOLE BLDG END-USES:____________________________________________
Who/what reads the meters? ________________________ How often? _______________________
What is the metering equipment installation process (if needed)?
Are historical data available? YES NO Collected?
Fuel 3: Utility/CEP: Bills? YES NO If no, cost: $_______
What uses Fuel 3? HEAT_____________ COOLING______________ HOT WATER ________________
What is metered? NOTHING WHOLE BLDG END-USES:____________________________________________
Who/what reads the meters? ________________________ How often? _______________________
What is the metering equipment installation process (if needed)?
Ener
gy
Are historical data available? YES NO Collected?
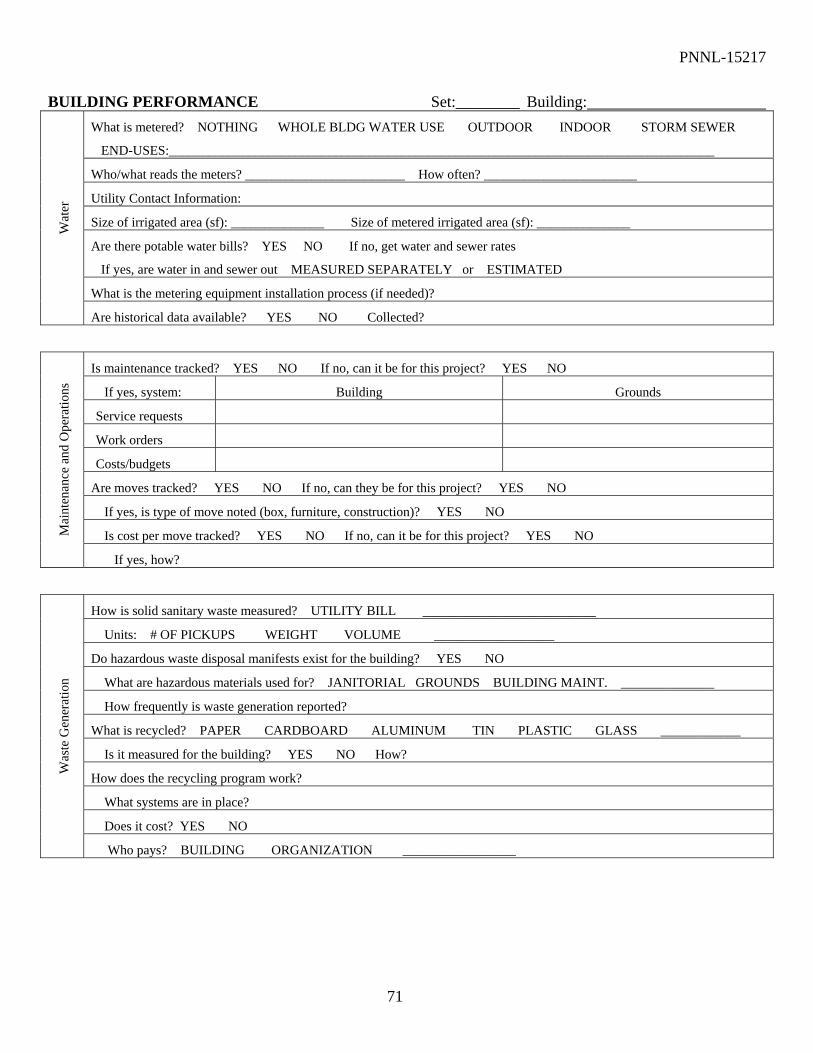
PNNL-15217
71
BUILDING PERFORMANCE Set:________ Building: What is metered? NOTHING WHOLE BLDG WATER USE OUTDOOR INDOOR STORM SEWER
END-USES:__________________________________________________________________________________
Who/what reads the meters? ________________________ How often? _______________________
Utility Contact Information:
Size of irrigated area (sf): ______________ Size of metered irrigated area (sf): ______________
Are there potable water bills? YES NO If no, get water and sewer rates
If yes, are water in and sewer out MEASURED SEPARATELY or ESTIMATED
What is the metering equipment installation process (if needed)?
Wat
er
Are historical data available? YES NO Collected?
Is maintenance tracked? YES NO If no, can it be for this project? YES NO
If yes, system: Building Grounds
Service requests
Work orders
Costs/budgets
Are moves tracked? YES NO If no, can they be for this project? YES NO
If yes, is type of move noted (box, furniture, construction)? YES NO
Is cost per move tracked? YES NO If no, can it be for this project? YES NO Mai
nten
ance
and
Ope
ratio
ns
If yes, how?
How is solid sanitary waste measured? UTILITY BILL __________________________
Units: # OF PICKUPS WEIGHT VOLUME __________________
Do hazardous waste disposal manifests exist for the building? YES NO
What are hazardous materials used for? JANITORIAL GROUNDS BUILDING MAINT. ______________
How frequently is waste generation reported?
What is recycled? PAPER CARDBOARD ALUMINUM TIN PLASTIC GLASS ____________
Is it measured for the building? YES NO How?
How does the recycling program work?
What systems are in place?
Does it cost? YES NO
Was
te G
ener
atio
n
Who pays? BUILDING ORGANIZATION _________________

PNNL-15217
72
BUILDING PERFORMANCE Set:________ Building: Is purchasing tracked (possibly within P2 Program for EPP)? YES NO
If green purchasing is tracked, how is it tracked? COST ITEM OTHER _________________
If no, can it be tracked for this project? YES NO
Can we track total purchases for building by total cost and by item?
Do you purchase “green” supplies for: CUSTODIAL BUILDING MAINT. GROUNDS MAINT. NONE Purc
hasi
ng
EPP policies:
Which of the following data can be tracked by building?
Occupant turnover: YES NO Absenteeism: YES NO
How frequently could it be collected? MONTHLY QUARTERLY ANNUALLY
Occ
upan
t Hea
lth a
nd
Prod
uctiv
ity
Electronic occupant survey distribution:
What is the process for getting an occupant survey approved and distributed?
Who needs to be involved in the process for the building?
How do people get to work? DRIVE TRANSIT WALK BIKE CARPOOL _____________
Is mass transit available? YES NO What types?
Is parking readily available? YES NO
Incentives or disincentives for: Walking:
Biking:
Carpooling:
Using mass transit:
Driving:
Tran
spor
tatio
n
What is the community attitude toward driving?
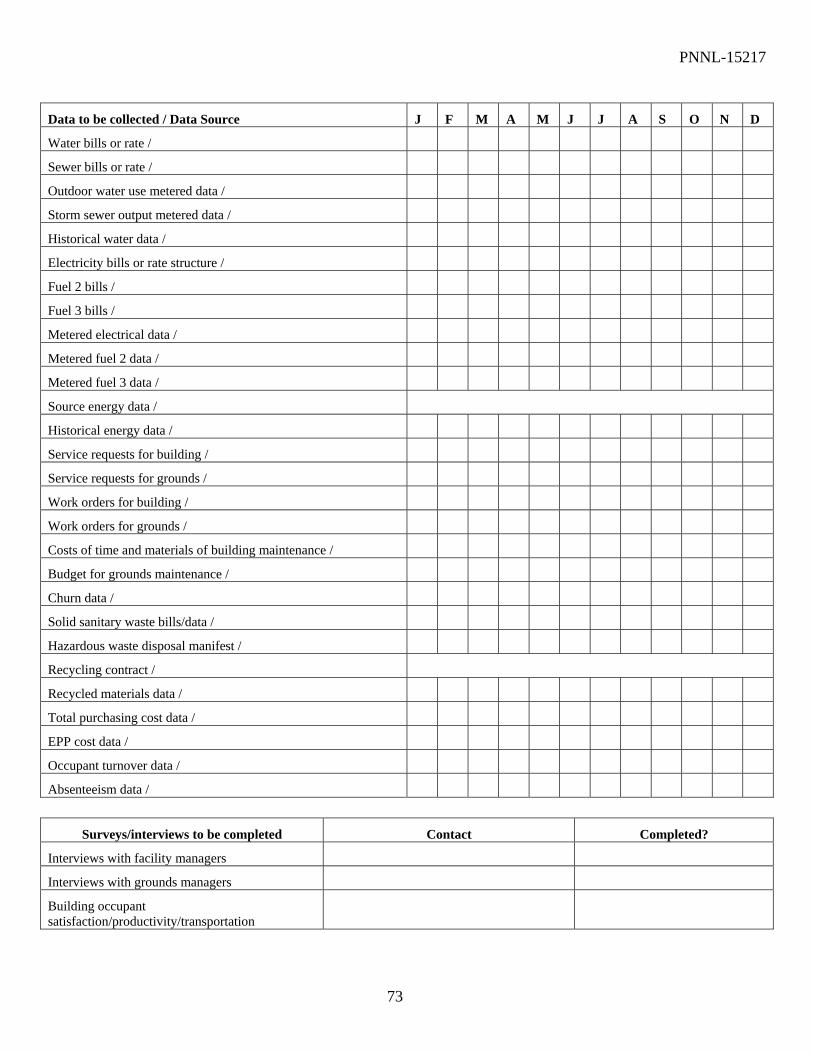
PNNL-15217
73
Data to be collected / Data Source J F M A M J J A S O N D
Water bills or rate /
Sewer bills or rate /
Outdoor water use metered data /
Storm sewer output metered data /
Historical water data /
Electricity bills or rate structure /
Fuel 2 bills /
Fuel 3 bills /
Metered electrical data /
Metered fuel 2 data /
Metered fuel 3 data /
Source energy data /
Historical energy data /
Service requests for building /
Service requests for grounds /
Work orders for building /
Work orders for grounds /
Costs of time and materials of building maintenance /
Budget for grounds maintenance /
Churn data /
Solid sanitary waste bills/data /
Hazardous waste disposal manifest /
Recycling contract /
Recycled materials data /
Total purchasing cost data /
EPP cost data /
Occupant turnover data /
Absenteeism data /
Surveys/interviews to be completed Contact Completed?
Interviews with facility managers
Interviews with grounds managers
Building occupant satisfaction/productivity/transportation
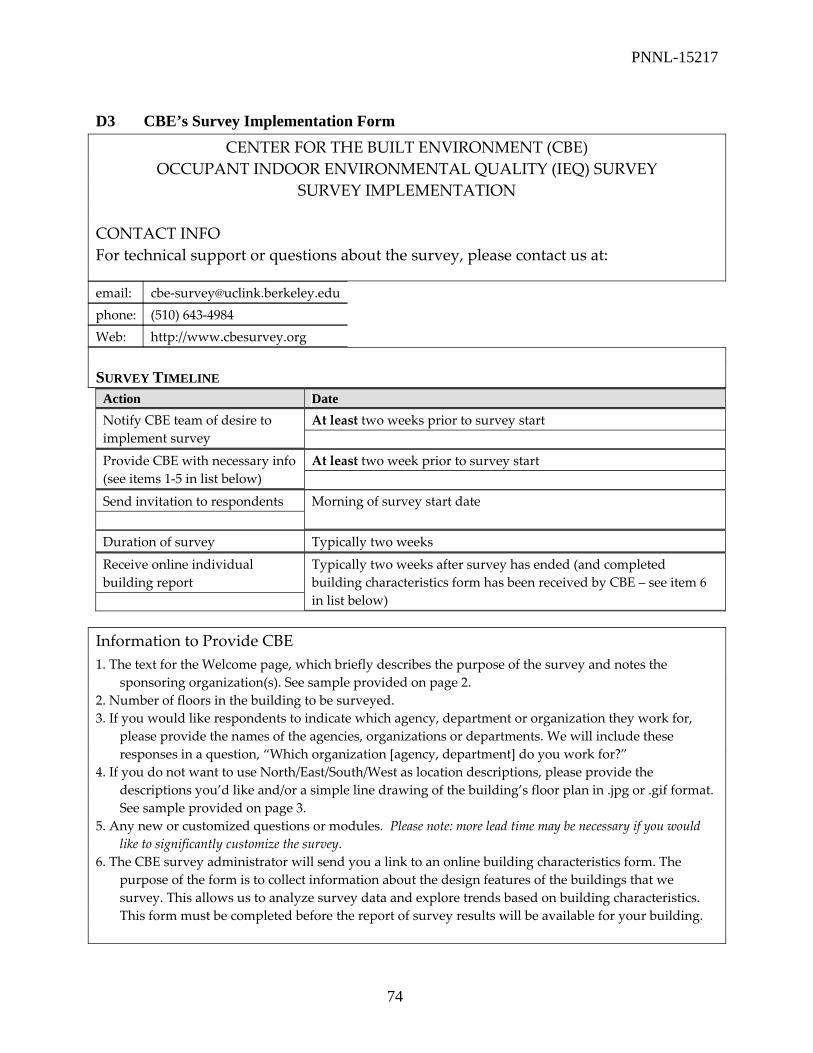
PNNL-15217
74
D3 CBE’s Survey Implementation Form
CENTER FOR THE BUILT ENVIRONMENT (CBE) OCCUPANT INDOOR ENVIRONMENTAL QUALITY (IEQ) SURVEY
SURVEY IMPLEMENTATION CONTACT INFO For technical support or questions about the survey, please contact us at:
email: cbe‐[email protected] phone: (510) 643‐4984 Web: http://www.cbesurvey.org SURVEY TIMELINE
Action Date Notify CBE team of desire to implement survey
At least two weeks prior to survey start
Provide CBE with necessary info (see items 1‐5 in list below)
At least two week prior to survey start
Send invitation to respondents Morning of survey start date
Duration of survey Typically two weeks
Receive online individual building report
Typically two weeks after survey has ended (and completed building characteristics form has been received by CBE – see item 6 in list below)
Information to Provide CBE 1. The text for the Welcome page, which briefly describes the purpose of the survey and notes the
sponsoring organization(s). See sample provided on page 2. 2. Number of floors in the building to be surveyed. 3. If you would like respondents to indicate which agency, department or organization they work for,
please provide the names of the agencies, organizations or departments. We will include these responses in a question, “Which organization [agency, department] do you work for?”
4. If you do not want to use North/East/South/West as location descriptions, please provide the descriptions you’d like and/or a simple line drawing of the building’s floor plan in .jpg or .gif format. See sample provided on page 3.
5. Any new or customized questions or modules. Please note: more lead time may be necessary if you would like to significantly customize the survey.
6. The CBE survey administrator will send you a link to an online building characteristics form. The purpose of the form is to collect information about the design features of the buildings that we survey. This allows us to analyze survey data and explore trends based on building characteristics. This form must be completed before the report of survey results will be available for your building.
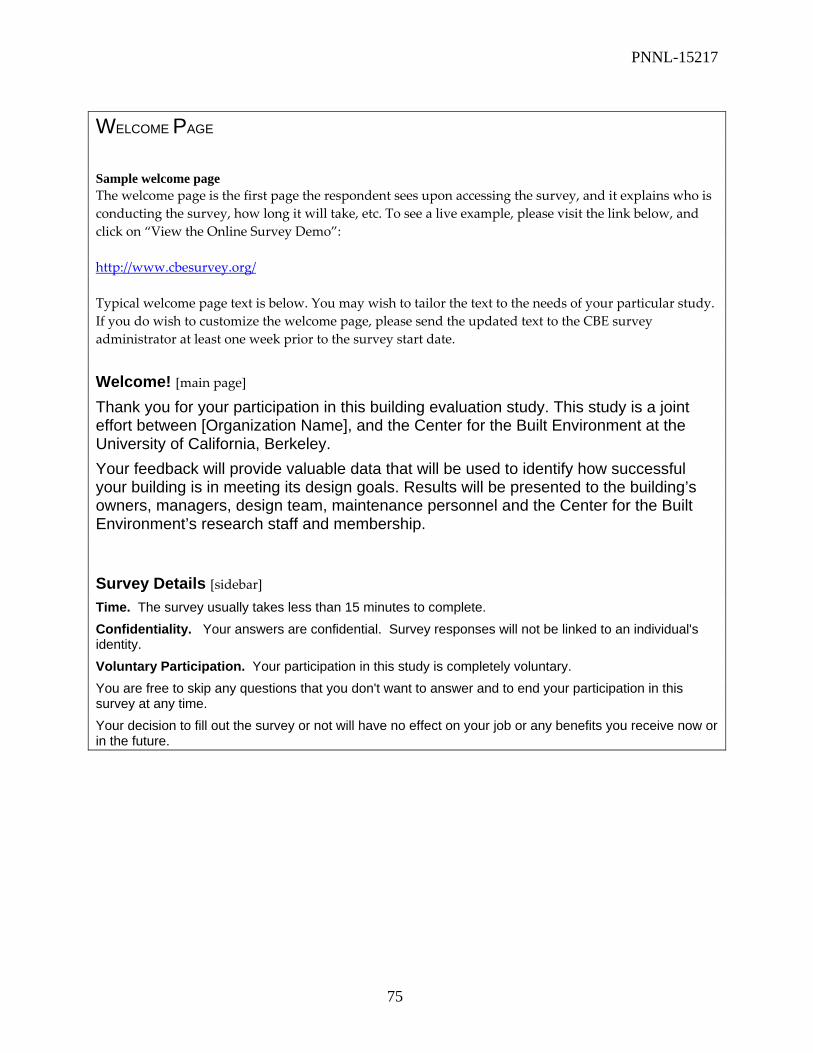
PNNL-15217
75
WELCOME PAGE Sample welcome page The welcome page is the first page the respondent sees upon accessing the survey, and it explains who is conducting the survey, how long it will take, etc. To see a live example, please visit the link below, and click on “View the Online Survey Demo”: http://www.cbesurvey.org/ Typical welcome page text is below. You may wish to tailor the text to the needs of your particular study. If you do wish to customize the welcome page, please send the updated text to the CBE survey administrator at least one week prior to the survey start date.
Welcome! [main page] Thank you for your participation in this building evaluation study. This study is a joint effort between [Organization Name], and the Center for the Built Environment at the University of California, Berkeley. Your feedback will provide valuable data that will be used to identify how successful your building is in meeting its design goals. Results will be presented to the building’s owners, managers, design team, maintenance personnel and the Center for the Built Environment’s research staff and membership.
Survey Details [sidebar] Time. The survey usually takes less than 15 minutes to complete. Confidentiality. Your answers are confidential. Survey responses will not be linked to an individual's identity. Voluntary Participation. Your participation in this study is completely voluntary. You are free to skip any questions that you don't want to answer and to end your participation in this survey at any time. Your decision to fill out the survey or not will have no effect on your job or any benefits you receive now or in the future.
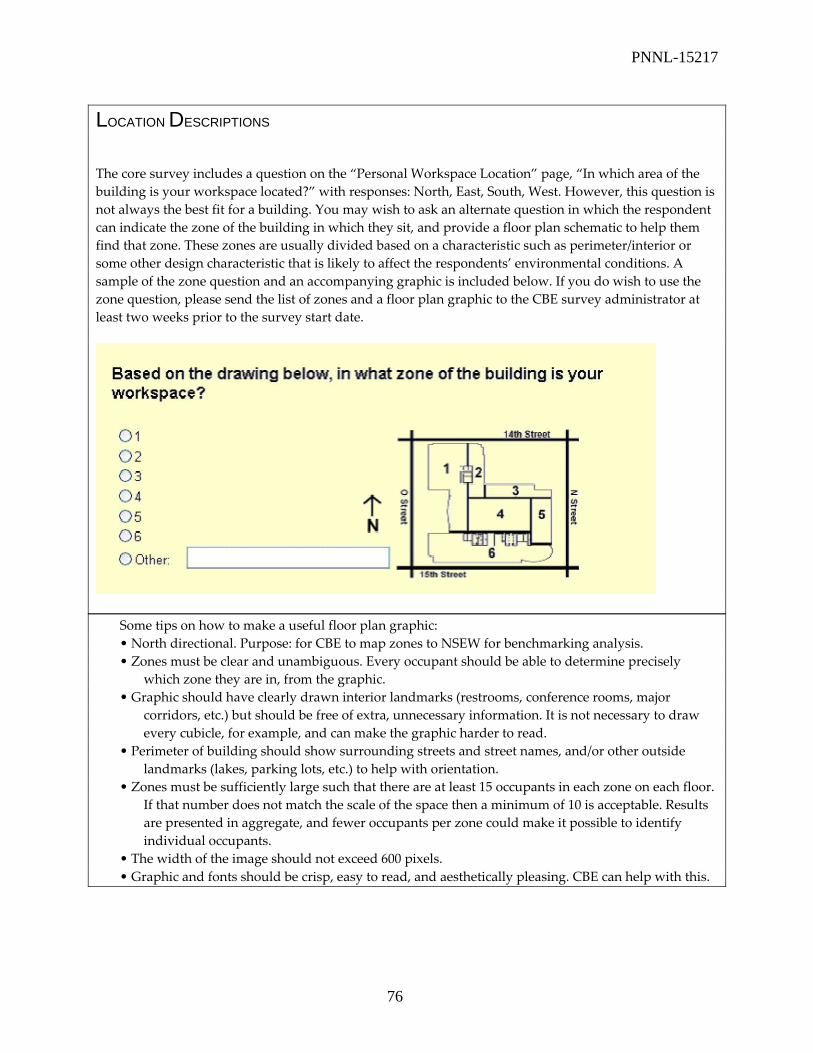
PNNL-15217
76
LOCATION DESCRIPTIONS The core survey includes a question on the “Personal Workspace Location” page, “In which area of the building is your workspace located?” with responses: North, East, South, West. However, this question is not always the best fit for a building. You may wish to ask an alternate question in which the respondent can indicate the zone of the building in which they sit, and provide a floor plan schematic to help them find that zone. These zones are usually divided based on a characteristic such as perimeter/interior or some other design characteristic that is likely to affect the respondents’ environmental conditions. A sample of the zone question and an accompanying graphic is included below. If you do wish to use the zone question, please send the list of zones and a floor plan graphic to the CBE survey administrator at least two weeks prior to the survey start date.
Some tips on how to make a useful floor plan graphic: • North directional. Purpose: for CBE to map zones to NSEW for benchmarking analysis. • Zones must be clear and unambiguous. Every occupant should be able to determine precisely
which zone they are in, from the graphic. • Graphic should have clearly drawn interior landmarks (restrooms, conference rooms, major
corridors, etc.) but should be free of extra, unnecessary information. It is not necessary to draw every cubicle, for example, and can make the graphic harder to read.
• Perimeter of building should show surrounding streets and street names, and/or other outside landmarks (lakes, parking lots, etc.) to help with orientation.
• Zones must be sufficiently large such that there are at least 15 occupants in each zone on each floor. If that number does not match the scale of the space then a minimum of 10 is acceptable. Results are presented in aggregate, and fewer occupants per zone could make it possible to identify individual occupants.
• The width of the image should not exceed 600 pixels. • Graphic and fonts should be crisp, easy to read, and aesthetically pleasing. CBE can help with this.
PNNL-15217
77
INVITING PARTICIPANTS Sending the invitation We recommend sending the introductory message for the survey directly (i.e., not forwarded) from an individual who is well known, respected and a decision maker in the organization. This conveys management support for the survey and can have a significant effect on the response rate. We’ve found that the introductory email for the survey with the lowest response rate was poorly executed; it was forwarded three times before it reached the occupant, each time with an additional header attached. By the time it arrived to the intended recipients, the reader needed to scroll to the bottom of the message to read the original text. This diminished the perceived importance of the study and is likely to have contributed to the low response rate. The study with the highest response rate was introduced with an email sent directly from the head of the organization noting an “important survey” for all building occupants. The invitation should be sent to the recipients on the morning of the survey start date.
Example invitation Dear Occupants: [Organization Name] is using an innovative on‐line survey developed by the Center for the Built Environment at the University of California, Berkeley to evaluate your satisfaction with our building and identify how to improve our facility services. Your participation is very important. Please visit this web address before [date]: [link] This survey gives you an opportunity to comment on your satisfaction with spatial layout, office furnishings, office temperature, air quality, lighting, acoustic quality, building maintenance, and the building overall. The survey takes less than 15 minutes to complete and is confidential and anonymous. The results will greatly assist us in making this facility work for you. If you have questions about the survey or experience any technical difficulties, please contact CBE via e‐mail at cbe‐[email protected] or by phone at (510) 643‐4984. Thank you in advance for your participation.
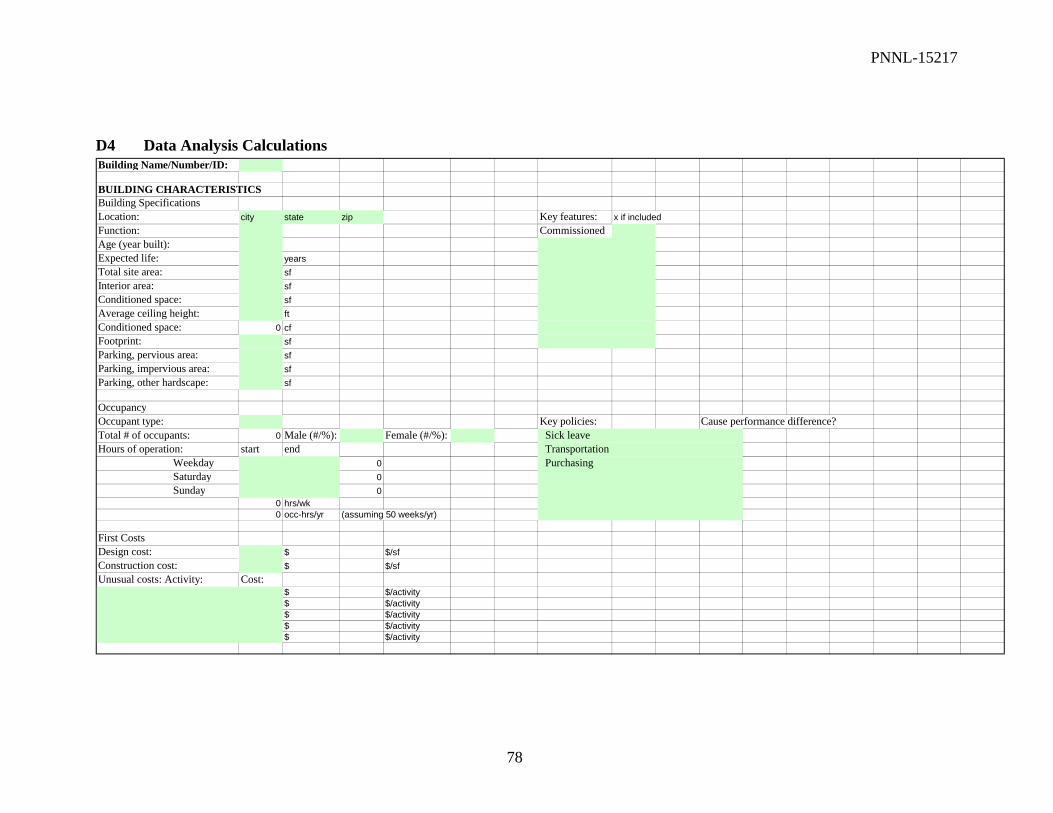
PNNL-15217
78
D4 Data Analysis Calculations Building Name/Number/ID:
BUILDING CHARACTERISTICSBuilding SpecificationsLocation: city state zip Key features: x if includedFunction: CommissionedAge (year built):Expected life: yearsTotal site area: sfInterior area: sfConditioned space: sfAverage ceiling height: ftConditioned space: 0 cfFootprint: sfParking, pervious area: sfParking, impervious area: sfParking, other hardscape: sf
OccupancyOccupant type: Key policies: Cause performance difference?Total # of occupants: 0 Male (#/%): Female (#/%): Sick leaveHours of operation: start end Transportation
Weekday 0 PurchasingSaturday 0Sunday 0
0 hrs/wk0 occ-hrs/yr (assuming 50 weeks/yr)
First CostsDesign cost: $ $/sfConstruction cost: $ $/sfUnusual costs: Activity: Cost:
$ $/activity$ $/activity$ $/activity$ $/activity$ $/activity
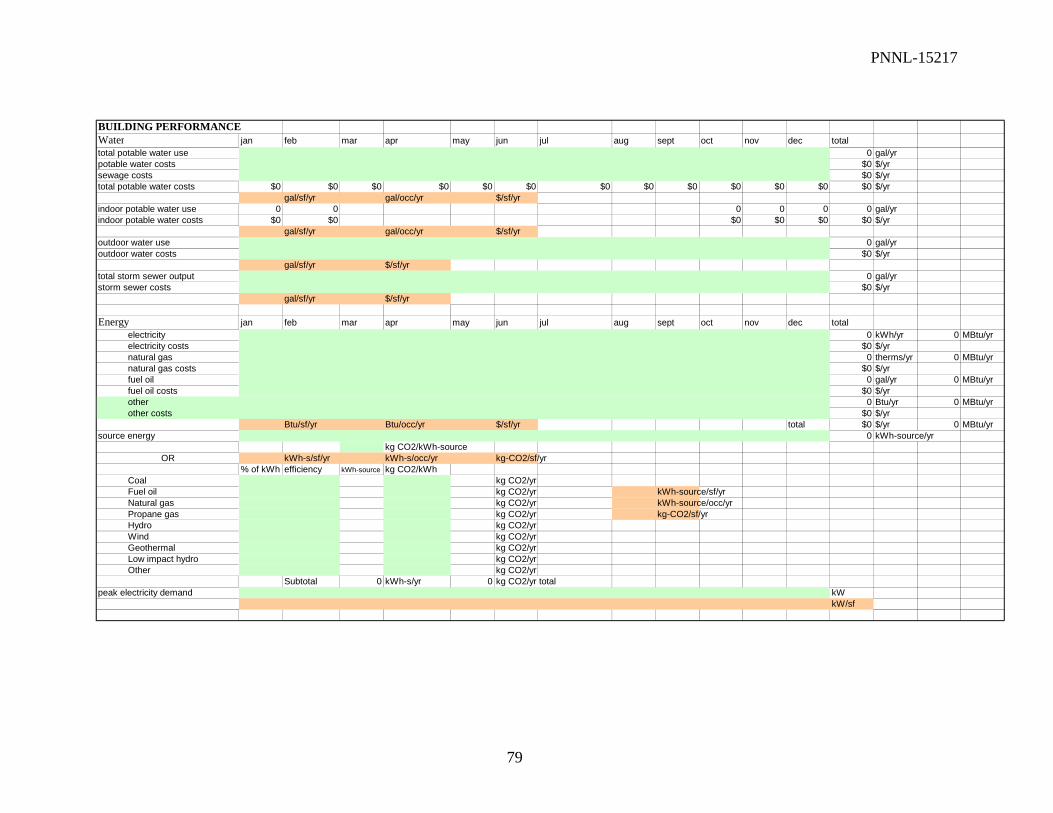
PNNL-15217
79
BUILDING PERFORMANCEWater jan feb mar apr may jun jul aug sept oct nov dec totaltotal potable water use 0 gal/yrpotable water costs $0 $/yrsewage costs $0 $/yrtotal potable water costs $0 $0 $0 $0 $0 $0 $0 $0 $0 $0 $0 $0 $0 $/yr
gal/sf/yr gal/occ/yr $/sf/yrindoor potable water use 0 0 0 0 0 0 gal/yrindoor potable water costs $0 $0 $0 $0 $0 $0 $/yr
gal/sf/yr gal/occ/yr $/sf/yroutdoor water use 0 gal/yroutdoor water costs $0 $/yr
gal/sf/yr $/sf/yrtotal storm sewer output 0 gal/yrstorm sewer costs $0 $/yr
gal/sf/yr $/sf/yr
Energy jan feb mar apr may jun jul aug sept oct nov dec totalelectricity 0 kWh/yr 0 MBtu/yrelectricity costs $0 $/yrnatural gas 0 therms/yr 0 MBtu/yrnatural gas costs $0 $/yrfuel oil 0 gal/yr 0 MBtu/yrfuel oil costs $0 $/yrother 0 Btu/yr 0 MBtu/yrother costs $0 $/yr
Btu/sf/yr Btu/occ/yr $/sf/yr total $0 $/yr 0 MBtu/yrsource energy 0 kWh-source/yr
kg CO2/kWh-sourceOR kWh-s/sf/yr kWh-s/occ/yr kg-CO2/sf/yr
% of kWh efficiency kWh-source kg CO2/kWhCoal kg CO2/yrFuel oil kg CO2/yr kWh-source/sf/yrNatural gas kg CO2/yr kWh-source/occ/yrPropane gas kg CO2/yr kg-CO2/sf/yrHydro kg CO2/yrWind kg CO2/yrGeothermal kg CO2/yrLow impact hydro kg CO2/yrOther kg CO2/yr
Subtotal 0 kWh-s/yr 0 kg CO2/yr totalpeak electricity demand kW
kW/sf

PNNL-15217
80
BUILDING PERFORMANCE, cont.Maintenance and Operationsbuilding maintenance cost: $/yr $/sf/yr
hrs spent on maintenance: hrs/yr hrs/sf/yr# of maintenance requests: requests/yr requests/sf/yr# of preventative jobs: jobs/yr
grounds maintenance cost: $/yr $/sf/yrhrs spent on maintenance: hrs/yr hrs/sf/yr# of maintenance requests: requests/yr requests/sf/yrkg hazardous chemicals used: kg/yr
churn cost: $/churn $/occ/yr# of box moves: moves/yr box moves/occ/yr# of furniture moves: moves/yr furniture moves/occ/yr# of construction moves: moves/yr construction moves/occ/yrtotal moves: 0 moves/yr moves/occ/yr
Waste Generation jan feb mar apr may jun jul aug sept oct nov dec totalsolid sanitary waste generated: 0 yd3/yr
0 tons/yrsolid sanitary waste cost: $0 $/yr
kg/ton kg/yr kg/sf/yr kg/occ/yr $/sf/yrhazardous waste generated: 0 gal/yr
0 kg/yrhazardous waste cost: $0 $/yr
kg/sf/yr kg/occ/yr $/sf/yrrecycled materials: 0 ft3/yr
0 tons/yrrecycled materials cost: $0 $/yr
kg/yr kg/sf/yr kg/occ/yr $/sf/yr
Purchasing EPP: %total purchasing costs: $/yr $/occ/yr $/sf/yrEPP purchasing costs: $/yr $/occ/yr $/sf/yr
Occupant Health and Productivityturnover rate: turnovers/yr turnovers/occ/yrabsenteeism: absentees/yr absentees/occ/yroccupant satisfaction survey results:
Transportationcommute survey results:

PNNL-15217
81
Appendix E: IEQ and Transportation Surveys E1 Center for Built Environment Indoor Environmental Quality Survey [18] Welcome! This demonstration version of CBE's Environmental Quality Assessment Survey is fully functional, although only your comments will be recorded. The survey contains three background and eight primary screens. When you fill out 'dissatisfied' responses, the survey often asks follow-up questions, to determine the cause of your dissatisfaction. To learn more about the survey tool, please see our project brochure. The CBE team greatly appreciates your interest in our survey. If you would like to implement the survey at your organization, or simply wish to offer comments, please e-mail us.
__ Check this box if you are using a screen reader for the visually impaired. System Requirements. You will need to use a version 4.0 or later edition of Netscape Navigator or Microsoft Internet Explorer. If you have an older version, click to download the current version of Navigator or Internet Explorer. Questions/Feedback. If you have questions about the study, or for help using the survey or this website, please email the Center for the Built Environment at the University of California, Berkeley. A research specialist will respond to your question promptly. Your Rights. If you have questions about your rights as a participant in this research project, please email the University of California at Berkeley's Committee for Protection of Human Subjects (CPHS). Please do not contact CPHS regarding technical support issues. Survey Details Time. The survey usually takes less than 15 minutes to complete. Confidentiality. Your answers are confidential. Survey responses will not be linked to an individual's identity. Voluntary Participation. Your participation in this study is completely voluntary. You are free to skip any questions that you don't want to answer and to end your participation in this survey at any time. Your decision to fill out the survey or not will have no effect on your job or any benefits you receive now or in the future.
START THE SURVEY

PNNL-15217
82
Background How many years have you worked in this building?
Less than 1 year 1-2 years 3-5 years More than 5 years
How long have you been working at your present workspace? Less than 3 months 4-6 months 7-12 months More than 1 year
In a typical week, how many hours do you spend in your workspace?
10 or less 11-30 More than 30
What is your age? 30 or under 31-50 Over 50
What is your gender? Female Male
Personal Workspace Location On which floor is your workspace located? choose one
1st Floor 2nd Floor 3rd Floor 4th Floor
In which area of the building is your workspace located? choose one
North East South West
Are you near an exterior wall (within 15 feet)?
Yes No
PNNL-15217
83
Are you near a window (within 15 feet)?
Yes No
Personal Workspace Description Which of the following best describes your personal workspace?
Enclosed office, private Enclosed office, shared with other people Cubicles with partitions above standing eye level Cubicles with partitions below standing eye level Workspace in open office with no partitions Other:
Office Layout How satisfied are you with the amount of space available for individual work and storage?
How satisfied are you with the level of visual privacy?
How satisfied are you with ease of interaction with co-workers?
Overall, does the office layout enhance or interfere with your ability to get your job done?
Please describe any other issues related to the office layout that are important to you.
Available Space
You have said that you are dissatisfied with the amount of space available for individual work and storage. Which of the following contribute to your dissatisfaction? (check all that apply)
Amount of work surface area
PNNL-15217
84
Total area of work station Available filing and storage space Available space for personal items Space for meeting with other people Other:
Visual Privacy
You have said that you are dissatisfied with the level of visual privacy. Which of the following contribute to your dissatisfaction? (check all that apply)
High density--too little space separating people Partitions or walls are too low or transparent People can easily see in through exterior windows Too many people walking in my work area Other:
Ease of Interaction
You have said that you are dissatisfied with the ease of interaction with co-workers. Which of the following contribute to your dissatisfaction? (check all that apply)
My work station is not near my co-workers My work station is difficult to find or out of the way Conversations are discouraged because the noise is distracting to others There are no spaces (i.e., break rooms) to casually interact with co-
workers There are few organized opportunities to interact with co-workers Other:
Office Furnishings
How satisfied are you with the comfort of your office furnishings (chair, desk, computer, equipment, etc.)?
How satisfied are you with your ability to adjust your furniture to meet your needs?
How satisfied are you with the colors and textures of flooring, furniture and surface finishes?
PNNL-15217
85
Do your office furnishings enhance or interfere with your ability to get your job done?
Please describe any other issues related to office furnishings that are important to you.
Thermal Comfort
Which of the following do you personally adjust or control in your workspace? (check all that apply)
Window blinds or shades Operable window Thermostat Portable heater Permanent heater Room air-conditioning unit Portable fan Ceiling fan Adjustable air vent in wall or ceiling Adjustable floor air vent (diffuser) Door to interior space Door to exterior space None of the above Other:
How satisfied are you with the temperature in your workspace?
Overall, does your thermal comfort in your workspace enhance or interfere with your ability to get your job done?
Temperature
You have said that you are dissatisfied with the temperature in your workspace. Which of the following contribute to your dissatisfaction? In warm/hot weather, the temperature in my workspace is: (check all that apply)
Often too hot Often too cold

PNNL-15217
86
In cool/cold weather, the temperature in my workspace is: (check all that apply)
Often too hot Often too cold
When is this most often a problem? (check all that apply)
Morning Afternoon Evening Weekends/holidays Monday mornings No particular time Other:
How would you best describe the source of this discomfort? (check all that apply)
Humidity too high (damp) Humidity too low (dry) Air movement too high Air movement too low Incoming sun Hot/cold surrounding surfaces (floor, ceiling, walls or windows) Heat from office equipment Drafts from windows Drafts from vents My area is hotter/colder than other areas Thermostat is inaccessible Thermostat is adjusted by other people Heating/cooling system does not respond quickly enough to the thermostat Clothing policy is not flexible Other:
Please describe any other issues related to being too hot or too cold in your workspace.
Air Quality
How satisfied are you with the air quality in your workspace (i.e. stuffy/stale air, cleanliness, odors)?
Overall, does the air quality in your workspace enhance or interfere with your ability to get your job done?
PNNL-15217
87
You have said that you are dissatisfied with the air quality in your workspace. Please rate the level of each of the following problems: Air is stuffy/stale
Not a problem
Air is not clean
Not a problem
Air smells bad (odors)
Not a problem
If there is an odor problem, which of the following contribute to this problem? (check all that apply)
Tobacco smoke Photocopiers Printers Food Carpet or furniture Other people Cleaning products Other:
Please describe any other issues related to the air quality in your workspace that are important to you.
Lighting
Which of the following controls do you have over the lighting in your workspace? (check all that apply)
Light switch Light dimmer Window blinds or shades Desk (task) light None of the above Other:
How satisfied are you with the amount of light in your workspace?

PNNL-15217
88
How satisfied are you with the visual comfort of the lighting (e.g., glare, reflections, contrast)?
Overall, does the lighting quality enhance or interfere with your ability to get your job done?
You have said that you are dissatisfied with the lighting in your workspace. Which of the following contribute to your dissatisfaction? (check all that apply)
Too dark Too bright Not enough daylight Too much daylight Not enough electric lighting Too much electric lighting Electric lighting flickers Electric lighting is an undesirable color No task lighting Reflections in the computer screen Shadows on the workspace Other:
Please describe any other issues related to lighting that are important to you.
Acoustic Quality How satisfied are you with the noise level in your workspace?
How satisfied are you with the sound privacy in your workspace (ability to have conversations without your neighbors overhearing and vice versa)?
Overall, does the acoustic quality in your workspace enhance or interfere with your ability to get your job done?
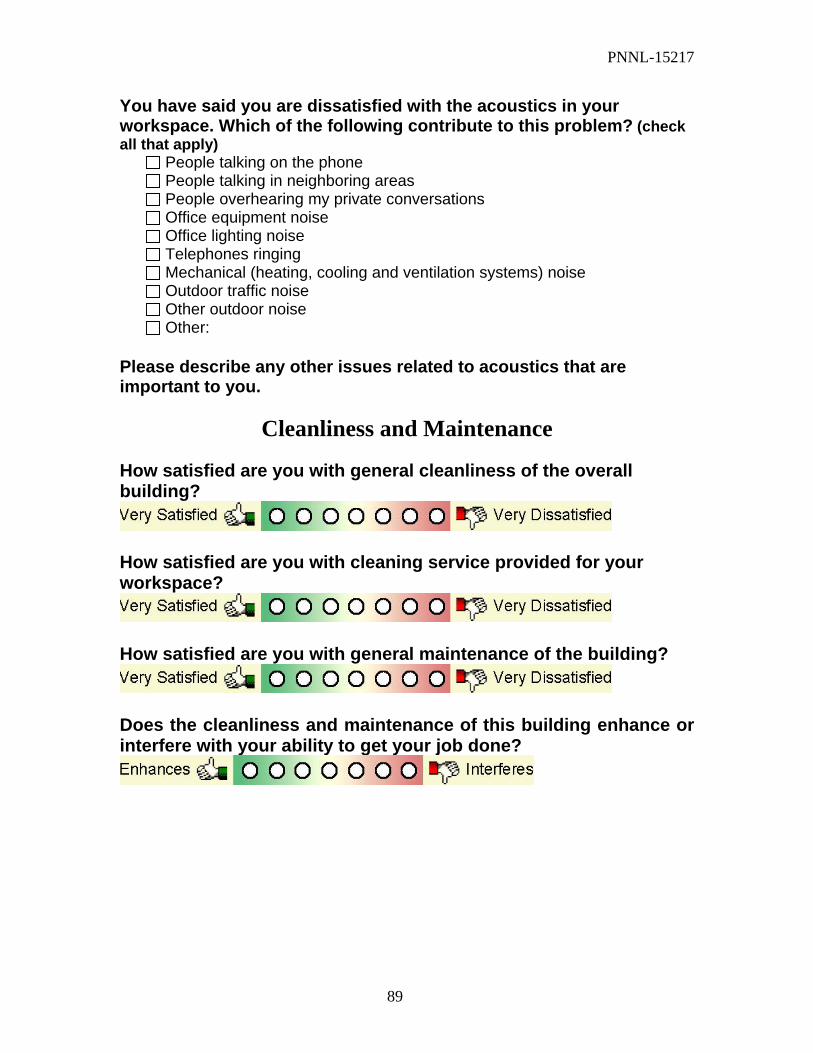
PNNL-15217
89
You have said you are dissatisfied with the acoustics in your workspace. Which of the following contribute to this problem? (check all that apply)
People talking on the phone People talking in neighboring areas People overhearing my private conversations Office equipment noise Office lighting noise Telephones ringing Mechanical (heating, cooling and ventilation systems) noise Outdoor traffic noise Other outdoor noise Other:
Please describe any other issues related to acoustics that are important to you.
Cleanliness and Maintenance How satisfied are you with general cleanliness of the overall building?
How satisfied are you with cleaning service provided for your workspace?
How satisfied are you with general maintenance of the building?
Does the cleanliness and maintenance of this building enhance or interfere with your ability to get your job done?

PNNL-15217
90
Cleaning Service You have told us that you are dissatisfied with the cleaning service provided for your workspace. How often do you have significant problems?
Always Often Sometimes Rarely Never Don't know/No opinion
Which of the following contribute to this dissatisfaction? (check all that apply)
Surface dust on work surfaces close to you Surface dust on other surfaces you might touch Surface dust on surfaces difficult to reach Spills and debris Dirty floors Trash cans are not emptied overnight Trash cans get too full during the day Trash cans are a significant source of odor Other:
Please describe any other issues related to cleaning and maintenance that are important to you.
General Comments All things considered, how satisfied are you with your personal workspace?
How satisfied are you with the building overall?
Any additional comments or recommendations about your personal workspace or building overall?
Thank you for participating in this Survey! All contents copyright © 2000-2003 The Regents of the University of California.
All rights reserved. Revised: July 11, 2003
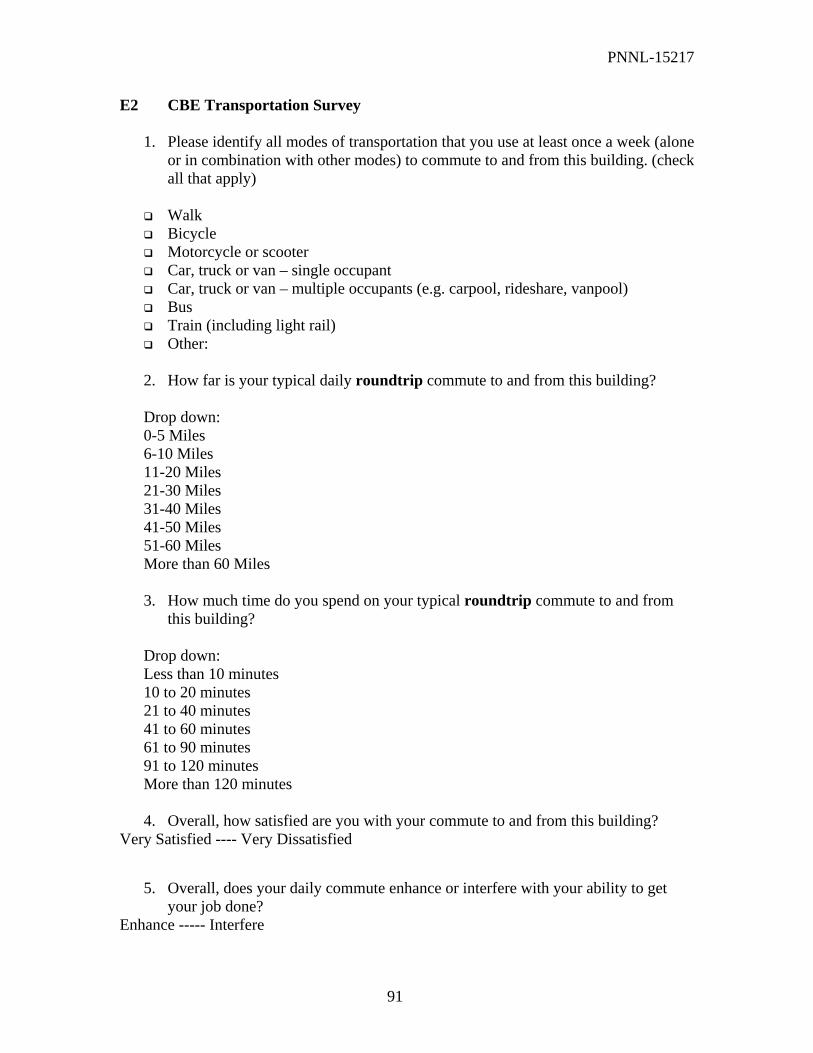
PNNL-15217
91
E2 CBE Transportation Survey
1. Please identify all modes of transportation that you use at least once a week (alone or in combination with other modes) to commute to and from this building. (check all that apply)
Walk Bicycle Motorcycle or scooter Car, truck or van – single occupant Car, truck or van – multiple occupants (e.g. carpool, rideshare, vanpool) Bus Train (including light rail) Other:
2. How far is your typical daily roundtrip commute to and from this building? Drop down: 0-5 Miles 6-10 Miles 11-20 Miles 21-30 Miles 31-40 Miles 41-50 Miles 51-60 Miles More than 60 Miles
3. How much time do you spend on your typical roundtrip commute to and from
this building? Drop down: Less than 10 minutes 10 to 20 minutes 21 to 40 minutes 41 to 60 minutes 61 to 90 minutes 91 to 120 minutes More than 120 minutes
4. Overall, how satisfied are you with your commute to and from this building?
Very Satisfied ---- Very Dissatisfied
5. Overall, does your daily commute enhance or interfere with your ability to get your job done?
Enhance ----- Interfere
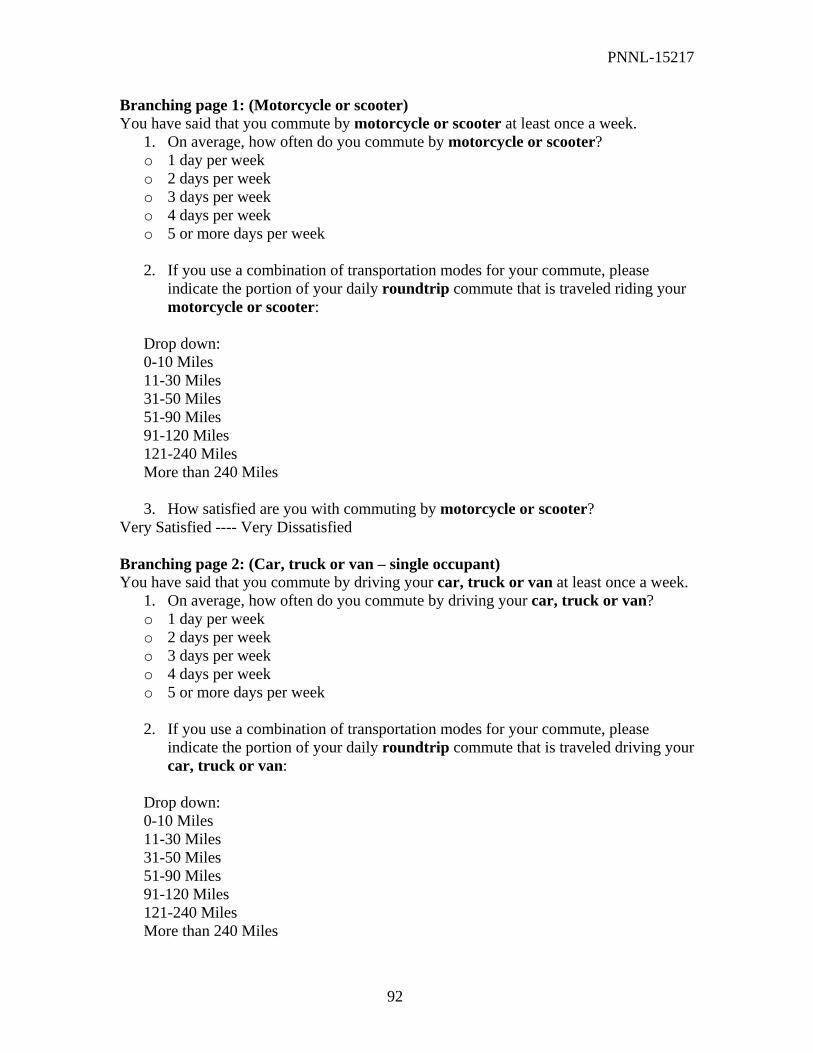
PNNL-15217
92
Branching page 1: (Motorcycle or scooter) You have said that you commute by motorcycle or scooter at least once a week.
1. On average, how often do you commute by motorcycle or scooter? o 1 day per week o 2 days per week o 3 days per week o 4 days per week o 5 or more days per week 2. If you use a combination of transportation modes for your commute, please
indicate the portion of your daily roundtrip commute that is traveled riding your motorcycle or scooter:
Drop down: 0-10 Miles 11-30 Miles 31-50 Miles 51-90 Miles 91-120 Miles 121-240 Miles More than 240 Miles 3. How satisfied are you with commuting by motorcycle or scooter?
Very Satisfied ---- Very Dissatisfied Branching page 2: (Car, truck or van – single occupant) You have said that you commute by driving your car, truck or van at least once a week.
1. On average, how often do you commute by driving your car, truck or van? o 1 day per week o 2 days per week o 3 days per week o 4 days per week o 5 or more days per week 2. If you use a combination of transportation modes for your commute, please
indicate the portion of your daily roundtrip commute that is traveled driving your car, truck or van:
Drop down: 0-10 Miles 11-30 Miles 31-50 Miles 51-90 Miles 91-120 Miles 121-240 Miles More than 240 Miles

PNNL-15217
93
3. What is the estimated fuel economy of your car, truck or van? o Less than 10 mpg o 11-20 mpg o 21-30 mpg o 31-40 mpg o 41-60 mpg o More than 60 mpg 4. How satisfied are you with your daily commute driving your car, truck or van?
Very Satisfied ---- Very Dissatisfied Branching page 3: (Car, truck or van – multiple occupants)
You have said that you commute by carpool, vanpool or rideshare at least once a week. 1. On average, how often do you carpool, vanpool or rideshare for your commute? o 1 day per week o 2 days per week o 3 days per week o 4 days per week o 5 or more days per week 2. If you use a combination of transportation modes for your commute, please
indicate the portion of your daily roundtrip commute that is traveled by carpooling, ridesharing or vanpooling:
Drop down: 0-10 Miles 11-30 Miles 31-50 Miles 51-90 Miles 91-120 Miles 121-240 Miles More than 240 Miles
3. On a typical day, what is the estimated fuel economy of the carpool, rideshare or
vanpool vehicle? o Less than 10 mpg o 11-20 mpg o 21-30 mpg o 31-40 mpg o 41-60 mpg o More than 60 mpg o Don’t know
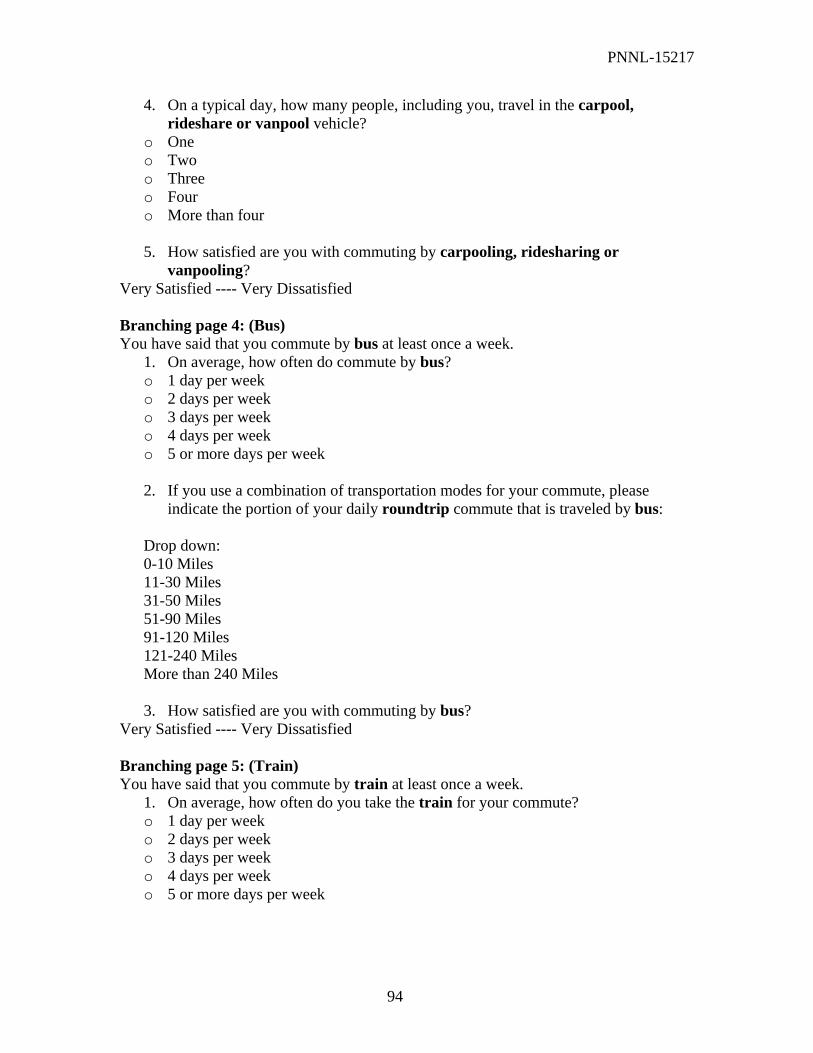
PNNL-15217
94
4. On a typical day, how many people, including you, travel in the carpool, rideshare or vanpool vehicle?
o One o Two o Three o Four o More than four 5. How satisfied are you with commuting by carpooling, ridesharing or
vanpooling? Very Satisfied ---- Very Dissatisfied Branching page 4: (Bus) You have said that you commute by bus at least once a week.
1. On average, how often do commute by bus? o 1 day per week o 2 days per week o 3 days per week o 4 days per week o 5 or more days per week 2. If you use a combination of transportation modes for your commute, please
indicate the portion of your daily roundtrip commute that is traveled by bus: Drop down: 0-10 Miles 11-30 Miles 31-50 Miles 51-90 Miles 91-120 Miles 121-240 Miles More than 240 Miles 3. How satisfied are you with commuting by bus?
Very Satisfied ---- Very Dissatisfied Branching page 5: (Train) You have said that you commute by train at least once a week.
1. On average, how often do you take the train for your commute? o 1 day per week o 2 days per week o 3 days per week o 4 days per week o 5 or more days per week

PNNL-15217
95
2. If you use a combination of transportation modes for your commute, please indicate the portion of your daily roundtrip commute that is traveled by the train:
Drop down: 0-10 Miles 11-30 Miles 31-50 Miles 51-90 Miles 91-120 Miles 121-240 Miles More than 240 Miles 3. How satisfied are you with commuting by train?
Very Satisfied ---- Very Dissatisfied Branching page 5: (Comments) Please describe any other issues related to your commute to and from this building that are important to you:
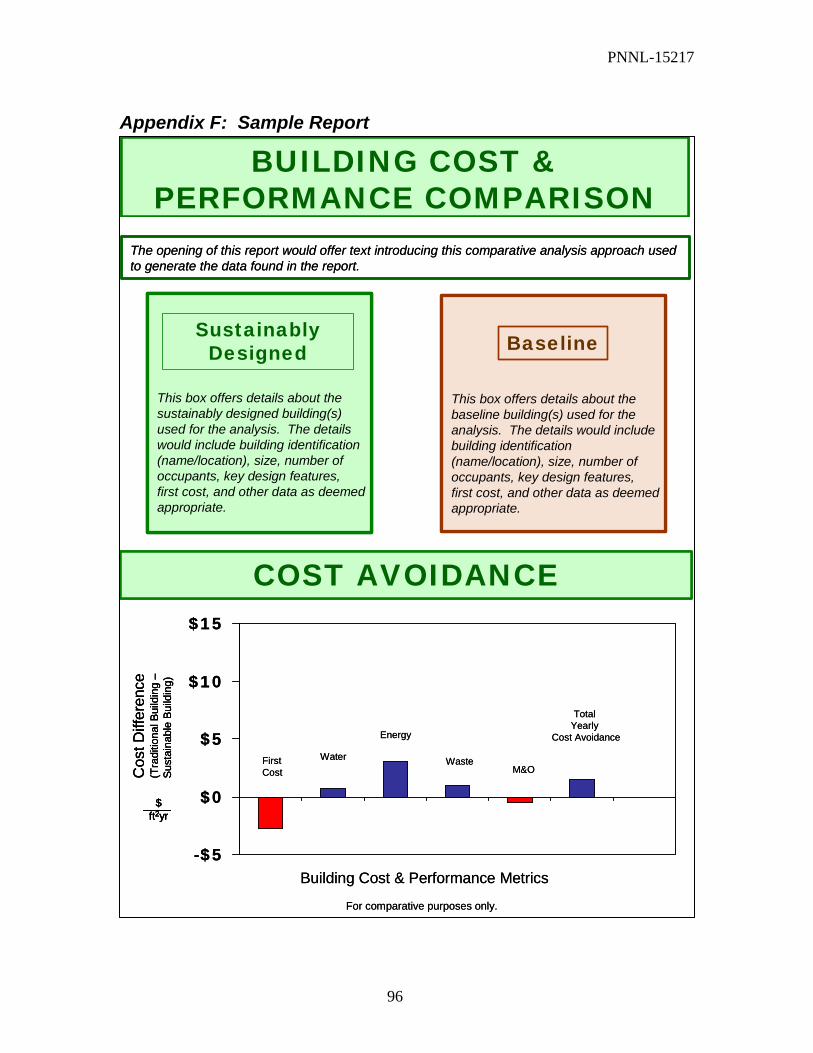
PNNL-15217
96
Appendix F: Sample Report
BUILDING COST & PERFORMANCE COMPARISON
The opening of this report would offer text introducing this comparative analysis approach used to generate the data found in the report.
For comparative purposes only.
COST AVOIDANCE
-$ 5
$ 0
$ 5
$ 1 0
$ 1 5
FirstCost
Water
Energy
M&O
Total Yearly
Cost Avoidance
Cos
t Diff
eren
ce
(Tra
ditio
nal B
uild
ing
–Su
stai
nabl
e Bu
ildin
g)
$ft2yr
Waste
Building Cost & Performance Metrics
This box offers details about the baseline building(s) used for the analysis. The details would include building identification (name/location), size, number of occupants, key design features, first cost, and other data as deemedappropriate.
This box offers details about the sustainably designed building(s)used for the analysis. The details would include building identification (name/location), size, number of occupants, key design features, first cost, and other data as deemedappropriate.
SustainablyDesigned Baseline
BUILDING COST & PERFORMANCE COMPARISON
The opening of this report would offer text introducing this comparative analysis approach used to generate the data found in the report.
For comparative purposes only.
COST AVOIDANCE
-$ 5
$ 0
$ 5
$ 1 0
$ 1 5
FirstCost
Water
Energy
M&O
Total Yearly
Cost Avoidance
Cos
t Diff
eren
ce
(Tra
ditio
nal B
uild
ing
–Su
stai
nabl
e Bu
ildin
g)
$ft2yr
Cos
t Diff
eren
ce
(Tra
ditio
nal B
uild
ing
–Su
stai
nabl
e Bu
ildin
g)
$ft2yr
$ft2yr
Waste
Building Cost & Performance Metrics
This box offers details about the baseline building(s) used for the analysis. The details would include building identification (name/location), size, number of occupants, key design features, first cost, and other data as deemedappropriate.
This box offers details about the sustainably designed building(s)used for the analysis. The details would include building identification (name/location), size, number of occupants, key design features, first cost, and other data as deemedappropriate.
SustainablyDesigned
This box offers details about the sustainably designed building(s)used for the analysis. The details would include building identification (name/location), size, number of occupants, key design features, first cost, and other data as deemedappropriate.
SustainablyDesigned Baseline
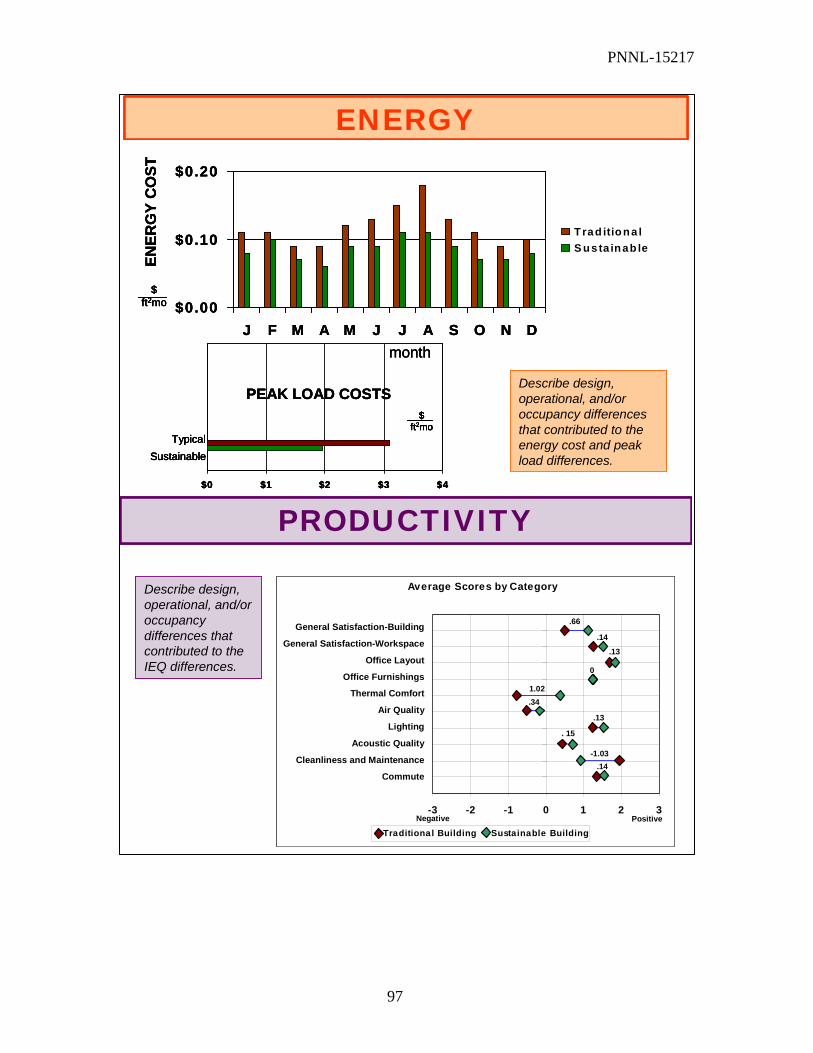
PNNL-15217
97
$0.00
$0.10
$0.20
J F M A M J J A S O N D
Trad itiona lS u s ta inab le
$ft2mo
month
ENER
GY
CO
ST
PRODUCTIVITY
Describe design, operational, and/or occupancy differences that contributed to the IEQ differences.
Describe design, operational, and/or occupancy differences that contributed to the energy cost and peak load differences.
ENERGY
PEAK LOAD COSTS
Sustainable
$0 $1 $2 $3 $4
Typical
$ft2mo
Average Scores by Category
-3 -2 -1 0 1 2 3
Traditional Building Sustainable Building
General Satisfaction-Building
General Satisfaction-Workspace
Office Layout
Office Furnishings
Thermal Comfort
Air Quality
Lighting
Acoustic Quality
Cleanliness and Maintenance
Commute
Negative Positive
.66
.14
.13
0
1.02.34
.13
. 15
-1.03.14
$0.00
$0.10
$0.20
J F M A M J J A S O N D
Trad itiona lS u s ta inab le
$ft2mo
month
ENER
GY
CO
ST
$0.00
$0.10
$0.20
J F M A M J J A S O N D
Trad itiona lS u s ta inab le
$ft2mo
$ft2mo
month
ENER
GY
CO
ST
PRODUCTIVITY
Describe design, operational, and/or occupancy differences that contributed to the IEQ differences.
Describe design, operational, and/or occupancy differences that contributed to the energy cost and peak load differences.
ENERGY
PEAK LOAD COSTS
Sustainable
$0 $1 $2 $3 $4
Typical
$ft2mo
PEAK LOAD COSTS
Sustainable
$0 $1 $2 $3 $4
Typical
$ft2mo
Sustainable
$0 $1 $2 $3 $4
Typical
$ft2mo
$ft2mo
Average Scores by Category
-3 -2 -1 0 1 2 3
Traditional Building Sustainable Building
General Satisfaction-Building
General Satisfaction-Workspace
Office Layout
Office Furnishings
Thermal Comfort
Air Quality
Lighting
Acoustic Quality
Cleanliness and Maintenance
Commute
Negative Positive
.66
.14
.13
0
1.02.34
.13
. 15
-1.03.14
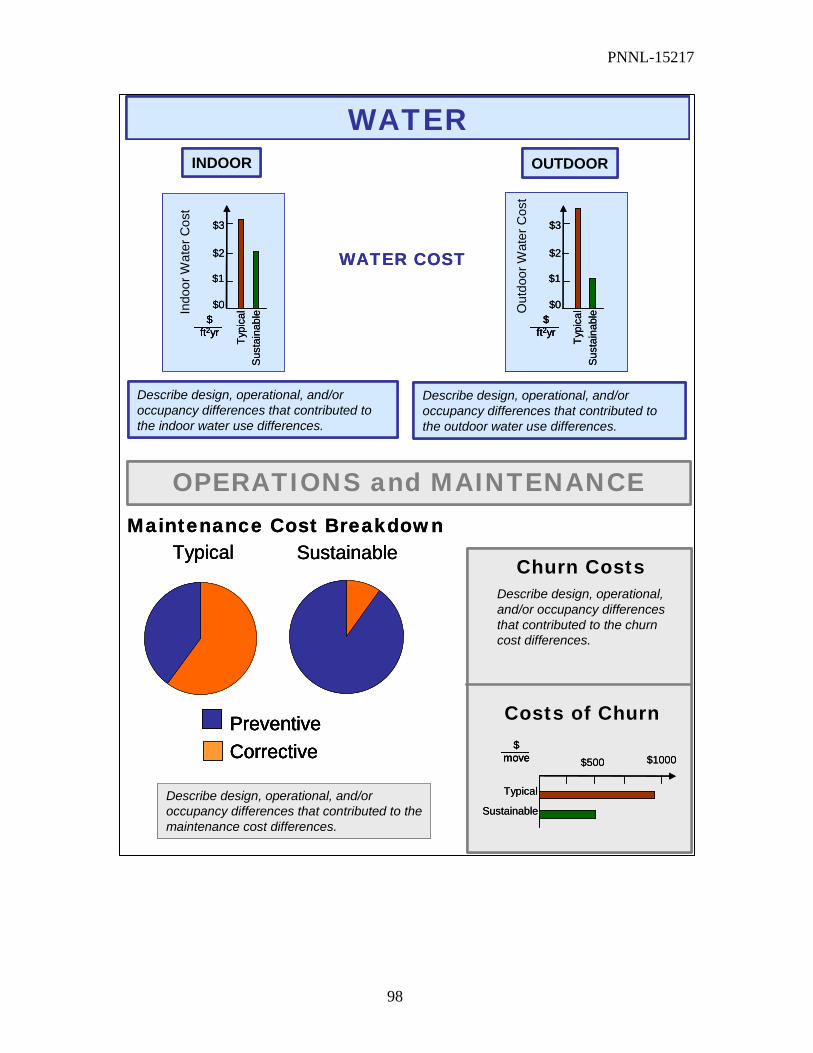
PNNL-15217
98
WATER
OPERATIONS and MAINTENANCE
WATER COST
$0
$1
$2
$3Ty
pica
lSu
stai
nabl
e$ft2yr
Indo
or W
ater
Cos
tINDOOR
$0
$1
$2
$3
Typi
cal
Sust
aina
ble
$ft2yr
Out
door
Wat
er C
ost
OUTDOOR
Describe design, operational, and/or occupancy differences that contributed to the indoor water use differences.
Describe design, operational, and/or occupancy differences that contributed to the outdoor water use differences.
Maintenance Cost Breakdown
Churn Costs
Costs of Churn
$500 $1000
Typical
Sustainable
$move
Describe design, operational, and/or occupancy differences that contributed to the churn cost differences.
Typical Sustainable
PreventiveCorrective
Describe design, operational, and/or occupancy differences that contributed to the maintenance cost differences.
WATER
OPERATIONS and MAINTENANCE
WATER COST
$0
$1
$2
$3Ty
pica
lSu
stai
nabl
e$ft2yr
Indo
or W
ater
Cos
t
$0
$1
$2
$3Ty
pica
lSu
stai
nabl
e$ft2yr
$0
$1
$2
$3Ty
pica
lSu
stai
nabl
e$ft2yr
$ft2yr
Indo
or W
ater
Cos
tINDOOR
$0
$1
$2
$3
Typi
cal
Sust
aina
ble
$ft2yr
Out
door
Wat
er C
ost
$0
$1
$2
$3
Typi
cal
Sust
aina
ble
$ft2yr
$0
$1
$2
$3
Typi
cal
Sust
aina
ble
$ft2yr
$ft2yr
Out
door
Wat
er C
ost
OUTDOOR
Describe design, operational, and/or occupancy differences that contributed to the indoor water use differences.
Describe design, operational, and/or occupancy differences that contributed to the outdoor water use differences.
Maintenance Cost Breakdown
Churn Costs
Costs of Churn
$500 $1000
Typical
Sustainable
$move $500 $1000
Typical
Sustainable
$move
$move
Describe design, operational, and/or occupancy differences that contributed to the churn cost differences.
Typical Sustainable
PreventiveCorrective
Typical Sustainable
PreventiveCorrectivePreventiveCorrective
Describe design, operational, and/or occupancy differences that contributed to the maintenance cost differences.
PNNL-15217
99
ENVIRONMENTAL BENEFITS
This section would summarize the environmental benefits found during the project – numbers and anecdotal items may be included.
SOCIAL BENEFITS
BACKGROUND INFORMATION
This section would contain additional information about the project.
Resource and ContactInformation
__________ ________________ _____
www._____ .com
This section would summarize the societal benefits found during the project – numbers and anecdotal items may be included.

PNNL-15217
100
Appendix G: References and Literature Review 1. American Society for Testing and Materials. 2003. E1836-01 Standard
Classification for Building Floor Area Measurements for Facility Management. http://www.astm.org/cgi-bin/SoftCart.exe/DATABASE.CART/REDLINE_PAGES/E1836.htm?E+mystore
2. American Society of Heating, Refrigerating and Air-Conditioning Engineers, Inc.
2002. Guideline 14-2002, Measurement of Energy and Demand Savings. 3. American Society of Heating, Refrigerating and Air-Conditioning Engineers.
2001. Standard 90.1-2001 (I-P Version) -- Energy Standard for Buildings Except Low-Rise Residential Buildings (IESNA cosponsored; ANSI approved; Continuous Maintenance Standard), I-P Edition. http://resourcecenter.ashrae.org/store/ashrae/newstore.cgi?itemid=6868&view=item&page=1&loginid=828145&priority=none&words=90.1%20-%202001&method=and&.
4. American Society of Heating, Refrigerating and Air-Conditioning Engineers.
1992. ASHRAE 55-1992, Thermal Environmental Conditions for Human Occupancy, and ASHRAE Standard 62-1999, Ventilation for Acceptable Indoor Air Quality. http://www.ashrae.org/.
5. Architectural Energy Corporation. Advanced Utility Metering DRAFT. National
Renewable Energy Laboratory, Golden, Colorado. 6. Australian Building Greenhouse Rating. April 6, 2004. http://www.abgr.com.au/. 7. Australian Department of Environment and Heritage. April 10, 2004. National
Built Environment Rating System. http://www.deh.gov.au/industry/construction/nabers/overview.html.
8. Bensch, I. 2000. Northland College's Environmental Living and Learning Center:
A Process Evaluation of a Green Building. Energy Center of Wisconsin, Madison, Wisconsin.
9. Building Design & Construction. 2003. White Paper on Sustainability: A Report
on the Green Building Movement. Oak Brook, Illinois. 10. Building Design and Construction. 2004. White Paper on Sustainability: Progress
Report 2004. Oak Brook, Illinois. 11. Building Owners and Managers Association International. 1996. Standard
Method for Measuring Floor Area in Office Buildings. http://www.boma.org/ProductsAndResearch/Standards/StandardMethodForMeasuringFloorAreainOfficeBuildings.htm.

PNNL-15217
101
12. Building Research Establishment, Ltd. Building Research Establishment Environmental Assessment Method (BREEAM). Garston, United Kingdom. www.breeam.com.
13. California Climate Action Registry. October 2003. General Reporting Protocol,
Version 2, DRAFT. Los Angeles, California. http://www.climateregistry.org/docs/PROTOCOLS/General%20Reporting%20Protocol%20DRAFT%20Oct03.pdf.
14. California Environmental Protection Agency. 2004. Sustainable Silicon Valley
Project. Silicon Valley, California. http://www.calepa.ca.gov/ems/siliconems/.
15. Carmody, J. 2003. Building Research Information Data Gathering Exchange (BRIDGE). University of Minnesota Center for Sustainable Building Research, Minneapolis, Minnesota. http://www.csbr.umn.edu/bridge.html.
16. Carmona, Andreu, and Isabel and Tadj Oreszczyn. 2004. Architects Need
Feedback on Environmental Performance. Jul-Aug 2004, Vol. 32 (4). Building Research and Information.
17. Carnegie Mellon University. Building Investment Decision Support (BIDS) - Trial
Version. http://nodem.pc.cc.cmu.edu/bidstrial/. 18. Center for the Built Environment. Occupant Indoor Environmental Quality (IEQ)
Survey. UC, Berkeley, Berkeley, California. http://www.cbe.berkeley.edu/RESEARCH/briefs-survey.htm.
19. CIBdf managed and EU funded Thematic Network. Performance Based Building
(PeBBu). http://www.pebbu.nl. 20. City of Seattle. April 21, 2004. Implement: Seattle's Sustainable Building Tool.
http://www2.ci.seattle.wa.us/Implement/.
21. Clean Air Act. Public Law 91-604 as amended in 1990. http://www.epa.gov/oar/caa/contents.html#titleiv.
22. Cole, RJ, and N Larsson. 2002. GBTool. Green Building Challenge. [Excel].
http://greenbuilding.ca/gbc2k/gbc-start.htm. 23. Curran MA, and JA Todd. 1999. Streamlined Life Cycle Assessment: A Final
Report from the SETAC North America Streamlined LCA Workgroup. Society of Environmental Toxicology and Chemistry (SETAC) and SETAC Foundation for Environmental Education.
24. DeCotis, P. 2004. Non-Energy Benefits: Why They Are Important in Evaluating
Energy Programs. Association of Energy Service Professionals International
PNNL-15217
102
(AESP) Brownbag Seminar. New York State Energy Research and Development Authority (NYSERDA), Albany, New York. [Powerpoint].
25. Deru, M and JA Todd. 2003. Facilities Performance Evaluation Learning
Consortium and Summit Report on Energy Monitoring Methods. National Renewable Energy Laboratory, Golden, Colorado.
26. Deru, M, D Barley, S Pless, N Blair, P Torcellini, and R Judkoff. 2005. Standard
Definitions of Building Geometry for Energy Evaluation Purposes. National Renewable Energy Laboratory, Golden, Colorado.
27. Deru, M. 2004. Commercial Buildings Integration Performance Metrics Project
Overview DRAFT. National Renewable Energy Laboratory, Golden, Colorado. 28. Economic Policy Research Institute. 2004. EPRI/LBNL Center for Green Building
Research, Green Buildings: Evaluating the Benefits. Lawrence Berkeley National Laboratory, Berkeley, California.
29. ENSAR Group. 2003. Sustainable Federal Facilities Task 2.1 Business Case.
Boulder, Colorado. 30. ESD Limited. 2002. Post Occupancy Review of Buildings and their Engineering
(PROBE). http://www.usablebuildings.co.uk/ 31. European Union. A European Thematic Network on Construction and City
Related Sustainability Indicators (CRISP). http://crisp.cstb.fr.
32. Facilities Issues. Flagstaff, Arizona. http://www.facilityissues.com.
33. Farm Security and Rural Investment Act of 2002. FSRIA – Section 9002. 34. Fisk, WJ. 2003. Center for Green Building Research Overview of Preliminary
Study Design. Lawrence Berkeley National Laboratory, Berkeley, California. [Powerpoint].
35. Fowler, KM. 2004. Building Cost and Performance Measurement Data.
Greenbuild 2004 International Conference and Expo Proceedings. Portland, Oregon.
36. Friend, G. April 30, 2004. "Key Sustainability KPIs - the simple, the sobering, the
significant." New Bottom Line 13.1, Natural Logic, Inc., Berkeley, California. http://www.natlogic.com/resources/nbl/v13/n01.html.
37. General Services Administration. 2004. GSA LEEDTM Cost Study.
http://www.wbdg.org/

PNNL-15217
103
38. Global Reporting Initiative. 2002. Substantial Reporting Guidelines. Boston, Massachusetts. http://www.globalreporting.org/guidelines/2002.asp.
39. Green Building Challenge (GBC). 2004. GBTool 2005 Overview.
http://www.iisbe.org/iisbe/gbc2k5/gbc2k5-start.htm. 40. Green Building Challenge. 2001. Green Building Challenge 1998 - 2002 Process
Overview. http://greenbuilding.ca/iisbe/gbc2k2/gbc2k2-start.htm. 41. Green Building Challenge. 2000. GBC Performance Indicators for Buildings. 42. Hadley, DL. May 2001. Sustainable Design Performance - Energy Savings at the
Naval Facilities Engineering Command Headquarters Building Washington Navy Yard Washington, DC Pacific Northwest National Laboratory, Richland, Washington.
43. Hakkinen, T. 2004. CD 21929 Building construction - Sustainability in building
construction - Sustainability Indicators DRAFT. International Organization for Standardization.
44. Hall, N. 2004. Non-Energy Effects: Residential & Commercial Programs.
Association of Energy Service Professionals International (AESP) Brownbag Seminar. TecMarket Works, Oregon, Wisconsin. [Powerpoint].
45. Heerwagen, Judith. 2001. Do Green Buildings Enhance the Well Being of
Workers? Environmental Design+Construction. http://www.edcmag.com/CDA/ArticleInformation/coverstory/BNPCoverStoryItem/0,4118,19794,00.html
46. Heschong, L. 2004. Daylighting: Energy Savings + Productivity. Association of
Energy Service Professionals International (AESP) Brownbag Seminar. Heschong Mahone Group, Fair Oaks, California. [Powerpoint].
47. Heschong Mahone Group. 1999. Daylighting in Schools. Heschong Mahone
Group, Fair Oaks, California. http://www.h-m-g.com/Daylighting/ (updates to this report and related studies were written in 2001 and 2003)
48. High-Performance Commercial Buildings: A Technology Roadmap. 2000.
Department of Energy. http://www.eere.energy.gov/buildings/documents/pdfs/roadmap_lowres.pdf.
49. Hitchcock, RJ. 2002. Performance Metrics Tracking. Lawrence Berkeley
National Laboratory, Berkeley, California. 50. Howard, BD. July 30, 2001. Building Real Green for Sustainable Development.
[Powerpoint]. http://www.energybuilder.com/wva-01/.
PNNL-15217
104
51. IESNA. IESNA Lighting Handbook – 9th Edition, HB-9-00. http://www.iesna.org/. 52. IPMVP, Inc. 2003. International Performance Measurement and Verification
Protocol. Washington, DC. http://www.ipmvp.org/download.php. 53. Kats, G, L Alevantis, A Berman, E Mills, and J Perlman. 2003. The Costs and
Financial Benefits of Green Buildings: A Report to California's Sustainable Building Task Force. Prepared by Capital E, Department of Health Services, and Lawrence Berkeley National Laboratory for California's Sustainable Building Task Force, Sacramento, California. http://www.cap-e.com/ewebeditpro/items/O59F3259.pdf.
54. Loftness, V, et al. 2005. Productivity Protocol Development WorkPlace 2020:
The Role of Real Estate and Facilities in Individual and Organizational Effectiveness - Mid-Year Report. Center for Building Performance and Diagnostics, Carnegie Mellon University, Pittsburgh, Pennsylvania.
55. Loftness, V and V Hartkopf. 2002. Building Investment Decision Support (BIDS).
Greenbuild 2002 International Conference and Expo Proceedings. Austin, Texas.
56. Matthiessen, LF. 2004. Examining the Cost of Green. Greenbuild 2004 International Conference and Expo Proceedings, Portland, Oregon. http://www.dladamson.com/Attachment%20Files/Research/The%20full%20report.pdf
57. Matthiessen, LF and P Morris. 2004. Costing Green: A Comprehensive Cost
Database and Budgeting Methodology. Davis Langdon, Santa Monica, California. http://www.davislangdon.com/pdf/USA/2004CostingGreen.pdf
58. McClanahan, K. December 1997. Facilities Benchmarking Instructions and
Workbook. Facilities Issues, Flagstaff, Arizona. http://www.facilityissues.com. 59. Mendler, Sandra F and William Odell. 2000. The HOK Guidebook to Sustainable
Design. ISBN: 0471379069. John Wiley & Sons, New York, New York. 60. Moran, MJ and HN Shapiro. 2000. Fundamentals of Engineering
Thermodynamics. John Wiley & Sons, Inc, New York. 61. Morton, Steven. 2002. Business Case for Green Design. Building Operating
Management, November 2002 Issue. www.facilities.com/bom/articles.asp?id=1481
62. National Ambient Air Quality Standards. Clean Air Act. Public Law 91-604 as
amended in 1990. http://www.epa.gov/ttn/naaqs/.

PNNL-15217
105
63. National Climatic Data Center. http://www.ncdc.noaa.gov/oa/ncdc.html.
64. National Renewable Energy Laboratory. 2005. Procedure for Measuring and Reporting Commercial Building Energy Performance. Golden, Colorado.
65. National Renewable Energy Laboratory. 2002. High Performance Buildings
Metrics Project Framework: July 18, 2002 DRAFT. Golden, Colorado. 66. National Renewable Energy Laboratory. 2002. Synopsis: Spring 2002
Performance Metrics Workshop for High-Performance Buildings. Park City, Utah.
67. National Renewable Energy Laboratory. 2001. Performance Metric Workshop for
High-Performance Commercial Buildings. Vail, Colorado. 68. Occupant Indoor Environmental Quality (IEQ) Survey. 2002. UC Berkeley
Center for the Built Environment. Berkeley, California. http://www.cbe.berkeley.edu/RESEARCH/survey.htm.
69. Paladino & Company, Inc. 2003. City of Seattle 2002 LEEDTM Evaluation Report.
Prepared for The City of Seattle, Seattle, Washington. 70. Paladino & Company, Inc. 2003. LEEDTM Performance Evaluation Plan: Seattle
Justice Center & City Hall. Prepared for The City of Seattle, Seattle, Washington.
71. Payne, C and B Dyer. 2004. Federal Participation in LEEDTM. Greenbuild 2004 International Conference and Expo Proceedings. Portland, Oregon.
72. Pettersen, TD. 2000. Ecoprofile for Commercial Buildings: A Simplistic
Environmental Asset Method. http://www.byggsertifisering.no/oekoprofil/Beskrivelse%20av%20metoden/%C3%98koprofilmetoden-eng.pdf.
73. Reis, Robert, K LaScola Needy, M Bilec, N Mehmet Gokham, and B Rettura.
2004. Creating a Framework to Examine Benefits of Green Building Features. Greenbuild 2004 International Conference and Expo Proceedings. Portland, Oregon.
74. Renewable Resource Data Center. Solar Radiation Resource Information.
National Renewable Energy Laboratory. Accessed 6/28/2004. http://rredc.nrel.gov/solar/.
75. Resource Conservation and Recovery Act of 1976. 42 USC 6862, Section 6002. 76. Roaf, S, T Woolley, and S Ghosh. Sustainable Building Indicators. OX2 8DY
Oxford School of Architecture, Oxford, United Kingdom, and Centre for Green

PNNL-15217
106
Building Research, Queens University, Belfast, United Kingdom. 77. Sikdar, SK. 2003. Sustainable Development and Sustainability Metrics. United
States Environmental Protection Agency National Risk Management Research Laboratory. http://www.epa.gov/ORD/NRMRL/news/rh122003.pdf.
78. Sullivan, GP, R Pugh, AP Melendez, and WD Hunt. 2004. Operations and
Maintenance Best Practices: A Guide to Achieving Operational Efficiency. U.S. Department of Energy, Federal Energy Management Program, Pacific Northwest National Laboratory, Richland, Washington.
79. Talbot, R. 2004. Personal communication: Vulcan Onboard Scales.
http://www.vulcanscales.com/vulcan.html. 80. Todd, JA, A Crawley, and B Dyer. 2003. Performance Indicators for Buildings.
Interagency Sustainability Working Group. Washington, DC [Powerpoint]. 81. Torrie Smith Associates Inc. Cities for Climate Protection Greenhouse Gas
Emissions Software. Developed for the International Council for Local Environmental Initiatives. [Demonstration Software]. http://www.torriesmith.com/licence-or-demo.cfm.
82. U.S. Department of Energy. 2003. The Business Case for Sustainable Design in
Federal Facilities. Interagency Sustainability Working Group, Federal Energy Management Program, Washington, DC. http://www.eere.energy.gov/femp/techassist/sustainability.html#business.
83. U.S. Department of Energy, Office of Energy Efficiency and Renewable Energy.
2003. Performance Metrics Research Project. http://www.eere.energy.gov/buildings/highperformance/performance_metrics/.
84. U.S. Department of Energy, Office of Energy Efficiency and Renewable Energy.
High Performance Buildings Database. http://www.eere.energy.gov/buildings/highperformance/.
85. U.S. Department of Energy, Office of Energy Efficiency and Renewable Energy.
2000. Measurement and Verification Guidelines for Federal Energy Management Projects. Prepared for the Federal Energy Management Program by Schiller Associates, Oakland, California. http://www.eere.energy.gov/femp/financing/superespcs_measguide.cfm.
86. U.S. Environmental Protection Agency. April 2004. Inventory of U.S. Greenhouse
Gas Emissions and Sinks: 1990-2002. Office of Atmospheric Programs, Washington, DC. http://yosemite.epa.gov/oar/globalwarming.nsf/content/ResourceCenterPublicationsGHGEmissions.html.

PNNL-15217
107
87. U.S. Environmental Protection Agency. July 31, 2003. Technical Description for
the Office, Bank, Financial Center, and Courthouse Model. http://www.energystar.gov/ia/business/evaluate_performance/tech_desc_office.pdf.
88. U.S. Environmental Protection Agency. June 2003. Professional Engineer's
Guide to the ENERGY STAR Label for Buildings. http://www.energystar.gov/ia/business/evaluate_performance/pm_pe_guide.pdf.
89. U.S. Environmental Protection Agency. April 2001. Benchmarking Commercial
Building Performance: "Site" and "Source" Energy DRAFT. EnergyStar. http://www.energystar.gov/ia/business/evaluate_performance/FuelMixSiteSource.pdf.
90. U.S. Environmental Protection Agency. July 1999. The Measure of Success -
Calculating Waste Reduction. http://www.epa.gov/epaoswer/non-hw/reduce/wstewise/pubs/wwupda11.pdf.
91. U.S. Environmental Protection Agency. Fuel Economy website.
http://www.fueleconomy.gov/ 92. U.S. Environmental Protection Agency. Energy Star. Washington, DC.
http://www.energystar.org. 93. U.S. Environmental Protection Agency. Weather Normalization Description.
EnergyStar. http://www.energystar.gov/index.cfm?c=business.bus_weather_normalization.
94. U.S. Green Building Council (USGBC). 2004. Green Building Rating System For
Existing Buildings: Upgrades, Operations and Maintenance (LEED-EBTM): Ballot Draft.
95. U.S. Green Building Council. June 2001. LEEDTM Reference Guide Version 2.0.
Leadership in Energy & Environmental Design. 96. Wallace, B. 2003. Project Indicators of Sustainability DRAFT. International
Confederation of Consulting Engineers Sustainable Development Task Force.
97. Warnke, David M. 2004. Making the Business Case for Sustainable Design in the Department of Defense. Air Force Institute of Technology, School of Engineering and Management. Wright-Patterson Air Force Base, Ohio.
98. World Business Council for Sustainable Development. Greenhouse Gas Protocol
Initiative. World Resources Institute. http://www.ghgprotocol.org/.

PNNL-15217
108
99. Yarmuth, L. FEMP Business Case Metrics for Data Collection. ENSAR Group, Inc.
100. Yashiro, T. 2004. CD 21931 Building construction - Sustainability in building
construction - Framework for assessment of environmental performance of buildings and constructed assets DRAFT. International Organization for Standardization.